LC-MS based metabolite fingerprinting and profiling of a ...
69
LC-MS based metabolite fingerprinting and profiling of a traditional Chinese medicine YANG XIN ® formulation By Ahmad Jarallah Sa’eed Almalki A Thesis submitted to the Graduate Faculty of Auburn University In partial fulfillment of the Requirements for the Degree of Master of Science Auburn, Alabama August 1, 2015 Keywords: Liquid-chromatography, Mass spectrometry, Traditional Chinese medicine, Fingerprinting, Profiling, Quality control Copyright 2015 by Ahmad Jarallah Almalki. Approved by Angela I. Calderón, Chair, Associate Professor of Drug Discovery and Development C. Randall Clark, Professor of Drug Discovery and Development Jack DeRuiter, Professor of Drug Discovery and Development Forrest Smith, Associate Professor of Drug Discovery and Development
Transcript of LC-MS based metabolite fingerprinting and profiling of a ...

LC-MS based metabolite fingerprinting and profiling of a traditional Chinese medicine
YANG XIN® formulation
By
Ahmad Jarallah Sa’eed Almalki
A Thesis submitted to the Graduate Faculty of
Auburn University
In partial fulfillment of the
Requirements for the Degree of
Master of Science
Auburn, Alabama
August 1, 2015
Keywords: Liquid-chromatography, Mass spectrometry, Traditional Chinese medicine,
Fingerprinting, Profiling, Quality control
Copyright 2015 by Ahmad Jarallah Almalki.
Approved by
Angela I. Calderón, Chair, Associate Professor of Drug Discovery and Development
C. Randall Clark, Professor of Drug Discovery and Development
Jack DeRuiter, Professor of Drug Discovery and Development
Forrest Smith, Associate Professor of Drug Discovery and Development

ii
Abstract
For thousands of years, Traditional Chinese Medicine (TCM) has been used to treat or
prevent various diseases, for this reason western countries have been attracted to and use TCM
together with allopathic medicine. YANG XIN® is a TCM formulation used for nervous fatigue
and consists of a 500 mg proprietary blend of concentrated extracts from 18 plants. In this study,
liquid chromatography coupled to a quadruple time of flight (q-TOF) mass spectrometer was used
for identification of constituents and quantification of chemical markers for quality control of the
YANG XIN® formulation.
Chapter One is an overview of TCM in general and YANG XIN® formulation in particular
and its composition and usage. A brief review on the definition of chronic fatigue syndrome (CFS)
and its symptoms are also included.
Chapter Two talks about metabolite fingerprinting and profiling of YANG XIN®
formulation by using LC-MS and NMR. It also describes the process from sample extraction to
sample preparation and analysis, in addition to the identification of the analytical markers and the
strategy used for selection of analytical markers in plant ingredients.
Chapter Three describes the quantification process of YANG XIN® markers starting with
sample preparation and ending with method validation.

iii
Acknowledgements
First and foremost I would like to thank Allah to give me the power, patience, and
determination to accomplish this work, without his guidance in my prayers I would not be able to
stay in the right track all the time.
I dedicate this thesis to my mother, Nuhair Abdulrahman Surrati, my father, Jarallah Sa’eed
Almalki, my brother, Malik Jarallah Almalki for their continuous support and their endless love
and care; without them I could not achieve what I achieve today.
I would like also to thank my research advisor Dr. Angela Calderón, who supported me in
every step through my research career, prepared me to be a good scientist in the future and armed
me with the knowledge and experience to discover the mysteries of science.
My appreciation is extended to my committee members Dr. Randall Clark, Dr. Jack
DeRuiter and Dr. Forrest Smith for their valuable lessons and always welcoming my questions at
any time.
Also, I would like to extend my gratitude to my colleagues Ahmed Zaher, Dr. Johayra
Simithy Williams and Ben Nie, for their patience in teaching me experimental research techniques
during my stay at Auburn University. Also thanks to my friend Mansour Alturki for his wonderful
friendship and letting me to mentor him.
Finally, I would like to thank King Abdulaziz University for sponsoring my scholarship
and I would like to thank Nature’s Sunshine for funding this project.
iv
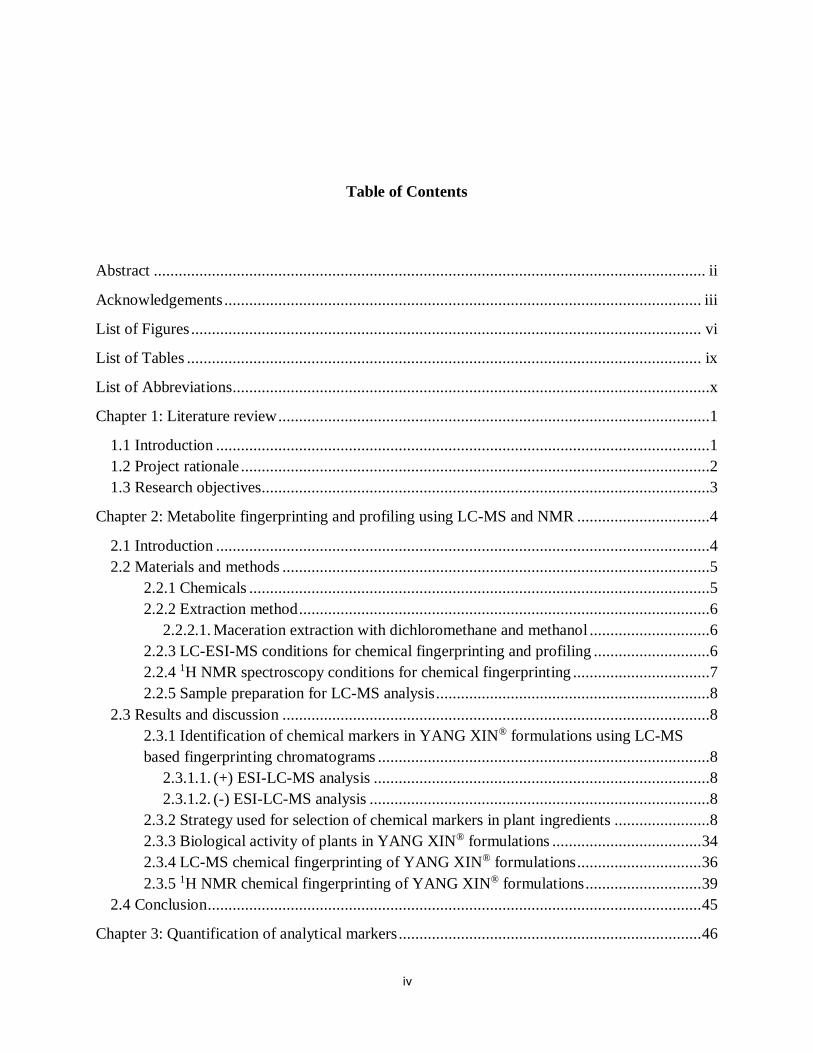
Table of Contents
Abstract ..................................................................................................................................... ii
Acknowledgements ................................................................................................................... iii
List of Figures ........................................................................................................................... vi
List of Tables ............................................................................................................................ ix
List of Abbreviations...................................................................................................................x
Chapter 1: Literature review ........................................................................................................1
1.1 Introduction .......................................................................................................................1
1.2 Project rationale .................................................................................................................2
1.3 Research objectives............................................................................................................3
Chapter 2: Metabolite fingerprinting and profiling using LC-MS and NMR ................................4
2.1 Introduction .......................................................................................................................4
2.2 Materials and methods .......................................................................................................5
2.2.1 Chemicals ...............................................................................................................5
2.2.2 Extraction method ...................................................................................................6
2.2.2.1. Maceration extraction with dichloromethane and methanol .............................6
2.2.3 LC-ESI-MS conditions for chemical fingerprinting and profiling ............................6
2.2.4 1H NMR spectroscopy conditions for chemical fingerprinting .................................7
2.2.5 Sample preparation for LC-MS analysis ..................................................................8
2.3 Results and discussion .......................................................................................................8
2.3.1 Identification of chemical markers in YANG XIN® formulations using LC-MS
based fingerprinting chromatograms ................................................................................8
2.3.1.1. (+) ESI-LC-MS analysis .................................................................................8
2.3.1.2. (-) ESI-LC-MS analysis ..................................................................................8
2.3.2 Strategy used for selection of chemical markers in plant ingredients .......................8
2.3.3 Biological activity of plants in YANG XIN® formulations .................................... 34
2.3.4 LC-MS chemical fingerprinting of YANG XIN® formulations .............................. 36
2.3.5 1H NMR chemical fingerprinting of YANG XIN® formulations ............................ 39
2.4 Conclusion ....................................................................................................................... 45
Chapter 3: Quantification of analytical markers ......................................................................... 46

v
3.1 Introduction ..................................................................................................................... 46
3.2 Materials and methods ..................................................................................................... 47
3.2.1 Chemicals ............................................................................................................. 47
3.2.2 Preparation of standard solutions........................................................................... 47
3.2.3 Calibration curves ................................................................................................. 47
3.2.4 Linearity and detection limits ................................................................................ 48
3.2.5 Recovery............................................................................................................... 48
3.3 Results and discussion ..................................................................................................... 49
3.3.1 Quantitation of chemical markers in YANG XIN® formulations ........................... 49
3.3.2 Recovery............................................................................................................... 50
3.4 Conclusion ....................................................................................................................... 54
References ................................................................................................................................ 55

vi
List of Figures
Figure 1. Chemical structure of the analytical markers .............................................................. 12
Figure 2. Total ion chromatogram of Nelumbo nucifera (Lotus seed) ........................................ 13
Figure 3. Extracted ion chromatogram of armepavine from Nelumbo nucifera (Lotus seed).
Methanol extract; ESI; positive ionization mode. ...................................................................... 13
Figure 4. Total ion chromatogram of Rehmannia glutinosa (Rehmannia root tuber) .................. 14
Figure 5. Extracted ion chromatogram of forsythoside A from Rehmannia glutinosa (Rehmannia
root tuber). Methanol extract; ESI; negative ionization mode. ................................................... 14
Figure 6. Total ion chromatogram of Acorus gramineus (Acorus rhizome) ................................ 15
Figure 7. Extracted ion chromatogram of α-asarone from Acorus gramineus (Acorus rhizome).
Dichloromethane extract; ESI; positive ionization mode. .......................................................... 15
Figure 8. Total ion chromatogram of Astragalus membranaceus (Astragalus root) .................... 16
Figure 9. Extracted ion chromatogram of formononetin from Astragalus membranaceus
(Astragalus root). Methanol extract; ESI; negative ionization mode........................................... 16
Figure 10. Total ion chromatogram of Panax ginseng (Ginseng root) ........................................ 17
Figure 11. Extracted ion chromatogram of ginsenoside Rf from Panax ginseng (Ginseng root).
Methanol extract; ESI; positive ionization mode. ...................................................................... 17
Figure 12. Total ion chromatogram of Zizyphus spinosa (Jujuba seed) ...................................... 18
Figure 13. Extracted ion chromatogram of swertisin from Zizyphus spinosa (Jujuba seed).
Methanol extract; ESI; negative ionization mode. ...................................................................... 18
Figure 14. Total ion chromatogram of of Polygonatum sibiricum (Polygonatum rhizome) ........ 19
Figure 15. Extracted ion chromatogram of polygonatine A from Polygonatum sibiricum
(Polygonatum rhizome). Dichloromethane extract; ESI; positive ionization mode. .................... 19
Figure 16. Total ion chromatogram of Schisandra chinensis (Schizandra fruit) ......................... 20

vii
Figure 17. Extracted ion chromatogram of schisandrol A from Schisandra chinensis (Schizandra
fruit). Dichloromethane extract; ESI; positive ionization mode. ................................................. 20
Figure 18. Total ion chromatogram of Dioscorea batatas (Dioscorea rhizome) ......................... 21
Figure 19. Extracted ion chromatogram of batatisin III from Dioscorea batatas (Dioscorea
rhizome). Dichloromethane extract; ESI; negative ionization mode. .......................................... 21
Figure 20. Total ion chromatogram of Ophiopogon japonicas (Ophiopogon root tuber) ............ 22
Figure 21. Extracted ion chromatogram of ophiopogonanone A from Ophiopogon japonicas
(Ophiopogon root tuber). Dichloromethane extract; ESI; negative ionization mode. .................. 22
Figure 22. Total ion chromatogram of Biota orientalis (Biota seed) .......................................... 23
Figure 23 Extracted ion chromatogram of pinusolide from Biota orientalis (Biota seed). Methanol
extract; ESI; positive ionization mode. ...................................................................................... 23
Figure 24. Total ion chromatogram of Poria cocos (Hoelen sclerotium) .................................... 24
Figure 25. Extracted ion chromatogram of poricoic acid A from Poria cocos (Hoelen sclerotium).
Dichloromethane extract; ESI; negative ionization mode. .......................................................... 24
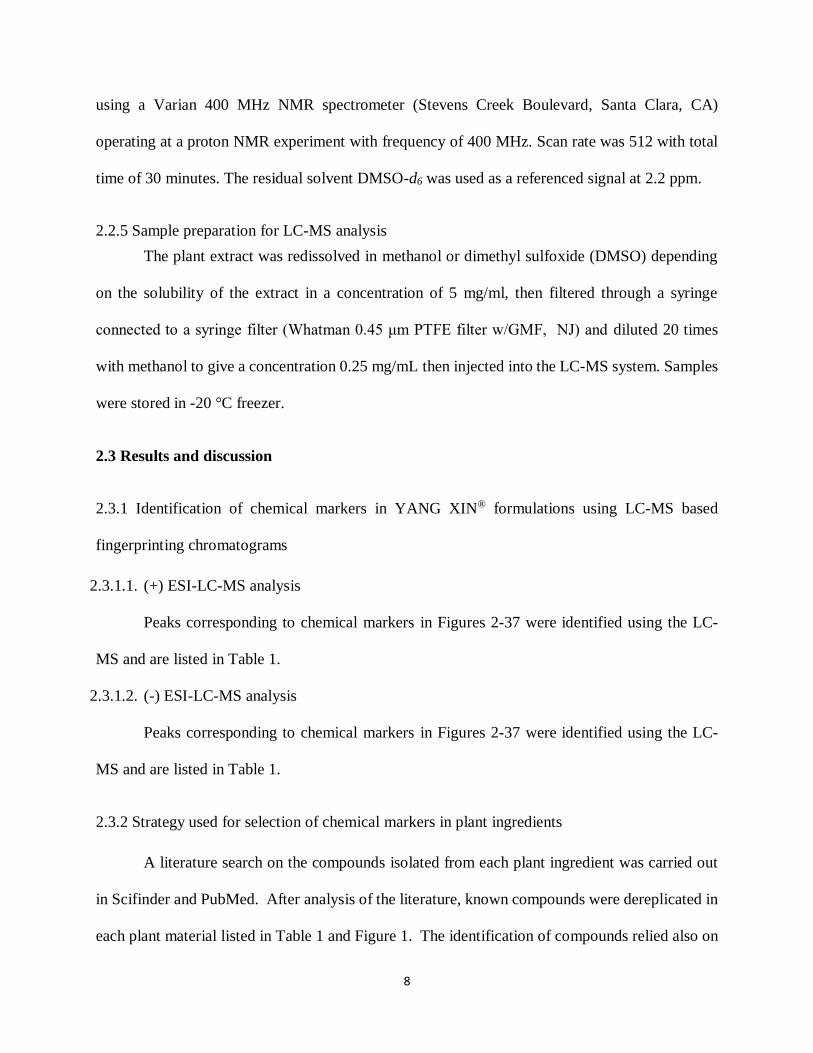
Figure 26. Total ion chromatogram of Polygala tenuifolia (Polygala root) ................................ 25
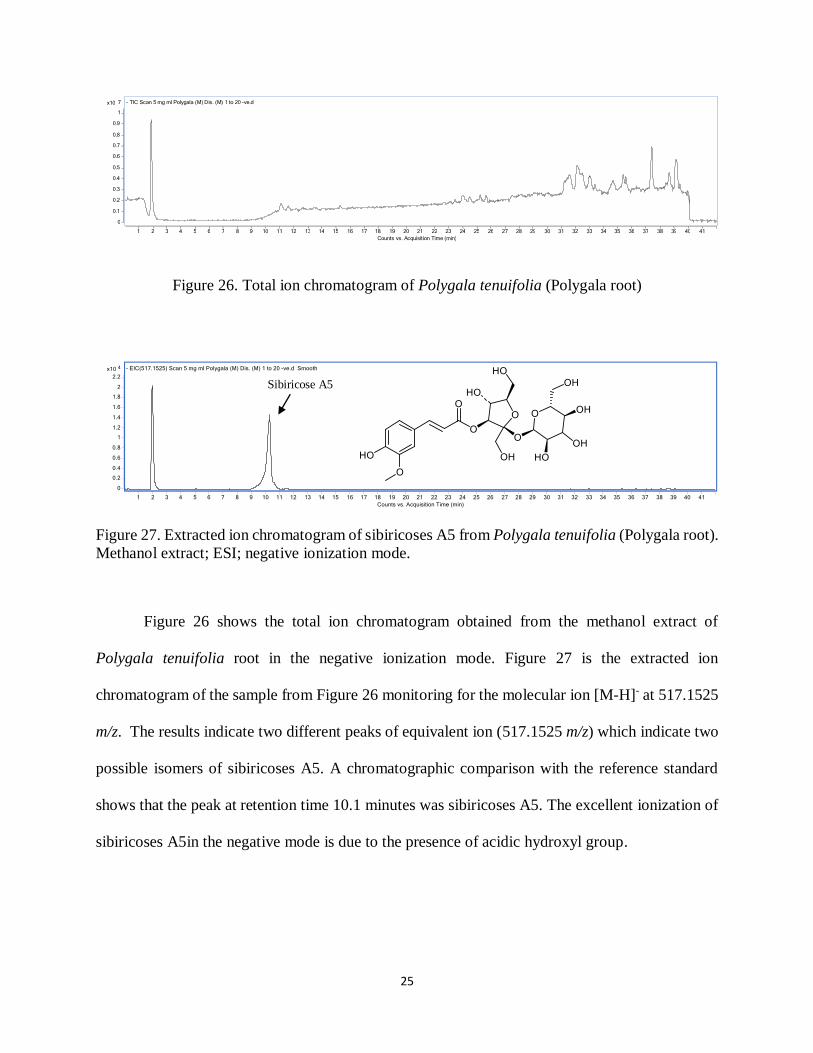
Figure 27. Extracted ion chromatogram of sibiricoses A5 from Polygala tenuifolia (Polygala root).
Methanol extract; ESI; negative ionization mode. ...................................................................... 25
Figure 28. Total ion chromatogram of Cuscuta chinensis (Cuscuta seed) ................................... 26
Figure 29. Extracted ion chromatogram of 4,5 dicaffeoylquinic acid from Cuscuta chinensis
(Cuscuta seed). Methanol extract; ESI; negative ionization mode. ............................................. 26
Figure 30. Total ion chromatogram of Angelica sinensis (Tangkuei root) .................................. 27
Figure 31. Extracted ion chromatogram of Z-butylidenephthalide from Angelica sinensis
(Tangkuei root). Dichloromethane extract; ESI; positive ionization mode. ................................ 27
Figure 32. Total ion chromatogram of Cistanche salsa (Cistanche stem) ................................... 28
Figure 33. Extracted ion chromatogram of cistanoside D from Cistanche salsa (Cistanche stem).
Dichloromethane extract; ESI; negative ionization mode. .......................................................... 28
Figure 34. Total ion chromatogram of Lycium barbarum (Lycium fruit) ................................... 29
Figure 35. Extracted ion chromatogram of neoxanthin from Lycium barbarum (Lycium fruit).
Dichloromethane extract; ESI; positive ionization mode. .......................................................... 29

viii
Figure 36. Total ion chromatogram of Amber (Succinum) ......................................................... 30
Figure 37. Extracted ion chromatogram of β-amyrin from Amber (Succinum). Dichloromethane
extract; ESI; positive ionization mode. ...................................................................................... 30
Figure 38. Identification of schisandrol A in the plant extract .................................................... 31
Figure 39. Identification of the schisandrol A in the plant extract YANG XIN® formulations and
reference standard ..................................................................................................................... 32
Figure 40. Total ion chromatogram of methanol extract of the three different formulations in
positive mode ............................................................................................................................ 36
Figure 41. Total ion chromatogram of dichloromethane extract of the three different formulations
in positive mode ........................................................................................................................ 37
Figure 42. Total ion chromatogram of methanol extract of the three different formulations in
negative mode ........................................................................................................................... 37
Figure 43. Total ion chromatogram of dichloromethane extract of the three different formulations
in negative mode ....................................................................................................................... 38
Figure 44. Total ion chromatogram of dichloromethane extract of the three different formulations
in positive mode ........................................................................................................................ 38
Figure 45. 1H NMR fingerprint of methanol concentrated extract 2014-005_1A ........................ 40
Figure 46. 1H NMR fingerprint of methanol concentrated extract 2014-005_1B ........................ 41
Figure 47. 1H NMR fingerprint of methanol extract of YANG XIN® capsules ........................... 42
Figure 48. 1H NMR fingerprint of dichloromethane concentrated extract 2014-005_1B ............ 43
Figure 49. 1H NMR fingerprint of dichloromethane extract of YANG XIN® capsules ............... 44
ix
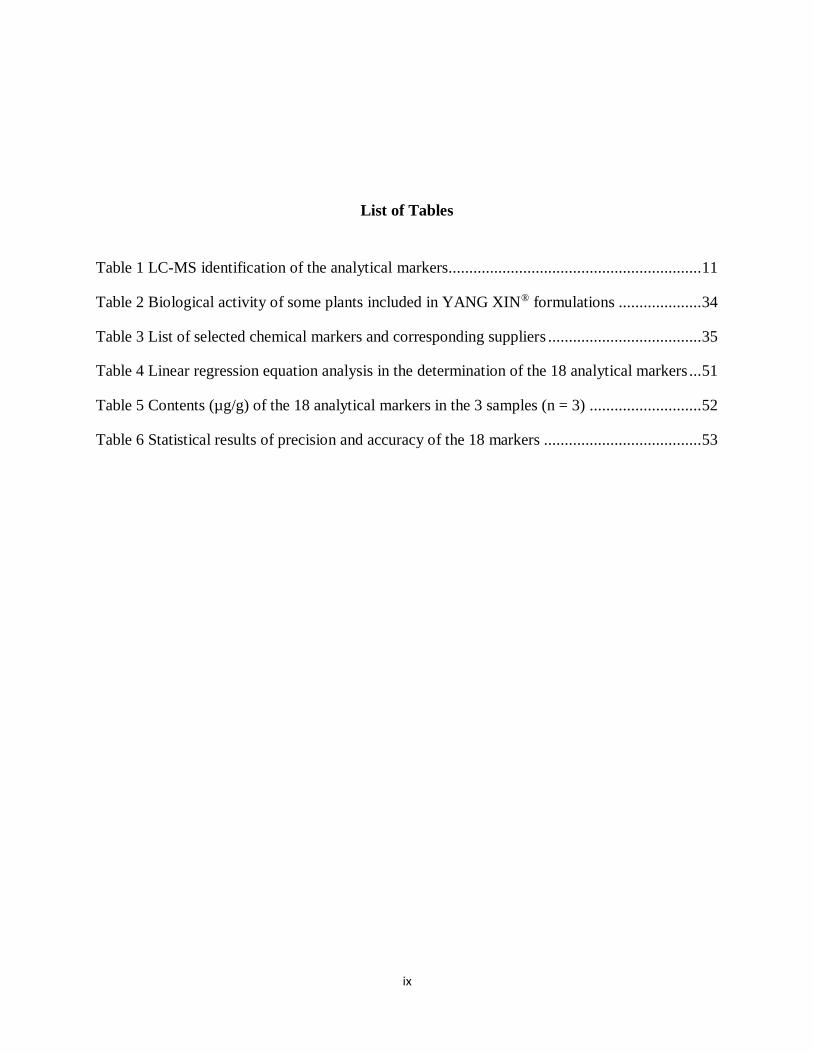
List of Tables
Table 1 LC-MS identification of the analytical markers ............................................................. 11
Table 2 Biological activity of some plants included in YANG XIN® formulations .................... 34
Table 3 List of selected chemical markers and corresponding suppliers ..................................... 35
Table 4 Linear regression equation analysis in the determination of the 18 analytical markers ... 51
Table 5 Contents (µg/g) of the 18 analytical markers in the 3 samples (n = 3) ........................... 52
Table 6 Statistical results of precision and accuracy of the 18 markers ...................................... 53

x
List of Abbreviations
® Registered trademark
°C Degree centigrade
µL Microliter
µM Micromolar
1H NMR Proton nuclear magnetic resonance
CE Capillary electrophoresis
CFS Chronic fatigue syndrome
DBE Double bond equivalent
DMSO Dimethyl sulfoxide
EIC Extracted ion chromatogram
EMA European Medicines Agency
ESI Electrospray ionization
FDA Food and Drug Administration
g Gram
GC Gas chromatography
HPLC High performance liquid chromatography
LC-MS Liquid chromatography-mass spectrometry
mL Milliliter
mm Millimeter

xi
MS Mass spectrometry
NMR Nuclear magnetic resonance
Q-TOF Quadruple time-of-flight
TCM Traditional Chinese Medicine
TIC Total ion chromatogram
TLC Thin layer chromatography
WHO World Health Organization

1
Chapter 1: Literature review
1.1 Introduction
For thousands of years, Traditional Chinese Medicine (TCM) has been used to treat or
prevent various diseases; for this reason western countries have been attracted to and use TCM
together with allopathic medicine [1]. However, the quality of TCM products are usually
influenced by their different plant species, and their corresponding chemical composition, harvest
season, storage, and geographic origins [1].
TCM formulations are usually made of multiple herbs; consequently, in order to
standardize each formulations to help manufacturers to have consistent products, a so-called
marker compound is selected for each plant included in the formulation. There are two types of
marker compounds, the first is an active constituent marker, which is a compound or group of
compounds that contributes to therapeutic action, and the second is an analytical marker, which is
a compound or a group of compounds that does not contribute to the therapeutic action but serve
only for analytical purposes which was used in this study. If we used the marker for the purpose
of quality control study only, then a statement which include the content of the marker should not
be included on the product label and this information should be available on request [2].
Analysis of such complicated mixtures like TCM formulations bears substantial challenges
[3]. Therefore, identification of chemical constituents and quantification of selected chemical
markers for quality control of TCM products are important to standardize herbal medicine to
ensure efficacy and safety [4].
Chemical fingerprinting is one of the techniques used to ensure quality control of herbal
preparations and to distinguish the herbal preparations from other related species [5].

2
Chronic fatigue syndrome (CFS) is a complex disease defined as: clinically unexplained,
persistent or relapsing fatigue of at least 6 months duration and concurrent occurrence of at least
4 accompanying symptoms such as significant impairment of memory and muscle pain [6]. The
symptoms of chronic fatigue syndrome can be classified into two groups: somatic and
psychological symptoms [6]. Nervous fatigue is one of the psychological symptoms of CFS
including sleep disorders with periodic movement disorder, excessive daytime sleepiness, apnea
and narcolepsy, impaired short-term memory, headaches, tinnitus, anxiety, and depression.
Currently a definitive treatment to cure nervous fatigue is not available. Since medical treatment
of CFS is used to relieve symptoms [6], it is not surprising that utilization of TCM has been
common in CFS. Eleven TCM formulations have been reported for the treatment of CFS [6]. For
none of them except Yi-Gan San has, a quality control study been done [7,8]. YANG XIN®
formulation is also used to treat nervous fatigue and it is the object of this study. This formulation
consists of 500 mg of a proprietary blend of concentrated extract of 18 plants.
1.2 Project rationale
To the best of our knowledge, there is no report on the development of methods for the
quality control of YANG XIN® formulation. Consequently, the use of liquid chromatography -
mass spectrometry (LC-MS) is a well-accepted analytical technique for the identification of a
potential analytical marker and to elucidate the chemical structure in complex matrices such as
TCM formulations [3]. In this study, liquid chromatography coupled to quadruple time of flight
(q-TOF) mass spectrometry was used for identification of chemical constituents, selection and
quantification of analytical markers for quality control of YANG XIN® formulation.

3
1.3 Research objectives
1. Development of metabolite fingerprinting and profiling method of Traditional Chinese
Medicine based formulations from two vendors to assess their quality using LC-MS and NMR.
2. Validation of the LC-MS quantitative method for analytical markers of YANG XIN®
formulation from two vendors.

4
Chapter 2: Metabolite fingerprinting and profiling using LC-MS and NMR
2.1 Introduction
Chromatographic fingerprinting and chemical profiling of TCM products have proved to
be a favorable approach to ensure quality control of herbal preparations and to distinguish the
herbal preparations from other closely related species [9,10] by providing an overall picture of all
the components of TCM formulations [5].
So far, chromatographic fingerprints have been globally accepted as efficient tools for
quality control of TCM products [11] and authentication and identification of herbal products [12].
Therefore, many agencies such as the World Health Organization (WHO), the Food and Drug
Administration (FDA), and the European Medicines Agency (EMA) recommend the use of
chromatographic fingerprinting to verify herbal stability and consistency [13]. In 1991, the WHO
introduced and accepted the chromatographic fingerprinting for herbal medicine quality
assessment [14]. Through the past years, many methods have been established for
chromatographic fingerprinting including thin layer chromatography (TLC), capillary
electrophoresis (CE), gas chromatography (GC), high performance liquid chromatography
(HPLC), and nuclear magnetic resonance (NMR) [14,15]. Among them, the LC method is
considered as the best option [13], because in the United States and Europe the herbal medicine
monograph reports are primarily based on HPLC fingerprints [9]. Thus, liquid chromatography –
mass spectrometry (LC-MS) has grown into the best technique for analyzing TCM products [15].
However, there are certain limitations with the use of the LC-MS technique for
fingerprinting, like chromatographic selectivity which can be altered by, e.g. dwell volume,

5
gradient flow, temperature, and the age and the brand of the column. Another limitation is signal
intensity which can be biased by instrument parameters or the detector’s range of linearity.
Therefore, such limitations can be overcome with the use of a different complementary technique
like NMR fingerprints in which the 1H NMR spectroscopy is used to generate a chemical
fingerprint for herbal samples and their finished products. The main advantage of using NMR
fingerprinting is its great reproducibility but its limitations are low sensitivity [16], expensive
price, need for special environment, and training.
2.2 Materials and methods
2.2.1 Chemicals
LC-MS grade water and methanol, and HPLC grade dichloromethane were purchased from
Thermo Fisher (Fair Lawn, NJ, USA). Formic acid was bought from Sigma-Aldrich (St. Louis,
MO, USA). Seventeen standard compounds were purchased from the following suppliers:
ophiopogonanone A (A Chemtek, Inc., Worcester, MA, USA), cistanoside D (AApin Chemicals
Limited, Oxon, OX14 4RU, UK), sibiricoses A5 and forsythoside A (Analyticon Discovery,
Potsdam, Germany), neoxanthine (BOC Sciences, Shirley, NY, USA), poricoic acid A, batatasin
III, and pinusolide (ChemFaces, Wuhan, Hubei, PRC), α-asarone, formononetin, ginsenoside Rf,
and swertisin (Chromadex, Irvine, CA, USA), armepavine (Ryan Scientific Inc, Mount Pleasant,
SC, USA), racemic mixture of 3-butylidenephthalide, schizandrin, and β-amyrin (Chromadex,
Irvine, CA, USA), and 4,5-dicaffeoylquinic acid (AvaChem Scientific, San Antonio, TX, U.S.A).
Three samples of YANG XIN® capsules (Nourish the fire; Stock No. 1017-1), concentrated extract
2014-005_1A, and concentrated extract 2014-005_1B were supplied by Nature's Sunshine
Products, Inc. and analyzed in this study.

6
2.2.2 Extraction method
Eighteen plants supplied by Nature's Sunshine Products, Inc., in addition to YANG XIN®
capsules, concentrated extracts 2014-005_1A, and 2014-005_1B were extracted according to the
following extraction method:
2.2.2.1. Maceration extraction with dichloromethane and methanol
Thirty grams (30 g) of each plant material, concentrated extracts 2014-005_1A and 2014-
005_1B, and YANG XIN® capsules were extracted with 300 mL of dichloromethane. The mixture
was stirred using a mechanical shaker for 24 hours. The macerate was allowed to settle for 30
minutes. The extract was then filtered through two filter papers Whatman No. 4 (GE Healthcare
Bio-Sciences, Pittsburgh, PA, USA) and concentrated under vacuum in a rotary evaporator (Büchi,
Flawil, Switzerland) at 40 °C. The concentrated extract was transferred into a small vial and placed
under a nitrogen evaporator (Organomation Associate Inc., Berlin, MA, USA) for complete
dryness. After filtration, the macerate was further extracted with methanol, filtered and dried using
the same procedure described above.
2.2.3 LC-ESI-MS conditions for chemical fingerprinting and profiling
Ten (10) µl of the plant extract or two (2) μl of reference standard solutions were separated
on reversed phase column Poroshell 120 EC-C18, 2.7 µm x 2.1 mm x 150 mm (Agilent
Technologies, Inc, Little Falls, DE, USA). Two solvents (A and B) were used in the analysis.
Solvent (A) was composed of water with 0.1% formic acid and solvent (B) was composed of
methanol with gradient elution as follows: 0-6 min, 0 to 10% B; 6-8 min, 10 to 60% B; 8-40 min,
60 to 100% B; 40-42, 100% to 0 % and followed by 3 minutes post run with 0% solvent B. The
total run time of the analysis was 45 minutes at flow rate of 0.2 ml/min and column temperature
of 25 °C. A rapid resolution LC 1200 series coupled to 6520 accurate mass Q-TOF spectrometer

7
(Agilent Technologies, Little Falls, DE, USA) equipped with dual electrospray ionization (ESI)
source was used for the analysis. Data acquisitions were collected under both positive (+) and
negative (-) mode of ionization using full spectrum scan analysis for qualitative and quantitative
analyses of the samples. For the mass spectrometer conditions, the nebulizing and drying gases
were nitrogen supplied at a flow rate of 25 Psig and 10 ml/min, respectively. Drying gas
temperature was 350 °C. Ionization source was dual ESI (electrospray ionization) with a capillary
voltage of 3200 V. Fragmentor voltage was 175 V. Identification of compounds was performed
using Agilent Mass Hunter Qualitative Analysis software, version B.06.00.
For the instrument’s parameters when equipped with atmospheric pressure chemical
ionization (APCI) ion source, the method of detection of β-amyrin consisted of isocratic 100%
methanol. Total run time of the analysis was 20 minutes at a flow rate of 0.2 ml/min and column
temperature of 25 °C. A rapid resolution LC 1200 series coupled to a 6520 accurate mass Q-TOF
spectrometer (Agilent Technologies, Little Falls, DE, USA) equipped with APCI source was used
for the analysis. Data acquisitions were collected under positive mode of ionization using full
spectrum scan analysis for qualitative and quantitative analyses of the samples. For the mass
spectrometer conditions, the nebulizing and drying gases were nitrogen supplied at a flow rate of
60 Psig and 10 ml/min, respectively. The drying gas temperature was 350 °C. Vaporizer
temperature 450 °C with capillary voltage of 3500 V. The fragmentor voltage was 175 V.
Identification of compounds was performed using Agilent Mass Hunter Qualitative Analysis
software, version B.06.00.
2.2.4 1H NMR spectroscopy conditions for chemical fingerprinting
One hundred milligrams of the dried extract was dissolved in 1 mL of DMSO-d6 (Sigma
Aldrich, St. Louis, MO, USA) and filtered through glass wool fiber. NMR analysis was performed
8
using a Varian 400 MHz NMR spectrometer (Stevens Creek Boulevard, Santa Clara, CA)
operating at a proton NMR experiment with frequency of 400 MHz. Scan rate was 512 with total
time of 30 minutes. The residual solvent DMSO-d6 was used as a referenced signal at 2.2 ppm.
2.2.5 Sample preparation for LC-MS analysis
The plant extract was redissolved in methanol or dimethyl sulfoxide (DMSO) depending
on the solubility of the extract in a concentration of 5 mg/ml, then filtered through a syringe
connected to a syringe filter (Whatman 0.45 μm PTFE filter w/GMF, NJ) and diluted 20 times
with methanol to give a concentration 0.25 mg/mL then injected into the LC-MS system. Samples
were stored in -20 °C freezer.
2.3 Results and discussion
2.3.1 Identification of chemical markers in YANG XIN® formulations using LC-MS based
fingerprinting chromatograms
2.3.1.1. (+) ESI-LC-MS analysis
Peaks corresponding to chemical markers in Figures 2-37 were identified using the LC-
MS and are listed in Table 1.
2.3.1.2. (-) ESI-LC-MS analysis
Peaks corresponding to chemical markers in Figures 2-37 were identified using the LC-
MS and are listed in Table 1.
2.3.2 Strategy used for selection of chemical markers in plant ingredients
A literature search on the compounds isolated from each plant ingredient was carried out
in Scifinder and PubMed. After analysis of the literature, known compounds were dereplicated in
each plant material listed in Table 1 and Figure 1. The identification of compounds relied also on

9
the data of accurate mass measurement, molecular formula and double bond equivalent (DBE),
score, and error (ppm) of the measurement as well as the comparison of the data with the previously
published data for the compounds [9] (Figure 38). A potential marker per plant was compared with
each one of the markers present in every plant ingredient of the formulations to avoid duplicity of
the markers. Another relevant characteristic of the marker is its commercial availability. This
allowed for the determination of the presence of each plant ingredient in the formulations. Table
3 lists the markers selected per plant ingredient and their commercial availability.
A comparison between the accurate mass of the proposed chemical marker with the
corresponding accurate mass of chemical constituents of plant raw material is included in the
formula and the three samples of the formulation. Further confirmation of the selected chemical
marker was done by matching of retention time, molecular formula, and double bond equivalent
(DBE) of each chemical marker in the plant materials and extracts 2014-005_1A and 2014-005_1B
and YANG XIN® capsules, and the reference standard (Figure 39). Figures 2-37 provide the total
ion chromatogram of the plants and the extracted ion chromatogram of chemical markers selected
per each plant.
Eleven markers out of 18 markers have been selected for the first time as chemical markers
to represent the plants in the YANG XIN® formulations. Two markers, forsythoside A and β-
amyrin, were present in more than one plant present in YANG XIN® formulations. Forsythoside
A was found in Rehmannia glutinosa and Cistanche salsa whereas β-amyrin was present in Lycium
barbarum, Panax ginseng, and Amber. Because other specific compounds to these 5 plant
ingredients were not commercially available, forsythoside A was selected as an analytical marker
for Rehmannia glutinosa and β-amyrin for Amber. The identification of β-amyrin was carried on
APCI because the compound was non-polar and did not ionize in the ESI mode. The chemical

10
marker polygonatine A was not commercially available due to the failure in its chemical synthesis
by two vendors.

11
Table 1 LC-MS identification of the analytical markers
Plant Family Part tR Accurate mass Exact mass Formula DBE Error (ppm) Score Marker
Angelica sinensis (Tang-kuei root) Apiaceae Root 19.91 188.0838 188.0837 C12H12O2 7 -0.47 99.94 Z-Butylidenephthalide
Cuscuta chinensis (Cuscuta seed) Convolvulaceae Seed 11.22 516.1273 516.1268 C25H24O12 14 -1.06 97.61 4,5 Dicaffeoylquinic acid
Nelumbo nucifera (Lotus seed) Nelumbonaceae Seed 10.00 313.1679 313.1678 C19H23NO3 9 -0.42 99.04 Armepavine
Dioscorea batatas (Dioscorea rhizome) Dioscoreaceae Rhizome 14.50 244.1099 244.1099 C15H16O3 8 0.29 99.81 Batatasin III
Cistanche salsa (Cistanche stem) Orobanchaceae Stem 11.58 652.2372 652.2367 C31H40O15 12 -0.78 99.14 Cistanoside D
Astragalus membranaceus (Astragalus root) Fabaceae Root 16.98 268.0734 268.0736 C16H12O4 11 0.62 98.6 Formononetin
Rehmannia glutinosa (Rehmannia root tuber) Orobanchaceae Root Tuber 10.69 624.2043 624.2054 C29H36O15 12 1.78 97.44 Forsythoside A
Panax ginseng (Ginseng root) Araliaceae Root 18.53 800.4961 800.4922 C42H72O14 7 0.81 96.06 Ginsenoside Rf
Lycium barbarum (Lycium fruit) Solanaceae Fruit 36.80 600.4178 600.4179 C40H56O4 13 0.04 99.8 Neoxanthin
Ophiopogon japonicas (Ophiopogon root tuber) Asparagaceae Root Tuber 23.78 328.0941 328.0947 C18H16O6 11 1.72 95.9 Ophiopogonanone A
Biota orientalis (Biota seed) Cupressaceae Seed 23.70 346.215 346.2144 C21H30O4 7 -1.83 92.97 Pinusolide
Polygonatum sibiricum (Polygonatum rhizome) Asparagaceae Rhizome 9.60 165.0788 165.0790 C9H11NO2 5 1.1 87.35 Polygonatine A
Poria cocos (Hoelen sclerotium) Polyporaceae Sclerotium 30.99 498.3349 498.3345 C31H46O5 9 -0.84 98.96 Poricoic Acid A
Schisandra chinensis (Schizandra fruit) Schisandraceae Fruit 17.30 432.2147 432.2148 C24H32O7 9 0.18 99.65 Schisandrol A
Polygala tenuifolia (Polygala root) Polygalaceae Root 10.33 518.1638 518.1636 C22H30O14 8 -0.5 99.54 Sibiricoses A5
Zizyphus spinosa (Jujuba seed) Rhamnaceae Seed 11.45 446.1217 446.1213 C22H22O10 12 -.0.94 98.95 Swertisin
Amber (Succinum amber) Unclassified Unclassified 10.71 426.3861 426.3862 C30H50O 6 0.05 99.76 β-Amyrin
Acorus gramineus (Acorus rhizome) Acoraceae Rhizome 18.32 208.1098 208.1099 C12H16O3 5 0.87 99.64 α-Asarone
tR: Retention time; DBE: Double bond equivalent

12
Figure 1. Chemical structure of the analytical markers

13
Figure 2. Total ion chromatogram of Nelumbo nucifera (Lotus seed)
Figure 3. Extracted ion chromatogram of armepavine from Nelumbo nucifera (Lotus seed).
Methanol extract; ESI; positive ionization mode.
Figure 2 shows the total ion chromatogram obtained from the methanol extract of Nelumbo
nucifera seeds in the positive ionization mode. Figure 3 is the extracted ion chromatogram of the
sample from Figure 2 monitoring for the molecular ion [M+H]+ at 314.1751 m/z. The results
indicate three different peaks of equivalent ion (314.1751 m/z) which indicate three possible
isomers of armepavine. A chromatographic comparison with the reference standard shows that the
peak at retention time 10 minutes was armepavine. The excellent ionization of armepavine in the
positive mode is due to the presence of a basic nitrogen atom.
6 x10
0 1 2 3 4 5 6 7
+ TIC Scan 5 mg.ml Lotus(M)Dis(M)Dil(M)1to5+ve.d
Counts vs. Acquisition Time (min) 1 2 3 4 5 6 7 8 9 10 11 12 13 14 15 16 17 18 19 20 21 22 23 24 25 26 27 28 29 30 31 32 33 34 35 36 37 38 39 40
4 x10
0 0.25 0.5
0.75 1
1.25 1.5
1.75 2
2.25 2.5
2.75 3 + EIC(314.1751) Scan 5 mg.ml Lotus(M)Dis(M)Dil(M)1to5+ve.d Smooth
Counts vs. Acquisition Time (min) 1 2 3 4 5 6 7 8 9 10 11 12 13 14 15 16 17 18 19 20 21 22 23 24 25 26 27 28 29 30 31 32 33 34 35 36 37 38 39 40 41
Armepavine

14
Figure 4. Total ion chromatogram of Rehmannia glutinosa (Rehmannia root tuber)
Figure 5. Extracted ion chromatogram of forsythoside A from Rehmannia glutinosa (Rehmannia
root tuber). Methanol extract; ESI; negative ionization mode.
Figure 4 shows the total ion chromatogram obtained from the methanol extract of
Rehmannia glutinosa root in the negative ionization mode. Figure 5 is the extracted ion
chromatogram of the sample from Figure 4 monitoring for the molecular ion [M-H]- at 623.1951
m/z. The results indicate three different peaks of equivalent ion (623.1951 m/z) which indicate
three possible isomers of Forsythoside A. A chromatographic comparison with the reference
standard shows that the peak at retention time 10.9 minutes was Forsythoside A. The excellent
ionization of Forsythoside A in the negative mode is due to the presence of acidic catechol groups.
7 x10
0 0.1 0.2 0.3 0.4 0.5 0.6 0.7 0.8 0.9
1 1.1 1.2
- TIC Scan 5 mg ml Rehmania (M) Dis. (M) 1 to 20 -ve.d
Counts vs. Acquisition Time (min) 1 2 3 4 5 6 7 8 9 10 11 12 13 14 15 16 17 18 19 20 21 22 23 24 25 26 27 28 29 30 31 32 33 34 35 36 37 38 39 40
4 x10
0 0.2 0.4 0.6 0.8
1 1.2 1.4 1.6
- EIC(623.1951) Scan 5 mg ml Rehmania (M) Dis. (M) 1 to 20 -ve.d Smooth
Counts vs. Acquisition Time (min) 1 2 3 4 5 6 7 8 9 10 11 12 13 14 15 16 17 18 19 20 21 22 23 24 25 26 27 28 29 30 31 32 33 34 35 36 37 38 39 40 41
Forsythoside A

15
Figure 6. Total ion chromatogram of Acorus gramineus (Acorus rhizome)
Figure 7. Extracted ion chromatogram of α-asarone from Acorus gramineus (Acorus rhizome).
Dichloromethane extract; ESI; positive ionization mode.
Figure 6 shows the total ion chromatogram obtained from the dichloromethane extract of
Acorus gramineus rhizome in the positive ionization mode. Figure 7 is the extracted ion
chromatogram of the sample from Figure 6 monitoring for the molecular ion [M+H]+ at 209.1167
m/z. The results indicate four different peaks of equivalent ion (209.1167 m/z) which indicate four
possible isomers of α-asarone. A chromatographic comparison with the reference standard shows
that the peak at retention time 18 minutes was α-asarone. The excellent ionization of α-asarone in
the positive mode is probably due to the presence of alkene group.
7 x10
0 0.1 0.2 0.3 0.4 0.5 0.6 0.7 0.8 0.9
1 1.1 1.2 1.3
+ TIC Scan 5 mg.ml Acorus(D)Dis(M)Dil(M)1to40 +ve new.d
Counts vs. Acquisition Time (min) 1 2 3 4 5 6 7 8 9 10 11 12 13 14 15 16 17 18 19 20 21 22 23 24 25 26 27 28 29 30 31 32 33 34 35 36 37 38 39
6 x10
0 0.2 0.4 0.6 0.8
1 1.2 1.4 1.6 1.8
2 2.2 2.4 2.6
+ EIC(209.1167) Scan 5 mg.ml Acorus(D)Dis(M)Dil(M)1to40 +ve new.d Smooth
Counts vs. Acquisition Time (min) 1 2 3 4 5 6 7 8 9 10 11 12 13 14 15 16 17 18 19 20 21 22 23 24 25 26 27 28 29 30 31 32 33 34 35 36 37 38 39 40 41
α-Asarone

16
Figure 8. Total ion chromatogram of Astragalus membranaceus (Astragalus root)
Figure 9. Extracted ion chromatogram of formononetin from Astragalus membranaceus
(Astragalus root). Methanol extract; ESI; negative ionization mode.
Figure 8 shows the total ion chromatogram obtained from the methanol extract of
Astragalus membranaceus root in the negative ionization mode. Figure 9 is the extracted ion
chromatogram of the sample from Figure 8 monitoring for the molecular ion [M-H]- at 267.0655
m/z. The results indicate one peaks of equivalent ion (267.0655 m/z) which probably indicate
formononetin. A chromatographic comparison with the reference standard shows that the peak at
retention time 17 minutes was formononetin. The excellent ionization of formononetin in the
negative mode is due to the presence of acidic hydroxyl group.
7 x10
0 0.1 0.2 0.3 0.4 0.5 0.6 0.7 0.8 0.9
1 1.1 1.2 1.3
- TIC Scan 5 mg ml Astragalus (M) Dis. (M) 1 to 20 -ve.d
Counts vs. Acquisition Time (min) 1 2 3 4 5 6 7 8 9 10 11 12 13 14 15 16 17 18 19 20 21 22 23 24 25 26 27 28 29 30 31 32 33 34 35 36 37 38 39 40 41
5 x10
0 0.25 0.5
0.75 1
1.25 1.5
1.75 2
2.25 2.5
2.75 - EIC(267.0655) Scan 5 mg ml Astragalus (M) Dis. (M) 1 to 20 -ve.d Smooth
Counts vs. Acquisition Time (min) 1 2 3 4 5 6 7 8 9 10 11 12 13 14 15 16 17 18 19 20 21 22 23 24 25 26 27 28 29 30 31 32 33 34 35 36 37 38 39 40 41
Formononetin

17
Figure 10. Total ion chromatogram of Panax ginseng (Ginseng root)
Figure 11. Extracted ion chromatogram of ginsenoside Rf from Panax ginseng (Ginseng root).
Methanol extract; ESI; positive ionization mode.
Figure 10 shows the total ion chromatogram obtained from the methanol extract of Panax
ginseng root in the positive ionization mode. Figure 11 is the extracted ion chromatogram of the
sample from Figure 10 monitoring for the molecular ion [(M+H)-GluGlu-H2O]+ at 423.3626 m/z.
The results indicate multiple different peaks of equivalent ion (423.3626 m/z) which indicate
multiple possible isomers of ginsenoside Rf. A chromatographic comparison with the reference
standard shows that the peak at retention time 17.6 minutes was ginsenoside Rf. The excellent
ionization of ginsenoside Rf in the positive mode is probably due to the presence of alkene group.
Ginsenoside Rf

18
Figure 12. Total ion chromatogram of Zizyphus spinosa (Jujuba seed)
Figure 13. Extracted ion chromatogram of swertisin from Zizyphus spinosa (Jujuba seed).
Methanol extract; ESI; negative ionization mode.
Figure 12 shows the total ion chromatogram obtained from the methanol extract of
Zizyphus spinosa seed in the negative ionization mode. Figure 13 is the extracted ion
chromatogram of the sample from Figure 12 monitoring for the molecular ion [M-H]- at 445.1163
m/z. The results indicate one peaks of equivalent ion (445.1163 m/z) which probably indicates
swertisin. A chromatographic comparison with the reference standard shows that the peak at
retention time 11.5 minutes was swertisin. The excellent ionization of swertisin in the negative
mode is due to the presence of acidic hydroxyl groups.
7 x10
0 0.2 0.4 0.6 0.8
1 1.2 1.4
- TIC Scan 2.5 mg ml Jujube (M) Dis. (M) 1 to 5 -ve.d
Counts vs. Acquisition Time (min) 1 2 3 4 5 6 7 8 9 10 11 12 13 14 15 16 17 18 19 20 21 22 23 24 25 26 27 28 29 30 31 32 33 34 35 36 37 38 39 40
3 x10
0 1 2 3 4 5 6 7 8
- EIC(445.1107-445.1219) Scan 2.5 mg ml Jujube (M) Dis. (M) 1 to 5 -ve.d Smooth
Counts vs. Acquisition Time (min) 1 2 3 4 5 6 7 8 9 10 11 12 13 14 15 16 17 18 19 20 21 22 23 24 25 26 27 28 29 30 31 32 33 34 35 36 37 38 39 40 41
Swertisin

19
Figure 14. Total ion chromatogram of of Polygonatum sibiricum (Polygonatum rhizome)
Figure 15. Extracted ion chromatogram of polygonatine A from Polygonatum sibiricum
(Polygonatum rhizome). Dichloromethane extract; ESI; positive ionization mode.
Figure 14 shows the total ion chromatogram obtained from the dichloromethane extract of
Polygonatum sibiricum rhizome in the positive ionization mode. Figure 15 is the extracted ion
chromatogram of the sample from Figure 14 monitoring for the molecular ion [M+H]+ at 166.0861
m/z. The results indicate multiple different peaks of equivalent ion (166.0861 m/z) which indicate
multiple possible isomers of polygonatine A. A chromatographic comparison with the reference
standard shows that the peak at retention time 10 minutes was polygonatine A. The excellent
ionization of polygonatine A in the positive mode is due to the presence of nitrogen atom.
7 x10
0 0.1 0.2 0.3 0.4 0.5 0.6 0.7 0.8 0.9
1 1.1 1.2
+ TIC Scan 5 mg.ml Polugonatum(D)Dis(M)Dil(M)1to5 +ve new.d
Counts vs. Acquisition Time (min) 1 2 3 4 5 6 7 8 9 10 11 12 13 14 15 16 17 18 19 20 21 22 23 24 25 26 27 28 29 30 31 32 33 34 35 36 37 38 39 40
4 x10
0 0.1 0.2 0.3 0.4 0.5 0.6 0.7 0.8 0.9
1 1.1 1.2 1.3
+ EIC(166.0861) Scan 5 mg.ml Polugonatum(D)Dis(M)Dil(M)1to5 +ve new.d Smooth
Counts vs. Acquisition Time (min) 1 2 3 4 5 6 7 8 9 10 11 12 13 14 15 16 17 18 19 20 21 22 23 24 25 26 27 28 29 30 31 32 33 34 35 36 37 38 39 40 41
Polygonatine A

20
Figure 16. Total ion chromatogram of Schisandra chinensis (Schizandra fruit)
Figure 17. Extracted ion chromatogram of schisandrol A from Schisandra chinensis (Schizandra
fruit). Dichloromethane extract; ESI; positive ionization mode.
Figure 16 shows the total ion chromatogram obtained from the dichloromethane extract of
Schisandra chinensis fruit in the positive ionization mode. Figure 17 is the extracted ion
chromatogram of the sample from Figure 16 monitoring for the molecular ion [M+H]+ at 433.2223
m/z. The results indicate two different peaks of equivalent ion (433.2223 m/z) which indicate two
possible isomers of schisandrol A. A chromatographic comparison with the reference standard
shows that the peak at retention time 17.5 minutes was schisandrol A.
7 x10
0 0.1 0.2 0.3 0.4 0.5 0.6 0.7 0.8 0.9
1 1.1 1.2 1.3 + TIC Scan 2.5 mg ml Schisandra (D) Dis. (M) 1 to 10 +ve.d
Counts vs. Acquisition Time (min) 1 2 3 4 5 6 7 8 9 10 11 12 13 14 15 16 17 18 19 20 21 22 23 24 25 26 27 28 29 30 31 32 33 34 35 36 37 38 39 40 41
Schisandrol A

21
Figure 18. Total ion chromatogram of Dioscorea batatas (Dioscorea rhizome)
Figure 19. Extracted ion chromatogram of batatisin III from Dioscorea batatas (Dioscorea
rhizome). Dichloromethane extract; ESI; negative ionization mode.
Figure 18 shows the total ion chromatogram obtained from the dichloromethane extract of
Dioscorea batatas rhizome in the negative ionization mode. Figure 19 is the extracted ion
chromatogram of the sample from Figure 18 monitoring for the molecular ion [M-H]- at 243.1024
m/z. The results indicate two different peaks of equivalent ion (243.1024 m/z) which indicate two
possible isomers of batatisin III. A chromatographic comparison with the reference standard shows
that the peak at retention time 15.5 minutes was batatisin III. The excellent ionization of batatisin
III in the negative mode is due to the presence of acidic hydroxyl groups.
7 x10
0 0.2 0.4 0.6 0.8
1 1.2 1.4 1.6 1.8
- TIC Scan 2.5 mg.ml Yam(D)Dis(M) no Dil -ve new.d
Counts vs. Acquisition Time (min) 1 2 3 4 5 6 7 8 9 10 11 12 13 14 15 16 17 18 19 20 21 22 23 24 25 26 27 28 29 30 31 32 33 34 35 36 37 38 39 40 41
Batatisin III

22
Figure 20. Total ion chromatogram of Ophiopogon japonicas (Ophiopogon root tuber)
Figure 21. Extracted ion chromatogram of ophiopogonanone A from Ophiopogon japonicas
(Ophiopogon root tuber). Dichloromethane extract; ESI; negative ionization mode.
Figure 20 shows the total ion chromatogram obtained from the dichloromethane extract of
Ophiopogon japonicas root in the negative ionization mode. Figure 21 is the extracted ion
chromatogram of the sample from Figure 20 monitoring for the molecular ion [M-H]- at 327.0908
m/z. The results indicate one peaks of equivalent ion (327.0908 m/z) which probably indicates
ophiopogonanone A. A chromatographic comparison with the reference standard shows that the
peak at retention time 24 minutes was ophiopogonanone A. The excellent ionization of
ophiopogonanone A in the negative mode is due to the presence of acidic hydroxyl groups.
6 x10
0 1 2 3 4 5 6 7 8
- TIC Scan 5 mg ml Ophiopogon (D) Dis. (M) 1 to 20 -ve.d
Counts vs. Acquisition Time (min) 1 2 3 4 5 6 7 8 9 10 11 12 13 14 15 16 17 18 19 20 21 22 23 24 25 26 27 28 29 30 31 32 33 34 35 36 37 38 39 40 41
5 x10
0 0.5
1 1.5
2 2.5
3 3.5
4 4.5
5 5.5
- EIC(327.0871-327.0944) Scan 5 mg ml Ophiopogon (D) Dis. (M) 1 to 20 -ve.d Smooth
Counts vs. Acquisition Time (min) 1 2 3 4 5 6 7 8 9 10 11 12 13 14 15 16 17 18 19 20 21 22 23 24 25 26 27 28 29 30 31 32 33 34 35 36 37 38 39 40 41
Ophiopogonanone A

23
Figure 22. Total ion chromatogram of Biota orientalis (Biota seed)
Figure 23 Extracted ion chromatogram of pinusolide from Biota orientalis (Biota seed). Methanol
extract; ESI; positive ionization mode.
Figure 22 shows the total ion chromatogram obtained from the methanol extract of Biota
orientalis seed in the positive ionization mode. Figure 23 is the extracted ion chromatogram of the
sample from Figure 22 monitoring for the molecular ion [M+H]+ at 347.2216 m/z. The results
indicate three different peaks of equivalent ion (347.2216 m/z) which indicate three possible
isomers of pinusolide. A chromatographic comparison with the reference standard shows that the
peak at retention time 25 minutes was pinusolide. The excellent ionization of pinusolide in the
positive mode is probably due to the presence of alkene group.
6 x10
0 1 2 3 4 5 6 7 8
+ TIC Scan 5 mg.ml Biota(M)Dis(M)Dil(M)1to5+ve.d
Counts vs. Acquisition Time (min) 1 2 3 4 5 6 7 8 9 10 11 12 13 14 15 16 17 18 19 20 21 22 23 24 25 26 27 28 29 30 31 32 33 34 35 36 37 38 39 40 41
Pinusolide

24
Figure 24. Total ion chromatogram of Poria cocos (Hoelen sclerotium)
Figure 25. Extracted ion chromatogram of poricoic acid A from Poria cocos (Hoelen sclerotium).
Dichloromethane extract; ESI; negative ionization mode.
Figure 24 shows the total ion chromatogram obtained from the dichloromethane extract of
Poria cocos sclerotium in the negative ionization mode. Figure 25 is the extracted ion
chromatogram of the sample from Figure 24 monitoring for the molecular ion [M-H]- at 497.3332
m/z. The results indicate two different peaks of equivalent ion (497.3332 m/z) which indicate two
possible isomers of poricoic acid A. A chromatographic comparison with the reference standard
shows that the peak at retention time 31 minutes was poricoic acid A. The excellent ionization of
poricoic acid A in the negative mode is due to the presence of acidic carboxylic acid groups.
7 x10
0 0.1 0.2 0.3 0.4 0.5 0.6 0.7 0.8 0.9
1 1.1 1.2 1.3
- TIC Scan 5 mg ml Poria (D) Dis. (M) 1 to 20 -ve.d
Counts vs. Acquisition Time (min) 1 2 3 4 5 6 7 8 9 10 11 12 13 14 15 16 17 18 19 20 21 22 23 24 25 26 27 28 29 30 31 32 33 34 35 36 37 38 39 40 41
6 x10
0 0.2 0.4 0.6 0.8
1 1.2 1.4 1.6 1.8
2 2.2
- EIC(497.3257-497.3407) Scan 5 mg ml Poria (D) Dis. (M) 1 to 20 -ve.d Smooth
Counts vs. Acquisition Time (min) 1 2 3 4 5 6 7 8 9 10 11 12 13 14 15 16 17 18 19 20 21 22 23 24 25 26 27 28 29 30 31 32 33 34 35 36 37 38 39 40 41
Poricoic Acid A
25
Figure 26. Total ion chromatogram of Polygala tenuifolia (Polygala root)
Figure 27. Extracted ion chromatogram of sibiricoses A5 from Polygala tenuifolia (Polygala root).
Methanol extract; ESI; negative ionization mode.
Figure 26 shows the total ion chromatogram obtained from the methanol extract of
Polygala tenuifolia root in the negative ionization mode. Figure 27 is the extracted ion
chromatogram of the sample from Figure 26 monitoring for the molecular ion [M-H]- at 517.1525
m/z. The results indicate two different peaks of equivalent ion (517.1525 m/z) which indicate two
possible isomers of sibiricoses A5. A chromatographic comparison with the reference standard
shows that the peak at retention time 10.1 minutes was sibiricoses A5. The excellent ionization of
sibiricoses A5in the negative mode is due to the presence of acidic hydroxyl group.
7 x10
0 0.1 0.2 0.3 0.4 0.5 0.6 0.7 0.8 0.9
1 - TIC Scan 5 mg ml Polygala (M) Dis. (M) 1 to 20 -ve.d
Counts vs. Acquisition Time (min) 1 2 3 4 5 6 7 8 9 10 11 12 13 14 15 16 17 18 19 20 21 22 23 24 25 26 27 28 29 30 31 32 33 34 35 36 37 38 39 40 41
Sibiricose A5

26
Figure 28. Total ion chromatogram of Cuscuta chinensis (Cuscuta seed)
Figure 29. Extracted ion chromatogram of 4,5 dicaffeoylquinic acid from Cuscuta chinensis
(Cuscuta seed). Methanol extract; ESI; negative ionization mode.
Figure 28 shows the total ion chromatogram obtained from the methanol extract of Cuscuta
chinensis seed in the negative ionization mode. Figure 29 is the extracted ion chromatogram of the
sample from Figure 28 monitoring for the molecular ion [M-H]- at 515.1161 m/z. The results
indicate two different peaks of equivalent ion (515.1161 m/z) which indicate two possible isomers
of 4,5 dicaffeoylquinic acid. A chromatographic comparison with the reference standard shows
that the peak at retention time 11.6 minutes was 4,5 dicaffeoylquinic acid. The excellent ionization
of 4,5 dicaffeoylquinic acid in the negative mode is due to the presence of acidic catechol groups.
6 x10
0 0.5
1 1.5
2 2.5
3 3.5
4 4.5
5 5.5
6 6.5
- TIC Scan 5 mg ml Dodder (M) Dis. (M) 1 to 20 -ve.d
Counts vs. Acquisition Time (min) 1 2 3 4 5 6 7 8 9 10 11 12 13 14 15 16 17 18 19 20 21 22 23 24 25 26 27 28 29 30 31 32 33 34 35 36 37 38 39 40
4,5 Dicaffeoylquinic acid

27
Figure 30. Total ion chromatogram of Angelica sinensis (Tangkuei root)
Figure 31. Extracted ion chromatogram of Z-butylidenephthalide from Angelica sinensis
(Tangkuei root). Dichloromethane extract; ESI; positive ionization mode.
Figure 30 shows the total ion chromatogram obtained from the dichloromethane extract of
Angelica sinensis root in the positive ionization mode. Figure 31 is the extracted ion chromatogram
of the sample from Figure 30 monitoring for the molecular ion [M+H]+ at 189.0906 m/z. The
results indicate four different peaks of equivalent ion (189.0906 m/z) which indicate four possible
isomers of Z-butylidenephthalide. A chromatographic comparison with the reference standard
shows that the peak at retention time 10.9 minutes was Z-butylidenephthalide. The excellent
ionization of Z-butylidenephthalide in the positive mode is probably due to the presence of alkene
group.
6 x10
0 0.1 0.2 0.3 0.4 0.5 0.6 0.7 0.8 0.9
1 + EIC(189.0906) Scan 2.5 mg ml Angelica (D) Dis. (M) 1 to 10 +ve.d Smooth
Counts vs. Acquisition Time (min) 1 2 3 4 5 6 7 8 9 10 11 12 13 14 15 16 17 18 19 20 21 22 23 24 25 26 27 28 29 30 31 32 33 34 35 36 37 38 39 40 41
Z-Butylidenephthalide

28
Figure 32. Total ion chromatogram of Cistanche salsa (Cistanche stem)
Figure 33. Extracted ion chromatogram of cistanoside D from Cistanche salsa (Cistanche stem).
Dichloromethane extract; ESI; negative ionization mode.
Figure 32 shows the total ion chromatogram obtained from the dichloromethane extract of
Cistanche salsa stem in the negative ionization mode. Figure 33 is the extracted ion chromatogram
of the sample from Figure 32 monitoring for the molecular ion [M-H]- at 651.2245 m/z. The results
indicate six different peaks of equivalent ion (651.2245 m/z) which indicate six possible isomers
of cistanoside D. A chromatographic comparison with the reference standard shows that the peak
at retention time 12.2 minutes was cistanoside D. The excellent ionization of cistanoside D in the
negative mode is due to the presence of acidic hydroxyl groups.
6 x10
0 0.5
1 1.5
2 2.5
3 3.5
4 4.5
5 5.5
- TIC Scan 5 mg.ml Cistanche(D)Dis(M)Dil(M)1to5 -ve.d
Counts vs. Acquisition Time (min) 1 2 3 4 5 6 7 8 9 10 11 12 13 14 15 16 17 18 19 20 21 22 23 24 25 26 27 28 29 30 31 32 33 34 35 36 37 38 39 40
Cistanoside D

29
Figure 34. Total ion chromatogram of Lycium barbarum (Lycium fruit)
Figure 35. Extracted ion chromatogram of neoxanthin from Lycium barbarum (Lycium fruit).
Dichloromethane extract; ESI; positive ionization mode.
Figure 34 shows the total ion chromatogram obtained from the dichloromethane extract of
Lycium barbarum fruit in the positive ionization mode. Figure 35 is the extracted ion
chromatogram of the sample from Figure 34 monitoring for the molecular ion [M+H]+ at 601.4479
m/z. The results indicate four different peaks of equivalent ion (601.4479 m/z) which indicate four
possible isomers of neoxanthin. A chromatographic comparison with the reference standard shows
that the peak at retention time 35.7 minutes was neoxanthin. The excellent ionization of neoxanthin
in the positive mode is probably due to the presence of alkene groups.
7 x10
0 0.1 0.2 0.3 0.4 0.5 0.6 0.7 0.8 0.9
1 + TIC Scan 5 mg.ml Lycium(D)Dis(M)Dil(M)1to5 +ve new.d
Counts vs. Acquisition Time (min) 1 2 3 4 5 6 7 8 9 10 11 12 13 14 15 16 17 18 19 20 21 22 23 24 25 26 27 28 29 30 31 32 33 34 35 36 37 38 39 40 41
4 x10
0 0.2 0.4 0.6 0.8
1 1.2 1.4 1.6 1.8
+ EIC(601.4479) Scan 5 mg.ml Lycium(D)Dis(M)Dil(M)1to5 +ve new.d Smooth
Counts vs. Acquisition Time (min) 1 2 3 4 5 6 7 8 9 10 11 12 13 14 15 16 17 18 19 20 21 22 23 24 25 26 27 28 29 30 31 32 33 34 35 36 37 38 39 40 41
Neoxanthin

30
Figure 36. Total ion chromatogram of Amber (Succinum)
Figure 37. Extracted ion chromatogram of β-amyrin from Amber (Succinum). Dichloromethane
extract; ESI; positive ionization mode.
Figure 36 shows the total ion chromatogram obtained from the dichloromethane extract of
Amber in the positive ionization mode. Figure 37 is the extracted ion chromatogram of the sample
from Figure 36 monitoring for the molecular ion [(M+H)-H2O]+ at 409.3800 m/z. The results
indicate three different peaks of equivalent ion (409.3800 m/z) which indicate three possible
isomers of β-amyrin. A chromatographic comparison with the reference standard shows that the
peak at retention time 10.7 minutes was β-amyrin. The excellent ionization of β-amyrin in the
positive mode is probably due to the presence of alkene group.
β-Amyrin

31
6/30/2015 27
Identification of schisandrol A in
the plant extract
TIC of the reference
compound schisandrol A
TIC of the plant extract
EIC of the marker
EIC of the reference
compound schisandrol A
Figure 38. Identification of schisandrol A in the plant extract

32
Figure 39. Identification of the schisandrol A in the plant extract YANG XIN® formulations and reference standard

33
In summary, we found that the majority of polar compounds like sibiricoses A5 were
extracted in the methanol fraction because methanol is a more polar solvent and extracted the polar
compounds in contrast to non-polar compounds like neoxanthin which partitioned into the
dichloromethane extract because dichloromethane is a non-polar solvent. The use of ESI ion
source enhance the ionization of polar compounds like ginsenoside Rf. The use of ESI for non-
polar compounds such as β-Amyrin was a less efficient ionization strategy and APCI ionization
gave better results. The use of positive mode was more favorable for compounds that have
functional group that can accept proton like basic nitrogen atom in armepavine while the use of
negative mode was more favorable for compounds with acidic functional group like the carboxylic
acid group in poricoic acid A. The detection of some compounds reveals more than one peaks
which could be isomeric forms of the proposed compound like in the case of batatasin III in figure
19 which shows two peaks that correspond to batatasin III and batatasin IV. The comparison of
the extracted mass in figure 19 with batatasin III reference standard revealed that the first peak is
batatasin III. Both ionization mode, positive and negative, detected the same number of analytical
markers, nine analytical markers for each mode. The dichloromethane extract extracted 10
analytical markers in comparison to 8 analytical markers in the methanol extract. The use of APCI
ion source was for ionization of non-polar compounds like β-amyrin, while more polar compounds
was ionized very well with the use of ESI ion source.

34
2.3.3 Biological activity of plants in YANG XIN® formulations
Table 2 Biological activity of some plants included in YANG XIN® formulations
Markers Biological activity Reference
Angelica sinensis Reduce sleep disorder [6]
Cuscuta chinensis Nourishing blood [6]
Cistanche salsa Prolong the duration of barbiturate-induced sleeping time [6]
Astragalus membranaceus Tonic effect and anti-oxidant [17]
Rehmannia glutinosa Treat cognitive impairment via enhancing endogenous antioxidant enzymatic activities
and inhibiting free radical generation [6]
Panax ginseng Maintain balance in the body and help the body adapt to stress [18]
Lycium barbarum
Increased energy level, stamina/endurance, sleep quality, ability to focus on activities,
mental acuity, calmness, reduced feelings of fatigue, stress, headache, depression,
daydreaming, impaired concentration, excess worry, unreasonable worry, memory loss
[19]
Biota orientalis Sedative effect [18]
Poria cocos Anti-neurasthenia activity [6]
Schisandra chinensis Increase the body’s capacity to work and support circulation [18]
Polygala tenuifolia Cognition improving effects [6]
Zizyphus spinosa Promote relaxation [18]
Table 2 shows the biological activity of some of the plants included in YANG XIN®
formulations.

35
Table 3 List of selected chemical markers and corresponding suppliers
Markers Class Purity (%) Supplier Catalog Number
Z-Butylidenephthalide Phthalide 96 Sigma Aldrich W333301-SAMPLE-K
4,5 Dicaffeoylquinic acid Polyphenolic Compound 98 AvaChem Scientific 2086
Armepavine Isoquinoline Alkaloid 95 Ryan Scientific Inc STOCK1N-04340
Batatasin III Stilbene 95 Analyticon Discovery NP-012363
Cistanoside D Phenylpropanoid Glycoside 95 Aapin Chemicals 20263 c
Formononetin Isoflavone Reagent Grade Chromadex ASB-00006191-050
Forsythoside A Phenylpropanoid Glycoside 71 Analyticon Discovery NP-003731
Ginsenoside Rf Triterpenoid Saponin Glycoside 86 Chromadex ASB-00007215-010
Neoxanthin Tetraterpene 97 Bocsci 14660-91-4
Ophiopogonanone A Homoisoflavonoid 98 A ChemtekInc 217-1330
Pinusolide labdane-type diterpene lactone 98 A ChemtekInc 172-1204
Polygonatine A Alkaloid Not commercially available
Poricoic acid A Triterpene 98 ChemFaces CFN92838
Schisandrol A Lignan 98 Sigma Aldrich SML0054-10MG
Sibiricoses A5 Sucrose ester 100 Analyticon Discovery NP-018116
Swertisin Flavonoid 78 Chromadex ASB-00019441-010
β-Amyrin Triterpene 99 Chromadex ASB-00001745-010
α-asarone Phenolic Ether 99 Chromadex ASB-00011016-100

36
2.3.4 LC-MS chemical fingerprinting of YANG XIN® formulations
The same method for sample extraction described in Section 2.2.2.1 and sample
preparation for plant fingerprinting described in Section 2.2.5 was used for the chemical
fingerprinting of the YANG XIN® formulations, with the exception that a concentration of 0.75
mg/mL was used. LC-MS chemical fingerprinting of YANG XIN® formulations was achieved as
shown in the following Figures 40-44. The visual inspection of the three different formulations in
methanol and dichloromethane extracts in the positive and negative ionization modes revealed that
YANG XIN® formulation seemed similar to the 2014-005_1B formulation and completely
different from 2014-005_1A formulation.
Figure 40. Total ion chromatogram of methanol extract of the three different formulations in
positive mode
Type of extract: Methanol
Source of ionization: ESI
Ionization mode: Positive

37
Figure 41. Total ion chromatogram of dichloromethane extract of the three different formulations
in positive mode
Type of extract: Dichloromethane
Source of ionization: ESI
Ionization mode: Positive
Figure 42. Total ion chromatogram of methanol extract of the three different formulations in
negative mode
Type of extract: Methanol
Source of ionization: ESI
Ionization mode: Negative

38
Figure 43. Total ion chromatogram of dichloromethane extract of the three different formulations
in negative mode
Type of extract: Dichloromethane
Source of ionization: ESI
Ionization mode: Negative
Figure 44. Total ion chromatogram of dichloromethane extract of the three different formulations
in positive mode
Type of extract: Dichloromethane
Source of ionization: APCI
Ionization mode: Positive

39
2.3.5 1H NMR chemical fingerprinting of YANG XIN® formulations
Based on the 1H NMR chemical fingerprinting method described in Section 2.2.4. 1H NMR
chemical fingerprints of YANG XIN® formulations were achieved as shown in the Figures 45-49.
From the visual inspection of the NMR fingerprint of the methanol extract revealed that
formulation 2014-005_1A showed higher relative intensity of signals in the region of δH 2.5 - 5.5
ppm in comparison to the formulation 2014-005_1B and YANG XIN® capsules. However, the
relative intensity of chemical shifts in the 1H NMR spectra of formulation 2014-005_1B and
YANG XIN® capsules seemed to be identical. On the other hand, the 1H NMR fingerprint of the
dichloromethane extract of YANG XIN® formulation displayed higher relative intensity of the
signals in the region of δH 0.6 − 6.8 ppm when compared with the formulation 2014-005_1B. One
point worth discussing is that a 1H NMR chemical fingerprinting of dichloromethane concentrated
extract 2014-005_1A was not acquired due to very low amount of sample available for the NMR
fingerprinting study.

40
Figure 45. 1H NMR fingerprint of methanol concentrated extract 2014-005_1A
Type of extract: Methanol
Solvent: DMSO- d6

41
Figure 46. 1H NMR fingerprint of methanol concentrated extract 2014-005_1B
Type of extract: Methanol
Solvent: DMSO- d6

42
Figure 47. 1H NMR fingerprint of methanol extract of YANG XIN® capsules
Type of extract: Methanol
Solvent: DMSO- d6

43
Figure 48. 1H NMR fingerprint of dichloromethane concentrated extract 2014-005_1B
Type of extract: Dichloromethane
Solvent: DMSO- d6

44
Figure 49. 1H NMR fingerprint of dichloromethane extract of YANG XIN® capsules
Type of extract: Dichloromethane
Solvent: DMSO-d6

45
2.4 Conclusion
In this section, we developed an optimal extraction procedure of YANG XIN® formulations
twice with dichloromethane and methanol respectively and the LC-MS analysis of its chemical
components. We selected 18 analytical markers for each plant present in the YANG XIN®
formulation based on literature search on the compounds previously isolated from each plant
ingredient. The identification of compounds relied on the data of accurate mass measurement,
molecular formula and double bond equivalent (DBE), score, and error (ppm) of the measurement
as well as the comparison of the data with the previously published data for the compounds. A
comparison was made between the accurate mass of the proposed chemical marker with the
corresponding accurate mass of chemical constituents of plant raw material included in the YANG
XIN® formulation. Further confirmation of the selected chemical marker was done by matching
of retention time, molecular formula, and double bond equivalent (DBE) of each chemical marker
in the plant materials and extracts of YANG XIN® formulations, and the reference standard. Two
ionization sources were used (ESI and APCI) in the LC-MS analysis. The use of LC-MS and 1H
NMR fingerprinting of the different formulations proved to be a useful technique to distinguish
the three different formulations among each other and to assess consistency in the quality of such
samples.

46
Chapter 3: Quantification of analytical markers
3.1 Introduction
After the qualitative analysis part in the previous chapter to identify analytical markers in
the YANG XIN® formulation, gathering quantitative information is definitely a prerequisite for
quality control. A considerable number of obstacles lie in the path of quantitative analysis of herbal
medicine, not only because of its great diversity/variations in phytochemical components either
because of species, origins and harvest season changes [20,21], or presence of some toxic
compounds like in the plants of the genus Digitalis [10], but also due to the lack of authentic
reference standard [22]. According to a review paper written by Li et al in 2011, only 400 reference
compounds were available for TCM products. This low number of reference standards might be
due to instability of reference compounds or the challenging isolation of trace amounts from plants.
About 1.5 billion people are using TCM preparations worldwide [20]. Therefore, quality control
of TCM products is very important to ensure safety and efficacy since they might contain chemical
adulterants and toxic compounds. Also, TCM products must meet the criteria of many
governmental regulatory agencies such as FDA and EMA that clearly state that proper
fingerprinting should be used to assess the consistency of botanical products [21]. Herbal
identification and authentication by the WHO and Chinese pharmacopeia commission are also
required [12].
TCM formulations are usually made from a combination of many plants/herbs, which
contain hundreds or even thousands of different chemical compounds. Moreover, usually the
compound of interest may be present in a very low concentration (˂100 µg/g) [23]. In order to
quantify each plant to ensure safety and efficacy [20], a so-called marker compound for each plant

47
is selected for the purpose of quantitative analysis. Quantification of a small amount of a natural
product in a complex mixture requires state of the art analytical methods [12]. Using a hyphenated
technique such as LC coupled to mass spectrometry is considered the best choice and has been
extensively applied for quality control of TCM products [20]. LC is the most popular instrument
for chromatography because of ease of use and wide suitability [24] and coupling to an MS detector
that provides higher selectivity and sensitivity for assaying trace amounts of compounds [25].
These features of LC-MS makes the quantification of trace amount natural products’ metabolite
easier within a few minutes with high level of sensitivity [12].
3.2 Materials and methods
3.2.1 Chemicals
LC-MS solvents, reference compounds, and formulations used were described previously
in detail in the Section 2.2.1.
3.2.2 Preparation of standard solutions
Each reference standard was dissolved in methanol in a concentration of 5 mg/mL except
for neoxanthin 5 mg/mL in DMSO and formononetin 2.5 mg/ml in methanol then diluted for a
series of dilution according to dilution factor 1:2. Samples were kept in -80 °C freezer until the
date of the analysis.
3.2.3 Calibration curves
Working solutions with concentrations of 0.0076, 0.0153, 0.0305, 0.0610, 0.1221, 0.2441,
0.4883, 0.9766, 1.9531, 3.9063, 7.8125, 15.6250, 31.25, 62.50 µg/mL were prepared by diluting
the stock solutions of reference standards with methanol. Then each working solution was

48
analyzed using LC-MS for the preparation of calibration curves and the determination of linearity,
limit of detection (LOD) and limit of quantitation (LOQ).
3.2.4 Linearity and detection limits
The linearity of the calibration curves were constructed using 15 different concentrations
of the selected chemical markers utilizing a least square linear regression method. Each
concentration was injected three times. Reference standard calibration curves were constructed by
plotting the peak area ratio of each standard against the expected concentrations of the calibration
reference standards. Various weighting factors were used depending on the chemical marker. The
limit of detection (LOD) and the limit of quantification (LOQ) were defined as the concentrations
with signal-to-noise ratios of 3 and 10, respectively. The linear range was investigated up to an
analyte concentration of 62.50 µg/ml. To evaluate the method’s precision and accuracy, the intra-
day variation for the mixed reference standard solution was analyzed 9 times using 3 different
concentrations in 1 day to determine the intra-day variation, and on 3 consecutive days to
determine the inter-day variation using calibration curves that were prepared previously. Relative
standard deviation and relative errors were expressed for both intra-day and inter-day variation
respectively.
3.2.5 Recovery
In order to assess the recovery of the extraction method, we spiked ophiopogonanone A,
one of the selected chemical markers for YANG XIN® formulations at a concentration 0.2441
µg/mL into the YANG XIN® capsules then extracted as mentioned before in the extraction method.
Three replicate injections were performed in the recovery study.

49
3.3 Results and discussion
3.3.1 Quantitation of chemical markers in YANG XIN® formulations
A method based on LC-MS for the quantitative analysis of 17 chemical markers in Yang
Xin® capsules, and two concentrated extracts 2014-005_1A and 2014-005_1B has been developed.
The utility of our new method was demonstrated in the quantitative analysis of the first 17 chemical
markers in the three formulation samples (Tables 4, 5 & 6). No internal standard was used for the
quantitation of YANG XIN® formulations because of the lack of isotopic labeled compounds on
the market for each chemical markers selected for YANG XIN® formulations. Based on the
obtained results from Tables 4, 5 and 6, YANG XIN® capsules and 2014-005_1B formulation
appear to be similar to each other and different from 2014-005_1A formulation based on the fact
that both YANG XIN® capsule and 2014-005_1B formulations contain same analytical markers.
Fifteen chemical makers were identified and quantified in comparison to 10 markers in 2014-
005_1A formulation. The formulation 2014-005_1B contains the highest amount of chemical
markers followed by the formulation YANG XIN® capsules then 2014-005_1A. Good linearity
correlation response was observed for the different analytical markers (r2= 0.9945 – 0.999). The
R.S.D of the intraday precisions were in the range (0.4 -3.9%) with accuracy (99.2 – 101%)
whereas the R.S.D of interday precisions were within (0.5 - 5.6%) with accuracy (99.6 – 100.2%).
The limits of detection and quantitation were (0.0011 – 0.0732 µg/mL), and (0.0038 – 0.2441
µg/mL) respectively. The results suggest the ability of this method to detect the 17 analytical
markers of YANG XIN® formulations with high sensitivity and selectivity.

50
3.3.2 Recovery
In order to assess the recovery of the extraction method, ophiopogonanone A, one of the
18 markers, was selected as a candidate for this test due to two reasons. First, it displayed LOQ
value in the middle concentration range when compared with other markers and second it showed
the same LOQ values as other (6) markers from this study. The reference standard was spiked at a
concentration of 0.2441 µg/mL into the YANG XIN® capsules then extracted as mentioned before
in the extraction method. Three replicate injections were performed. The results showed recovery
of 145. 7% with R.S.D value of 0.2 %. A further recovery study could be done in the future to
assess the extraction efficacy of the remaining markers.

51
Table 4 Linear regression equation analysis in the determination of the 18 analytical markers
Compound tR(min)
Ions (m/z) Linear range
(μg/ml)
Weighting
factor Slope (a) Intercept (b) r2 (n = 3)
LOD
(μg/ml)
LOQ
(μg/ml) (+) ESI
[M+H]+
(-) ESI
[M-H]-
Z-Butylidenephthalide 19.91 189.0915 0.0305 – 3.9063 1/X 2681159.9783 26669.1011 0.9986 0.0092 0.0305
4,5 Dicaffeoylquinic acid 11.22 515.1167 0.0038 – 3.9063 1/X 841803.4303 1181.1532 0.9984 0.0011 0.0038
Armepavine 10.00 314.1783 0.0038 – 0.1221 None 46799070.3241 184499.2967 0.9951 0.0011 0.0038
Batatisin III 14.50 243.0992 0.0038 - 0.2441 None 1161644.9241 9665.6863 0.9978 0.0011 0.0038
Cistanoside D 11.58 651.2237 0.0038 – 0.2441 None 332783.4634 2339.2292 0.9977 0.0011 0.0038
Formononetin 16.98 267.0655 0.0076 - 3.9063 1/X 6920982.1854 14282.9095 0.9966 0.0023 0.0076
Forsythoside A 10.69 623.1993 0.0076 – 15.625 1/X 1458343.0021 7743.7846 0.9990 0.0023 0.0076
GinsenosideRf 18.53 423.3620+ 0.0076 - 3.9063 1/X 879855.6470 1282.2609 0.9993 0.0023 0.0076
Neoxanthin 36.80 601.4251 0.2441 – 7.8125 None 104558.0013 41502.8582 0.9949 0.0732 0.2441
Ophiopogonanone A 23.78 327.0900 0.0076 - 3.9063 None 6872049.7566 9150.0624 0.9999 0.0023 0.0076
Pinusolide 23.70 347.2216 0.0038 – 0.2441 1/X 4407492.7747 13477.1997 0.9961 0.0011 0.0038
Polygonatine A 9.60 166.0861 - - - - - - -
Poricoic Acid A 30.99 497.3300 0.0076 - 3.9063 None 5995277.1332 7786.0208 0.9990 0.0023 0.0076
Schisandrol A 17.30 433.2250 0.0153 – 3.9063 1/X 3107568.1846 12478.8984 0.9960 0.0046 0.0153
Sibiricoses A5 10.33 517.1580 0.0153 - 3.9063 1/X 800365.3913 -9172.8189 0.9990 0.0046 0.0153
Swertisin 11.45 445.1200 0.0076 - 3.9063 None 1782135.5123 949.7725 0.9998 0.0023 0.0076
β-Amyrin 10.71 409.3800* 0.0153 – 0.4883 None 482048.0949 14866.2519 0.9945 0.0046 0.0153
α-Asarone 18.32 209.1130 0.0153 – 3.9063 1/X 3537199.5011 32358.3206 0.9979 0.0046 0.0153
+: [M+H - GlcGlc - H2O]+; *: [M+H-H2O]+

52
Table 5 Contents (µg/g) of the 18 analytical markers in the 3 samples (n = 3)
Chemical Markers
Content of each compound in 18 samples (μg/g)A
2014-005_1A 2014-005_1B Capsules
Z-Butylidenephthalide 0.00 ± 0.00 * 24.61 ± 0.34 28.36 ± 0.83
4,5 Dicaffeoylquinic acid 13.26 ± 5.43 15.67 ± 0.28 8.13 ± 0.00 †
Armepavine 0.00 ± 0.00 * 0.00 ± 0.00 * 0.00 ± 0.00 *
Batatisin III 0.00 ± 0.00 0.00 ± 0.00 0.00 ± 0.00
Cistanoside D 0.08 ± 0.01 6.82 ± 0.24 4.46 ± 0.11
Formononetin 16.38 ± 0.27 6.33 ± 0.09 6.28 ± 0.11
Forsythoside A 131.72 ± 3.49 107.53 ± 2.10 449.25 ± 9.84
GinsenosideRf 107.39 ± 2.44 47.03 ± 1.62 2.10 ± 0.00 †
Neoxanthin 0.00 ± 0.00 * 338.05 ± 14.15 88.56 ± 8.15
Ophiopogonanone A 0.00 ± 0.00 * 0.02 ± 0.01 * 0.03 ± 0.00 *
Pinusolide 0.00 ± 0.00 * 0.09 ± 0.10 * 0.06 ± 0.06 *
Polygonatine A N.D. N.D. N.D.
Poricoic Acid A 0.01± 0.00 6.58 ± 0.21 1.66 ± 0.12
Schisandrol A 8.40 ± 0.10 933.09 ± 21.85 † 575.77 ± 15.12
Sibiricoses A5 250.45 ± 4.81 251.91 ± 7.44 245.58 ± 12.96
Swertisin 3.77 ± 1.25 † 10.19 ± 0.81 18.83 ± 0.92
β-Amyrin 0.20 ± 0.00 2.32 ± 0.41 1.03 ± 0.38
α-Asarone 0.00 ± 0.00 * 168.99 ± 6.36 163.69 ± 1.96
A: Mean ± Std. Dev.; †: n < 3; *: below quantitation level; N.D: Not determined

53
Table 6 Statistical results of precision and accuracy of the 18 markers
Compound
Intra-day Inter-day
Accuracy (R.E., %) Precision (R.S.D., %) Accuracy (R.E., %) Precision (R.S.D., %)
Z-Butylidenephthalide 99.8 1 99.6 1.1
4,5 Dicaffeoylquinic acid 100.3 2.3 100.2 3.9
Armepavine 99.7 1 99.6 1.1
Batatisin III 100 0.8 100.1 1.5
Cistanoside D 100 2.6 100.2 3.7
Formononetin 99.8 0.4 100 0.5
Forsythoside A 100.1 0.8 100 1.2
GinsenosideRf 99.9 1.6 99.8 1.8
Neoxanthin 99.2 3.9 99.9 5.6
Ophiopogonanone A 100.2 1 100.2 1.1
Pinusolide 99.9 1.2 99.9 1.5
Polygonatine A N.D. N.D N.D. N.D.
Poricoic Acid A 101 3.5 100 3.8
Schisandrol A 100 0.7 99.8 0.9
Sibiricoses A5 99.9 0.8 100 1.2
Swertisin 100.2 0.7 100 1.2
β-Amyrin 99.9 1.4 99.9 1.8
α-Asarone 99.7 0.8 99.6 1
N.D: Not determined

54
3.4 Conclusion
In this work, we were able to quantify 17 markers that represent 17 plants in the different
YANG XIN® formulations for the first time. The YANG XIN® capsules and 2014-005_1B
formulation were similar to each other and different from 2014-005_1A formulation based on the
fact that both YANG XIN® capsule and 2014-005_1B formulations contain same analytical
markers. This method provides good linearity (r2> 0.9945), intraday precisions (R.S.D˂ 3.9%),
interday precisions (R.S.D< 5.6%), accuracy (99.2 - 101%), recovery (145.7%), limit of detection
(0.0011 – 0.0732 µg/mL), and limit of quantitation (0.0038 – 0.2441 µg/mL). The newly developed
method proved to be a good tool for the quality assessment of YANG XIN® formulations with
sensitivity and selectivity
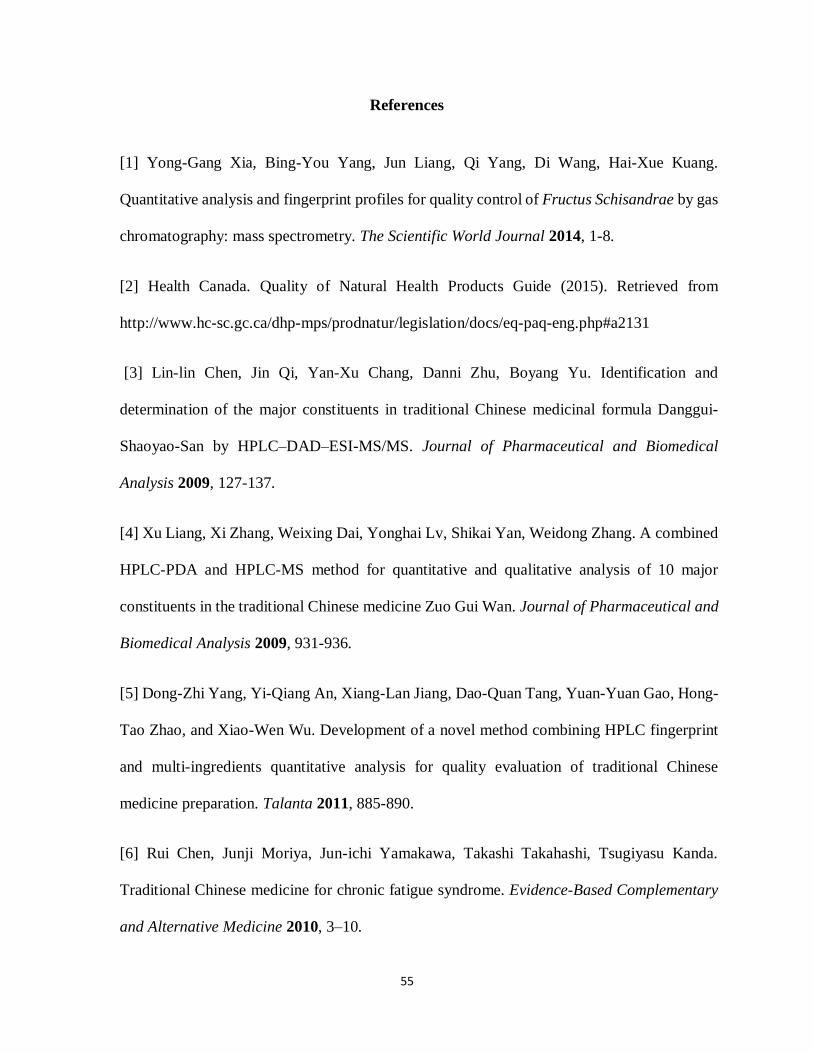
55
References
[1] Yong-Gang Xia, Bing-You Yang, Jun Liang, Qi Yang, Di Wang, Hai-Xue Kuang.
Quantitative analysis and fingerprint profiles for quality control of Fructus Schisandrae by gas
chromatography: mass spectrometry. The Scientific World Journal 2014, 1-8.
[2] Health Canada. Quality of Natural Health Products Guide (2015). Retrieved from
http://www.hc-sc.gc.ca/dhp-mps/prodnatur/legislation/docs/eq-paq-eng.php#a2131
[3] Lin-lin Chen, Jin Qi, Yan-Xu Chang, Danni Zhu, Boyang Yu. Identification and
determination of the major constituents in traditional Chinese medicinal formula Danggui-
Shaoyao-San by HPLC–DAD–ESI-MS/MS. Journal of Pharmaceutical and Biomedical
Analysis 2009, 127-137.
[4] Xu Liang, Xi Zhang, Weixing Dai, Yonghai Lv, Shikai Yan, Weidong Zhang. A combined
HPLC-PDA and HPLC-MS method for quantitative and qualitative analysis of 10 major
constituents in the traditional Chinese medicine Zuo Gui Wan. Journal of Pharmaceutical and
Biomedical Analysis 2009, 931-936.
[5] Dong-Zhi Yang, Yi-Qiang An, Xiang-Lan Jiang, Dao-Quan Tang, Yuan-Yuan Gao, Hong-
Tao Zhao, and Xiao-Wen Wu. Development of a novel method combining HPLC fingerprint
and multi-ingredients quantitative analysis for quality evaluation of traditional Chinese
medicine preparation. Talanta 2011, 885-890.
[6] Rui Chen, Junji Moriya, Jun-ichi Yamakawa, Takashi Takahashi, Tsugiyasu Kanda.
Traditional Chinese medicine for chronic fatigue syndrome. Evidence-Based Complementary
and Alternative Medicine 2010, 3–10.

56
[7] Han Chen, Yuan-Yuan Shi, Meng-Lin Wei, Wen-Yuan LIU, Feng Feng. Chemical profile
of the active fraction of Yi-Gan San by HPLC-DAD-Q-TOF-MS and its neuroprotective
Eeffect against glutamate-induced cytotoxicity. Chinese Journal of Natural Medicines 2014,
12, 869–880.
[8] YaNan Gai, Han Chen, ChunYong Wu, Feng Feng, YiXiang Wang, WenYuan Liu, SuiLou
Wang. Analysis of the traditional medicine YiGan San by the fragmentation patterns of
cadambine indole alkaloids using HPLC coupled with high-resolution MS. Journal of
Separation Science 2013, 36, 3723–3732.
[9] Chun-Feng Qiao, Quan-Bin Han, Jing-Zheng Song, Shi-Fu Mo, Ling-Dong Kong, Hsiang-
Fu Kung, Hong-Xi Xu. 2007. Chemical fingerprint and quantitative analysis of Fructus
Psoraleae by high-performance liquid chromatography. Journal of Separation Science 2007,
30, 813–818.
[10] Pavel Drašar, Jitka Moravcova. Recent advances in analysis of Chinese medical plants
and traditional medicines. Journal of Chromatography B 2004, 812, 3–21.
[11] Shi-Kai Yan, Wei-Dong Zhang, Run-Hui Liu, Yong-Cheng Zhan. Chemical
fingerprinting of Shexiang Baoxin pill and simultaneous determination of its major
constituents by HPLC with evaporative light scattering detection and electrospray mass
spectrometric detection. Chemical & Pharmaceutical Bulletin 2006, 54, 1058–1062.
[12] Haifeng Wu, Jian Guo, Shilin Chen, Xin Liu, Yan Zhou, Xiaopo Zhang, Xudong Xu.
Recent developments in qualitative and quantitative analysis of phytochemical constituents
and their metabolites using liquid chromatography–mass spectrometry. Journal of
Pharmaceutical and Biomedical Analysis 2013, 72, 267-291.

57
[13] Yan-hui Li, Shun-yuan Jiang, Yan-li Guan, Xin Liu, Yi Zhou, Li-Mei Li, Sheng-Xiong
Huang, Han-Dong Sun, Shu-Lin Peng, Yan Zhou. Quantitative determination of the chemical
profile of the plant material ‘Qiang-Huo’ by LC-ESI-MS-MS. Chromatographia 2006, 64,
405–411.
[14] Wei-Jun Kong, Yan-Ling Zhao, Xiao-He Xiao, Cheng Jin, Zu-Lun Li. Quantitative and
chemical fingerprint analysis for quality control of rhizoma Coptidischinensis based on UPLC-
PAD combined with chemometrics methods. Phytomedicine 2009, 16, 950–959.
[15] Min Cai, Yan Zhou, Suolang Gesang, Ciren Bianba, Li-Sheng Ding. Chemical fingerprint
analysis of rhizomes of Gymnadenia Conopsea by HPLC-DAD-MSn. Journal of
Chromatography B 2006, 844, 301–307.
[16] Helen Sheridan, Liselotte Krenn, Renwang Jiang, Ian Sutherland, Svetlana Ignatova,
Andreas Marmann, Xinmiao Liang, Jandirk Sendker. The potential of metabolic fingerprinting
as a tool for the modernisation of TCM preparations. Journal of Ethnopharmacology 2012,
140, 482–491.
[17] Yao-Haur Kuo, Wei-Jern Tsai, Soy-Hwee Loke, Tian-Shung Wu, Wen-Fei Chiou.
Astragalus membranaceus flavonoids (AMF) ameliorate chronic fatigue syndrome induced by
food intake restriction plus forced swimming. Journal of Ethnopharmacology 2009, 122, 28–
34.
[18] Nervous Fatigue TCM Conc. Nature's Sunshine (2015). Retrieved from
http://www.naturessunshine.com/us/product/nervous-fatigue-tcm-conc-30caps/1017/?Sponso
r =350900

58
[19] Harunobu Amagase, Norman Farnsworth. A review of botanical characteristics,
phytochemistry, clinical relevance in efficacy and safety of Lycium barbarum fruit (Goji).
Food Research International 2011, 44, 1702–1717.
[20] S. P. Li, J. Zhao, B. Yang. Strategies for quality control of Chinese medicines. Journal
of Pharmaceutical and Biomedical Analysis 2011, 55, 802–809.
[21] Ying Xie, Zhi-Hong Jiang, Hua Zhou, Xiong Cai, Yuen-Fan Wong, Zhong-Qiu Liu, Zhao-
Xiang Bian, Hong-Xi Xu, Liang Liu. Combinative method using HPLC quantitative and
qualitative analyses for quality consistency assessment of a herbal medicinal preparation.
Journal of Pharmaceutical and Biomedical Analysis 2007, 43, 204–212.
[22] Liang Wu, Haiping Hao, Guangji Wang. LC/MS based tools and strategies on qualitative
and quantitative analysis of herbal components in complex matrixes. Current Drug
Metabolism 2012, 13, 1251–1265.
[23] Jian-Liang Zhou, Lian-Wen Qi, Ping Li. Herbal medicine analysis by liquid
chromatography/time-of-flight mass spectrometry. Journal of Chromatography A 2009, 1216,
7582–7594.
[24] Yong Jiang, Bruno David, Pengfei Tu, Yves Barbin. Recent analytical approaches in
quality control of traditional Chinese medicines--a review. Analytica Chimica Acta 2010, 657,
9–18.
[25] Xin-miao Liang, Yu Jin, Yan-ping Wang, Gao-wa Jin, Qing Fu, Yuan-sheng Xiao.
Qualitative and quantitative analysis in quality control of traditional Chinese medicines.
Journal of Chromatography A 2009, 1216, 2033–2044.