LAZARD LTD REPORTS SECOND-QUARTER AND FIRST … · LAZARD LTD REPORTS SECOND-QUARTER AND FIRST-HALF...
19
1 LAZARD LTD REPORTS SECOND-QUARTER AND FIRST-HALF 2017 RESULTS Record quarterly and first-half operating revenue for both businesses Record assets under management (AUM) of $226 billion Returned $493 million of capital to shareholders in first half of year NEW YORK, July 27, 2017 – Lazard Ltd (NYSE: LAZ) today reported record quarterly operating revenue 1 of $720 million for the quarter ended June 30, 2017. Net income, as adjusted 1 and excluding pre-tax charges 2 , was $130 million, or $0.98 (diluted) per share for the quarter. Second- quarter 2017 net income on a U.S. GAAP basis was $120 million, or $0.91 per share (diluted). First-half net income, as adjusted 1,2 , was $240 million, or $1.81 per share (diluted). On a U.S. GAAP basis, first-half net income was $228 million, or $1.72 per share (diluted). “Lazard’s record operating revenue underscores the power of our model and the global breadth and depth of our franchise,” said Kenneth M. Jacobs, Chairman and Chief Executive Officer of Lazard. “We advised business and government leaders on a wide variety of strategic and financial matters around the world. Asset Management achieved a record level of AUM by providing diverse, sophisticated investment solutions for a global, primarily institutional client base.” ($ in millions, except per share data and AUM) Quarter Ended June 30, Six Months Ended June 30, 2017 2016 %’17-’16 2017 2016 %’17-’16 Net Income US GAAP $120 $80 50% $228 $147 55% Per share, diluted $0.91 $0.61 49% $1.72 $1.11 55% Adjusted 1,2 $130 $80 62% $240 $147 63% Per share, diluted $0.98 $0.61 61% $1.81 $1.11 63% Operating Revenue 1 Total operating revenue $720 $542 33% $1,345 $1,048 28% Financial Advisory $411 $287 43% $747 $553 35% Asset Management $307 $251 22% $585 $490 19% AUM ($ in billions) Period End $226 $192 18% Average $222 $193 15% $214 $189 14% Media Contact: Judi Frost Mackey +1 212 632 1428 [email protected] Investor Contact: Armand Sadoughi +1 212 632 6358 [email protected] Note: Endnotes are on page 7 of this release. A reconciliation of adjusted GAAP to U.S. GAAP is on page 18.
Transcript of LAZARD LTD REPORTS SECOND-QUARTER AND FIRST … · LAZARD LTD REPORTS SECOND-QUARTER AND FIRST-HALF...

1
LAZARD LTD REPORTS
SECOND-QUARTER AND FIRST-HALF 2017 RESULTS
Record quarterly and
first-half operating revenue
for both businesses
Record assets under
management (AUM)
of $226 billion
Returned $493 million of
capital to shareholders
in first half of year
NEW YORK, July 27, 2017 – Lazard Ltd (NYSE: LAZ) today reported record quarterly operating
revenue1 of $720 million for the quarter ended June 30, 2017. Net income, as adjusted1 and
excluding pre-tax charges2, was $130 million, or $0.98 (diluted) per share for the quarter. Second-
quarter 2017 net income on a U.S. GAAP basis was $120 million, or $0.91 per share (diluted).
First-half net income, as adjusted1,2, was $240 million, or $1.81 per share (diluted). On a U.S. GAAP
basis, first-half net income was $228 million, or $1.72 per share (diluted).
“Lazard’s record operating revenue underscores the power of our model and the global breadth
and depth of our franchise,” said Kenneth M. Jacobs, Chairman and Chief Executive Officer of
Lazard. “We advised business and government leaders on a wide variety of strategic and financial
matters around the world. Asset Management achieved a record level of AUM by providing diverse,
sophisticated investment solutions for a global, primarily institutional client base.”
($ in millions, except per share data and AUM)
Quarter Ended June 30,
Six Months Ended June 30,
2017 2016 %’17-’16 2017 2016 %’17-’16
Net Income
US GAAP $120 $80 50% $228 $147 55%
Per share, diluted $0.91 $0.61 49% $1.72 $1.11 55%
Adjusted1,2 $130 $80 62% $240 $147 63%
Per share, diluted $0.98 $0.61 61% $1.81 $1.11 63%
Operating Revenue1
Total operating revenue $720 $542 33% $1,345 $1,048 28%
Financial Advisory $411 $287 43% $747 $553 35%
Asset Management $307 $251 22% $585 $490 19%
AUM ($ in billions)
Period End $226 $192 18%
Average $222 $193 15% $214 $189 14%
Media Contact: Judi Frost Mackey +1 212 632 1428 [email protected] Investor Contact: Armand Sadoughi +1 212 632 6358 [email protected] Note: Endnotes are on page 7 of this release. A reconciliation of adjusted GAAP to U.S. GAAP is on page 18.

2
OPERATING REVENUE
Operating revenue1 was a quarterly record of $720 million for the second quarter of 2017, and a
first-half record of $1,345 million for the first half of 2017, up 33% and 28%, respectively, from the
2016 periods.
Financial Advisory
In the text portion of this press release, we present our Financial Advisory results as 1) M&A and
Strategic Advisory (M&A Advisory, Capital Advisory, Sovereign Advisory, Shareholder Advisory,
Capital Raising, and other advisory work for clients), and 2) Restructuring.
Second Quarter
Financial Advisory operating revenue was a quarterly record of $411 million for the second quarter
of 2017, 43% higher than the second quarter of 2016.
M&A and Strategic Advisory operating revenue was a second-quarter record of $323 million for the
second quarter of 2017, 50% higher than the second quarter of 2016.
During the second quarter of 2017, Lazard was engaged in highly visible, complex M&A
transactions and other advisory assignments, including cross-border transactions, spin-offs and
distressed asset sales, as well as sovereign, capital and shareholder advisory in the Americas,
Europe, Australia, Africa and Asia.
Among the major M&A transactions that were completed during the second quarter of 2017 were
the following (clients are in italics): Johnson & Johnson’s $30 billion acquisition of Actelion, with
spin-out of Idorsia, a new R&D company; Danone’s $12.5 billion acquisition of WhiteWave; United
Arab Shipping Company’s $12.5 billion combination with Hapag-Lloyd; and Alinta Holdings on the
sale of Alinta Energy to Chow Tai Fook Enterprises.
Transactions on which we continued to advise during or since the second quarter include: Dow
Chemical’s $130 billion merger of equals with DuPont; Reynolds American on the $49 billion
recommended offer from BAT for the remaining 57.8% of Reynolds; Great Plains Energy’s $14
billion merger of equals with Westar Energy; Safran’s €8.7 billion acquisition of Zodiac Aerospace;
and LVMH Moët Hennessy Louis Vuitton’s €6.5 billion acquisition of Christian Dior Couture.
Our Sovereign and Capital Advisory services remained active globally, advising governments and
corporations on balance sheet matters, financing strategy and capital raising.
Restructuring operating revenue was $88 million for the second quarter of 2017, 22% higher than
the second quarter of 2016. The increase primarily reflected the closing of several large
assignments. During or since the second quarter of 2017 we have been engaged in a broad range
of highly visible and complex restructuring and debt advisory assignments, including publicly
announced roles for: CGG, Gymboree, J.Crew, Nine West and Takata.

3
Please see M&A transactions on which Lazard advised in the second quarter, or continued to
advise or completed since June 30, 2017, as well as Capital Advisory, Sovereign Advisory and
Restructuring assignments, on pages 8 –11 of this release.
First Half
Financial Advisory operating revenue was a record $747 million for the first half of 2017, 35% higher
than the first half of 2016.
M&A and Strategic Advisory operating revenue was a record $571 million for the first half of 2017,
30% higher than the first half of 2016.
Restructuring operating revenue was $176 million for the first half of 2017, 53% higher than the
first half of 2016.
Asset Management
In the text portion of this press release, we present our Asset Management results as 1)
Management fees and other revenue, and 2) Incentive fees.
Second Quarter
Asset Management operating revenue was a quarterly record of $307 million for the second quarter
of 2017, 22% higher than the second quarter of 2016.
Management fees and other revenue were a quarterly record of $290 million for the second quarter
of 2017, 16% higher than the second quarter of 2016, and 7% higher than the first quarter of 2017.
Average assets under management (AUM) for the second quarter of 2017 was a record $222
billion, 15% higher than the second quarter of 2016, and 8% higher than the first quarter of 2017.
AUM as of June 30, 2017, was a record $226 billion, up 18% from June 30, 2016 and up 5% from
March 31, 2017. The sequential increase was primarily driven by market appreciation and foreign
exchange movement, partially offset by net outflows of $365 million.
Incentive fees were $17 million for the second quarter of 2017, compared to $1 million for the
second quarter of 2016.
First Half
Asset Management operating revenue was a record $585 million for the first half of 2017, 19%
higher than the first half of 2016.
Management fees and other revenue was a record $561 million for the first half of 2017, 15% higher
than the first half of 2016, primarily reflecting changes in average AUM. Average AUM for the first
half of 2017 was $214 billion, 14% higher than the first half of 2016. Net inflows were $2.9 billion
for the first half of 2017.
Incentive fees were $24 million for the first half of 2017, compared to $3 million for the first half of
2016.

4
OPERATING EXPENSES
Compensation and Benefits
In managing compensation and benefits expense, we focus on annual awarded compensation
(cash compensation and benefits plus deferred incentive compensation with respect to the
applicable year, net of estimated future forfeitures and excluding charges). We believe annual
awarded compensation reflects the actual annual compensation cost more accurately than the
GAAP measure of compensation cost, which includes applicable-year cash compensation and the
amortization of deferred incentive compensation principally attributable to previous years’ deferred
compensation. We believe that by managing our business using awarded compensation with a
consistent deferral policy, we can better manage our compensation costs, increase our flexibility in
the future and build shareholder value over time.
For the second quarter of 2017, we accrued compensation and benefits expense1 at an adjusted
compensation1 ratio of 56.5%. This resulted in $407 million of adjusted compensation and benefits
expense, compared to $306 million for the second quarter of 2016. The increase reflected higher
operating revenue.
For the first half of 2017, adjusted compensation and benefits expense1 was $760 million, compared
to $604 million for the first half of 2016, also reflecting higher operating revenue.
We manage our compensation and benefits expense based on awarded compensation with a
consistent deferral policy. Assuming that the performance of both of our businesses, our hiring
levels, and the compensation environment are similar to 2016, we expect our 2017 awarded
compensation ratio to be in line with the 2016 awarded compensation ratio.
We take a disciplined approach to compensation, and our goal is to maintain a compensation-to-
operating revenue ratio over the cycle in the mid- to high-50s percentage range on both an awarded
and adjusted basis, with consistent deferral policies.
Non-Compensation Expense
For the second quarter of 2017, adjusted non-compensation expense1 was $116 million, 4% higher
than the second quarter of 2016. The ratio of adjusted non-compensation expense to operating
revenue for the second quarter of 2017 was 16.1%, compared to 20.7% for the second quarter of
2016.
For the first half of 2017, adjusted non-compensation expense1 was $224 million, 5% higher than
the first half of 2016. The ratio of adjusted non-compensation expense to operating revenue for the
first half of 2017 was 16.6%, compared to 20.4% for the first half of 2016.
Our goal remains to achieve an adjusted non-compensation expense-to-operating revenue ratio
over the cycle of 16% to 20%.

5
TAXES
The provision for taxes, on an adjusted basis1,2, was $55 million for the second quarter of 2017 and
$95 million for the first half of 2017. The effective tax rate on the same basis was 29.6% for the
second quarter and 28.3% for the first half of 2017, compared to 28.4% and 28.8% for the
respective 2016 periods.
CAPITAL MANAGEMENT AND BALANCE SHEET
Our primary capital management goals include managing debt and returning capital to
shareholders through dividends and share repurchases.
For the second quarter of 2017, Lazard returned $133 million to shareholders, which included: $50
million in dividends; $79 million in share repurchases of our Class A common stock; and $4 million
in satisfaction of employee tax obligations in lieu of share issuances upon vesting of equity grants.
For the first half of 2017, Lazard returned $493 million to shareholders, which included: $242 million
in dividends; $185 million in share repurchases of our Class A common stock; and $66 million in
satisfaction of employee tax obligations in lieu of share issuances upon vesting of equity grants.
Year to date, we have repurchased 4.3 million shares at an average price of $43.32 per share. In
line with our objectives, these repurchases have more than offset the potential dilution from our
2016 year-end equity-based compensation awards (net of estimated forfeitures and tax withholding
to be paid in cash in lieu of share issuances), which were granted at an average price of $43.42
per share. As of today, our remaining share repurchase authorization is $170 million.
On July 26, 2017, Lazard declared a quarterly dividend of $0.41 per share on its outstanding
common stock. The dividend is payable on August 18, 2017, to stockholders of record on August
7, 2017.
Lazard’s financial position remains strong. As of June 30, 2017, our cash and cash equivalents
were $956 million, and stockholders’ equity related to Lazard’s interests was $1,243 million.
***
6
CONFERENCE CALL
Lazard will host a conference call at 8:00 a.m. EDT on July 27, 2017, to discuss the company’s
financial results for the second quarter and first half of 2017. The conference call can be accessed
via a live audio webcast available through Lazard’s Investor Relations website at www.lazard.com,
or by dialing 1 (888) 378-4439 (U.S. and Canada) or +1 (323) 701-0225 (outside of the U.S. and
Canada), 15 minutes prior to the start of the call.
A replay of the conference call will be available by 10:00 a.m. EDT on July 27, 2017, via the Lazard
Investor Relations website, or by dialing 1 (888) 203-1112 (U.S. and Canada) or +1 (719) 457-0820
(outside of the U.S. and Canada). The replay access code is 1761126.
ABOUT LAZARD
Lazard, one of the world's preeminent financial advisory and asset management firms, operates
from 43 cities across 27 countries in North America, Europe, Asia, Australia, Central and South
America. With origins dating to 1848, the firm provides advice on mergers and acquisitions,
strategic matters, restructuring and capital structure, capital raising and corporate finance, as well
as asset management services to corporations, partnerships, institutions, governments and
individuals. For more information on Lazard, please visit www.lazard.com. Follow Lazard at
@Lazard.
*** Cautionary Note Regarding Forward-Looking Statements:
This press release contains forward-looking statements. In some cases, you can identify these statements by forward-looking words such as “may”, “might”, “will”, “should”, “could”, “would”, “expect”, “plan”, “anticipate”, “believe”, “estimate”, “predict”, “potential”, “target,” “goal”, or “continue”, and the negative of these terms and other comparable terminology. These forward-looking statements, which are subject to known and unknown risks, uncertainties and assumptions about us, may include projections of our future financial performance based on our growth strategies, business plans and initiatives and anticipated trends in our business. These statements are only predictions based on our current expectations and projections about future events. There are important factors that could cause our actual results, level of activity, performance or achievements to differ materially from the results, level of activity, performance or achievements expressed or implied by these forward-looking statements. These factors include, but are not limited to, those discussed in our Annual Report on Form 10-K under Item 1A “Risk Factors,” and also discussed from time to time in our reports on Forms 10-Q and 8-K, including the following:
A decline in general economic conditions or the global or regional financial markets;
A decline in our revenues, for example due to a decline in overall mergers and acquisitions (M&A) activity, our share of the M&A market or our assets under management (AUM);
Losses caused by financial or other problems experienced by third parties;
Losses due to unidentified or unanticipated risks;
A lack of liquidity, i.e., ready access to funds, for use in our businesses; and
Competitive pressure on our businesses and on our ability to retain and attract employees at current compensation levels. Although we believe the expectations reflected in the forward-looking statements are reasonable, we cannot guarantee future results, level of activity, performance or achievements. Neither we nor any other person assumes responsibility for the accuracy or completeness of any of these forward-looking statements. You should not rely upon forward-looking statements as predictions of future events. We are under no duty to update any of these forward-looking statements after the date of this release to conform our prior statements to actual results or revised expectations and we do not intend to do so. Lazard Ltd is committed to providing timely and accurate information to the investing public, consistent with our legal and regulatory obligations. To that end, Lazard and its operating companies use their websites to convey information about their businesses, including the anticipated release of quarterly financial results, quarterly financial, statistical and business-related information, and the posting of updates of assets under management in various mutual funds, hedge funds and other investment products managed by Lazard Asset Management LLC and Lazard Frères Gestion SAS. Investors can link to Lazard and its operating company websites through www.lazard.com.
***

7
ENDNOTES
1 A non-U.S. GAAP measure. See attached financial schedules and related notes for a detailed explanation
of adjustments to corresponding U.S. GAAP results. We believe that presenting our results on an adjusted
basis, in addition to the U.S. GAAP results, is the most meaningful and useful way to compare our operating
results across periods.
2 Second-quarter and first-half 2017 results were affected primarily by the following charges:
Second-quarter 2017 adjusted results exclude pre-tax charges of (i) $8.9 million of costs
associated with the implementation of a new Enterprise Resource Planning (ERP) system, and
(ii) $3.2 million of office space reorganization costs primarily relating to incremental rent expense
and lease abandonment costs. On a U.S. GAAP basis, these items collectively resulted in a net
charge of $9.0 million, or $0.07 (diluted) per share, in the quarter.
First-half 2017 adjusted results also exclude post-tax charges of $3.1 million of acquisition-
related items, primarily reflecting changes in fair value of contingent consideration associated
with certain business acquisitions. On a U.S. GAAP basis, this resulted in a charge of $0.02
(diluted) per share in the first half of 2017.
LAZ-EPE
###
8
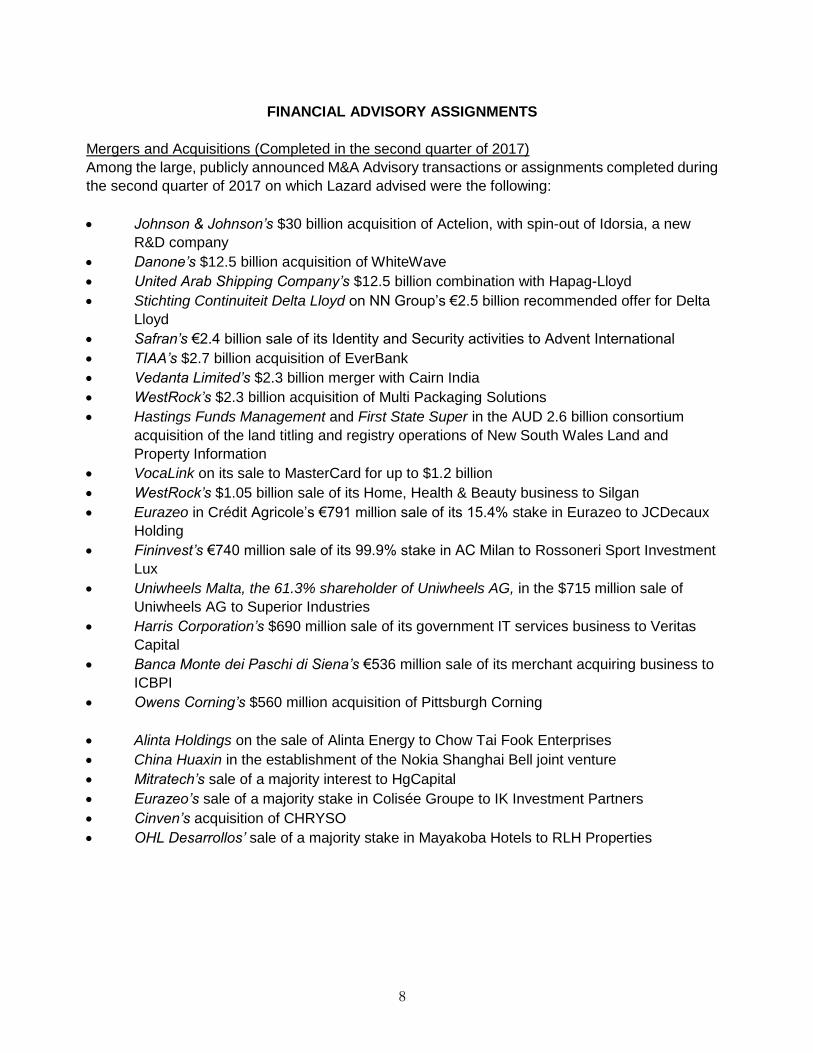
FINANCIAL ADVISORY ASSIGNMENTS
Mergers and Acquisitions (Completed in the second quarter of 2017)
Among the large, publicly announced M&A Advisory transactions or assignments completed during
the second quarter of 2017 on which Lazard advised were the following:
Johnson & Johnson’s $30 billion acquisition of Actelion, with spin-out of Idorsia, a new
R&D company
Danone’s $12.5 billion acquisition of WhiteWave
United Arab Shipping Company’s $12.5 billion combination with Hapag-Lloyd
Stichting Continuiteit Delta Lloyd on NN Group’s €2.5 billion recommended offer for Delta
Lloyd
Safran’s €2.4 billion sale of its Identity and Security activities to Advent International
TIAA’s $2.7 billion acquisition of EverBank
Vedanta Limited’s $2.3 billion merger with Cairn India
WestRock’s $2.3 billion acquisition of Multi Packaging Solutions
Hastings Funds Management and First State Super in the AUD 2.6 billion consortium
acquisition of the land titling and registry operations of New South Wales Land and
Property Information
VocaLink on its sale to MasterCard for up to $1.2 billion
WestRock’s $1.05 billion sale of its Home, Health & Beauty business to Silgan
Eurazeo in Crédit Agricole’s €791 million sale of its 15.4% stake in Eurazeo to JCDecaux
Holding
Fininvest’s €740 million sale of its 99.9% stake in AC Milan to Rossoneri Sport Investment
Lux
Uniwheels Malta, the 61.3% shareholder of Uniwheels AG, in the $715 million sale of
Uniwheels AG to Superior Industries
Harris Corporation’s $690 million sale of its government IT services business to Veritas
Capital
Banca Monte dei Paschi di Siena’s €536 million sale of its merchant acquiring business to
ICBPI
Owens Corning’s $560 million acquisition of Pittsburgh Corning
Alinta Holdings on the sale of Alinta Energy to Chow Tai Fook Enterprises
China Huaxin in the establishment of the Nokia Shanghai Bell joint venture
Mitratech’s sale of a majority interest to HgCapital
Eurazeo’s sale of a majority stake in Colisée Groupe to IK Investment Partners
Cinven’s acquisition of CHRYSO
OHL Desarrollos’ sale of a majority stake in Mayakoba Hotels to RLH Properties
9
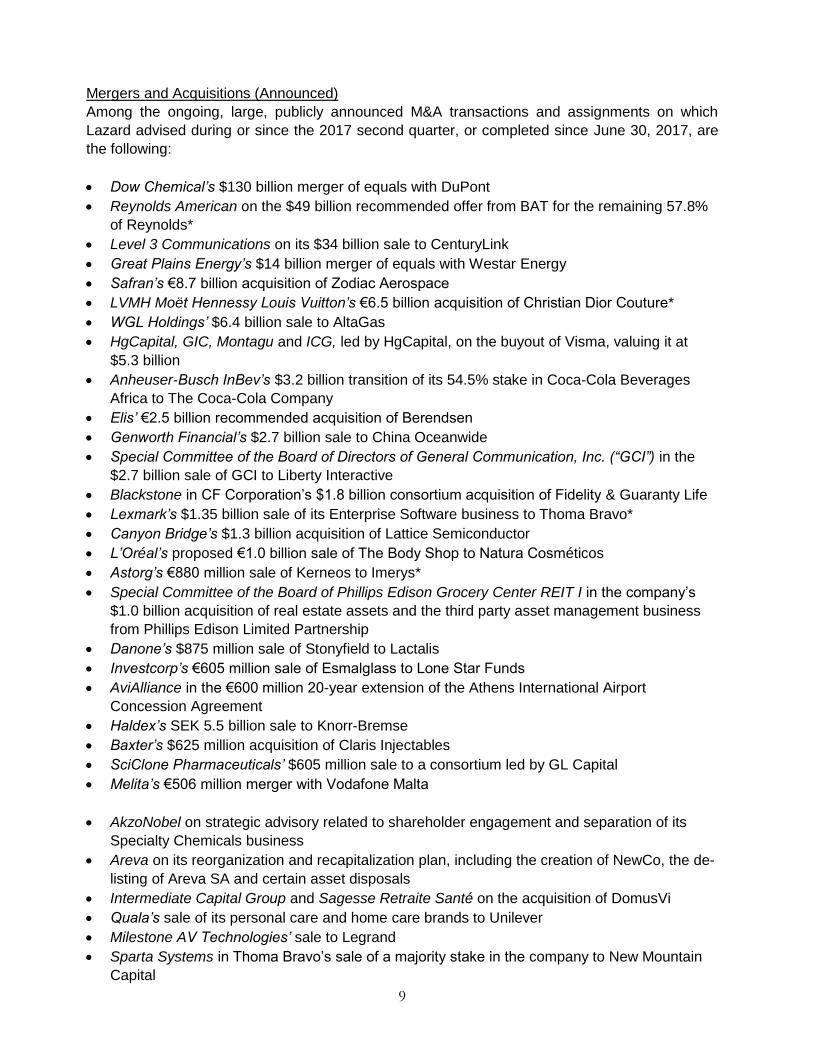
Mergers and Acquisitions (Announced)
Among the ongoing, large, publicly announced M&A transactions and assignments on which
Lazard advised during or since the 2017 second quarter, or completed since June 30, 2017, are
the following:
Dow Chemical’s $130 billion merger of equals with DuPont
Reynolds American on the $49 billion recommended offer from BAT for the remaining 57.8%
of Reynolds*
Level 3 Communications on its $34 billion sale to CenturyLink
Great Plains Energy’s $14 billion merger of equals with Westar Energy
Safran’s €8.7 billion acquisition of Zodiac Aerospace
LVMH Moët Hennessy Louis Vuitton’s €6.5 billion acquisition of Christian Dior Couture*
WGL Holdings’ $6.4 billion sale to AltaGas
HgCapital, GIC, Montagu and ICG, led by HgCapital, on the buyout of Visma, valuing it at
$5.3 billion
Anheuser-Busch InBev’s $3.2 billion transition of its 54.5% stake in Coca-Cola Beverages
Africa to The Coca-Cola Company
Elis’ €2.5 billion recommended acquisition of Berendsen
Genworth Financial’s $2.7 billion sale to China Oceanwide
Special Committee of the Board of Directors of General Communication, Inc. (“GCI”) in the
$2.7 billion sale of GCI to Liberty Interactive
Blackstone in CF Corporation’s $1.8 billion consortium acquisition of Fidelity & Guaranty Life
Lexmark’s $1.35 billion sale of its Enterprise Software business to Thoma Bravo*
Canyon Bridge’s $1.3 billion acquisition of Lattice Semiconductor
L’Oréal’s proposed €1.0 billion sale of The Body Shop to Natura Cosméticos
Astorg’s €880 million sale of Kerneos to Imerys*
Special Committee of the Board of Phillips Edison Grocery Center REIT I in the company’s
$1.0 billion acquisition of real estate assets and the third party asset management business
from Phillips Edison Limited Partnership
Danone’s $875 million sale of Stonyfield to Lactalis
Investcorp’s €605 million sale of Esmalglass to Lone Star Funds
AviAlliance in the €600 million 20-year extension of the Athens International Airport
Concession Agreement
Haldex’s SEK 5.5 billion sale to Knorr-Bremse
Baxter’s $625 million acquisition of Claris Injectables
SciClone Pharmaceuticals’ $605 million sale to a consortium led by GL Capital
Melita’s €506 million merger with Vodafone Malta
AkzoNobel on strategic advisory related to shareholder engagement and separation of its
Specialty Chemicals business
Areva on its reorganization and recapitalization plan, including the creation of NewCo, the de-
listing of Areva SA and certain asset disposals
Intermediate Capital Group and Sagesse Retraite Santé on the acquisition of DomusVi
Quala’s sale of its personal care and home care brands to Unilever
Milestone AV Technologies’ sale to Legrand
Sparta Systems in Thoma Bravo’s sale of a majority stake in the company to New Mountain
Capital

10
F2i’s purchase of a wind portfolio from Veronagest
Liberty Steel Limited on the proposed acquisition of Arrium Australia
*Transaction completed since June 30, 2017
Capital Advisory
Among the publicly announced Capital Advisory transactions or assignments on which Lazard
advised during or since the second quarter of 2017 were the following:
Banca Monte dei Paschi di Siena’s precautionary recapitalization through an €8.1 billion
capital increase and €5.5 billion disposal of a bad loan portfolio with a total GBV of €26 billion
SFPI-FPIM’s €2.0 billion of forward sale transactions representing a 2.5% stake in BNP
Paribas
Acek Desarollo y Géstion Industrial on the €877 million IPO of Gestamp Automocion
McDermott International’s $810 million credit facility
Hellenic Republic on the €557 million listing of ADMIE Holding
Clayton, Dubilier & Rice and SSA Investments on the £454 million secondary disposal of a
stake in B&M European Value Retail
Sovereign Advisory
Among the publicly announced Sovereign Advisory assignments on which Lazard advised during
or since the second quarter of 2017 were the following:
The State of Alaska
The International Bank of Azerbaijan
Southern Gas Corridor CJSC of Azerbaijan
Altiplano (Bolivia)
The Democratic Republic of the Congo
The Republic of the Congo
The Republic of Croatia
Compania Nacional de Telecomunicacion (The Republic of Ecuador)
Refineria del Pacifico (The Republic of Ecuador)
The Arab Republic of Egypt
The Federal Democratic Republic of Ethiopia
The Gabonese Republic
Sotrader (joint venture between the government of Gabon and Olam International)
The Hellenic Republic
The Hashemite Kingdom of Jordan
airBaltic (majority owned by the government of Latvia)
SNIM (The Islamic Republic of Mauritania)
The Republic of Mozambique
The Republic of Serbia
Ukraine and certain sub-sovereign entities
The Republic of Zimbabwe
11
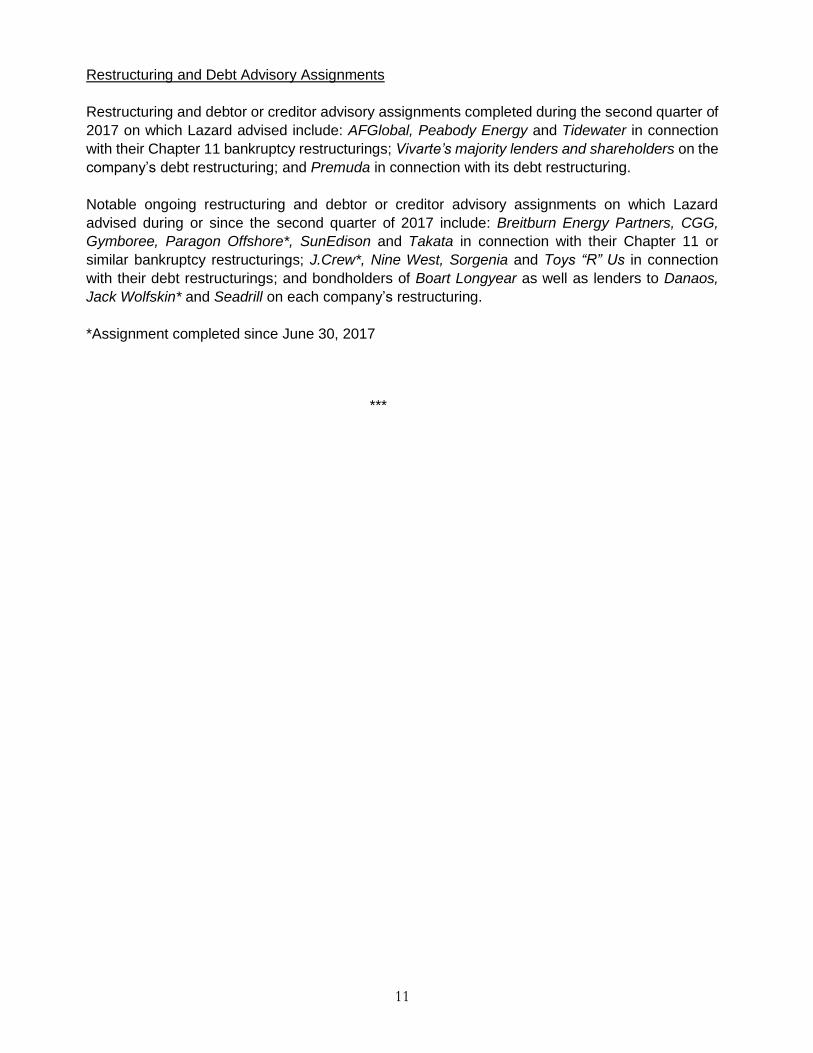
Restructuring and Debt Advisory Assignments
Restructuring and debtor or creditor advisory assignments completed during the second quarter of
2017 on which Lazard advised include: AFGlobal, Peabody Energy and Tidewater in connection
with their Chapter 11 bankruptcy restructurings; Vivarte’s majority lenders and shareholders on the
company’s debt restructuring; and Premuda in connection with its debt restructuring.
Notable ongoing restructuring and debtor or creditor advisory assignments on which Lazard
advised during or since the second quarter of 2017 include: Breitburn Energy Partners, CGG,
Gymboree, Paragon Offshore*, SunEdison and Takata in connection with their Chapter 11 or
similar bankruptcy restructurings; J.Crew*, Nine West, Sorgenia and Toys “R” Us in connection
with their debt restructurings; and bondholders of Boart Longyear as well as lenders to Danaos,
Jack Wolfskin* and Seadrill on each company’s restructuring.
*Assignment completed since June 30, 2017
***

12
June 30, March 31, June 30, March 31, June 30,
($ in thousands, except per share data) 2017 2017 2016 2017 2016
Total revenue $729,946 $637,420 $546,642 15% 34%
Interest expense ($12,766) (13,956) (11,962)
Net revenue 717,180 623,464 534,680 15% 34%
Operating expenses:
Compensation and benefits 414,612 361,801 308,310 15% 34%
Occupancy and equipment 30,828 27,484 27,163
Marketing and business development 24,027 19,752 23,877
Technology and information services 32,032 24,024 24,296
Professional services 11,234 11,462 11,245
Fund administration and outsourced services 18,338 15,913 15,895
Amortization and other acquisition-related costs 1,257 3,574 330
Other 12,351 9,257 10,328
Subtotal 130,067 111,466 113,134 17% 15%
Operating expenses 544,679 473,267 421,444 15% 29%
Operating income 172,501 150,197 113,236 15% 52%
Provision for income taxes 51,600 39,767 31,872 30% 62%
Net income 120,901 110,430 81,364 9% 49%
Net income attributable to noncontrolling interests 523 2,877 1,007
Net income attributable to Lazard Ltd $120,378 $107,553 $80,357 12% 50%
Attributable to Lazard Ltd Common Stockholders:
Weighted average shares outstanding:
Basic 122,368,150 122,815,163 125,461,948 (0%) (2%)
Diluted 132,139,616 132,689,375 132,341,522 (0%) (0%)
Net income per share:
Basic $0.98 $0.88 $0.64 11% 53%
Diluted $0.91 $0.81 $0.61 12% 49%
LAZARD LTD
UNAUDITED CONDENSED CONSOLIDATED STATEMENT OF OPERATIONS
(U.S. GAAP)
Three Months Ended % Change From

13
LAZARD LTD
UNAUDITED CONDENSED CONSOLIDATED STATEMENT OF OPERATIONS
June 30, June 30,
($ in thousands, except per share data) 2017 2016 % Change
Total revenue $1,367,366 $1,056,758 29%
Interest expense (26,722) (23,860)
Net revenue 1,340,644 1,032,898 30%
Operating expenses:
Compensation and benefits 776,413 605,520 28%
Occupancy and equipment 58,312 54,170
Marketing and business development 43,779 43,565
Technology and information services 56,056 47,227
Professional services 22,696 21,007
Fund administration and outsourced services 34,251 29,330
Amortization and other acquisition-related costs 4,831 974
Other 21,608 19,492
Subtotal 241,533 215,765 12%
Operating expenses 1,017,946 821,285 24%
Operating income 322,698 211,613 52%
Provision for income taxes 91,367 59,526 53%
Net income 231,331 152,087 52%
Net income attributable to noncontrolling interests 3,400 4,907
Net income attributable to Lazard Ltd $227,931 $147,180 55%
Attributable to Lazard Ltd Common Stockholders:
Weighted average shares outstanding:
Basic 122,591,656 125,751,195 (3%)
Diluted 132,414,496 132,616,403 (0%)
Net income per share:
Basic $1.86 $1.17 59%
Diluted $1.72 $1.11 55%
(U.S. GAAP)
Six Months Ended

14
LAZARD LTD
UNAUDITED CONDENSED CONSOLIDATED
STATEMENT OF FINANCIAL CONDITION
June 30, December 31,
($ in thousands) 2017 2016
Cash and cash equivalents $955,639 $1,158,785
Deposits with banks and short-term investments 756,507 419,668
Cash deposited with clearing organizations and other segregated cash 34,480 29,030
Receivables 654,739 638,282
Investments 421,727 459,422
Goodwill and other intangible assets 389,216 382,024
Deferred tax assets 1,113,528 1,075,777
Other assets 443,926 393,520
Total Assets $4,769,762 $4,556,508
Liabilities
Deposits and other customer payables $829,993 $472,283
Accrued compensation and benefits 378,279 541,588
Senior debt 1,189,489 1,188,600
Tax receivable agreement obligation 512,834 513,610
Other liabilities 556,454 546,614
Total liabilities 3,467,049 3,262,695
Commitments and contingencies
Stockholders' equity
Preferred stock, par value $.01 per share - -
Common stock, par value $.01 per share 1,298 1,298
Additional paid-in capital 673,242 688,231
Retained earnings 1,166,026 1,134,186
Accumulated other comprehensive loss, net of tax (277,785) (314,222)
Subtotal 1,562,781 1,509,493
Class A common stock held by subsidiaries, at cost (319,755) (273,506)
Total Lazard Ltd stockholders' equity 1,243,026 1,235,987
Noncontrolling interests 59,687 57,826
Total stockholders' equity 1,302,713 1,293,813
Total liabilities and stockholders' equity $4,769,762 $4,556,508
(U.S. GAAP)
ASSETS
LIABILITIES & STOCKHOLDERS' EQUITY

15
LAZARD LTD
SELECTED SUMMARY FINANCIAL INFORMATION (a)
(Non-GAAP - unaudited)
June 30, March 31, June 30, March 31, June 30,
($ in thousands, except per share data) 2017 2017 2016 2017 2016
Revenues:
Financial Advisory $410,882 $335,812 $286,967 22% 43%
Asset Management 306,796 278,428 250,730 10% 22%
Corporate 2,483 10,194 4,610 (76%) (46%)
Operating revenue (b) $720,161 $624,434 $542,307 15% 33%
Expenses:
Compensation and benefits expense (c) $406,891 $352,805 $306,404 15% 33%
Ratio of compensation to operating revenue 56.5% 56.5% 56.5%
Non-compensation expense (d) $116,111 $107,470 $112,167 8% 4%
Ratio of non-compensation to operating revenue 16.1% 17.2% 20.7%
Earnings:
Earnings from operations (e) $197,159 $164,159 $123,736 20% 59%
Operating margin (f) 27.4% 26.3% 22.8%
Net income (g) $129,840 $110,141 $80,357 18% 62%
Diluted net income per share $0.98 $0.83 $0.61 18% 61%
Diluted weighted average shares 132,139,616 132,689,375 132,341,522 (0%) (0%)
Effective tax rate (h) 29.6% 26.6% 28.4%
Three Months Ended % Change From
This presentation includes non-U.S. GAAP ("non-GAAP") measures. Our non-GAAP measures are not meant to be considered in isolation or as a
substitute for the corresponding U.S. GAAP measures, and should be read only in conjunction with our consolidated financial statements prepared in
accordance with U.S. GAAP. For a detailed explanation of the adjustments made to the corresponding U.S. GAAP measures, see Reconciliation of U.S.
GAAP to Selected Summary Financial Information and Notes to Financial Schedules.

16
LAZARD LTD
SELECTED SUMMARY FINANCIAL INFORMATION (a)
(Non-GAAP - unaudited)
Six Months Ended June 30,
($ in thousands, except per share data) 2017 2016 % Change
Revenues:
Financial Advisory 746,694 552,981 35%
Asset Management 585,224 490,280 19%
Corporate 12,677 5,112 NM
Operating revenue (b) $1,344,595 $1,048,373 28%
Expenses:
Compensation and benefits expense (c) $759,696 $604,376 26%
Ratio of compensation to operating revenue 56.5% 57.6%
Non-compensation expense (d) $223,581 $213,756 5%
Ratio of non-compensation to operating revenue 16.6% 20.4%
Earnings:
Earnings from operations (e) $361,318 $230,241 57%
Operating margin (f) 26.9% 22.0%
Net income (g) $239,981 $147,180 63%
Diluted net income per share $1.81 $1.11 63%
Diluted weighted average shares 132,414,496 132,616,403 (0%)
Effective tax rate (h) 28.3% 28.8%
This presentation includes non-U.S. GAAP ("non-GAAP") measures. Our non-GAAP measures are not
meant to be considered in isolation or as a substitute for the corresponding U.S. GAAP measures, and
should be read only in conjunction with our consolidated financial statements prepared in accordance
with U.S. GAAP. For a detailed explanation of the adjustments made to the corresponding U.S. GAAP
measures, see Reconciliation of U.S. GAAP to Selected Summary Financial Information and Notes to
Financial Schedules.

17
LAZARD LTD
ASSETS UNDER MANAGEMENT ("AUM")
As of Variance
June 30, March 31, December 31,2017 2017 2016 Qtr to Qtr YTD
Equity:
Emerging Markets $48,115 $46,563 $41,363 3.3% 16.3%
Global 37,012 34,520 30,567 7.2% 21.1%
Local 39,034 38,390 36,243 1.7% 7.7%
Multi-Regional 63,930 59,506 54,668 7.4% 16.9%
Total Equity 188,091 178,979 162,841 5.1% 15.5%
Fixed Income:
Emerging Markets 16,330 16,539 15,580 (1.3%) 4.8%
Global 3,860 3,646 3,483 5.9% 10.8%
Local 4,391 4,299 4,245 2.1% 3.4%
Multi-Regional 8,584 7,734 7,847 11.0% 9.4%
Total Fixed Income 33,165 32,218 31,155 2.9% 6.5%
Alternative Investments 2,621 2,420 2,422 8.3% 8.2%
Private Equity 1,447 1,285 1,253 12.6% 15.5%
Cash Management 437 276 239 58.3% 82.8%
Total AUM $225,761 $215,178 $197,910 4.9% 14.1%
Three Months Ended June 30, Six Months Ended June 30,
2017 2016 2017 2016
AUM - Beginning of Period $215,178 $190,554 $197,910 $186,380
Net Flows (365) 453 2,938 92
Market and foreign exchange
appreciation (depreciation) 10,948 858 24,913 5,393
AUM - End of Period $225,761 $191,865 $225,761 $191,865
Average AUM $222,208 $192,634 $214,495 $188,836
% Change in average AUM 15.4% 13.6%
(unaudited)
($ in millions)
Note: Average AUM generally represents the average of the monthly ending AUM balances for the period.

18
June 30, March 31, June 30, June 30, June 30,
($ in thousands, except per share data) 2017 2017 2016 2017 2016
Net revenue - U.S. GAAP Basis $717,180 $623,464 $534,680 $1,340,644 $1,032,898
Adjustments:
Revenue related to noncontrolling interests (i) (3,098) (4,942) (3,398) (8,040) (9,610)
(Gains) losses related to Lazard Fund Interests ("LFI") and other similar arrangements (5,753) (7,353) (312) (13,106) 2,202
Interest expense 11,832 13,265 11,337 25,097 22,883
Operating revenue, as adjusted (b) $720,161 $624,434 $542,307 $1,344,595 $1,048,373
Compensation & benefits expense - U.S. GAAP Basis $414,612 $361,801 $308,310 $776,413 $605,520
Adjustments:
(Charges) credits pertaining to LFI and other similar arrangements (5,753) (7,353) (312) (13,106) 2,202
Compensation related to noncontrolling interests (i) (1,968) (1,643) (1,594) (3,611) (3,346)
Compensation & benefits expense, as adjusted (c) $406,891 $352,805 $306,404 $759,696 $604,376
Non-compensation expense - Subtotal - U.S. GAAP Basis $130,067 $111,466 $113,134 $241,533 $215,765
Adjustments:
Expenses associated with ERP system implementation (j) (8,861) - - (8,861) -
Expenses related to office space reorganization (k) (3,161) - - (3,161) -
Amortization and other acquisition-related costs (l) (1,257) (3,574) (330) (4,831) (974)
Non-compensation expense related to noncontrolling interests (i) (677) (422) (637) (1,099) (1,035)
Non-compensation expense, as adjusted (d) $116,111 $107,470 $112,167 $223,581 $213,756
Operating Income (loss) - U.S. GAAP Basis $172,501 $150,197 $113,236 $322,698 $211,613
Adjustments:
Expenses associated with ERP system implementation (j) 8,861 - - 8,861 -
Expenses related to office space reorganization (k) 3,161 - - 3,161 -
Acquisition-related costs (l) 435 2,745 - 3,180 -
Net income related to noncontrolling interests (i) (454) (2,877) (1,007) (3,331) (4,907)
Pre-tax income, as adjusted 184,504 150,065 112,229 334,569 206,706
Interest expense 11,832 13,265 11,337 25,097 22,883
Amortization (LAZ only) 823 829 170 1,652 652
Earnings from operations, as adjusted (e) $197,159 $164,159 $123,736 $361,318 $230,241
Net income attributable to Lazard Ltd - U.S. GAAP Basis $120,378 $107,553 $80,357 $227,931 $147,180
Adjustments:
Expenses associated with ERP system implementation (j) 8,861 - - 8,861 -
Expenses related to office space reorganization (k) 3,161 - - 3,161 -
Acquisition-related costs (l) 435 2,745 - 3,180 -
Tax benefit allocated to adjustments (2,995) (157) - (3,152) -
Net income, as adjusted (g) $129,840 $110,141 $80,357 $239,981 $147,180
Diluted net income per share:
U.S. GAAP Basis $0.91 $0.81 $0.61 $1.72 $1.11
Non-GAAP Basis, as adjusted $0.98 $0.83 $0.61 $1.81 $1.11
LAZARD LTD
RECONCILIATION OF U.S. GAAP TO SELECTED SUMMARY FINANCIAL INFORMATION (a)
(unaudited)
Three Months Ended Six Months Ended
This presentation includes non-U.S. GAAP ("non-GAAP") measures. Our non-GAAP measures are not meant to be considered in isolation or as a substitute for comparable U.S. GAAP
measures, and should be read only in conjunction with our consolidated financial statements prepared in accordance with U.S. GAAP. For a detailed explanation of the adjustments
made to comparable U.S. GAAP measures, see Notes to Financial Schedules.
Operating Revenue
Compensation & Benefits Expense
Non-Compensation Expense
Pre-Tax Income and Earnings From Operations
Net Income attributable to Lazard Ltd

19
(a)
(b)
(c)
(d)
(e)
(f)
(g)
(h)
(i)
(j)
(k)
(l)
NM
LAZARD LTD
Notes to Financial Schedules
Selected Summary Financial Information are non-U.S. GAAP ("non-GAAP") measures. Lazard believes that presenting results and measures on
an adjusted basis in conjunction with U.S. GAAP measures provides the most meaningful basis for comparison of its operating results across
periods.
A non-GAAP measure which excludes (i) revenue related to non-controlling interests (see (i) below), (ii) (gains)/losses related to the changes in
the fair value of investments held in connection with Lazard Fund Interests and other similar deferred compensation arrangements for which a
corresponding equal amount is excluded from compensation & benefits expense, and (iii) interest expense primarily related to corporate financing
activities.
A non-GAAP measure which excludes (i) (charges)/credits related to the changes in the fair value of the compensation liability recorded in
connection with Lazard Fund Interests and other similar deferred compensation arrangements, and (ii) compensation and benefits related to
noncontrolling interests (see (i) below).
A non-GAAP measure which excludes (i) for the three and six month periods ended June 30, 2017, expenses associated with ERP system
implementation (see (j) below), (ii) for the three and six month periods ended June 30, 2017, expenses related to office space reorganization (see
(k) below), (iii) amortization and other acquisition-related costs (see (l) below), and (iv) expenses related to noncontrolling interests (see (i) below).
A non-GAAP measure which excludes (i) for the three and six month periods ended June 30, 2017, expenses associated with ERP system
implementation (see (j) below), (ii) for the three and six month periods ended June 30, 2017, expenses related to office space reorganization (see
(k) below), (iii) amortization and other acquisition-related costs, (iv) revenue and expenses related to noncontrolling interests (see (i) below), and
(v) interest expense primarily related to corporate financing activities.
Represents earnings from operations as a percentage of operating revenue, and is a non-GAAP measure.
A non-GAAP measure which excludes (i) for the three and six month periods ended June 30, 2017, expenses associated with ERP system
implementation, net of tax benefits (see (j) below), (ii) for the three and six month periods ended June 30, 2017, expenses related to office space
reorganization, net of tax benefits (see (k) below), and (iii) for the three and six month periods ended June 30, 2017 and for the three month
period ended March 31, 2017, amortization and other acquisition-related costs, net of tax benefits (see (l) below).
Effective tax rate is a non-GAAP measure based upon the U.S. GAAP rate with adjustments for the tax applicable to the non-GAAP adjustments
to operating income, generally based upon the effective marginal tax rate in the applicable jurisdiction of the adjustments. The computation is
based on a quotient, the numerator of which is the provision for income taxes of $54,664, $39,924, and $31,872 for the three month periods
ended June 30, 2017, March 31, 2017, and June 30, 2016, respectively, $94,588 and $59,526 for the six month periods ended June 30, 2017 and
2016, respectively, and the denominator of which is pre-tax income of $184,504, $150,065, and $112,229 for the three month periods ended June
30, 2017, March 31, 2017, and June 30, 2016, respectively, $334,569 and $206,706 for the six month periods ended June 30, 2017 and 2016
respectively.
Noncontrolling interests include revenue and expenses principally related to Edgewater, and is a non-GAAP measure.
Represents expenses associated with Enterprise Resource Planning (ERP) system implementation.
Represents incremental rent expense and lease abandonment costs related to office space reorganization.
Represents the change in fair value of the contingent consideration associated with certain business acquisitions.
Not meaningful