Layer-by-Layer Assembly of Electroactive Dye/L.D.H.s ...
16
Lajevardi Esfahani et al. Nanoscale Res Lett (2020) 15:210 https://doi.org/10.1186/s11671-020-03442-6 NANO COMMENTARY Layer-by-Layer Assembly of Electroactive Dye/LDHs Nanoplatelet Matrix Film for Advanced Dual Electro-optical Sensing Applications Sepehr Lajevardi Esfahani 1 , Shohre Rouhani 1,3* and Zahra Ranjbar 2,3 Abstract It proved that the most destructive effects of the toxic Al 3+ ion on the human nervous system and disease that are involved with this system, such as Alzheimer’s. The development of solid-state electrodes is still in its infancy during the sensor-based detection methods for Al 3+ . Hence, in this study, a novel flexible ITO/PET-based electrochemical solid-state sensor was designed and constructed. Modification of the surface of electrode bedding was done by layer-by-layer (LbL) assembly of Mg–Al LDH. nanoplatelets along with alizarin red S (ARS) in an interconnected matrix film. In the molecular design of sensing base of the electrode, the electroactive organic units (ARS molecules) present in the ITO/PET-layered (ARS/LDHs) n matrix are involved in electrochemical reactions when exposed to the target molecule (Al 3+ ion), so the electrochemical changes of the new formed Al-chelated system are detectable. This type of sensor is used for sensitive and selective detection of Al 3+ . The minimum sheet resistance, morphology and high electrocatalytic activity of the modified matrix film are obtained in the fifth cycle of LbL assembly technique. In this electrochemical sensor, both electrochemical and optical methods were detected with high sensitivity and selectiv- ity of Al 3+ , so that in a cyclic voltammetry electrochemical method, the lower detection limit of 10.1 nM with a linear range of [0.2–120 μM] was obtained compared to the fluorescence-based optical method. Keywords: Solid-state sensor, Layer-by-layer (LbL), Electrochemical sensor, Optical sensor, LDHs, Alizarin reds © The Author(s) 2020. Open Access This article is licensed under a Creative Commons Attribution 4.0 International License, which permits use, sharing, adaptation, distribution and reproduction in any medium or format, as long as you give appropriate credit to the original author(s) and the source, provide a link to the Creative Commons licence, and indicate if changes were made. The images or other third party material in this article are included in the article’s Creative Commons licence, unless indicated otherwise in a credit line to the material. If material is not included in the article’s Creative Commons licence and your intended use is not permitted by statutory regulation or exceeds the permitted use, you will need to obtain permission directly from the copyright holder. To view a copy of this licence, visit http://creativecommons.org/licenses/by/4.0/. Introduction Layered double hydroxides (LDHs) are two-dimensional compounds of the general type of anion clay that are widely used in optical, biological and electronic appli- cations [1–4]. e chemical structure of LDHs is intro- duced as [M II 1−x M III x (OH) 2 ] − (A n− ) x/n . mH 2 O (M II and M III are divalent and trivalent metals, respectively, and A n− is an inter-layered anion) [1]. Due to the two- dimensional structure, the flexibility and ionic exchange of LDHs, with the help of a new layer-by-layer (LbL) assembly method, combine this combination with a suitable organic molecule in a regular-layered arrange- ment with each other and form organic/inorganic com- pounds that have been extensively used in various fields of science [5–7]. One of these species as a guest molecule in this arrangement is the electroactive molecule, which results in accelerating the direct electron transfer pro- cess between the species involved in the electrochemi- cal reaction and the initial electrode bedding [8, 9]. e use of LDHs nanoplatelets and structural reforms on their surface has found widespread use in the develop- ment of electronic and optoelectronic devices [10]. Some of the essential researches in this field are the following: Chen and colleagues [11], using a new and straightfor- ward method, with single-stage Ni–Co LDHs hybrid film growth using ultrathin and porous nanosheets, could Open Access *Correspondence: [email protected] 1 Organic Colorants Department, Institute for Color Science and Technology (ICST), Tehran, Iran Full list of author information is available at the end of the article
Transcript of Layer-by-Layer Assembly of Electroactive Dye/L.D.H.s ...

Lajevardi Esfahani et al. Nanoscale Res Lett (2020) 15:210 https://doi.org/10.1186/s11671-020-03442-6
NANO COMMENTARY
Layer-by-Layer Assembly of Electroactive Dye/LDHs Nanoplatelet Matrix Film for Advanced Dual Electro-optical Sensing ApplicationsSepehr Lajevardi Esfahani1, Shohre Rouhani1,3* and Zahra Ranjbar2,3
Abstract
It proved that the most destructive effects of the toxic Al3+ ion on the human nervous system and disease that are involved with this system, such as Alzheimer’s. The development of solid-state electrodes is still in its infancy during the sensor-based detection methods for Al3+. Hence, in this study, a novel flexible ITO/PET-based electrochemical solid-state sensor was designed and constructed. Modification of the surface of electrode bedding was done by layer-by-layer (LbL) assembly of Mg–Al LDH. nanoplatelets along with alizarin red S (ARS) in an interconnected matrix film. In the molecular design of sensing base of the electrode, the electroactive organic units (ARS molecules) present in the ITO/PET-layered (ARS/LDHs)n matrix are involved in electrochemical reactions when exposed to the target molecule (Al3+ ion), so the electrochemical changes of the new formed Al-chelated system are detectable. This type of sensor is used for sensitive and selective detection of Al3+. The minimum sheet resistance, morphology and high electrocatalytic activity of the modified matrix film are obtained in the fifth cycle of LbL assembly technique. In this electrochemical sensor, both electrochemical and optical methods were detected with high sensitivity and selectiv-ity of Al3+, so that in a cyclic voltammetry electrochemical method, the lower detection limit of 10.1 nM with a linear range of [0.2–120 μM] was obtained compared to the fluorescence-based optical method.
Keywords: Solid-state sensor, Layer-by-layer (LbL), Electrochemical sensor, Optical sensor, LDHs, Alizarin reds
© The Author(s) 2020. Open Access This article is licensed under a Creative Commons Attribution 4.0 International License, which permits use, sharing, adaptation, distribution and reproduction in any medium or format, as long as you give appropriate credit to the original author(s) and the source, provide a link to the Creative Commons licence, and indicate if changes were made. The images or other third party material in this article are included in the article’s Creative Commons licence, unless indicated otherwise in a credit line to the material. If material is not included in the article’s Creative Commons licence and your intended use is not permitted by statutory regulation or exceeds the permitted use, you will need to obtain permission directly from the copyright holder. To view a copy of this licence, visit http://creat iveco mmons .org/licen ses/by/4.0/.
IntroductionLayered double hydroxides (LDHs) are two-dimensional compounds of the general type of anion clay that are widely used in optical, biological and electronic appli-cations [1–4]. The chemical structure of LDHs is intro-duced as [MII
1−xMIIIx(OH)2]−(An−)x/n. mH2O (MII and
MIII are divalent and trivalent metals, respectively, and An− is an inter-layered anion) [1]. Due to the two-dimensional structure, the flexibility and ionic exchange of LDHs, with the help of a new layer-by-layer (LbL) assembly method, combine this combination with a
suitable organic molecule in a regular-layered arrange-ment with each other and form organic/inorganic com-pounds that have been extensively used in various fields of science [5–7]. One of these species as a guest molecule in this arrangement is the electroactive molecule, which results in accelerating the direct electron transfer pro-cess between the species involved in the electrochemi-cal reaction and the initial electrode bedding [8, 9]. The use of LDHs nanoplatelets and structural reforms on their surface has found widespread use in the develop-ment of electronic and optoelectronic devices [10]. Some of the essential researches in this field are the following: Chen and colleagues [11], using a new and straightfor-ward method, with single-stage Ni–Co LDHs hybrid film growth using ultrathin and porous nanosheets, could
Open Access
*Correspondence: [email protected] Organic Colorants Department, Institute for Color Science and Technology (ICST), Tehran, IranFull list of author information is available at the end of the article

Page 2 of 16Lajevardi Esfahani et al. Nanoscale Res Lett (2020) 15:210
significantly increase the specific capacitance of the elec-trode based on this hybrid film, which compared to other similar electrode based on Ni-Co oxide/hydroxide was strongly enhanced. Li et al. [12] succeeded in interca-lating of two kinds of anions with different molar ratios to the Mg–Al LDHs network and thereby obtain blue luminescent hybrid materials. Tian et al. [13] localized gold nanoclusters (Au NCs) inside the two-dimensional LDHs grid with layer-by-layer assembly to improve the fluorescence and efficient method to fabricate Au NCs-based films. Layered by layered assembly organization was considered a primary new method for fabricating fluorescence sensors with high fluorescence efficiency. Therefore, the precise molecular and structural design of the electrode base in an electrochemical device using advanced materials false detection and display of highly elegant electrochemical and optical changes within the designed network can significantly enhance the efficiency and sensitivity of the equipment.
Transparent electrodes have recently attracted more attention due to the critical components for optoelec-tronic devices. Recently, flexible and stretchable electron-ics and optoelectronics technology devices growing up fast, especially promoting the development of wearable electronics and highly portable features [14] Research on flexible electronics is rapidly expanding. It already exhib-its applications in supercapacitors, implant sensors, flex-ible piezoelectric sensors, electronic paper, solar cells, touch panels, wireless wearable gadgets, flexible displays, bio-integrated therapeutic devices and epidermal elec-tronics. Indium tin oxide (ITO) displays excellent opto-electronic features. It is at present the most widely used transparent electrode [15–17] Moreover, up to now ITO-coated polyethylene terephthalate (PET) substrates (ITO/PET) has been applied in numerous applications since they couple good flexibility and high electrical conductiv-ity [18].
Recently, we reported an LDH base electrochemical sensor with dual amplification strategy for dopamine and Fe(III) detection. During the layer-by-layer (LbL) assembly, the synthesized electroactive naphthalimide dye/LDH nanoplatelets matrix (NALD-n) displayed in successive layers on the GO/ITO/PET surface electrode. This structure design resulted in a significant increase in the fluorescence emission of electroactive dye in the sen-sor’s bed [19].
This field of molecular engineering in the structure of highly sensitive electronics, such as nanosensors, is the basis of the process designed in this research work.
Alizarin red S with the chemical name of 1,2-dihy-droxy-9,10-anthraquinone has a flat heterocyclic ring structure, which has been widely used in biological sciences, photochemicals and environmental studies
involved with toxic contaminants [20, 21]. ARS has been widely used as a sensor for the detection of metal ions and biomolecules because of high fluorescence intensity [22, 23].
Al3+ ion is a heavy and toxic metal ion that has numer-ous applications in various industries. Aluminium ion toxic and destructive effects on human health are inves-tigated in several studies. The most destructive effects on the human nervous system, such as Alzheimer’s reported [24]. Several precise laboratory methods are usually used to determine the amount of aluminium ion in bio-logical and environmental samples. Some of these com-monly used methods are including inductively coupled plasma atomic emission spectroscopy (ICP-AES) [25, 26], inductively coupled plasma atomic emission spectros-copy (ICP-MS) [27], graphite furnace atomic absorption spectroscopy (GF-AAS) [28], high-resolution continuum source flame atomic absorption spectrometer (HR-CS) [29], flame atomic absorption spectrometry (FAAS) [30]. These methods are standard and functional, but there are some serious disadvantages in serious matrix interfer-ences, as well as the lack of accuracy. Different methods for aluminium ion determination are listed in Table 1. As can be seen, its detection limit is in the range of mg/l or µg/L. Some methods need a long time for sample prepa-ration and analysis.
In most cases, for trace analysis, preconcentration steps on a specific sorbent are needed. Some spectrofluori-metric methods show high sensitivity with low detection limit, but long response time [31–37]. Even though their detection systems were simple, but it shows weaknesses in sensitivity and selectivity. A combine optical and elec-trochemical methods sensor will offer better advantages over other methods. An optical–electrochemical sensor is compact for miniaturization, easily be incorporated into low-cost and easy-to-use with the excellent selectiv-ity and sensitivity necessary for real-time environmental monitoring. Solid-state sensing platforms are essential in sensor fabrication. When a chemical reagent immobilizes into or onto a solid matrix, its stability improves in the immobilization media and so avoids the undesirable sus-ceptibility to interference and fouling.
In the newer researches, the use of an electrochemical sensor is introduced for more precise detection of Al3+ ion [38]. A sensor that consists of a three-dimensional inorganic or two-dimensional organic/inorganic rigid network has a higher interfacial area for ion adsorption, and hence higher electrocatalysis reactivity in the sen-sor, which will result in higher sensitivity and selectivity of the electrochemical sensor [39]. Based on our knowl-edge, ITO/PET-layered (ARS/LDHs)n matrix presented here is the first electro-optical platform for aluminium monitoring.

Page 3 of 16Lajevardi Esfahani et al. Nanoscale Res Lett (2020) 15:210
In this research work, a novel electrochemical solid-state sensor used to detect Al3+ ion accurately. The basis of this electrochemical sensor is the measurement of the signal by electrochemical and optical methods simulta-neously. In this type of sensor, the electroactive organic units (ARS molecules) present in the indium tin oxide coated PET (ITO/PET) LbL assembled (ARS/LDHs)n matrix are involved in electrochemical reactions when exposed to the target molecule (Al3+ ion), so the electro-chemical changes of the new formed Al-chelated system are detectable. The electrochemical changes, the amount and quality of light released from the sensor are also assessed by contact with the target molecule.
Materials and MethodsMaterialsITO/PET sheet (60 Ω cm−1), alizarin red S (3,4-dihy-droxy-9,10-dioxo-2-anthracensulphonic acid, sodium salt), aluminium(III) nitrate (Al(NO3)3), Cobalt(II) nitrate (Co(NO3)2), Ni(II) nitrate (Ni(NO3)2, Ca(II) nitrate (Ca(NO3)2), Sr(II) nitrate (Sr(NO3)2), Cu(II) nitrate (Cu(NO3)2), acetate/sodium carbonate buffers and potas-sium chloride (KCl) were obtained from Sigma Aldrich Co.
ApparatusThe sheet resistance of modified electrodes was meas-ured with Fluke Ohmmeter (1550B). Absorption measurements were taken with a single beam UV–Vis Spectrophotometer (CECIL CE9200) from 200 to 800 nm. Scanning electron microscopy (SEM) and atomic force microscopy (AFM) tests were done on prepared
samples using (LEO 1455VP) and (Micro Photonics Inc/ Dual scope DS95-200E) instruments, respectively. A fluo-rescence spectrometer (PerkinElmer LS55) was used to measure the fluorescence intensity of tested samples. The cyclic voltammetry (CV) measurements were performed on electrodes using a (Zahner PP211 potentiostat) in the three-electrode electrochemical cell. In this test, the sur-face of prepared electrodes was used as a working elec-trode, and platinum was used as a counter electrode with Ag/AgCl as the reference one. A KCl solution (0.1molar in deionized water) was used as a standard electrolyte in all tests. In all of CV tests, the potential scan step was 0.005 V, and the potential scanning speed was 0.05 Vs−1. Each cyclic voltammogram presented in this research work is the most representative cycle obtained for each experiment.
Fabrication of the A.R.S./LDHs Film Modified ElectrodeMg–Al LDHs (including nitrate anion) was synthesized by the method developed by the ICRC Research Group [40]. The colloidal suspension of Mg–Al L.D.H.s nan-oplatelets in deionized water (1.0 g L−1) was prepared under ultrasonication in a sonicator bath (Bandelin electronic/510 h) at 40 °C for 4 h. In order to investi-gate the pH effect on the adsorption of LDH nanoplate-lets and ARS dye molecules on the electrode surface in a range of pH values, which were adjusted by different (acetate/carbonate) buffers, the ITO/PET electrode was immersed in LDH suspension (in different adjusted pH varied from 3.5 to 11.5) for 10 min. The electrodes were then removed and rinsed with distilled water. Then they were immersed in ARS solution in distilled water
Table 1 Comparison of the analytical methods for the determination of aluminium ion
Method Detection limit Response time Linear calibration graph RSD (%) Sample References
ICP-AES 1.96 × 10⁻³ (mg/L) – – 3.7 Biological samples and [25]
ICP-AES 6 × 10⁻⁵ (mg/L) 3 s – 1.6 Human urine samples [26]
ICP-MS 5 × 10⁻⁵ (mg/L) – – 11 Lake water [27]
GF-AAS 9 × 10⁻⁵ (mg/L) – (1 × 10⁻⁵ to 250 × 10–5) × 10–5 (mg/L)
3.1–5.2 Biological and environmental [28]
HR-CS 1.8 × 10⁻⁴ (mg/L) – (0.1 to 20.0) (mg/L) 2.4 Real water samples [29]
FAAS 7.71 × 10⁻³ (mg/L) (1 × 10⁻³ to 20 × 10–3) (mg/L) 5 Dam waters [30]
Fluorescence 4.7 × 10⁻⁷(mol/L) 3 min (6.19 × 10⁻⁷ to 6 × 10⁻⁵) (mol/L) < 5.0 Spiked lake and river water samples
[31]
Fluorescence 3.62 × 10⁻⁶ (mol/L) 40 s (3.62 × 10⁻⁶ to 1 × 10⁻⁴) (mol/L) 2.82 Synthetic water [32]
Colorimetric 1 × 10⁻³ (mg/L) 35 s (0.1–1.0) × 10–3 (mg/L) 2.4–3.1 Synthetic water [33]
Fluorescence 4.8 × 10⁻¹² (M/L) 15 min (1.0 × 10 −10 to 1.0 × 10⁻⁵) (M/L) < 5.0 Synthetic water [34]
Reflectance 10–5 (mol/L) 5 min (0.34 × 10⁻³ to 10.75 × 10⁻³) (mg/L)
– [35]
Diffuse reflectance 6.7 × 10⁻⁶ (mg/ L) (6.7 × 10⁻⁶ to 7.4 × 10⁻⁶) (mol/L) 8.8 Synthetic water [36]
Fluorescence 1.1 × 10⁻⁵ (mg/L) – – 5 Dialysis solutions and water [37]
Page 4 of 16Lajevardi Esfahani et al. Nanoscale Res Lett (2020) 15:210
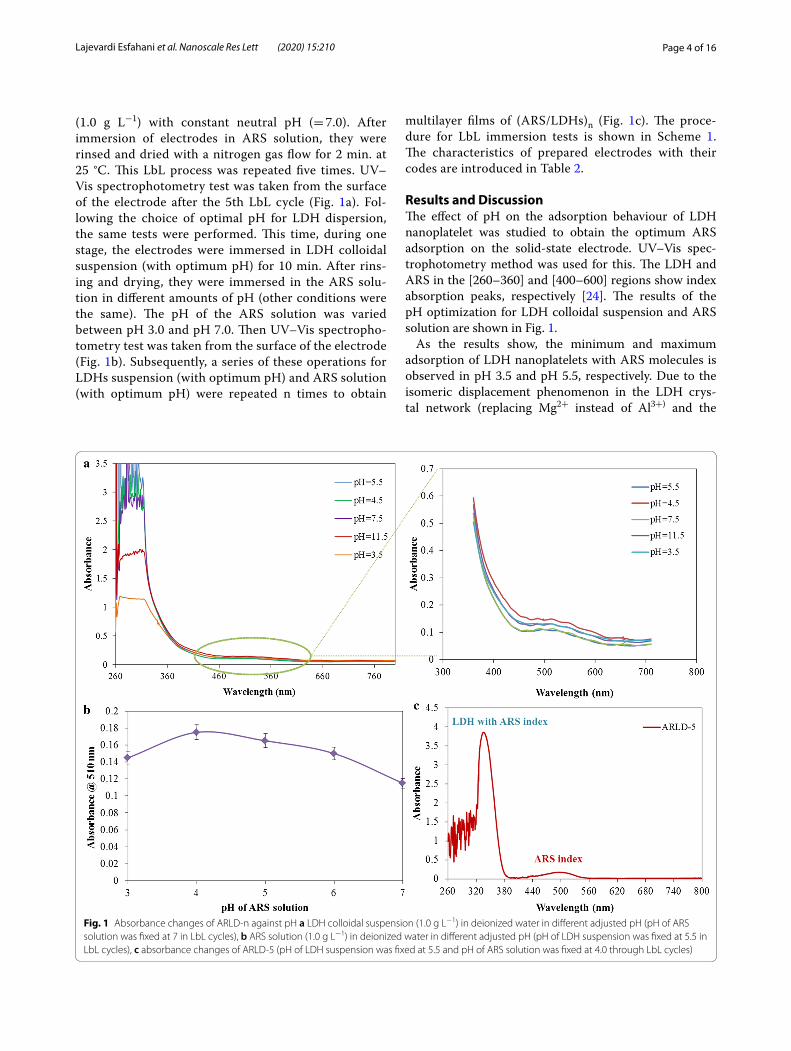
(1.0 g L−1) with constant neutral pH (= 7.0). After immersion of electrodes in ARS solution, they were rinsed and dried with a nitrogen gas flow for 2 min. at 25 °C. This LbL process was repeated five times. UV–Vis spectrophotometry test was taken from the surface of the electrode after the 5th LbL cycle (Fig. 1a). Fol-lowing the choice of optimal pH for LDH dispersion, the same tests were performed. This time, during one stage, the electrodes were immersed in LDH colloidal suspension (with optimum pH) for 10 min. After rins-ing and drying, they were immersed in the ARS solu-tion in different amounts of pH (other conditions were the same). The pH of the ARS solution was varied between pH 3.0 and pH 7.0. Then UV–Vis spectropho-tometry test was taken from the surface of the electrode (Fig. 1b). Subsequently, a series of these operations for LDHs suspension (with optimum pH) and ARS solution (with optimum pH) were repeated n times to obtain
multilayer films of (ARS/LDHs)n (Fig. 1c). The proce-dure for LbL immersion tests is shown in Scheme 1. The characteristics of prepared electrodes with their codes are introduced in Table 2.
Results and DiscussionThe effect of pH on the adsorption behaviour of LDH nanoplatelet was studied to obtain the optimum ARS adsorption on the solid-state electrode. UV–Vis spec-trophotometry method was used for this. The LDH and ARS in the [260–360] and [400–600] regions show index absorption peaks, respectively [24]. The results of the pH optimization for LDH colloidal suspension and ARS solution are shown in Fig. 1.
As the results show, the minimum and maximum adsorption of LDH nanoplatelets with ARS molecules is observed in pH 3.5 and pH 5.5, respectively. Due to the isomeric displacement phenomenon in the LDH crys-tal network (replacing Mg2+ instead of Al3+) and the
Fig. 1 Absorbance changes of ARLD-n against pH a LDH colloidal suspension (1.0 g L−1) in deionized water in different adjusted pH (pH of ARS solution was fixed at 7 in LbL cycles), b ARS solution (1.0 g L−1) in deionized water in different adjusted pH (pH of LDH suspension was fixed at 5.5 in LbL cycles), c absorbance changes of ARLD-5 (pH of LDH suspension was fixed at 5.5 and pH of ARS solution was fixed at 4.0 through LbL cycles)

Page 5 of 16Lajevardi Esfahani et al. Nanoscale Res Lett (2020) 15:210
charge level depends on the pH caused by the protona-tion/deprotonation on the LDH surface, metal ions of LDHs (in the basal surface of LDH) are dissolved in very acidic conditions (pH < 4) and the structure of the LDH is changed. The dissolution of LDH does not observe in other pH values [41–43]. The point of zero charges (PZC) is said to be the pH at which the opposite charges are zero under constant temperature, pressure and medium. Researches show that PZC has existed for LDHs [44]. The adsorption of proton charge on the LDH surface can alter
the pH of the medium. However, charges on the surface of the LDHs can change with changing the pH of the sys-tem. Also, the arrangement of LDH nanoplatelets (basal and prismatic surfaces) due to the effect of electrostatic bonding in different pH conditions has different ten-dencies for adsorption of dye molecules. According to the results, in severe acidic conditions (pH < 4), due to the dissolution of metal ions on the basal surface of the LDHs, the amount of stable and unsolvable LDH nano-particles that adsorb on the solid electrode surface will be minimal.
On the other hand, by moving to entirely alkaline con-ditions, due to the deprotonation of the LDH, the lower amount of ARS molecules are adsorbed on the surface of LDHs. Therefore, the optimum pH of LDH colloidal suspension for LbL immersion test is considered to be 5.5. According to Fig. 2b, the highest adsorption of ARS on the electrode surface containing LDH nanoplate-lets indicated in pH 4.0. It seems that an inappropriate mediator formed for formation of a complex with Al3+ ions on the surface of LDHs. Due to the significant acidic conditions (pH 4.0), the structural form of the interme-diate compound (compound II in Scheme 2) is more sta-ble, which is more stable conditions, can form a chelate with Al3+ ions in the LDHs network. As far as neutral pH is concerned, the relative adsorption of ARS on the
Scheme 1 Schematic illustration for LbL assembly of LDH suspension (1.0 g L−1) and ARS solution (1.0 g L−1) to achieve modified electrode ARLD-5
Table 2 The characteristics of prepared electrodes
Number of LbL cycles (n) Sample code
n = 1 ARLD-1
n = 2 ARLD-2
n = 3 ARLD-3
n = 4 ARLD-4
n = 5 ARLD-5
n = 6 ARLD-6
n = 7 ARLD-7
n = 8 ARLD-8
n = 9 ARLD-9
n = 10 ARLD-10

Page 6 of 16Lajevardi Esfahani et al. Nanoscale Res Lett (2020) 15:210
LDH surface decreases. Sathish [45] and Supian et al. [24] also reported that ARS reagent formed a complex with an Al3+ ion in the acetate buffer at pH 4.0. There-fore, the optimum pH of ARS solution for LbL immer-sion test considered to be 4.0. The absorbance behaviour of ARLD-5 modified electrode can be seen in Fig. 1c, while the optimum pH adjustment was made for LDH
suspension (pH 5.5) and ARS solution (pH 4.5) during all of five LbL cycles.
Regarding the effect of Mg–Al LDHs nanoplatelets on the electrical conductivity of the electrode surface, the number of immersion cycle (n) should be determined. For this purpose, changes in electrode sheet resistance were investigated in different immersion cycles. Figure 2 shows the results of the sheet resistance of ITO/PET electrode samples layered by (ARS/LDHs)n.
As the result of Fig. 2 is clear, the electrode’s sheet resistance to the fifth cycle decreases slightly, and after the fifth cycle, the increasing sheet resistance is due to the excessive increase in LDHs nanoplatelets densities and the increase in the length of the electron transfer pathway. It is important to note that the LbL assembly of LDHs nanoplatelets on the electrode surface can result in the ionic exchange function and the robust electron transfer. Therefore, the fifth cycle was selected as the optimal cycle, so that the modified electrode in these conditions has the least resistance and the highest elec-trical conductivity. In general, the results of this test show that the LbL assembly method of LDHs nanoplatelets with the ARS dye molecules does not have a significant
Fig. 2 The sheet resistance changes of ITO/PET electrode samples layered by (ARS/LDHs)n
Scheme 2 Equilibrium structures of ARS depending on the pH and tautomeric structures

Page 7 of 16Lajevardi Esfahani et al. Nanoscale Res Lett (2020) 15:210
effect on the resistance and electrical conductivity of the electrode until the tenth cycle.
In Figs. 3 and 4, SEM images and topographic AFM results obtained from the samples are presented, respectively.
As an illustration in the results of morphology and topography scanning of the prepared electrodes, with increasing the number of LbL cycles (n), continuous increase in the density of LDH layers along the ARS is observed on the surface of the electrode. As from the first cycle to the fifth cycle, surface roughness was increased (AFM images) and the thickness of the LDH nano-platelets along with the adsorbed ARS continually was increased sharply.
In order to investigate the adsorption of ARS molecules on the LDHs nanoplatelets, the optical behaviour of the adsorbed layers was studied using the spectrofluorimetry
test. After each LbL immersion cycle, the spectrofluorim-etry test was performed from the solid electrode surface. The results of the spectrofluorimetry test of the prepared electrodes are given in Fig. 5.
As the results show, after the first LbL immersion cycle, due to the lower amount of ARS molecules along with LDHs nanoplatelets adsorbed on the electrode surface, the amount of fluorescence emission is meagre and the peak of the weak fluorescence emission is about 666 nm. By increasing the number of LbL immersion cycles (n), the fluorescence emission rate increases con-tinually by increasing density of ARS layers along with LDHs nanoplatelets on the solid electrode surface. As in the fifth cycle, the highest fluorescence emission peak is observed at 668 nm. Due to the weak emission spec-trum of ARS solution in deionized water in low concen-tration (10–4 M), the fluorescence emission intensity of
Fig. 3 SEM images (top-view) obtained from the prepared solid-state electrodes (a: ITO/PET, b: ARLD-1, c: ARLD-2, d: ARLD-3, e: ARLD-4, f: ARLD-5)
Fig. 4: 3D-dimensional topographic AFM images obtained from the prepared solid-state electrodes (a: ARLD-1, b: ARLD-2, c: ARLD-3, d: ARLD-4, e: ARLD-5)

Page 8 of 16Lajevardi Esfahani et al. Nanoscale Res Lett (2020) 15:210
this compound when enclosed between Mg–Al LDHs on solid electrode substrate has improved due to less molecular rotation of dye molecules in solid-phase than dye molecules in solvent phase and reduced solvent effect in solid phase [46]. As the number of layers increases, the shape of the couriers will be sharpened, and the peak width will be lower, which confirms this. Fluorescence emission of molecules in aggregates forms or assembled into crystalline lattices undergoes enhancement, the effects of non-radiative energy transfer and reduction of molecular rotations are considerably reduced or elimi-nated. However, high aggregation on the solid surface
resulted in a remarkable self-quenching. To reduce the intermolecular interaction between the chromophores, an increasing separation between stacked structures to reduce π-overlapping between aromatic cores, led to a reduction of fluorescence quenching and strong emission resulted [47].
It found that ARS has three equilibrium structures depending on the pH of the solution, as shown in Scheme 2 [48, 49]. The second deprotonation leads to a bluish violet dianion (III) at pH > 12.1. The species of oxi-dized ARS 1 and reduced ARS 7 present as a function of experimental conditions. As can be seen from below pH 4 ARS 1 represents the main species, ARS 2 prevails in the pH region of 5.5–10.5 and ARS 3 will be the relevant species above pH 12. Ionic forms of ARS have tautomeric structures. Scheme 2 shows the reduction forms and tau-tomerism of each species.
Alizarin (I) and ARS is known to form stable complexes with Al3+, known as “lake pigments”. V. Ya. Fain and cow-orkers deeply studied on metal complexes of alizarin and alizarin reds based on their electronic absorption spectra [50]. They concluded the complexation of dihydroxyanth-raquinones always proceeds at the peri- or ortho-hydrox-ycarbonyl group and involves tautomeric anthraquinoid forms. Alizarin complexation occurs at the peri-hydrox-ycarbonyl group via the formation of the C=O M–O coordination bond and six-membered chelate ring in monoanionic form of ARS, compound II (Scheme 3). The authors suggested that in alkali solutions, alizarin reacted with metal ions as the ortho-diphenol compound to give structure III. Complexation in neutral media can be explained by the replacement of the hydrogen atom in
Fig. 5 The changes in the fluorescence intensity of different prepared electrodes (λexc. = 388 nm)
Scheme 3 Tautomeric forms of ARS-Al complex

Page 9 of 16Lajevardi Esfahani et al. Nanoscale Res Lett (2020) 15:210
the chelate cycle of complex I by the metal ion followed by the ionization of the M–O bond. Therefore, the ion-ized hydroxy group of alizarin monoanion in position 1 is bonded through the intramolecular hydrogen bond. Also, to form II, this complex can have three more tautomeric forms (IV–VI).
In acidic media, the O–M bond remains covalent, and the electronic absorption spectra of monometallic alizar-inates are identical to the spectrum of nonionized aliza-rin. In weakly alkali media, alizarin enters complexation reaction with metal ions as monoanion. Of all monoan-ionic structures, only 9-hydroxy-2-oxo-1,10- anthraqui-none contains the adjacent carbonyl and oxo groups. Therefore, monometallic alizarinates formed in an alkali medium should have the 1,10-anthraquinoid structure VII with the five-membered chelate cycle.
As can be seen in Scheme 2, ARS has a reversible redox behaviour. Its metal complexes are also electroactive with different redox characteristics, make it a right candidate for application in the electrochemical-based analysis. Its complexation rate is fast respect to some common metal ion complexing reagents. ARS and ARS-Al show differ-ent redox peak potentials. Therefore during the addition of aluminium ion to free ARS a new peak (ARS-Al) in different potentials related to ARS-Al redox is growing up proportional to aluminium ion concentration. Differ-ent stable platforms introduced in order improved the sensitivity and applicability of ARS-based sensors. Both ARS and its complex are electroactive in the solid state.
Electrochemical behaviours of prepared electrodes were studied by cyclic voltammetry test. The results of cyclic voltammograms of prepared electrodes are shown in Fig. 6.
According to the results of Fig. 6a, the shape of the bare ITO/PET electrode is a noisy graph with low current flow and a shallow width, indicating weak
electrocatalytic activity of the electrode. With the mod-ification of the electrode surface by the (ARS/LDHs)n LbL assembly, the shape of the CV graph tends to wider and symmetrical cycles, so as the number of immer-sion cycles increases, the flow interval increases and the courier surface becomes more expansive, with the highest peak flow rate and the broadest graph in the fifth cycle (n = 5). As shown in the results of Fig. 6b, for the ARLD-5 electrode in the 0.1 M KCl, when no aluminium ion is present, a somewhat “reversible” peak is observed by the result of the CV test. In this peak, the anode and cathode currents in about 0.25 V (vs Ag/AgCl) occurred due to oxidation/reduction of free ARS on the modified electrode surface. In the presence of aluminium ions (Fig. 6c), a pseudo-reversible peak burst is detectable at about 0.58 V (vs Ag/AgCl), which is related to oxidation peak for the alizarin–aluminium complex on the modified electrode surface, so that in ARLD-5, oxidation peak can be detected sharply and distinctly. The results of the voltammogram show that, with an increasing number of LbL immersion layers, the electrocatalytic activity of the modified electrode has improved concerning the electron transfer to the external surface of the electrode. Also, the following reactions for the reduction of the (ARS-Al) complex (Scheme 3) on the electrode surface have improved, and the best electrocatalytic activity is evident in ARLD-5 electrode [24].
Regarding the importance of the pH effect on the structural model of dye and formation of an (ARS-Al) complex, all CV experiments were carried out in the neutral pH (= 7.0) (0.1 M KCl in deionized water), that all electrochemical and optical changes in the electrode surface can be controlled and detected only by chang-ing the concentration of Al3+ ion.
Fig. 6 The cyclic voltammograms of a bare ITO/PET in 0.1 M KCl in deionized water, b ARLD-5 electrode in 0.1 M KCl in deionized water, c prepared electrodes in (0.1 M KCl in deionized water) including 15 μM Al3+
Page 10 of 16Lajevardi Esfahani et al. Nanoscale Res Lett (2020) 15:210
Electrochemical Detection of Al3+
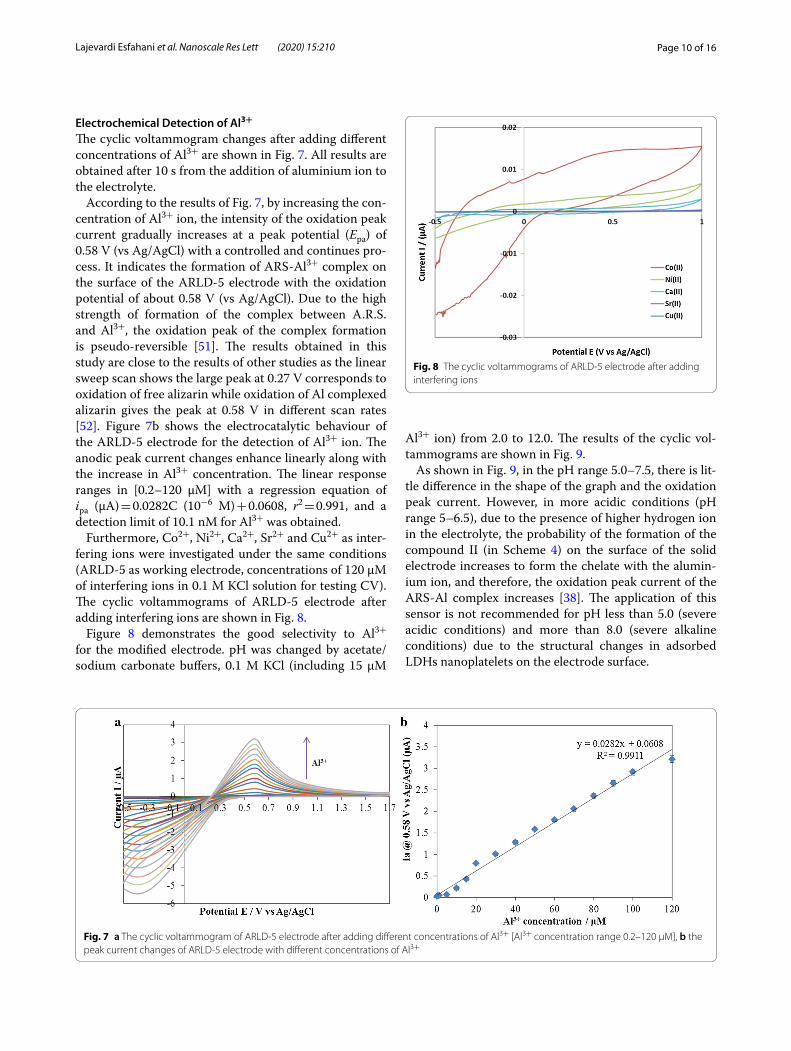
The cyclic voltammogram changes after adding different concentrations of Al3+ are shown in Fig. 7. All results are obtained after 10 s from the addition of aluminium ion to the electrolyte.
According to the results of Fig. 7, by increasing the con-centration of Al3+ ion, the intensity of the oxidation peak current gradually increases at a peak potential (Epa) of 0.58 V (vs Ag/AgCl) with a controlled and continues pro-cess. It indicates the formation of ARS-Al3+ complex on the surface of the ARLD-5 electrode with the oxidation potential of about 0.58 V (vs Ag/AgCl). Due to the high strength of formation of the complex between A.R.S. and Al3+, the oxidation peak of the complex formation is pseudo-reversible [51]. The results obtained in this study are close to the results of other studies as the linear sweep scan shows the large peak at 0.27 V corresponds to oxidation of free alizarin while oxidation of Al complexed alizarin gives the peak at 0.58 V in different scan rates [52]. Figure 7b shows the electrocatalytic behaviour of the ARLD-5 electrode for the detection of Al3+ ion. The anodic peak current changes enhance linearly along with the increase in Al3+ concentration. The linear response ranges in [0.2–120 μM] with a regression equation of ipa (μA) = 0.0282C (10−6 M) + 0.0608, r2 = 0.991, and a detection limit of 10.1 nM for Al3+ was obtained.
Furthermore, Co2+, Ni2+, Ca2+, Sr2+ and Cu2+ as inter-fering ions were investigated under the same conditions (ARLD-5 as working electrode, concentrations of 120 μM of interfering ions in 0.1 M KCl solution for testing CV). The cyclic voltammograms of ARLD-5 electrode after adding interfering ions are shown in Fig. 8.
Figure 8 demonstrates the good selectivity to Al3+ for the modified electrode. pH was changed by acetate/sodium carbonate buffers, 0.1 M KCl (including 15 μM
Al3+ ion) from 2.0 to 12.0. The results of the cyclic vol-tammograms are shown in Fig. 9.
As shown in Fig. 9, in the pH range 5.0–7.5, there is lit-tle difference in the shape of the graph and the oxidation peak current. However, in more acidic conditions (pH range 5–6.5), due to the presence of higher hydrogen ion in the electrolyte, the probability of the formation of the compound II (in Scheme 4) on the surface of the solid electrode increases to form the chelate with the alumin-ium ion, and therefore, the oxidation peak current of the ARS-Al complex increases [38]. The application of this sensor is not recommended for pH less than 5.0 (severe acidic conditions) and more than 8.0 (severe alkaline conditions) due to the structural changes in adsorbed LDHs nanoplatelets on the electrode surface.
Fig. 7 a The cyclic voltammogram of ARLD-5 electrode after adding different concentrations of Al3+ [Al3+ concentration range 0.2–120 μM], b the peak current changes of ARLD-5 electrode with different concentrations of Al3+
Fig. 8 The cyclic voltammograms of ARLD-5 electrode after adding interfering ions

Page 11 of 16Lajevardi Esfahani et al. Nanoscale Res Lett (2020) 15:210
Optical Detection of Al3+
Alizarin red S (ARS) has been used as a chromogenic agent for developing spectrophotometric methods. Anth-raquinone-metal complexes show strong fluorescence. The fluorescence of metal–ARS complexes is affected
by cation’s field energy [53]. Therefore, the maximum excitation fluorescence wavelength pair of the Al-ARS complex is significantly different from other metal ions, which are interferents in spectrophotometric methods for Al determination. The principle of spectrofluorimet-ric determination of aluminium is based on its inten-sity enhancement which growing up during addition of aluminium ion to free ARS. Herein ARS was adsorbed on a solid platform of LDH, making it more rigid and improved its intensity resulted in more sensitivity.
Prepared electrodes were considered as the working electrode in the three-electrode electrochemical cell. The electrolyte used was a KCl solution (0.1 M) in distilled water. Different concentrations of aluminium ion were added to the electrolyte. After each CV test and comple-tion of this test, the spectrofluorimetry test was regularly performed on the electrode surface. The results of spec-trofluorimetry test are shown in Fig. 10.
The modified ITO/PET electrode with (ARS/LDHs)5 matrix shows an intense fluorescence emission spectrum in the presence of Al3+ ion. Figure 10 shows the grad-ual fluorescence increase in ARLD-5 after the addition of Al3+ (concentration range from 0.2 to 120 μM) and
Fig. 9 Anodic current changes at 0.58 V versus Ag/AgCl of ARLD-5 electrode to pH of 0.1 M KCl in deionized water (including 15 μM Al3+ ion)
Scheme 4 Mechanism of ARS complex reduction on the electrode surface
Fig. 10 a, b The changes of fluorescence intensity (λexc. = 388 nm) of ARLD-5 electrode after adding different concentrations of Al3+ [Al3+ concentration range 0.2–120 μM], c the fluorescence intensity changes in terms of Al3+ concentration inverse

Page 12 of 16Lajevardi Esfahani et al. Nanoscale Res Lett (2020) 15:210
indicates the formation of a static adduct between A.R.S. and Al3+. It was found that the ARLD-5 fluorescence intensity increased within 10 s after addition of Al3+. So, the fluorescence increasing of ARLD-5 was relatively independent of the incubation time. From the results above, the ARLD-5 has a sensitivity and high-efficiency fluorescence emission to Al3+ ion.
To calculate the detection limit and calibration curve in an optical sensor, first, we obtain the ratio of the flu-orescence intensity differences, draw then the graph of this ratio in terms of the target concentration inverse. According to Eq. (1) [54], the slope of the fitted line was used to determine the detection limit. The obtained results are shown in Fig. 10c.
As the results of Fig. 10b shows, the fluorescence intensity changes enhance along with the increase in Al3+ concentration with the linear response ranges of [0.2–120 μM]. Plotting fluorescence intensity versus inverse of the concentration, the regression equation of Y = 0.6994X + 0.5445, r2 = 0.986, and a detection limit of 23 nM for Al3+ was obtained.
In order to determine the selectivity of the sensor to the Al3+, a concentration of 120 μM interfering ions (Co2+, Ni2+, Ca2+, Sr2+, Cu2+) were prepared. The spec-trofluorimetry test was carried out from the electrode surface after adding the interfering ions to the electro-lyte. As shown in the results of Fig. 11, it is clear that the addition of interfering ions did not show a significant difference in the fluorescence emission of the electrode surface, and the most significant difference was observed in the emission of fluorescence for Al3+, indicates the high selectivity of this type of sensor for Al3+. In order
(1)(Fmax − F0)/(Fc − F0) = 1+ (KC)−1.
to better determine the selectivity of the modified elec-trode to Al3+, six solutions of 10–4 M concentrations of ARS in distilled water were prepared in completely same conditions. Therefore, 120 μM of Al3+ ion and interfer-ing ions were assigned to each of the solutions and mixed well. Figure 11b shows the images taken under UV cabin with an excitation wavelength of 366 nm of each of the solutions. As the spectrofluorimetry test results showed, adding Al3+ ion to ARS solution showed significant fluo-rescence, while the initial solution of ARS and other ARS solutions contained interfering ions under the UV cabin have no fluorescence emission.
To better understand the electrochemical mechanism on the electrode surface, UV–Vis spectrophotometry investigation was performed on the electrode surface before and after adding 120 μM of Al3+ ion and perform-ing a CV test. A.R.S. solution (10–4 M) in deionized water was also prepared. 120 μM of Al3+ ion was added to the solution and mixed well. The UV–Vis spectrophotometry test was then taken from both solutions. The obtained UV–Vis spectrophotometry results from the samples are shown in Fig. 12.
According to the results of Fig. 12, when the aluminium ion was added to the ARS solution, we see a sharp peak at a maximum absorption wavelength of 577 nm, indicating an increase in the absorption wavelength (redshift) after the formation of the ARS-Al3+ complex in the ARS solu-tion. When Al3+ ion reacted with the ARS molecule, the hydroxyl (–OH) functional group in the ARS molecule which acted as an auxochrome group has affected the shifting of carbonyl (C=O) chromophore peak to a longer wavelength at 577 nm as well as increasing the chromo-gen absorbance intensity [24]. The interesting point is that the absorption diagram of the ARLD-5 after adding
Fig. 11 a The fluorescence intensity (λexc. = 388 nm) changes of ARLD-5 electrode after adding 120 μM of Al3+ and interfering ions, b the fluorescence intensity differences for Al3+ detection compared to interfering ions

Page 13 of 16Lajevardi Esfahani et al. Nanoscale Res Lett (2020) 15:210
the aluminium ion to the electrolyte solution and testing CV, a sharp peak at 590 nm absorption wavelength indi-cates that the formation of the ARS-Al3+ complex on the surface of the solid electrode is confirmed. In the study of Supian et al. [24], the wavelength of maximum absorp-tion of the ARS-Al3+ complex was measured at 488 nm.
Sensor StabilityMoreover, ten replicate measurements of 0.2 μM Al3+ on the modified electrode yielded a reproducible cur-rent and maximum fluorescence intensity with the relative standard deviation (R.S.D.) of 2.5% and 2.6%, respectively; also, six independent modified electrodes were prepared using the same procedure and used for determination of Al3+ (0.2 μM) with the (RSD) of 1.9%, demonstrating the excellent repeatability and reproduce ability of the electrochemical sensor. The long-term and too high flexibility were investigated by measuring the current response of 0.2 μM Al3+ after bending test (in a cylindrical manner to a 90° angle) of modified ITO/PET electrode for 90 times during 1 month and the per cent recovery was 96%, indicating the long lifetime stability of the modified flexible electrode.
The results of Fig. 13 represent the electrochemical and optical response changes of the electrochemical sensor designed to the changes in the aluminium ion concentra-tion, which shows a perfect and significant fit between the electrochemical and optical response of this type of sensor against the target molecule.
The detection limit in this work is compared to previ-ous works so that the details are presented in Table 3.
Other methods summarized in Table 3, based on the ASV technique, usually require longer detection times and repeatable electrode polishing step at each
Fig. 12 The UV–Vis spectrophotometry test of ARS solutions (10–4 M) in deionized water compared to modified solid electrodes before and after adding 120 μM Al3+
Fig. 13 The electrochemical /optical response changes of the electrochemical sensor to the changes in Al3+ concentration

Page 14 of 16Lajevardi Esfahani et al. Nanoscale Res Lett (2020) 15:210
measurement. On the other hand, the electrochemical sensor designed in this study has a simple design system and, in addition to an electrochemical signal that accu-rately detects tiny amounts of target molecules quanti-tatively, also has an optical signal. As the optical signal changes in the spectrofluorimetry test, the application of the sensor is very convenient for biologists. This design structure is considered very suitable for future biotech-nology applications.
ConclusionIn this study, a novel flexible ITO/PET-based electro-chemical sensor was designed and constructed so that by modifying its surface by (ARS/LDHs)n matrix grid by LbL assembly technique, a sensitive and selective sensor was obtained to detect Al3+. The results of this study showed that the LbL assembly of LDH nanoplatelets along with the electroactive dye molecules (ARS), up to five cycles, formed a conductive matrix network with uniform mor-phology and topology. The minimum sheet resistance with the high electrocatalytic function was obtained in the fifth cycle of the LbL assembly. In this electrochemi-cal sensor, both electrochemical and optical methods were detected with the high sensitivity of Al3+, so that in a CV-based electrochemical method, the lower detection limit of 10.1 nM with a broad linear range [0.2–120 μM] was obtained than fluorescence-based optical method. Although the electrochemical technique had a sensitivity of about 2.27 times more than an optical method in this sensor, due to the resolution of distinct optical response in different concentrations of Al3+, the optical applica-tions will be an interest of biologists for biotechnological diagnostics.
AbbreviationsL.D.H.: Layered double hydroxides; LbL: Layer-by-layer; A.R.S: Alizarin red S; NCs: Nanoclusters; ITO/PET: ITO-coated polyethylene terephthalate; NALD: Naphthalimide dye/LDH nanoplatelets matrix; ICP-AES: Inductively coupled plasma atomic emission spectroscopy; ICP-MS: Inductively coupled plasma mass spectrometry; GF-AAS: Graphite furnace atomic absorption spectros-copy; HR-CS: High-resolution continuum source flame atomic absorption spectrometer; FAAS: Flame atomic absorption spectrometry; ASV: Adsorptive stripping voltammetry; DPV: Differential pulse voltammetry; EIS: Electrical impedance spectroscopy; CV: Cyclic voltammetry; PZC: Point of zero charges; SEM: Scanning electron microscope; AFM: Atomic force microscopy; SPE: Solid phase extraction.
AcknowledgementsWe would like to appreciate the Center of Excellence for Color Science and Technology (CECST), Institute for Color Science and Technology, Tehran-Iran for providing us with a right environment and facilities to complete this project.
Authors’ ContributionsSLE performed the experimental data acquisition and interpretation of the results. SR and ZR designed and wrote the entire manuscript. All authors participated in discussing the results and approved the final draft of the manuscript. All authors read and approved the final manuscript.
FundingNot applicable.
Availability of Data and MaterialsAll data supporting the conclusions of this article are included within the article.
Competing interestsThe authors declare that they have no competing interests.
Author details1 Organic Colorants Department, Institute for Color Science and Technol-ogy (ICST), Tehran, Iran. 2 Surface Coatings and Novel Technologies, Institute for Color Science and Technology (ICST), Tehran, Iran. 3 Center of Excellence for Color Science and Technologies, Institute for Color Science and Technology (CECST), Tehran, Iran.
Received: 18 June 2020 Accepted: 30 October 2020
Table 3 Comparison of the present sensor system and other electrochemical Al3+ detection methods
Chelators used Chelator modification method Method based on Detection limit References
Alizarin red S LbL assembly of (A.R.S./LDHs)n on ITO/PET CV 10.1 nM Present system
Alizarin red S LbL assembly of (A.R.S./LDHs)n on ITO/PET Spectrofluorimetry 23 nM Present system
Alizarin red Drop coating ASV 19.21 μM [55]
Pyrocatechol violet Adsorption ASV 0.26 μM [56]
8-Hydroxy-quinoline Adsorption ASV 4 ppm [51]
Mercaptosuccinic acid Self-assembly onto gold nanoparticles modified S.P.E CV 37 nM [38]
p-((8-hydrocycloquibo-line)azo) benzenethiol
Self-assembly onto a gold electrode Potentiometry 8.32 × 10⁻³ nM [57]
Haematoxylin with graphite powder and paraffin wax
blending Voltammetry and EIS 100 nM [58]
Alizarin red S Sol–gel on glassy carbon electrode DPV 80 nM [59]
Alizarin red Polymerization with PVA-SbQ Amperometry 25 μM [60]

Page 15 of 16Lajevardi Esfahani et al. Nanoscale Res Lett (2020) 15:210
References 1. Nagendra B, Mohan K, Gowd EB (2015) Polypropylene/layered double
hydroxide (L.D.H.) nanocomposites: influence of L.D.H. particle size on the crystallization behaviour of polypropylene. ACS Appl Mater Interfaces 7:12399–12410. https ://doi.org/10.1021/am507 5826
2. Weidan N, Zhengyi Q, Xueqian C, Xingguang S (2018) A turn-on fluores-cent probe for sensitive detection of sulfide anions and ascorbic acid by using sulfanilic acid and glutathione functionalized graphene quantum dots. Sens Actuators B Chem 256:48–54. https ://doi.org/10.1016/j.snb.2017.09.182
3. Alibakhshi E, Ghasemi E, Mahdavian M, Ramezanzadeh B (2016) Corrosion inhibitor release from Zn-Al-[PO43-]-[CO32-] layered double hydroxide nanoparticles. Prog Color Color Coat 9:233–248
4. Jayakumar K, María Belén C, Dharuman V, Huangxian J, Ramendra SD, Yangping W (2018) One-step electrodeposition-assisted layer-by-layer assembly of gold nanoparticles and reduced graphene oxide and its self-healing three-dimensional nanohybrid for an ultrasensitive D.N.A. sensor. Nanoscale 10:1196–1206. https ://doi.org/10.1039/C7NR0 6952A
5. Guangwei G, Jie L, Zaochuan G, Shaojun C, Shiguo C, Haipeng Y (2017) Self-Assembling of electrochemical glucose biosensor with bacteriostatic materials via layer-by-layer method. J Electrochem Soc 164:189–192. https ://doi.org/10.1149/2.08417 06jes
6. Run-Min S, Zhan-Hong L, Peng-Ju W, Xue-Ling Z, Cheng C, Zhi-Gang Z (2018) Flexible hydrogen peroxide sensors based on platinum modified free-standing reduced graphene oxide paper. Appl Sci 8:848–860. https ://doi.org/10.3390/App80 60848
7. Yuan T, Pu L, Huang Q, Zhang H, Li X, Yang H (2014) An effective metha-nol-blocking membrane modified with graphene oxide nanosheets for passive direct methanol fuel cells. Electrochim Acta 117:393–397. https ://doi.org/10.1016/j.elect acta.2013.11.063
8. Kong XG, Rao XY, Han JB, Wei M, Duan X (2010) Layer-by-layer assembly of bi-protein/layered double hydroxide ultrathin film and its electrocata-lytic behaviour for catechol. Biosens Bioelectron 26:549–554. https ://doi.org/10.1016/j.bios.2010.07.045
9. Chen X, Fu CL, Wang Y, Yang WS, Evans DG (2008) Direct electrochem-istry and electrocatalysis based on a film of horseradish peroxidase intercalated into Ni–Al layered double hydroxide nanosheets. Biosens Bioelectron 24:356–361. https ://doi.org/10.1016/j.bios.2008.04.007
10. Taviot-Gueho C, Prevot V, Forano C, Renaudin G, Mousty C, Leroux F (2017) Tailoring Hybrid layered double hydroxides for the development of innovative applications. Adv Funct Mater 28:1703868. https ://doi.org/10.1002/adfm.20703 868
11. Chen H, Hu L, Chen M, Yan Y, Wu L (2014) Nickel-Cobalt layered double hydroxide nanosheets for high-performance supercapacitor elec-trode materials. Adv Funct Mater 24:934–942. https ://doi.org/10.1002/adfm.20130 1747
12. Li S, Lu J, Wei M, Evans DG, Duan X (2010) Tris(8-hydroxyquinoline-5-sulfonate) aluminium intercalated Mg–Al layered double hydroxide with blue luminescence by hydrothermal synthesis. Adv Funct Mater 20:2848–2856. https ://doi.org/10.1002/adfm.20100 0200
13. Tian R, Zhang S, Li M, Zhou Y, Lu B, Yan D, Wei M, Evans DG, Duan X (2015) Localization of Au nanoclusters on layered double hydrox-ides nanosheets: confinement-induced emission enhancement and temperature-responsive luminescence. Adv Funct Mater 25:5006–5015. https ://doi.org/10.1002/adfm.20150 1433
14. Marrani AG, Coico AC, Giacco D, Zanoni R, Motta A, Schrebler R, Dini Girolamo DD, Dalchiele EA (2019) Flexible interfaces between reduced graphene oxide and indium tin oxide/polyethylene terephthalate for advanced optoelectronic devices. ACS Appl Nano Mater 2:5963–5972. https ://doi.org/10.1021/acsan m.9b013 99
15. Dong H, Wu Z, Jiang Y, Liu W, Li X, Jiao B, Abbas W, Hou X (2016) A flexible and thin graphene/silver nanowires/polymer hybrid transpar-ent electrode for optoelectronic devices. ACS Appl Mater Interfaces 8:31212–31221. https ://doi.org/10.1021/acsam i.6b090 56
16. Chen Y, Zhang Y, Liang Z, Cao Y, Han Z, Feng X (2020) Flexible inorganic bioelectronics. npj Flex Electron 4:2. https ://doi.org/10.1038/s4152 8-020-0065-1
17. Li R, Qi H, Ma Y, Deng Y, Liu S, Jie Y, Jing J, He J, Zhang X, Wheatley L, Huang C, Sheng X, Zhang M, Yin L (2020) A flexible and physically tran-sient electrochemical sensor for real-time wireless nitric oxide monitor-ing. Nat Commun 11:3207. https ://doi.org/10.1038/s4146 7-020-17008 -8
18. Chang WY, Fang TH, Yeh SH, Lin YC (2009) Flexible electronics sensors for tactile multi-touching. Sensors (Basel) 9(2):1188–1203. https ://doi.org/10.3390/s9021 188
19. Lajevardi Esfahani S, Rouhani S, Ranjbar Z (2019) Electrochemical solid-state nanosensor based on a dual amplification strategy for sensitive detection of (FeIII-dopamine). Electrochim Acta 299:1011–1023. https ://doi.org/10.1016/j.elect acta.2019.01.065
20. Ding F, Diao JX (2011) Characterization of alizarin red S binding sites and structural changes on human serum albumin: a biophysical study. J Hazard Mater 18:352–359. https ://doi.org/10.1016/j.jhazm at.2010.11.002
21. Wang Z, Liu X, Baeyens WRG (2008) Copper(II)−alizarin red S complex as an efficient chemiluminescent probe for the detection of human serum proteins after polyacrylamide gel electrophoresis. J Proteome Res 7:5075–5081. https ://doi.org/10.1021/pr800 365n
22. Wang LL, Qiao J, Liu HH (2014) Ratiometric fluorescent probe based on gold nanoclusters and alizarin red-boronic acid for monitoring glucose in brain microdialysate. Anal Chem 86:9758–9764. https ://doi.org/10.1021/ac502 3293
23. Halls JE, Ahn SD, Jiang D (2013) Proton uptake vs. redox driven release from metal–organic-frameworks: alizarin red S reactivity in UMCM-1. J Electroanal Chem 689:168–175. https ://doi.org/10.1016/j.jelec hem.2012.11.016
24. Supian SM, Ling TL, Heng LY, Chong KF (2013) Quantitative determina-tion of Al(III) ion by using alizarin red S, including its microspheres optical sensing material. Anal Methods 5:26022609. https ://doi.org/10.1039/C3AY4 0238J
25. Liang P, Yang L, Hu B, Jiang Z (2003) ICP-AES detection of ultratrace aluminium (III) and chromium(III) ions with a microcolumn preconcentra-tion system using dynamically immobilized 8-hydroxyquinoline on TiO2 nanoparticles. Anal Sci 19(8):1167–1171. https ://doi.org/10.2116/anals ci.19.1167
26. Zheng H, Gao X, Song L et al (2011) Preconcentration of trace aluminium (III) ion using a nanometer-sized TiO2-silica composite modified with 4-aminophenylarsonic acid, and its determination by ICP-OES. Microchim Acta 175:225–231. https ://doi.org/10.1007/s0060 4-011-0667-3
27. Djerahov L, Vasileva P, Karadjova I, Kurakalva RM, Aradhi KK (2016) Chitosan film loaded with silver nanoparticles—sorbent for solid phase extraction of Al(III), Cd(II), Cu(II), Co(II), Fe(III), Ni(II), Pb(II) and Zn(II). Carbo-hydr Polym 147:45–52. https ://doi.org/10.1016/j.carbp ol.2016.03.080
28. Mashhadizadeh MH, Amoli-Diva M (2013) Atomic absorption spec-trometric determination of Al3+ and Cr3+ after preconcentration and separation on 3-mercaptopropionic acid modified silica coated-Fe3O4 nanoparticles. J Anal At Spectrom 28:251–258. https ://doi.org/10.1039/C2JA3 0286A
29. Ciftci H, Er C, Ozkan M (2016) Determination of aluminium from water samples and dialysis fluids after separation/preconcentration on Duolite XAD-761 polymeric resin. Desalin Water Treat 57(15):6916–6924. https ://doi.org/10.1080/19443 994.2015.10117 04
30. Yalçınkaya O, Erdoğan H, Çiftçi H, Türker AR (2012) Preconcentration of aluminum on nano ZrO2/B2O3 and its determination by flame atomic absorption spectrometry. Spectrosc Lett 45:344–351. https ://doi.org/10.1080/00387 010.2012.66670 0
31. Suah FBM, Ahmad M, Heng LY (2014) Highly sensitive fluorescence optode for aluminium(III) based on non-plasticized polymer inclu-sion membrane. Sens Actuators B Chem 201:490–495. https ://doi.org/10.1016/j.snb.2014.04.081
32. Muk NS, Narayanaswamy R (2006) Fluorescence sensor using a molecu-larly imprinted recognition receptor for the detection of aluminium ions in aqueous media. Anal Bioanal Chem 386:1235–1244. https ://doi.org/10.1007/s0021 6-006-0736-3
33. Supian S, Ling T, Heng lY, Chong KF (2013) Quantitative determination of Al(III) ion by using Alizarin Red S, including its microspheres optical sens-ing material. Anal Methods 5:2602–2609. https ://doi.org/10.1039/C3AY4 0238J
34. Mendecki L, Granados-Focil S, Jendrlin M, Mold M, Radu A (2020) Self-plasticized, lumogallion-based fluorescent optical sensor for the determi-nation of aluminium (III) with ultra-low detection limits. Anal Chim Acta 1101:141–148. https ://doi.org/10.1016/j.aca.2019.12.021
35. Ahmad M, Narayanaswamy R (1995) A flow-cell optosensor for monitor-ing aluminium(III) based on immobilised eriochrome cyanine R (ECR) and

Page 16 of 16Lajevardi Esfahani et al. Nanoscale Res Lett (2020) 15:210
reflectance spectrophotometry. Sci Total Environ 163:221–227. https ://doi.org/10.1016/0048-9697(95)04480 -O
36. Castañeda-Loaiza V, Díaz-de-Alba MI, Granado-Castro MD, Galindo-Riaño MD, Casanueva-Marenco MJ (2019) Disposable optical sensor for Al(III) ions determination by coupled colorimetric solid-phase extraction-reflectance spectroscopy in leachates from cookware, antacids and hygienic care products. Talanta 205:120102. https ://doi.org/10.1016/j.talan ta.2019.06.102
37. İşlek Y, Henden E (2020) Selective and sensitive fluorimetric deter-mination of aluminium in water samples and dialysis solutions after preconcentration using a novel Ni/NixB nano adsorbent. J Anal Chem 75:167–175. https ://doi.org/10.1134/S1061 93482 00200 45
38. See WP, Heng LY, Nathan S (2015) Highly Sensitive Aluminium(III) ion sensor based on a self-assembled monolayer on a gold nanoparticles modified screen-printed carbon electrode. Anal Sci 31:997–1003. https ://doi.org/10.2116/anals ci.31.997
39. Wu J, Chen X, Wang Q, Bian Y, Zhang K, Sheng Z, Jin J, Yang M, Dai P, Fu X, Chang W, Xie C (2018) Organic–inorganic‐hybrid‐enhancement electro-chemical sensor for determination of Cu (II) in river water. Electroanalysis. https ://doi.org/10.1002/Elan.20180 0056
40. Alibakhshi E, Ghasemi E, Mahdavian M, Ramezanzadeh B, Farashi S (2017) Active corrosion protection of Mg–Al–PO4
3− L.D.H. nanoparticle in silane primer coated with epoxy on mild steel. J Taiwan Inst Chem Eng 75:248–262. https ://doi.org/10.1016/j.jtice .2017.03.010
41. Liu M, Lv G, Mei L, Wei Y, Liu J, Li Z, Liao L (2017) Fabrication of AO/LDH fluorescence composite and its detection of Hg2+ in water. Sci Rep 7:13414–13422. https ://doi.org/10.1038/s4159 8-017-13779 -1
42. Xu ZP, Zeng QH, Lu GQ, Yu AB (2006) Inorganic nanoparticles as carriers for efficient cellular delivery. Chem Eng Sci 61:1027–1040. https ://doi.org/10.1016/j.ces.2005.06.019
43. Li SP, Hou WG, Han SH, Li LF, Zhao WA (2003) Studies on intrinsic ioniza-tion constants of Fe–Al–Mg hydrotalcite-like compounds. J Colloid Interface Sci 257:244–249. https ://doi.org/10.1016/S0021 -9797(02)00062 -0
44. Hu WG, Sun DJ, Zhang CG, Su YL (2001) Studies on zero point of charge and permanent charge density of Mg–Fe hydrotalcite-like compounds. Langmuir 17:1885–1888. https ://doi.org/10.1021/la000 8838
45. Sathish RS, Kumar MR, Rao GN, Kumar KA, Janardhana C (2007) A water-soluble fluorescent fluoride ion probe based on alizarin red S-Al(III) complex. Spectrochim Acta Part A 66:457–461. https ://doi.org/10.1016/j.saa.2006.03.023
46. Rouhani S, Nahavandifard F (2014) Molecular imprinting-based fluo-rescent optosensor using a polymerizable 1,8-naphthalimide dye as a fluorescence functional monomer. Sens Actuators B Chem 197:185–192. https ://doi.org/10.1016/j.snb.2014.02.082
47. Srujana P, Sudhakar P, Radhakrishnan TP (2018) Enhancement of fluorescence efficiency from molecules to materials and the critical role of molecular assembly. J Mater Chem C 6:9314–9329. https ://doi.org/10.1039/C8TC0 3305F
48. Turcanu A, Bechtold T (2011) pH Dependent redox behaviour of Alizarin Red S (1,2-dihydroxy-9,10- anthraquinone-3-sulfonate)—cyclic voltam-metry in presence of dispersed vat dye. Dyes Pigments 91:324–331. https ://doi.org/10.1016/j.dyepi g.2011.04.011
49. Fujikawa H, Yamaguchi S, Matsui K (2018) Spectroscopic study of alizarin and alizarin red adsorbed on anodic aluminum oxide films. Trans Mater Res Soc Jpn 43:197–200. https ://doi.org/10.14723 /tmrsj .43.197
50. Fain VY, Zaitsev BE, Ryabov MA (2004) Metal complexes with alizarin and alizarin red S: electronic absorption spectra and structure of ligands. Russ J Coord Chem 30:365–370. https ://doi.org/10.1023/B:RUCO.00000 26008 .98495 .51
51. Stryjewska E, Rubel S (1991) Adsorptive stripping voltammetry for deter-mination of trace amounts of aluminium with calmagite. Electroanalysis 3:995–998. https ://doi.org/10.1002/elan.11400 30919
52. O’sullivan B (1997) PhD thesis on electroanalysis of aluminum. University of Canterbury, pp 130–160
53. Dos Santos T, Aucélio R, Campos R (2003) Spectrofluorimetric method for the determination of aluminum with alizarin red PS. Microchim Acta 142:63–66. https ://doi.org/10.1007/s0060 4-003-0954-8
54. Moore SA, Glenn KM, Palepu RM (2007) Spectroscopic investigations on the interaction of Crystal Violet with nonionic micelles of Brij and Igepal surfactants in aqueous media. J Solut Chem 36:563–571. https ://doi.org/10.1007/s1095 3-007-9133-6
55. Downard AJ, Kipton H, Powell J, Xu S (1991) Voltammetric determination of aluminium(III) using a chemically modified electrode. Anal Chim Acta 251:157–163. https ://doi.org/10.1016/0003-2670(91)87129 -U
56. Vukomanovic DV, Page JA, Vanloon GW (1991) Voltammetric determina-tion of Al(III) with adsorptive preconcentration of the pyrocatechol violet complex. Can J Chem 69:1418–1426. https ://doi.org/10.1139/v91-210
57. Mashhadizadeh MH, Talemi RP (2011) Used gold nanoparticles as an on/off switch for response of a potentiometric sensor to Al(III) or Cu(II) metal ions. Anal Chim Acta 692:109–115. https ://doi.org/10.1016/j.aca.2011.02.028
58. Shervedani RK, Rezvaninia Z, Sabzyan H, Boeini HZ (2014) Characteriza-tion of gold-thiol-8 hydroxyquinoline self-assembled monolayers for selective recognition of aluminium ion using voltammetry and electro-chemical impedance spectroscopy. Anal Chim Acta 825:34–41. https ://doi.org/10.1016/j.aca.2014.03.041
59. Di J, Bi S, Yang T, Zhang M (2004) Voltammetric determination of alumin-ium (III) using a reagent less sensor fabricated by sol-gel process. Sens Actuators B Chem 99:468–473. https ://doi.org/10.1016/j.snb.2003.12.049
60. Chang SC (2010) Alizarin red S modified electrochemical sensors for the detection of aluminium ion. J Korean Sens Soc 19:421–427. https ://doi.org/10.5369/JSST.2010.19.6.421
Publisher’s NoteSpringer Nature remains neutral with regard to jurisdictional claims in pub-lished maps and institutional affiliations.