Law Firm Employment Practices and the Representation of Minority ...
60
LSAC GRANTS REPORT SERIES Law Firm Employment Practices and the Representation of Minority Associates and Partners Elizabeth H. Gorman University of Virginia Fiona M. Kay Queen’s University, Kingston, Ontario, Canada Law School Admission Council Grants Report 14-01 March 2014 A Publication of the Law School Admission Council
Transcript of Law Firm Employment Practices and the Representation of Minority ...

LSAC GRANTS REPORT SERIES
Law Firm Employment Practices and the Representation of Minority Associates and Partners Elizabeth H. Gorman University of Virginia Fiona M. Kay Queen’s University, Kingston, Ontario, Canada
Law School Admission Council Grants Report 14-01 March 2014
A Publication of the Law School Admission Council
The Law School Admission Council (LSAC) is a nonprofit corporation that provides unique, state-of-the-art products and services to ease the admission process for law schools and their applicants worldwide. Currently, 218 law schools in the United States, Canada, and Australia are members of the Council and benefit from LSAC's services. All law schools approved by the American Bar Association are LSAC members. Canadian law schools recognized by a provincial or territorial law society or government agency are also members. Accredited law schools outside of the United States and Canada are eligible for membership at the discretion of the LSAC Board of Trustees; Melbourne Law School, the University of Melbourne is the first LSAC-member law school outside of North America. Many nonmember schools also take advantage of LSAC’s services. For all users, LSAC strives to provide the highest quality of products, services, and customer service. Founded in 1947, the Council is best known for administering the Law School Admission Test (LSAT®), with about 100,000 tests administered annually at testing centers worldwide. LSAC also processes academic credentials for an average of 60,000 law school applicants annually, provides essential software and information for admission offices and applicants, conducts educational conferences for law school professionals and prelaw advisors, sponsors and publishes research, funds diversity and other outreach grant programs, and publishes LSAT preparation books and law school guides, among many other services. LSAC electronic applications account for 98 percent of all applications to ABA-approved law schools. © 2014 by Law School Admission Council, Inc. All rights reserved. No part of this work, including information, data, or other portions of the work published in electronic form, may be reproduced or transmitted in any form or by any means, electronic or mechanical, including photocopying and recording, or by any information storage and retrieval system, without permission of the publisher. For information, write: Communications, Law School Admission Council, 662 Penn Street, PO Box 40, Newtown, PA, 18940-0040. This study is published and distributed by LSAC.

i
Table of Contents
Executive Summary ...................................................................................................... 1
Introduction: The Underrepresentation of Minorities in Law Firms .......................... 2 Background .......................................................................................................... 3 Research Questions ............................................................................................. 5 Sample and Data .................................................................................................. 6
Where Are the Minorities?
Variation in Representation Across Types of Law Offices .................................. 7 Research Methods ............................................................................................... 8 Findings ................................................................................................................ 9 Discussion .......................................................................................................... 24
Developmental Practices and Minority Representation Among Partners .............. 26
Theory: Effects of Formal and Informal Developmental Practices ...................... 26 Research Methods ............................................................................................. 29 Findings .............................................................................................................. 31 Discussion .......................................................................................................... 39
Comparing the Effects of Developmental Practices Over Time .............................. 42
Research Methods ............................................................................................. 42 Findings and Discussion ..................................................................................... 42
Conclusion ................................................................................................................... 48
References ................................................................................................................... 49


1
Executive Summary
Although law schools have seen rising representation of diverse racial/ethnic groups among students, minorities continue to represent disproportionately small percentages of lawyers within large corporate law firms. Prior research on the nature and causes of minority underrepresentation in such firms has been sparse. In this research project, we examined variation across large U.S. law firms in the representation of three racial/ethnic groups—African Americans, Hispanics, and Asian Americans—using data on a national sample of nearly 1,400 law firm offices from the 2005 edition of the Directory of Legal Employers issued by the National Association for Law Placement (herein referred to as the NALP Directory). In the first phase of our inquiry, we aimed to provide an initial “map” of the topic area and lay the groundwork for future research by exploring the relationship between racial/ethnic composition and a number of salient organizational characteristics, such as location, size, financial resources, and aspects of organizational structure that bear on lawyers’ prospects for upward mobility. Overall, minorities are better represented in offices located in western states and in major metropolitan areas; offices that are larger and affiliated with larger firms; offices of firms with higher revenues and profits per partner; offices with greater associate–partner leverage; and branch offices rather than principal offices. They are equally distributed between offices with single-tiered and two-tiered partnerships. Distinct patterns emerge, however, when the three racial/ethnic groups are considered separately and when hierarchical rank within firms is taken into account.
In the second stage of our investigation, we focused our attention on firms’ formal and informal employment practices relating to the professional development of associates. We asked whether such practices influence the representation among partners of racial/ethnic minorities overall or of African Americans, Latinos, or Asian Americans separately. Junior lawyers’ skills depend on the developmental experiences made available to them at work. Minorities are likely to be disadvantaged in obtaining those experiences, which in turn likely increases their chances of quitting and reduces their chances of promotion. Formal developmental practices could compensate for this disadvantage and could narrow resulting racial/ethnic gaps in technical, cultural, and social resources. Informal practices involving support and cultivation of associates, if offered widely and universally, could overcome senior lawyers’ tendencies to offer more developmental opportunities to Whites. However, we found that formal practices and cultural values intended to aid employee growth and development do not “level the playing field” for minorities. Formal training and mentoring programs do not increase minority presence, while a longer time period to promotion, a cultural commitment to professional development, and a cultural norm of early responsibility are all negatively associated with minority representation. Although the pattern is broadly similar across all three groups, some effects vary in interesting ways.
Lastly, we explored how the effects of firms’ developmental practices changed over the previous decade, a period of transformation for large law firms, by comparing our findings with the results of identical analyses of data from the 1996–1997 edition of the NALP Directory. Despite some differences among the three groups, we found an overall trend toward more negative impacts on minority representation among partners between the 2 years, with many effects shifting from positive to nonsignificant or from

2
nonsignificant to negative over time. As the landscape of the large law firm world shifted during this period, formal and informal developmental practices apparently increasingly benefitted Whites at the expense of minorities.
Introduction: The Underrepresentation of Minorities in Law Firms
Much has changed since the “golden age of the big law firm” (Galanter & Palay, 1991) in the early 1960s, when a “large” American firm employed 40 or 50 lawyers, usually in a single office located in a major city such as Chicago or New York City. At that time, as reported in Smigel’s (1969) classic study, The Wall Street Lawyer, major firms explicitly recruited and promoted lawyers who were not only White and male, but also of Northern European descent, Protestant, and educated at Ivy League colleges and law schools. More broad-minded firms were willing to hire (male) Jews and Catholics, but usually would not make them partners (Smigel, 1969, pp. 44–45, 65–67). Since then, “large” firms have grown to employ hundreds or even thousands of lawyers in multiple offices across the United States and abroad. To what extent have these dramatic changes in law firm size and structure been matched by changes in the hiring and retention of racial/ethnic minorities?
Although large U.S. firms have broadened their horizons to incorporate lawyers from diverse racial/ethnic and cultural backgrounds, including both women and men, the pace of change in such firms has been slow. From the late 1980s to 2009, when we prepared our grant proposal, the percentage of minority law school graduates more than doubled from 10% to 23%, but in 2009 minorities still constituted only 12% of major firm lawyers (National Association for Law Placement, 2009). Furthermore, minority representation steadily declined with increasing hierarchical rank within major firms. In 2009, minorities accounted for 24% of summer associates, 19.7% of regular associates, and a mere 6.0% of partners in such firms (National Association for Law Placement, 2010).
Despite the importance of this continuing underrepresentation, research attention to the issue has been surprisingly sparse. In the case of women, who are similarly underrepresented in major law firms, especially among partners,1 an extensive body of research has investigated the nature and sources of disadvantage (e.g., Beckman & Phillips, 2005; Epstein, Sauté, Oglensky, & Gever, 1995; Gorman, 2005, 2006; Gorman & Kmec, 2009; Hagan & Kay, 1995; Kay & Hagan, 2003; Noonan, Corcoran, & Courant, 2007). In contrast, we were able to locate only a handful of theoretical or empirical studies of racial/ethnic differences in representation and mobility in law firms (Chambliss, 1997; Chambliss & Uggen, 2000; García-López, 2008; Kornhauser & Revesz, 1995; Sander, 2006; Wilkins, 1999; Wilkins & Gulati, 1996). Clearly, this topic is vastly understudied and in need of investigation.
1In 2009, they accounted for 48% of law students, 46.6% of summer associates, 45.7% of regular
associates, and 19.2% of partners (National Association for Law Placement, 2009).
3
Background Given that minority presence among summer associates and entering associates is similar to minority presence among law students, it is likely that minority underrepresentation in law firms is largely shaped by their disproportionately elevated rates of attrition, which have been described as “devastatingly high” (Sander, 2006, p. 1759) and a mass “exodus” (Wilkins, 1999, p. 117), rather than by low rates of entry. Associates are more likely to exit when they perceive their future prospects in a firm as unattractive. In the case of minorities, such perceptions are often realistic. Relative to Whites, minorities are less likely to experience promotion to partnership ranks within firms (Chambliss & Uggen, 2000; Wilkins, 1999) and are more likely to be made nonequity partners (Wilkins, 1999, p. 20).2 In addition, there is evidence of a significant earnings differential among law firm lawyers based on race (Ornstein, 2001, 2004). Racial/ethnic minority law students (Foley & Kidder, 2002) and lawyers (Brockman, 2008) are acutely aware of these inequities. It is not surprising, then, that many minority associates seek to leave corporate law firms while they are still marketable elsewhere (Wilkins, 1999; Wilkins & Gulati, 1996).
Most explanations for minorities’ low rates of representation and success in major U.S. law firms revolve around characteristics of individuals and individual-level interaction, focusing either on racial/ethnic differences in individual employees’ choices and qualifications (“supply-side” processes) or on senior decision-makers’ conscious or unconscious racial/ethnic preferences (“demand-side” processes). On the supply side, one possible explanation for the underrepresentation of racial/ethnic minorities in law firms is that minority lawyers are simply less interested in working in corporate law firms or indeed in any kind of private practice (Abel, 1989, p. 105). However, studies of race and the legal profession suggest that racial/ethnic differences in preferences are not the driving force behind the scarcity of minorities in large firms. Analyzing data from several sources, Sander (2006) found evidence that similar proportions of White and minority law students express aspirations to work in large corporate law firms. In a study of first job choices of New York University and University of Michigan graduates, Kornhauser and Revesz (1995) found that after controlling for academic grades, educational loans, law school activities, and stated preferences, Black law students were more likely to take jobs at corporate law firms than were their White counterparts.
Another possible supply-side explanation is that minorities enter large law firms with lower levels of relevant abilities and skills than their White counterparts, placing them at a disadvantage when they come under consideration for challenging work assignments or promotions (Sander, 2006). Usually thought of as the “human capital” view, this argument also extends to resources beyond cognitive and technical skill, such as cultural competence and social ties (Nee & Sanders, 2001). Importantly, this explanation does not necessarily blame minorities themselves for these deficits, which may be the result of earlier educational, cultural, and social disadvantages. There is
2Minority disadvantage is not unique to law firms. In corporate settings, racial/ethnic minorities also
face lower chances of promotion (James, 2000) and attain lower organizational rank or authority (Elliott & Smith, 2004; Wilson, Sakura-Lemessy, & West, 1999) than do their White counterparts. As a result, minorities are underrepresented among business managers relative to their presence at lower organizational levels (Cohen & Huffman, 2007; Stainback & Tomaskovic-Devey, 2009).
4
some evidence for this view. On average, minority law students’ grades are lower than those of White law students (Clydesdale, 2004; Sander, 2004, 2006), and the number of minority law students hired by large law firms appears to exceed the number of minority law students who have excellent law school grades (Sander, 2006).3 On the other hand, Wilkins and Gulati (1996) report that 70% of all the Black partners listed in the Minority Partners Handbook in 1995 graduated from 1 of 11 elite schools—a considerably higher percentage than the corresponding figure for White partners in most firms. Turning to demand-side processes affecting racial/ethnic inequality in large law firms, partners with decision-making authority may be less likely to select minorities for hiring or promotion due to cognitive biases favoring Whites. First, partners may harbor a conscious or unconscious “in-group preference” for their own racial/ethnic group. Consistent with this argument, Chambliss and Uggen (2000) find evidence that a minority group’s representation among law firm partners positively affects the subsequent representation of that group among associates.4 Second, as Wilkins and Gulati (1996) argue, partners’ impressions and evaluations of minority associates may be biased in negative ways by pervasive racial/ethnic stereotypes. Both kinds of bias may lead organizational leaders to perceive minority employees as less competent than Whites (Reskin, 2001). Laboratory studies suggest that employers hold minorities to stricter standards for demonstrating ability (Foschi, 2009). This problem may be even greater for female minority lawyers, who are burdened by gender stereotypes as well as racial/ethnic ones (American Bar Association, 1994). For example, in García-López’s (2008) qualitative study, female Mexican American lawyers perceived that their contributions were undervalued within firms and that they were assigned responsibilities beneath their capabilities.
A third possibility is that minority and White employees enter organizations with relatively similar levels of technical, cultural, and social resources, but Whites pull ahead during the course of employment as a result of better developmental opportunities. Senior employees typically have considerable discretion in deciding whether they will mentor or sponsor someone for developmental experiences. Due to the cognitive biases noted above, organizational decision-makers often perceive White employees as having greater potential. As a result, through a series of small, informal, and largely unplanned decisions, minority associates may be less likely to receive the training, mentoring, and challenging assignments that are essential for developing skills needed for success in large law firms (Sander, 2006; Wilkins & Gulati, 1996). Although there may be no deliberate intention to exclude minorities, they may experience “benign neglect” (Sander, 2006) or an “absence of advantage” (Di Tomaso, Post, Smith, Farris, & Cordero, 2007) while colleagues and superiors invest heavily in the career development of White employees. Research evidence suggests that, compared to Whites, minorities are less likely to form informal developmental relationships and/or to receive developmental experiences (Sander, 2006; Wilkins & Gulati, 1996). In particular, minority lawyers are less likely than Whites to form a developmental relationship with a
3In the business setting, some qualitative studies find that minorities feel less culturally at ease than
Whites in corporate work environments (Bell & Nkomo, 2001). Minority managers often have less effective social networks (McGuire, 2000) as well, and racial differences in social network composition play a role in explaining the racial gap in promotion to the executive level (Thomas & Gabarro, 1999).
4However, the effect only reached statistical significance for Asian Americans (and women).

5
White mentor (García-López, 2008 ). Research in corporate settings indicates that relationships with White mentors provide improved opportunities for advancement (Elliott & Smith, 2004). In the practice of law, developmental relationships and experiences are vitally important for the cultivation of needed capabilities and resources (Barnhizer, 2003; Hamilton & Brabbit, 2007; McManus, 2005; Reichman & Sterling, 2002). Whereas formal education imparts abstract principles and general analytical skills, the more practical forms of knowledge and skill that are essential for effective functioning are typically acquired in the workplace itself (Schleef, 2006). Mentors serve as advisors, teachers, exemplars, and career advocates; they supply both instrumental help and psychosocial support and provide channels for upward career mobility (Kram, 1985; Ragins, 1997; Ragins & Cotton, 1999). Thus, over time, differential access to developmental opportunities is likely to produce an observable gap in technical, cultural, and cognitive resources between Whites and minorities, even if they entered employment with similar levels of these resources. Indeed, there is evidence that less extensive and effective developmental experiences explain a portion of the racial/ethnic gap in upward organizational mobility (Smith, 2005). Although it is essential to understand these individual-level processes, researchers have paid insufficient attention to the role of organizational characteristics. In the workplace, individual action and interaction take place within the context of organizational structures and practices that facilitate some choices and constrain others (Reskin, 2003; Skaggs, 2009). The prevalence of minority underrepresentation in law firms suggests that similar individual-level processes are operating across law firms, but variations in the pattern indicate that characteristics of firms and offices moderate those processes. Yet we were able to identify only one previous study that examined such variation (Chambliss, 1997). Analyzing data on 97 elite law firms from annual editions of the Directory of Legal Employers issued by the National Association for Law Placement (herein referred to as the NALP Directory) between 1980 and 1990, Chambliss found that a firm’s geographic structure was associated with its racial/ethnic composition: The existence of branch offices was positively linked to the proportion of African American and Asian American associates, and firms that maintained international offices were more racially integrated than firms without such offices. Also important was the nature of the firm’s practice, which presumably reflects its client base. For example, the extent of litigation in a practice was positively associated with the proportion of Hispanic associates. Research Questions
To address this gap in the literature, we began by asking which kinds of firms maintain higher and lower proportions of minorities among their lawyers. Because so little is known on this subject, we did not initially attempt to test a theoretical model. Rather, we aimed to provide an initial “map” of the topic area and lay the groundwork for future research by exploring the relationship between firm racial/ethnic composition and a number of salient organizational characteristics, such as location, size, financial resources, and aspects of organizational structure that bear on lawyers’ prospects for upward mobility. With respect to each of these dimensions, we posed three central

6
questions. First, how does the representation of racial/ethnic minorities vary across different types of law firms? Second, how is this dimension associated with a greater minority presence at different levels of the standard law firm hierarchy? Third, does this organizational characteristic affect African Americans, Latinos, and Asian Americans in similar ways, or does it operate differently for different minority groups?
After this initial inquiry, we focused our attention on firms’ formal and informal employment practices relating to the professional development of associates.5 Formal developmental practices can potentially narrow racial/ethnic differences in developmental opportunity and the resulting gaps in technical, cultural, and social resources by compensating for minorities’ disadvantage in informal access to developmental experiences. Informal practices and norms involving support and cultivation of associates may lead senior lawyers to offer informal training, mentoring, and developmental assignments more widely, not only to those junior lawyers who are perceived as future stars. We asked whether law firms’ formal and informal practices relating to employee development influence the representation among partners of racial/ethnic minorities overall or of African Americans, Latinos, or Asian Americans separately. Lastly, we explored how the role of firms’ developmental practices changed over the previous decade by comparing our 2005 findings with the results of identical analyses of data from 1996. The years between 1996 and 2005 saw an acceleration of significant transformations in the large law firm landscape. As competitive pressures increased, a number of long-established firms went out of business, while others joined forces through mergers. Surviving firms grew dramatically larger and more geographically dispersed across a greater number of national and international offices. Firms increasingly moved away from the traditional “up or out” model by establishing nonequity partner “tiers” and other quasipermanent nonpartner positions. Firms began to make use of temporary and contract lawyers. Improvements in electronic technology increased the pace of legal practice and enabled firms to “outsource” many routine functions previously performed internally. We asked whether firms’ use of formal and informal developmental practices increased or diminished during this period and whether the effects of those practices on minority representation became stronger or weaker. Sample and Data
We analyzed data on nearly 1,400 law firm offices across the United States from the 2005–2006 edition of the NALP Directory. NALP is a nonprofit organization established to provide information about legal employment to law schools and their students.6 The NALP fields an annual survey of all law firms that conduct on-campus recruiting at law schools, asking for quantitative and qualitative information, and compiles the results in annual editions of the NALP Directory. Firms report information as of February 1 of the publication year. Our unit of analysis is the office, not the entire firm. In most cases, law
5Our interest is in practices open to all associates, not those that are targeted at minority lawyers.
6The authors acknowledge that these data were licensed to them by NALP. The views and
conclusions stated herein are those of the authors and do not necessarily reflect the views of NALP or of any individuals associated with NALP.

7
firms with multiple offices provide information pertaining to each office separately; the few firms that did not provide office-specific information were eliminated from the sample. We also removed from the sample any non-firm employers (e.g., government agencies or public interest law offices), offices located outside the United States, and offices with fewer than five lawyers. The final sample includes 1,394 offices. For our comparison of effects over time, we utilized data from the 1996–1997 edition of the NALP Directory (National Association for Law Placement, 1996). The NALP’s questionnaire and mode of data collection did not change between 1996 and 2005. The final 1996 sample includes 888 offices.7 The NALP questionnaire asks each office to report the numbers of African American, Hispanic, and Asian American lawyers it employs, by organizational position (partners, associates, counsel, senior attorneys, staff attorneys, and summer associates). Offices are also asked to report the number of female lawyers in each role. Unfortunately, the racial/ethnic and gender numbers are not cross-tabulated, so we cannot identify the numbers of lawyers who are both minority and female or both minority and male. The NALP Directory does not provide data on revenues, profits, or (in most cases) total firm size. To investigate how minority representation varies with these factors, we merged the NALP Directory data with firm-level measures of size, revenues, and profits from the 2005 AmLaw 200 rankings published in American Lawyer magazine. Similar to the Fortune 500 for corporations, this data source ranks the top 200 U.S. law firms by their gross revenues. Nearly two thirds of the offices in our sample are part of AmLaw 200 firms (N = 835). Analyses involving firm size and profits are restricted to this subsample; in the analysis of firm revenues, non-AmLaw 200 offices constitute the lowest category.
Where Are the Minorities? Variation in Representation Across Types of Law Offices
In our initial inquiry, we examined how minority representation varies with salient organizational characteristics that often influence workplace inequality outcomes. Location (region, large or small city) is likely to be important because African Americans, Latinos, and Asian Americans are differentially distributed across regions and across urban and rural settings in the United States. Different locations also reflect different cultural values that may affect firms’ willingness to hire, train, and promote minority lawyers. Organizational size (both office size and overall firm size) is associated with more bureaucratic structures and with greater visibility and susceptibility to institutional pressures, both of which may push firms toward racial/ethnic equality. Organizational resources (e.g., gross revenues and profits per partner) may enable firms to pursue diversity even if it is financially costly, or they may spark fierce competition that aggravates disadvantages for minority lawyers. Elements of organizational structure (e.g., associate–partner ratio, single- or two-tiered partnership, and principal or branch office) may reduce or enhance minority associates’ partnership prospects as well as their inclination to remain with their firms.
7The 1996 data were obtained from a print copy of the 1996–1997 NALP Directory.

8
Research Methods
For this initial investigation, we did not specify regression models, which represent mathematical expressions of theoretical models of causal processes. Given the paucity of previous empirical research about minorities in law firms (and indeed the relative scarcity of empirical research on minorities in professional roles more generally), we did not have a sufficiently developed theory concerning most organizational characteristics to justify hypothesis testing with a regression model. Regression analyses that are not theoretically driven are often misleading and biased: It is likely that key variables will be omitted, irrelevant variables included, and incorrect functional forms used. Instead, our goal was to lay the groundwork for theory development through bivariate tabular analyses. This sort of descriptive, exploratory analysis is appropriate in areas where theory is nascent (Edmondson & McManus, 2007; for an example relating to organizational inequality, see Roos & Gatta, 2009). For each salient organizational dimension, we first examined its association with all minorities together, then with African Americans, Latinos, and Asian Americans separately. In each case, we also examined how minority presence varied at different ranks in the standard firm hierarchy: summer associate, regular associate, senior nonpartner positions such as “counsel” or “senior attorney,” and partner.8 We define the partner–summer associate ratio as the ratio of the proportion minority among partners to the proportion minority among summer associates. This ratio gives us some purchase, albeit imperfect, on the extent of minority attrition and persistence between initial entry and partnership. Summer associate positions serve as “ports of entry” (Althauser & Kalleberg, 1981) to law firms: Summer associate offer rates in Atlanta, Chicago, New York, and San Francisco have typically exceeded 70%, and many of the most prestigious firms make offers to all of their summer associates (Wilkins & Gulati, 1996). A high proportion of those who receive such offers eventually return. Thus, in their narrative statements in the NALP Directory, many establishments describe their summer associate program as their primary source of new associates. For example, the Washington, D.C., office of Sidley and Austin states, “In recent years, the majority of our associates have come from our summer program”; Seyfarth Shaw’s Chicago office explains, “The Summer Associate Program is the cornerstone of the Firm’s hiring process. … Summer associates are hired with the expectation that they will later return to the Firm as associates.” The partner–summer associate ratio should be interpreted with caution, however, because with cross-sectional data, minority summer associates and minority partners are not the same lawyers. Moreover, the proportion minority among partners is a weighted average of the corresponding proportion in each cohort of partners, and low proportions in the oldest cohorts are likely due to low minority entry rates as associates as well as to attrition of minority lawyers after entry.
8The title “counsel” (and variants such as “special counsel,” “senior counsel,” and so on) can refer to a
variety of statuses, such as former associates who have not been made partners but have been retained as senior employees, and externally recruited senior lawyers who may eventually be made partners. As measured by the NALP, this category may also include former partners who continue to work for their firms on a nonpartnership compensation basis prior to retirement, who are traditionally said to be “of counsel” to their firms.

9
Findings
We first investigated the overall presence of minority lawyers in major U.S. law firms (Table 1). As of 2005, minorities represented 8.9% of lawyers in the average major law firm office. When rank is considered, minority representation declines noticeably and steadily from summer associates (17.8%) to partners (4.9%). Examining ethnic groups separately, we see that 2.5% of lawyers were African American, 2.3% were Latino, and 4.1% were Asian American. The steady decrease with increasing rank is observable for each of the three groups. Interestingly, all three groups have a similar presence among partners (1.6–1.7%), although they begin at different places: Asian Americans are the best represented among summer associates at 7.6%, followed by African Americans at 6.5% and Latinos at 3.4%. The partner–summer associate ratio is noticeably higher for Latinos (47%) than for African Americans (25%) or Asian Americans (22%). TABLE 1 Average minority representation in major U.S. law firm offices, 2005
All Minorities African Americans Latinos Asian Americans
All office lawyersa 8.9% 2.5% 2.3% 4.1%
By rank:
Summer associates 17.8% 6.5% 3.4% 7.6% Associates 13.7% 3.9% 3.2% 6.7% Counsel/sr. attorneys 5.1% 1.7% 1.5% 1.8% Partners 4.9% 1.6% 1.6% 1.7%
Partner–summer associate ratio
28.0% 25.0% 47.0% 22.0%
Note: N = 1,394. aExcluding summer associates.
We then turned to the task of analyzing how minority representation varies with
important organizational characteristics. Location
Regions of the United States are often perceived to harbor different political and
cultural inclinations that may affect minorities’ prospects for workplace mobility and success. The South has had a long a history of racial segregation and political conservatism, while the Northeast and West are usually seen as more liberal. Similarly, metropolitan areas are often thought to be more sophisticated and tolerant than rural areas in ways that may benefit minorities. At the same time, minorities in the general population are differentially distributed across regions of the United States, with Latinos and Asian Americans most prevalent in the West and African Americans best represented in the South (U.S. Census Bureau, 2001). Asian Americans are also concentrated in urban areas (U.S. Census Bureau, 2002). Are minority lawyers more prevalent in offices located in more politically and culturally liberal locations? Or does their representation in law firms reflect their representation in the local population?

10
Minority representation among lawyers in large law firms clearly varies across regions of the United States (Table 2). The overall minority presence is largest in the West, where minorities constitute 12.5% of the average office’s workforce.9 It is smallest in the Midwest, where the corresponding figure is 5.1%. The Midwest also has the lowest minority partner–summer associate ratio (16%). Interestingly, the South has the highest partner–summer associate ratio (35%), with the West close behind (33%). When we examine the three ethnic groups separately, we find that African Americans are best represented in the South, where they constitute 3.1% of lawyers in the average office. Latinos are also most heavily represented in the South (3.4% of lawyers) and Asian Americans in the West (8.0% of lawyers). If we break these numbers down by hierarchical rank, we find the same pattern at the partner level. Both African Americans and Latinos have their strongest representation among partners in the South, where on average they constitute 2.4% and 2.7% of partners, respectively. Asian Americans are best represented among partners in the West, where they make up 3.8% of partners in the average office.
However, patterns of attrition appear to vary for the three groups across regions in interesting ways. Relative to their representation among summer associates, African Americans’ presence among partners is comparable in the Northeast, South, and West (with partner–summer associate ratios of 22%, 29%, and 31%, respectively), but it is markedly lower in the Midwest (14%). Closer inspection shows that this is largely due to substantial drop in the proportion of African Americans from the summer associate level to the associate level (from 9.7% to 3.9%) in the Midwest. Latinos seem to experience the least attrition of the three groups across regions: Latinos’ partner–summer associate ratios are similar in the Northeast, Midwest, and West (at 36%, 30%, and 39%, respectively) and especially high in the South (64%). Yet, Latinos’ representation among summer associates is always noticeably lower than that of one or both of the other two groups. Asian Americans may experience especially high rates of attrition in most regions. Relative to their presence among summer associates, their numbers among partners are quite low in the Northeast, the South, and the Midwest (with partner–summer associate ratios of 14%, 17%, and 14%, respectively). A striking exception to this pattern is in the West, where Asian Americans’ partner–summer associate ratio is 30%.
9The Northeast is defined to include Connecticut, Delaware, the District of Columbia, Maine,
Massachusetts, New Hampshire, New Jersey, New York, Pennsylvania, Rhode Island, and Vermont. The South includes Alabama, Arkansas, Florida, Georgia, Kentucky, Louisiana, Maryland, Mississippi, North Carolina, Oklahoma, South Carolina, Tennessee, Texas, Virginia, and West Virginia. The Midwest includes Indiana, Illinois, Iowa, Kansas, Michigan, Minnesota, Missouri, Nebraska, North Dakota, Ohio, South Dakota, and Wisconsin. The West includes Alaska, Arizona, California, Colorado, Idaho, Montana, Nevada, New Mexico, Hawaii, Oregon, Utah, Washington, and Wyoming.

11
TABLE 2 Average minority representation in major U.S. law firm offices, by U.S. region, 2005
All Minorities
African Americans
Latinos
Asian Americans
All office lawyersa
Northeast 8.5% 2.7% 1.7% 4.1% South 7.9% 3.1% 3.4% 1.5% Midwest 5.1% 2.3% 0.9% 1.9% West 12.5% 1.8% 2.6% 8.0%
By rank: Northeast
Summer associates 17.0% 6.3% 2.2% 8.4% Associates 13.5% 4.0% 2.5% 6.9% Counsel/sr. attorneys 4.3% 1.7% 0.9% 1.7% Partners 3.4% 1.4% 0.8% 1.2%
Partner–summer associate ratio 20.0% 22.0% 36.0% 14.0% South
Summer associates 16.5% 8.2% 4.2% 4.1% Associates 12.4% 5.1% 4.6% 2.7% Counsel/sr. attorneys 5.7% 2.3% 2.7% 0.7% Partners 5.8% 2.4% 2.7% 0.7%
Partner–summer associate ratio 35.0% 29.0% 64.0% 17.0% Midwest
Summer associates 17.4% 9.7% 2.0% 5.7% Associates 8.8% 3.9% 1.6% 3.5% Counsel/sr. attorneys 2.6% 1.4% 0.3% 0.9% Partners 2.8% 1.4% 0.6% 0.8% Partner–summer associate ratio 16.0% 14.0% 30.0% 14.0%
West
Summer associates 20.4% 3.2% 4.6% 12.6% Associates 18.2% 2.8% 3.5% 11.9% Counsel/sr. attorneys 6.8% 1.4% 1.8% 3.6% Partners 6.7% 1.0% 1.8% 3.8%
Partner–summer associate ratio 33.0% 31.0% 39.0% 30.0%
Note: N = 1,394. aExcluding summer associates.
City size also matters (Table 3). Overall, minority lawyers are more likely to be found
in major metropolitan areas, where they constitute 10.6% of lawyers in the average major firm office, than in smaller cities, where the corresponding figure is 6.5%.10 When these numbers are disaggregated by rank, however, we see that minorities comprise roughly the same proportion of partners in both large and small cities (4.9% and 4.8%, respectively). The greater overall representation of minorities in major metropolitan
10
Major metropolitan areas are defined to include greater Atlanta, Boston, Chicago, Dallas–Fort Worth, Detroit, Houston, Los Angeles, New York City, Philadelphia, San Francisco–Oakland–San Jose, and Washington–Baltimore.

12
areas thus reflects their greater presence at lower ranks within those settings. Thus, the minority partner–summer associate ratio is higher in smaller cities (34%) than in larger ones (24%). These overall figures mask variation across the three ethnic groups. The distribution of Asian American lawyers is most heavily tilted toward large cities, while African Americans are closer to being evenly balanced between major metropolitan areas and smaller cities, and Latinos are better represented in smaller cities than in major metropolitan areas. Partner–summer associate ratios are not dramatically different across the two types of settings for African Americans (25% in major metropolitan areas versus 22% in smaller cities) or Latinos (45% versus 51%). Interestingly, the partner–summer associate ratio for Asian Americans is noticeably higher in smaller cities than in large ones (35% versus 19%). TABLE 3 Average minority representation in major U.S. law firm offices, by location in major metropolitan areas versus smaller cities, 2005
All Minorities
African Americans
Latinos
Asian Americans
All office lawyersa
Major metro area 10.6% 2.9% 2.1% 5.6% Smaller city 6.5% 1.9% 2.5% 2.1%
By rank: Major metro area
Summer associates 20.1% 6.5% 3.1% 10.5% Associates 16.3% 4.2% 2.9% 9.1% Counsel/sr. attorneys 5.8% 1.9% 1.6% 2.3% Partners 4.9% 1.6% 1.4% 2.0%
Partner–summer associate ratio 24.0% 25.0% 45.0% 19.0%
Smaller city
Summer associates 14.3% 6.7% 3.7% 3.9% Associates 10.2% 3.5% 3.5% 3.2% Counsel/sr. attorneys 4.0% 1.5% 1.5% 1.0% Partners 4.8% 1.5% 1.9% 1.4%
Partner–summer associate ratio 34.0% 22.0% 51.0% 35.0%
Note: N = 1,394. aExcluding summer associates.
Organizational Size
Organizational size, measured here by number of lawyers, is closely associated with many organizational processes. Size may affect minority representation because it is closely linked to bureaucratization, which may help disadvantaged groups by establishing objective standards and procedures for employee evaluation (Baron, Hannan, Hsu, & Kocak, 2007; Reskin & McBrier, 2000)—but which may also hurt them by constraining them in rigid roles or segregated job ladders (Kalev, 2009; Smith-Doerr,

13
2004). Larger, more visible organizations are also more susceptible to institutional pressures (Edelman, 1990) that should operate to promote diversity. In Table 4 we examine how minority representation varies with the size of the office, where office categories represent quartiles of the distribution of office size. Office size is only weakly associated with minority presence. Minority lawyers represent a somewhat smaller proportion of lawyers in the smallest offices (5–25 lawyers), but they are evenly distributed across offices in the upper three quartiles (26–809 lawyers). Disaggregating these figures by rank, we see that minority presence among summer associates increases steadily with office size. Interestingly, however, minority representation among partners peaks in the second quartile and declines in larger offices. As a result, the partner–summer associate ratio declines from 34% in the second quartile to 28% in the third and 21% in the top quartile. Looking at the three ethnic groups separately, we see that African Americans are best represented in the largest offices (104–809 lawyers), Latinos in the middle two quartiles (26–103 lawyers), and Asian Americans in the second quartile (26–52 lawyers), but the differences across quartiles are not large. When we take hierarchical rank into account, we see that representation among partners follows representation in the office as a whole. At the same time, it is clear that partner–summer associate ratios tend to decline with office size for all three minority groups. This is most obvious in the case of Latinos, where the partner–summer associate ratio plummets from 71% in the smallest offices to 28% in the largest. For African Americans, the partner–summer associate ratio declines from 30% in the second quartile to 22% in the top quartile. Similarly, for Asian Americans, the partner–summer associate ratio falls from 27% in the second quartile to 16% among the largest offices.

14
TABLE 4 Average minority representation in major U.S. law firm offices, by office size, 2005
All Minorities
African Americans
Latinos
Asian Americans
All office lawyersa
5–25 lawyers 7.5% 2.1% 2.2% 3.3% 26–52 lawyers 9.4% 2.4% 2.4% 4.6% 53–103 lawyers 9.4% 2.6% 2.4% 4.4% 104–809 lawyers 9.4% 3.0% 2.1% 4.3%
By rank: 5–25 lawyers
Summer associates 13.4% 4.9% 2.1% 6.3% Associates 11.0% 3.0% 3.0% 5.1% Counsel/sr. attorneys 3.1% 0.9% 1.4% 0.9% Partners 4.2% 1.3% 1.5% 1.4%
Partner–summer associate ratio 31.0% 27.0% 71.0% 22.0% 26–52 lawyers
Summer associates 16.4% 5.3% 2.8% 8.3% Associates 14.4% 4.0% 3.2% 7.1% Counsel/sr. attorneys 5.4% 1.6% 1.5% 2.3% Partners 5.6% 1.6% 1.8% 2.2%
Partner–summer associate ratio 34.0% 30.0% 64.0% 27.0% 53–103 lawyers
Summer associates 19.0% 7.0% 3.9% 8.0% Associates 15.0% 4.2% 3.3% 7.4% Counsel/sr. attorneys 5.4% 2.1% 1.6% 1.7% Partners 5.3% 1.6% 1.8% 1.9%
Partner–summer associate ratio 28.0% 23.0% 46.0% 23.0% 104–809 lawyers
Summer associates 21.4% 8.3% 4.3% 8.8% Associates 15.0% 4.6% 3.2% 7.0% Counsel/sr. attorneys 5.8% 2.2% 1.5% 2.1% Partners 4.4% 1.8% 1.2% 1.4%
Partner–summer associate ratio 21.0% 22.0% 28.0% 16.0%
Note: N = 1,394. aExcluding summer associates.

15
The size of the overall firm is considered in Table 5, where the categories represent quartiles of the distribution of firm size.11 In comparison with office size, there is a somewhat clearer positive association between minority presence and firm size. Minority lawyers represent 7.9% of lawyers in offices affiliated with the smallest firms and 13.2% of lawyers in offices affiliated with the largest firms. The minority presence among summer associates increases with firm size (with the exception of the second quartile). In contrast to the result for office size, however, minority representation among partners increases as well; the minority partner–summer associate ratio tends to increase with firm size.
Considering the three ethnic groups separately, a pattern of increasing representation with firm size is evident for both Latinos and Asian Americans. Latinos make up 2% of lawyers in offices linked to the smallest firms, and 3.4% of lawyers in offices linked to the largest firms. Asian Americans constitute 3.3% of lawyers in offices affiliated with the smallest firms, and 6.7% of lawyers in offices affiliated with the largest firms. Interestingly, the same pattern does not appear for African Americans, who represent 2.7% of lawyers in offices of both the smallest and the largest firms. They are best represented in firms in the third quartile (506–823 lawyers). Offices of firms in the third quartile also attract and retain the most African Americans among summer associates (8.4%), associates (4.5%), and partners (1.8%), compared to other firm size ranges. For Latinos and Asian Americans, the strongest presence at all three of those levels occurs in the largest firms. Once again, partner–summer associate ratios are relatively high for Latinos compared with the other two groups, ranging as high as 81% in the second quartile. In contrast, the partner–summer associate ratio for Asian Americans in the smallest major law firms is only 10%.
11
This analysis is restricted to offices of firms in the 2005 AmLaw 200.

16
TABLE 5 Average minority representation in major U.S. law firm offices, by firm size, 2005
All Minorities
African Americans
Latinos
Asian Americans
All office lawyersa
138–332 lawyers 7.9% 2.7% 2.0% 3.3% 333–505 lawyers 7.7% 2.6% 2.1% 3.1% 506–823 lawyers 11.9% 3.3% 2.4% 6.2% 824–2,984 lawyers 13.2% 2.7% 3.4% 6.7%
By rank: 138–332 lawyers
Summer associates 19.3% 6.4% 3.5% 9.4% Associates 13.3% 4.0% 3.0% 6.3% Counsel/sr. attorneys 5.1% 2.5% 1.2% 1.4% Partners 3.5% 1.4% 1.2% 0.9%
Partner–summer associate ratio 18.0% 22.0% 34.0% 10.0% 333–505 lawyers
Summer associates 13.8% 6.3% 2.1% 5.4% Associates 11.1% 3.5% 2.5% 5.0% Counsel/sr. attorneys 6.5% 2.5% 1.9% 2.1% Partners 4.2% 1.4% 1.7% 1.1%
Partner–summer associate ratio 30.0% 22.0% 81.0% 20.0% 506–823 lawyers
Summer associates 21.8% 8.4% 3.7% 9.7% Associates 17.2% 4.5% 3.2% 9.4% Counsel/sr. attorneys 7.0% 1.8% 2.0% 3.1% Partners 5.5% 1.8% 1.4% 2.3%
Partner–summer associate ratio 25.0% 21.0% 38.0% 24.0% 824–2,984 lawyers
Summer associates 23.7% 6.0% 5.0% 12.8% Associates 19.3% 3.9% 5.2% 10.1% Counsel/sr. attorneys 6.7% 1.3% 2.4% 3.0% Partners 6.4% 1.5% 2.4% 2.5%
Partner–summer associate ratio 27.0% 25.0% 48.0% 20.0%
Note: N = 835 (analysis is restricted to the subsample of offices affiliated with AmLaw 200 firms). aExcluding summer associates.

17
Financial Resources
Are the financial resources at a firm’s disposal a boon or an obstacle for minorities? On the one hand, wealthier firms may be more able to afford to pursue symbolic goals regardless of economic considerations, and thus may make greater efforts to demonstrate a commitment to diversity (Konrad & Pfeffer, 1991). On the other hand, wealthier firms typically offer higher levels of compensation, which in turn may attract large numbers of qualified male White applicants and reduce incentives to overcome bias in hiring and promotion (Blum, Fields, & Goodman, 1994). Table 6 analyzes how minority presence varies with firm gross revenues.12 The top four categories represent quartiles of the distribution of firm revenues as reported in the 2005 AmLaw 200 rankings; the lowest category represents offices affiliated with firms with revenues too low to be included in the AmLaw 200. The patterns here are similar in many respects to those we saw in Table 5. This is not surprising, given that law firm revenues are in large part a function of firm size. When all minorities are considered together, minority representation increases in a fairly straightforward fashion with firm revenues, from 7% in firms with revenues of less than $96 million to 13.3% in firms with $577 million to $1.61 billion in revenues. The minority presence among summer associates increases steadily with firm revenues, but the pattern among partners is less clear-cut. The partner–summer associate ratio is highest in the lowest bracket (34%), drops to its lowest level in the second bracket (21%), and then increases to 25–29% in the top three brackets. When the three ethnic groups are examined separately, we see a generally increasing pattern for all three, although African American representation is strongest in the second-highest revenue bracket while Latinos and Asian Americans are best represented in the highest revenue bracket. Turning to representation by rank, we again see similar patterns for Latinos and Asian Americans and a different pattern for African Americans. Latinos and Asian Americans are both best represented among partners in firms in the top revenue category ($577 million to $1.6 billion) and both have their weakest presence among partners in the second lowest revenue bracket ($96 million to $169.5 million). In contrast, African American representation among partners is fairly stable across revenue brackets at 1.5–1.6%. Interestingly, partner–summer associate ratios are highest for Latinos and Asian Americans in the lowest revenue category (52% and 33%, respectively), whereas they are relatively stable at 22–26% across revenue categories for African Americans (with the exception of a dip in the second-highest category).
12
For analyses involving gross revenues, non-AmLaw 200 offices are included as the lowest category.

18
TABLE 6 Average minority representation in major U.S. law firm offices, by firm gross revenues, 2005
All Minorities
African Americans
Latinos
Asian Americans
All office lawyersa
Less than $96M 7.0% 2.0% 1.9% 3.1%
$96M to $169.5M 6.6% 2.6% 1.5% 2.4% $169.5M to $318.5M 9.0% 2.6% 2.4% 4.0% $318.5M to $577M 11.9% 3.4% 2.6% 5.9% $577M to $1.61B 13.3% 2.7% 3.6% 7.0%
By rank: Less than $96M
Summer associates 14.6% 6.1% 2.9% 5.5% Associates 11.6% 3.9% 2.7% 5.0% Counsel/sr. attorneys 3.1% 1.3% 1.0% 0.9% Partners 4.9% 1.6% 1.5% 1.8%
Partner–summer associate ratio 34.0% 26.0% 52.0% 33.0% $96M to $169.5M
Summer associates 15.8% 6.7% 2.3% 6.7% Associates 11.1% 3.8% 2.3% 5.1% Counsel/sr. attorneys 4.5% 2.8% 0.9% 0.8% Partners 3.3% 1.6% 1.0% 0.7%
Partner–summer associate ratio 21.0% 24.0% 43.0% 10.0% $169.5M to $318.5M
Summer associates 19.1% 6.8% 3.6% 8.7% Associates 13.4% 3.7% 3.2% 6.6% Counsel/sr. attorneys 7.8% 2.1% 2.3% 3.3% Partners 4.8% 1.5% 1.7% 1.6%
Partner–summer associate ratio 25.0% 22.0% 47.0% 18.0% $318.5M to $577M
Summer associates 19.7% 7.9% 3.1% 8.6% Associates 17.3% 4.8% 3.6% 9.0% Counsel/sr. attorneys 5.6% 1.6% 1.8% 2.1% Partners 5.1% 1.5% 1.4% 2.1%
Partner–summer associate ratio 29.0% 19.0% 39.0% 24.0% $577M to $1.61B
Summer associates 24.5% 5.7% 5.3% 13.5% Associates 19.0% 3.7% 5.0% 10.4% Counsel/sr. attorneys 7.6% 1.7% 2.5% 3.4% Partners 6.5% 1.5% 2.4% 2.5%
Partner–summer associate ratio 27.0% 26.0% 45.0% 19.0%
Note: N = 1,394. aExcluding summer associates.

19
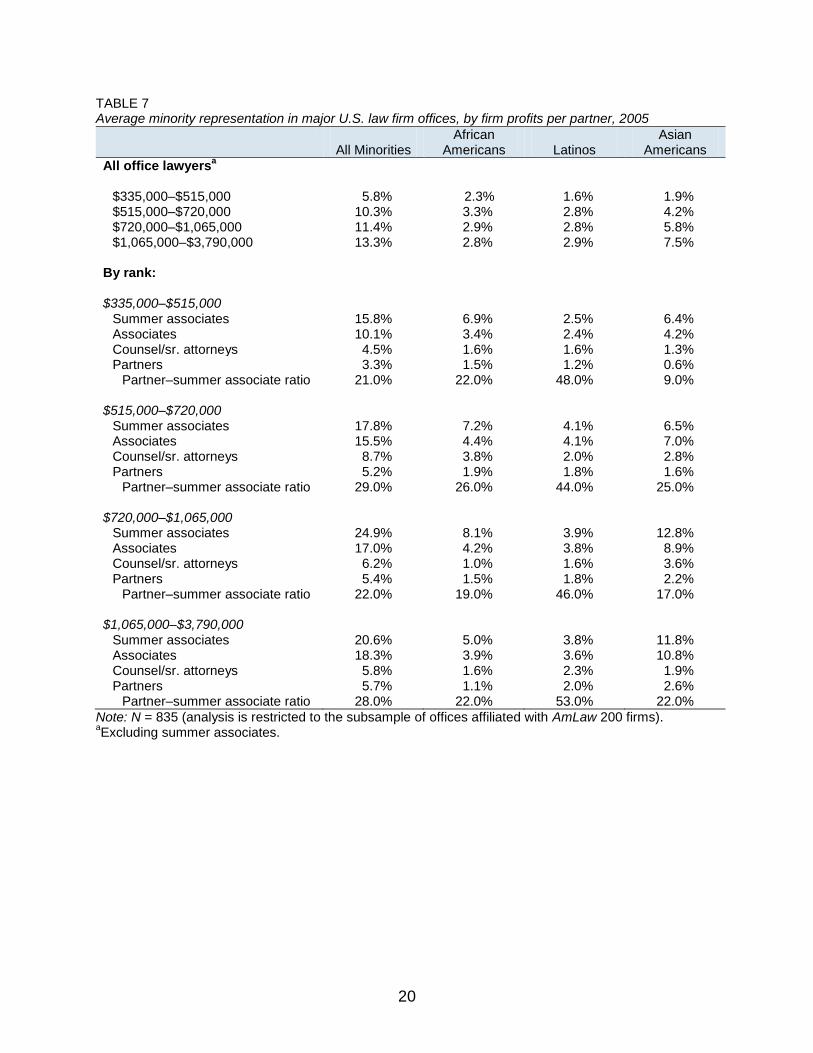
Profits per partner are a more direct indicator of the financial rewards and incentives that firms offer to their successful lawyers (Table 7). In this table, office categories represent quartiles of the distribution of firm profits per partner.13 Overall minority representation increases steadily with firm profits per partner. Disaggregating by rank, it is interesting to note that the minority presence among partners increases sharply from the lowest quartile (3.3%) to the second quartile (5.2%) and only slightly in the third and fourth quartiles (5.4% and 5.7%, respectively). The pattern of a steadily increasing presence among office lawyers holds across all three ethnic groups. When rank is taken into account, an interesting difference emerges, however. Among partners, both Latinos and Asian Americans have their weakest presence in the lowest profit bracket (1.2% and 0.6%, respectively) and their strongest presence in the highest profit bracket (2.0% and 2.6%, respectively). In contrast, African Americans have their strongest presence among partners in the second profit quartile (1.9%) and their weakest presence in the top quartile (1.1%). Once again, Latinos have the highest partner–summer associate ratios, ranging between 44% in the second profit quartile and 53% in the top profit quartile. African American and Asian American partner–summer associate ratios are similar across profit quartiles, with the exception of an unusually low ratio (9%) for Asian Americans in the lowest quartile.
13
This analysis is restricted to offices of firms in the 2005 AmLaw 200.
20
TABLE 7 Average minority representation in major U.S. law firm offices, by firm profits per partner, 2005
All Minorities
African Americans
Latinos
Asian Americans
All office lawyersa
$335,000–$515,000 5.8% 2.3% 1.6% 1.9% $515,000–$720,000 10.3% 3.3% 2.8% 4.2% $720,000–$1,065,000 11.4% 2.9% 2.8% 5.8% $1,065,000–$3,790,000 13.3% 2.8% 2.9% 7.5%
By rank: $335,000–$515,000
Summer associates 15.8% 6.9% 2.5% 6.4% Associates 10.1% 3.4% 2.4% 4.2% Counsel/sr. attorneys 4.5% 1.6% 1.6% 1.3% Partners 3.3% 1.5% 1.2% 0.6%
Partner–summer associate ratio 21.0% 22.0% 48.0% 9.0% $515,000–$720,000
Summer associates 17.8% 7.2% 4.1% 6.5% Associates 15.5% 4.4% 4.1% 7.0% Counsel/sr. attorneys 8.7% 3.8% 2.0% 2.8% Partners 5.2% 1.9% 1.8% 1.6%
Partner–summer associate ratio 29.0% 26.0% 44.0% 25.0% $720,000–$1,065,000
Summer associates 24.9% 8.1% 3.9% 12.8% Associates 17.0% 4.2% 3.8% 8.9% Counsel/sr. attorneys 6.2% 1.0% 1.6% 3.6% Partners 5.4% 1.5% 1.8% 2.2%
Partner–summer associate ratio 22.0% 19.0% 46.0% 17.0% $1,065,000–$3,790,000
Summer associates 20.6% 5.0% 3.8% 11.8% Associates 18.3% 3.9% 3.6% 10.8% Counsel/sr. attorneys 5.8% 1.6% 2.3% 1.9% Partners 5.7% 1.1% 2.0% 2.6%
Partner–summer associate ratio 28.0% 22.0% 53.0% 22.0%
Note: N = 835 (analysis is restricted to the subsample of offices affiliated with AmLaw 200 firms). aExcluding summer associates.

21
Organizational Structure Studies have repeatedly shown that organizational structure can play an important
role in generating or perpetuating workplace inequality. We considered three aspects of organizational structure that bear on lawyers’ mobility prospects and overall job quality: an office’s leverage (i.e., the ratio of its number of associates to its number of partners), whether an office has a two-tiered partnership (i.e., with an upper tier of equity partners and a lower tier of senior salaried lawyers who hold the title of “partner” but do not own equity in the firm), and whether an office is a branch office (rather than its firm’s principal office). All three characteristics tend to make lawyers’ jobs less attractive. Higher leverage is associated with lower chances of making partner and, for those who do become partners, greater pressure to generate business to keep associates employed. In two-tiered partnerships, those in the lower tier of nonequity partners may find themselves in dead-end positions, blocked from advancing to equity partner status. Lawyers in branch offices may have difficulty gaining visibility and access to important information, clients, and political allies. If minorities tend to be relegated to less attractive jobs, are all of these characteristics associated with a greater minority presence? Overall, minority representation increases in a straightforward manner as leverage increases (Table 8). Office categories here represent quartiles of the distribution of leverage. It is noteworthy that more than half of sample offices exhibit leverage values under unity, indicating that the number of partners exceeds the number of associates. (However, leverage values do range up to a maximum of 11.50.) Minorities constitute 6.4% of lawyers, on average, among offices in the bottom leverage quartile and 11.9% of lawyers among offices in the top leverage quartile. By definition, leverage has different implications for associates and partners. We might expect to see more minorities in lower firm ranks and fewer minorities among partners as leverage increases. When we consider all minorities together, in the left-hand column, we see that minority representation among summer associates does indeed increase steadily with leverage. However, the minority presence among partners does not follow a clear pattern. Looking at the three ethnic groups separately in the top panel, we see an increasing pattern among Latinos and Asian Americans across leverage quartiles. In contrast, African American presence remains stable at 2.7% across the top three leverage quartiles. When we look at representation by rank in the three groups, interesting differences appear. The African American presence among partners is weakest in the top leverage quartile, consistent with the pattern for minorities overall, but their presence among associates is strongest in the second quartile rather than the lowest one. For Latinos and Asian Americans, the strongest representation among associates is in the top leverage quartile (3.4% and 9.2%, respectively), consistent with the overall picture, but their strongest representation among partners is also in that quartile (1.8% and 2.0%, respectively). Despite these similarities between Latinos and Asian Americans, we see very different partner–summer associate ratios for the two groups in this top quartile (62% for Latinos and 18% for Asian Americans) due to Asian Americans’ much greater presence among summer associates.

22
TABLE 8 Average minority representation in major U.S. law firm offices, by leverage, 2005
All Minorities
African Americans
Latinos
Asian Americans
All office lawyersa
0–0.63 6.4% 2.0% 1.9% 2.5% 0.64–0.94 7.8% 2.7% 2.1% 3.0% 0.95–1.41 9.5% 2.7% 2.3% 4.6% 1.42–11.50 11.9% 2.7% 2.7% 6.5%
By rank: 0–0.63
Summer associates 15.7% 6.4% 3.2% 6.1% Associates 12.4% 4.3% 3.3% 4.8% Counsel/sr. attorneys 3.6% 1.6% 1.1% 0.9% Partners 5.3% 2.1% 1.5% 1.7%
Partner–summer associate ratio 34.0% 33.0% 47.0% 28.0%
0.64–0.94 Summer associates 16.7% 7.2% 3.8% 5.7% Associates 13.1% 4.6% 3.2% 5.3% Counsel/sr. attorneys 4.3% 1.5% 1.1% 1.6% Partners 4.2% 1.4% 1.4% 1.4%
Partner–summer associate ratio 25.0% 19.0% 37.0% 25.0%
0.95–1.41 Summer associates 19.1% 6.7% 3.5% 8.9% Associates 13.6% 3.6% 2.8% 7.2% Counsel/sr. attorneys 6.9% 1.9% 2.2% 2.8% Partners 5.2% 1.7% 1.7% 1.9%
Partner–summer associate ratio 27.0% 25.0% 49.0% 21.0%
1.42–11.50 Summer associates 19.6% 5.8% 2.9% 10.9% Associates 16.0% 3.3% 3.4% 9.2% Counsel/sr. attorneys 5.6% 1.9% 1.7% 2.0% Partners 4.8% 1.1% 1.8% 2.0%
Partner–summer associate ratio 25.0% 19.0% 62.0% 18.0%
Note: N = 1,394. aExcluding summer associates.
Turning to two-tiered partnerships, this feature is not strongly linked to overall minority presence. Minorities represent 9.0% of lawyers in both single-tiered and two-tiered offices (Table 9). Taking rank into account in the left-hand column, however, reveals that minorities are more prevalent at every level in two-tiered firms, but the partner–summer associate ratio is higher in single-tiered firms. When the three groups are considered separately, across the top panel, we see that African Americans and Latinos are somewhat better represented in two-tiered offices, while Asian Americans actually have a stronger presence in offices with single-tiered partnerships. The same pattern holds when we examine different hierarchical ranks for each group: At every

23
rank, African Americans and Latinos are better represented in two-tiered firms, and Asian Americans are better represented in single-tiered firms (except for similar representation among counsel and senior attorneys in the two settings).
TABLE 9 Average minority representation in major U.S. law firm offices, by partnership structure, 2005
All Minorities
African Americans
Latinos
Asian Americans
All office lawyersa
Single-tiered partnership 9.0% 2.3% 2.0% 4.7% Two-tiered partnership 9.0% 2.7% 2.6% 3.6%
By rank: Single-tiered partnership
Summer associates 16.5% 5.6% 2.8% 8.2% Associates 13.7% 3.8% 2.8% 7.1% Counsel/sr. attorneys 4.5% 1.0% 1.7% 1.8% Partners 4.8% 1.5% 1.3% 2.0%
Partner–summer associate ratio 29.0% 27.0% 46.0% 24.0% Two-tiered partnership
Summer associates 19.2% 7.5% 3.9% 7.8% Associates 13.8% 4.1% 3.5% 6.2% Counsel/sr. attorneys 5.7% 2.5% 1.4% 1.8% Partners 5.0% 1.6% 1.8% 1.5%
Partner–summer associate ratio 26.0% 21.0% 46.0% 19.0%
Note: N = 1,394. aExcluding summer associates.
Minority lawyers are more often located in branch offices, where they constitute
9.9% of lawyers, rather than firms’ principal offices, where they represent 7.5% of lawyers (Table 10). Moreover, minority representation in branch offices is greater at every hierarchical rank. The partner–summer associate ratio is the same in the two types of offices. Looking at the three ethnic groups separately, Latinos and Asian Americans are more prevalent in branch offices. We observe a distinct pattern for African Americans: Although the differences are slight, African Americans are better represented in principal offices than in branch offices at all levels except counsel/senior attorneys. Partner–summer associate ratios for African Americans are similar in the two settings. For Latinos, the partner–summer associate ratio is higher in branch offices, while for Asian Americans it is higher in principal offices.

24
TABLE 10 Average minority representation in major U.S. law firm offices, by principal versus branch office, 2005
All Minorities
African Americans
Latinos
Asian Americans
All office lawyersa
Principal office 7.5% 2.3% 1.6% 3.6% Branch office 9.9% 2.6% 2.7% 4.6%
By rank: Principal office
Summer associates 16.4% 6.6% 3.1% 6.6% Associates 12.4% 4.1% 2.5% 5.8% Counsel/sr. attorneys 3.9% 1.7% 0.9% 1.4% Partners 4.4% 1.6% 1.1% 1.7%
Partner–summer associate ratio 27.0% 24.0% 35.0% 26.0% Branch office
Summer associates 19.0% 6.5% 3.5% 9.0% Associates 14.8% 3.8% 3.6% 7.3% Counsel/sr. attorneys 6.0% 1.8% 2.1% 2.2% Partners 5.2% 1.5% 1.9% 1.8%
Partner–summer associate ratio 27.0% 23.0% 54.0% 20.0%
Note: N = 1,394. aExcluding summer associates.
Discussion
Several key findings emerge from these analyses. First, total minority representation declines noticeably and steadily across the ascending ranks of the typical law firm hierarchy, from summer associates at the bottom to partners at the top. Geographically, overall minority representation is greatest in the West and smallest in the Midwest. Minority lawyers are also better represented in major metropolitan areas than in smaller cities (although closer inspection reveals that this difference arises from the lower ranks; at the partnership level, minority presence is comparable across large and small cities). Firms with more human and financial resources at their disposal seem to be more able or more inclined to pursue lawyer diversity: Minority presence tends to increase with office size, firm size, firm gross revenues, and firm profits per partner. Yet, minority lawyers are also more prevalent in offices with structural features that accentuate workplace inequality. Thus, minority representation tends to be higher in offices with greater leverage, offices with two-tiered partnerships, and branch offices rather than principal offices. Somewhat paradoxically, perhaps, these findings suggest that minorities may be most welcomed in firms and offices that offer both richer potential rewards and lower probabilities of success. Considered separately, the three minority groups examined here present somewhat different profiles. African Americans are best represented in the South and in major metropolitan areas rather than smaller cities. Their representation increases steadily with office size, but they are best represented in the middle ranges of firm size, firm revenues, and firm profits per partner. They are less likely to be found in offices with the

25
lowest leverage. African Americans are more prevalent in offices with two-tiered partnerships and in branch offices. Interestingly, African Americans’ partner–summer associate ratio is highest in the West, even though their representation is lowest in that region. Higher partner–summer associate ratios among African Americans are also associated with the lowest and highest brackets of firm revenues, the lowest leverage quartile and single-tiered partnerships. To the extent that the partner–summer associate ratio sheds light on lawyer persistence and attrition, our findings suggest that African Americans experience better career progress in contexts where they are less numerous. Like African Americans, Latinos are best represented in the South, but unlike African Americans, they are more prevalent in smaller cities than in major metropolitan areas. Although their presence is relatively stable across smaller and larger offices, they are best represented in the biggest firms. Latinos are also more numerous in firms with higher revenues and profits per partner. Latino lawyers’ presence rises with leverage, and they are better represented in offices with two-tiered partnerships and in branch offices. Latinos’ partner–summer associate ratios are higher in the South, in smaller cities, in smaller offices, and in the mid-range of firm size. Higher partner–summer associate ratios are also associated with lower gross revenues, higher profits per partner, higher leverage, and branch offices. Latino partner–summer associate ratios tend to be strikingly higher than those of the other two groups, both overall and within most of the categories specified by various organizational characteristics. These higher partner–summer associate ratios stem primarily from markedly lower representation among summer associates rather than from higher representation among partners. Compared to the other groups, fewer Latinos embark on large-firm careers, but those who do appear to be more successful. Asian Americans are best represented in the West. They are more prevalent in major metropolitan areas than in smaller cities; indeed, among the three groups they are the most unevenly distributed across these two settings. Asian American representation increases slightly with office size and markedly and steadily with firm size, firm gross revenues, and firm profits per partner. Asian American lawyers are more likely to be found in offices with high associate–partner leverage, offices with single-tiered partnerships, and branch offices. Like African Americans, Asian Americans tend to experience higher partner–summer associate ratios in contexts where they are less prevalent. Thus, these ratios are higher in smaller cities; in the middle range of office size and firm size; in firms with lower revenues, profits, and leverage; and in principal offices. Asian Americans experience the lowest partner–summer associate ratios of the three groups, stemming from their unusually high representation among summer associates. In contrast to Latinos, then, large numbers of Asian Americans enter big firms, but few remain to become partners. The similarities and differences in the three groups’ patterns of distribution and attrition are intriguing and suggest a number of questions for future research. For example, why are minorities better represented in offices and firms with greater resources and rewards but lower chances of success? Why do minorities (or at least African Americans and Asian Americans) seem to persist longer in contexts where they are less numerous? And why do Latinos have low entry rates but high persistence, while the pattern is reversed for Asian Americans?

26
Developmental Practices and Minority Representation Among Partners
Theory: Effects of Formal and Informal Developmental Practices
In the second stage of our research, we investigated the consequences of law firms’ developmental practices for the representation of minorities at the partner level. Organizational practices can either substitute for individual-level developmental processes or influence the nature and extent of those processes. Formal Developmental Practices
To a certain extent, formal training can substitute for individually arranged developmental experiences. Like other organizations, law firms offer training in a variety of forms. We focus on relatively intensive and sustained programs consisting of multiple classroom-style sessions in which senior lawyers present information and impart skills, as opposed to brief orientation sessions or occasional workshops. Formal training programs, which seek to ensure that all employees obtain the same baseline level of knowledge and skill, can improve employee performance, job satisfaction, and organizational commitment (Saks, 1996) and increase promotion chances (Tharenou, Latimer, & Conroy, 1994; Wholey, 1990). We suspect that formal training programs are most successful at building technical and cognitive skills and are less effective at conveying culturally valued styles of communication or fostering social network ties to colleagues and clients. Still, to the extent that formal programs make training accessible to all junior employees, they should serve to reduce any skill and productivity gap that might otherwise exist between minorities and Whites and improve minorities’ chances for promotion into management. Firms may also offer formal mentoring programs that match new employees to more senior colleagues (Blake-Beard, 2001). A formal mentoring program ensures that each junior employee is assigned to a mentor and has a contact for guidance. Of course, the benefits of formal mentoring are likely to be weaker than those of informal mentoring relationships, which develop spontaneously and typically have longer durations than formal relationships. Indeed, in a quantitative meta-analytic review, Underhill (2006) reveals that informal mentoring produces larger and more significant effects on career outcomes than formal mentoring. Nonetheless, formal mentoring programs have generally been found to be satisfying to employees and offer such benefits as learning, receiving coaching and psychosocial support (Eby & Lockwood, 2005), developing self-confidence and professional direction (Wanberg, Kammeyer-Mueller, & Marchese, 2006), and realizing opportunities for career progress (Kay, Hagan, & Parker, 2009). Formal mentoring programs may be particularly beneficial to racial/ethnic minorities, who might otherwise have difficulty gaining access to mentoring (McManus, 2005). Indeed, research suggests extensive benefits of formal mentoring programs for racial/ethnic minorities (Ortiz-Walters & Gilson, 2005), and at least one study has found that formal mentoring programs are positively associated with the representation of African Americans among managers (Kalev, Dobbin, & Kelly, 2006).

27
Another important organizational employment practice is the length of the expected or typical “partnership track” period leading up to consideration for promotion. The duration of the partnership track could have either positive or negative consequences for minorities. On the one hand, a longer partnership track could aid minorities by affording them the time to overcome conscious or unconscious employer bias through repeatedly strong performances. Research in corporate settings suggests that minority managers who attain the executive level often take longer to achieve promotion than their White colleagues (Thomas & Gabarro, 1999). On the other hand, a longer track could increase the impact of processes of cumulative advantage and disadvantage. If organizational decision-makers disproportionately select Whites for informal training, mentoring, and developmental assignments, then Whites are likely to gain greater skills and resources, further solidifying the impression that they are more competent and better suited for positions of responsibility and increasing their advantage in the next round of selection. A longer partnership track could worsen minorities’ disadvantage by allowing more repetitions of this cycle. Informal Developmental Practices Informal practices and organizational culture represent two sides of the same coin. Informal practices give rise to cultural values and norms, as “what is” comes to be seen as “what should be” (Barker, 1993). Conversely, organizational culture can shape employee behavior in important ways (Wallace & Leicht, 2004). Three of these practices/values may be especially important for minority success in law firms: commitment to professional development, early delegation of responsibility, and collegiality. For some firms, commitment to the professional development of associates is a central tenet of organizational culture. In some of these organizations, developmental efforts are understood as a professional and ethical obligation (Barnhizer, 2003; McManus, 2005). Others accept the “business case” argument that professional development efforts increase productivity and reduce costs (Montgomery, 2008). Either way, senior lawyers are expected to take responsibility for the formation of less experienced juniors, as a service to the firm or the profession rather than for the purpose of enhancing their own status or political clout. Indeed, studies show that senior employees are more likely to engage in mentoring when they perceive that their organizations encourage it (Allen, Poteet, & Burroughs, 1997; Eby, Lockwood, & Butts, 2006). Like a longer partnership track, a commitment to professional development could be either beneficial or detrimental to the advancement of minorities. It could be beneficial if it leads senior lawyers to offer informal mentoring and developmental experiences more inclusively and consistently to associates of all races and ethnicities. If so, a developmental commitment would increase the probability that Whites and minorities receive similar developmental experiences, which should, in turn, reduce the disparity in their attrition and prospects of promotion to partnership. Consistent with this reasoning, in the corporate setting, at least one study has found that an organizational emphasis on the internal development of employees is positively associated with the presence of African Americans among managers (Fields, Goodman, & Blum, 2005). In contrast, a

28
developmental commitment could be detrimental to minorities if senior lawyers respond by focusing intensified developmental efforts on associates who are socially similar to themselves. In that case, given that most senior lawyers are White, developmental commitment would only aggravate the disadvantage that minorities face in gaining access to developmental experiences.
The nature and direction of the effect may depend on organizational size. A commitment to professional development of associates in general may more easily translate into particularistic ties based on homophily in smaller organizations. In smaller firms with relatively few associates, it may be easier for potential mentors to justify their choice of socially similar protégés by pointing to their individual strengths and apparently greater promise. In larger organizations, which are usually both more bureaucratic and more visible within their organizational fields than smaller organizations, a commitment to professional development may more readily take on an inclusive tone and be viewed as a policy that applies to all.14 The effect of developmental commitment could also depend on the representation of minorities among associates. It may be easier for potential mentors, who are predominantly White in most organizations, to maintain an inclusive, even-handed commitment to the professional growth of all junior lawyers when the numbers of minorities among them are relatively few. As the minority presence among associates grows, White senior lawyers may feel increasingly uncomfortable, and may—consciously or unconsciously—gravitate more strongly toward White protégés.
A second important informal practice is the extent to which senior lawyers delegate responsibility to junior lawyers at early stages of their careers, rather than keeping them under close supervision for long periods of time. Once again, it is possible to foresee both advantages and disadvantages for minorities. On the one hand, early responsibility for strategy formulation and relationships with major clients or customers is highly desirable to the career advancement of junior employees who are aiming for management. Because minority employees may be more likely to find themselves confined to support roles and “back office” tasks than their White counterparts (Sander, 2006), a norm of early responsibility may give them greater access to challenging developmental assignments than they would otherwise receive. On the other hand, early responsibility could operate as a screening device, selecting those who already have the necessary skills—or are able to acquire them quickly on their own—and weeding out the rest. In that case, a practice of early delegation of responsibility could intensify the disadvantage of minorities, whose early missteps are likely to be perceived as evidence of weaker abilities (Center for Accounting Education, 2010; Coleman & Gulati, 2006). A third significant informal practice, or norm, is the extent to which interactions and relationships among lawyers within the organization are collegial in nature. In law firms, the idea of collegiality encompasses both a social atmosphere of openness and trust and a relatively nonhierarchical way of organizing work in which authority is based on expertise rather than formal role (Greenwood & Empson, 2003; Lazega, 2001; Waters, 1989). Whereas the formal differentiation of roles can reinforce racial/ethnic divides, the blurring of role boundaries and collective self-management can benefit minorities
14
In the case of gender, larger bureaucratic firms appear to be more inclusive when it comes to career development and promotion of women (Hagan, Zatz, Arnold, & Kay, 1991).

29
(Kalev, 2009). Indeed, an emphasis on collegiality could tend to reduce the salience of racial/ethnic group boundaries and encourage all lawyers to define a new “in-group” inclusive of all members of the firm (see Reskin, 2001), which could, in turn, increase the accessibility of developmental opportunities for minorities. Research Methods Dependent Variables
We modeled the proportion of partners who belong to any minority group and the separate proportions of partners who are African American, Latino, and Asian American. We followed previous research (Gorman, 2005; Kalev, 2009; Reskin & McBrier, 2000) in transforming these proportions to their log-odds, in order to avoid predicted proportions below 0 and above 1, and because the functional form is likely to provide a better fit to the data. Independent Variables
The first set of independent variables captures formal professional development practices. Binary variables (coded 0–1) indicate whether or not an office offers a formal training program or a formal mentoring program. The typical period of time from entry to promotion, or partnership track length, is measured in years (ranging from 4 to 9.5 years). Measures of informal practices were obtained from the narrative statements that firm offices provided in conjunction with their NALP survey responses.15 The narrative statements were coded by three student research assistants. An initial subsample of 50 cases was coded by all three research assistants, resulting in high intercoder reliabilities. Before the assistants proceeded with additional coding, discrepancies in this subsample were discussed and resolved between the research assistants and the second author. Three binary variables (coded 0–1) measure whether or not the office’s informal practices include a commitment to professional development, a norm of early and substantial responsibility, and an emphasis on collegiality. Control Variables
The rate at which minorities are promoted to partnership depends on their presence among associates. Minority group presence among associates is measured by the proportion of associates who belong to the relevant group. This variable was centered for construction of the interaction term with developmental commitment. Various aspects of jobs and workplaces are also likely to influence the representation of minorities in managerial positions. Organizational size is a perennial subject of interest because it is closely associated with so many organizational processes. Larger, more visible organizations are also more susceptible to institutional pressures (Edelman, 1990) that should operate to promote diversity. Size may also
15
In most cases, offices provide statements independently, but a few firms supply the same
statement for all offices.

30
affect minority representation because it is closely associated with bureaucratization, which may help disadvantaged groups by establishing objective standards and procedures for employee evaluation (Baron et al., 2007). Organizational size is tapped by two measures. Office size is the number of lawyers in the establishment as reported in the 2005 NALP Directory; this variable was centered (i.e., the mean was subtracted from all values) for construction of the interaction term with developmental commitment. Our second measure indicates whether or not the establishment’s firm was included the 2005 AmLaw 200 rankings. As mentioned above, this data source ranks the top 200 U.S. law firms by their gross revenues; because revenues are generated by lawyers’ billable hours, revenues are highly correlated with firm size. To capture bureaucratization more directly, we also include a measure of whether an office is divided by departments (0 if no, 1 if yes).
If employers tend to place Whites ahead of minorities in their “labor queues” for hiring and promotion (Alon, 2004; Reskin & Roos, 1990), then minorities’ prospects depend on the number of available positions relative to the number of White candidates interested in filling them. Thus, characteristics that make jobs more attractive are likely to be negatively associated with the representation of minorities, presumably because they then face greater competition from Whites (and, conversely, characteristics that make jobs less attractive are likely to be positively linked to minority presence). At least one study has found a negative relationship between salary level and minority presence among managers (Fields et al., 2005). Although we do not have data for all cases on partner compensation, we do have a measure of the starting salary paid to associates. Associate and partner compensation are likely to be at least loosely linked. Because starting salaries vary across cities, we use the difference between an office’s starting salary and the city mean. We also included four structural characteristics that are likely to limit lawyers’ opportunities for advancement, recognition, and self-actualization, thus making jobs less appealing to White competitors: leverage, a two-tiered partnership, and branch office status (see Gorman & Kay, 2010). Leverage is measured as the ratio of nonpartner lawyers to partners within the office. Higher leverage is associated with lower chances of making partner and, for those who do become partner, greater pressure to generate business to keep associates employed (but also greater profits in the event of success).16 A dichotomous variable (coded 0–1) indicates the presence of a two-tiered partnership including both traditional, equity-holding partners and salaried lawyers who bear the title of “partner” without its traditional ownership rights; the lower, salaried tier can be a dead end. Another dichotomous variable indicates whether the office is a branch office (0 if headquarters, 1 if branch office); lawyers in a firm’s principal office are likely to have better prospects and perform more interesting work. Finally, three dichotomous variables indicating region of the United States (Midwest, South, and West, with Northeast as the reference category) were included to tap geographical variation in racial/ethnic presence (see Gorman & Kay, 2010).
16
Leverage could also have a negative influence on minority presence among managers, because it is associated with a steeper hierarchical structure and fewer managerial positions to fill. Thus, leverage could mean that employers find it easier to meet their staffing needs with Whites and are not pushed to go deeper into their “labor queues.”

31
Findings
Table 11 reports means, standard deviations, and ranges for the variables used in the analysis. In the average establishment, minorities represented 14% of associates and just 5% of partners. When we consider minority groups separately, we find African Americans made up 4% of associates and 1.6% of partners; Latinos 3% of associates and 1.6% of partners; and Asian Americans 7% of associates and 1.7% of partners. Thus, all three minority groups start out at different levels of representation in the lower ranks of firms, but end up at with a similar presence (1.6–1.7%) among partners. Formal training programs were more common (39% of offices) than formal mentoring programs (less than 21% of offices). A sizable share of establishments (41%) encouraged junior lawyers to take on significant responsibilities early, and the same percentage maintained a commitment to fostering the professional development of junior lawyers. An emphasis on collegiality was present in only 22% of establishments. TABLE 11 Descriptive statistics for selected organizational characteristics, 2005
Variable Mean SD Min. Max.
Group presence among partners: Proportion minority partners .049 .089 0 1 Proportion African American partners .016 .055 0 1 Proportion Latino partners .016 .045 0 .455 Proportion Asian American partners .017 .049 0 .583 Formal training program .391 .488 0 1 Formal mentoring program .205 .404 0 1 Partnership track length 7.66 .821 4 9.5 Cultural value on professional development
.406 .491 0 1
Cultural norm of early responsibility .406 .491 0 1 Cultural value on collegiality .450 .498 0 1 Group presence among associates: Proportion minority associates .138 .129 0 1 Proportion African American associates .040 .062 0 1 Proportion Latino associates .032 .064 0 .833 Proportion Asian American associates .067 .093 0 1 Establishment size 81.604 86.042 5 809 AmLaw 200 .600 .490 0 1 Departments .713 .453 0 1 Starting salary (difference from city mean) −14.99 8,704.761 0 1 Two-tiered partnership .500 .500 0 1 Leverage 1.427 1.055 .133 12.333 Branch .559 .497 0 1 Region Midwest .149 .356 0 1 Region Northeast .306 .461 0 1 Region South .271 .445 0 1 Region West .274 .446 0 1

32
The results of the multivariate regression analyses are presented in Tables 12–15. Huber–White standard errors are used because of likely violations of the assumptions that errors are independent and identically distributed. All Minorities
Table 12 presents the equations modeling the proportion of partners who belong to any of the three minority groups. Model 1 is a baseline model including only control variables. As expected, the proportion minority among associates has a strong positive effect on minority presence among partners. Surprisingly, establishment size has a negative effect. The coefficient on a firm’s membership in the AmLaw 200 is also negative, but the effect does not reach statistical significance. Also unexpected is the negative impact of departmentalization. As we anticipated, minority presence among partners is positively associated with leverage (the ratio of nonpartners to partners) and with status as a branch office, but a two-tiered partnership has no significant effect. Geographically, minority representation is especially high in the West and South, and lowest in the Northeast. These control variable effects do not change substantially across models, except that the coefficient on membership in AmLaw 200 becomes marginally significant (p < .10) when interaction terms are included in Models 3 and 4. Model 2 introduces the professional development variables. Neither formal training programs nor formal mentoring programs are significantly associated with overall minority presence among partners. Longer partnership tracks reduce minority representation. Interestingly, a norm of fostering the professional development of junior employees has a significant negative effect, consistent with the second of our alternative conjectures about the role of this variable. A norm of early responsibility is also negatively linked to minority presence among partners, in line with the second of our alternative arguments. A cultural emphasis on collegiality is not significantly associated with the proportion of minority partners.

33
TABLE 12 Regressions of log-odds of proportion of minorities among partners on selected organizational characteristics, 2005
Variable Model 1 Model 2 Model 3 Model 4
Formal practices Formal training program .008
(.058) .012
(.058) −.001 (.055)
Formal mentoring program
−.079 (.057)
−.081† (.056)
−.066 (.056)
Partnership track length
−.076** (.033)
−.076** (.033)
−.074** (.032)
Informal practices Developmental commitment −.089*
(.049) −.092* (.049)
−.079* (.047)
Developmental commitment × office size
.001* (.001)
Developmental commitment × group presence among associates
−1.059* (.508)
Early responsibility norm −.089* (.046)
−.091* (.046)
−.092* (.045)
Collegiality
.050 (.046)
.051 (.046)
.050 (.046)
Control variables Proportion minority associates 2.632***
(.456) 2.703*** (.453)
2.716*** (.452)
2.639*** (.408)
Establishment size −.002*** (.000)
−.002*** (.000)
−.002*** (.000)
−.002*** (.000)
AmLaw 200 −.059 (.063)
−.032 (.061)
−.032† (.061)
−.023† (.060)
Departments −.167** (.058)
−.141** (.055)
−.136** (.055)
−.151** (.055)
Starting salary (difference from city mean)
.000 (.000)
.000 (.000)
.000 (.000)
.000 (.000)
Two-tiered partnership −.010 (.049)
−.005 (.053)
−.001 (.053)
−.002 (.053)
Leverage .266*** (.028)
.278*** (.030)
.279*** (.030)
.276*** (.029)
Branch .250*** (.071)
.290*** (.072)
.287*** (.073)
.295*** (.071)
Region Midwesta .215**
(.068) .195**
(.069) .194**
(.069) .196**
(.068) Region South .391***
(.059) .337***
(.056) .339***
(.056) .339***
(.056) Region West .380***
(.060) .344***
(.060) .346***
(.060) .351***
(.060) Constant −3.681***
(.100) −3.113***
(.268) −3.307***
(.267) −2.784***
(.261) R
2 .328 .358 .360 .362
N 1,384 1,353 1,353 1,353
Note. Standard errors appear in parentheses. aComparison category is the Northeast region.
†p < .10; *p <.05; **p < .01; ***p < .001.

34
In Model 3, we add an interaction between developmental commitment and office size. Model 4 substitutes an interaction between developmental commitment and minority presence among associates. Because both continuous variables were centered before the multiplicative interaction terms were created, the coefficients on developmental commitment reflect its effect when office size (in Model 3) and proportion of minorities among associates (in Model 4) are at their means. In Model 3, as we anticipated, the coefficient on the interaction with office size is positive and significant, indicating that the negative effect of developmental commitment is weaker in larger offices.17 Conversely, the negative effect of organizational size is only half as strong in offices with a stronger commitment to professional development. The coefficient on the formal mentoring program indicator also becomes marginally significant (p < .10) and negative in this model. In Model 4, also as expected, the coefficient on the interaction with minority group presence among associates is negative, indicating that the negative impact of developmental commitment is especially strong when minorities hold a greater share of associate positions. At the same time, the positive effect of high representation of minorities among the associate ranks is diminished when an office places greater emphasis on professional development. Specific Minority Groups
Table 13 presents results for African American partners. While the pattern of results is similar to those for all minorities jointly, a few differences are worth noting. Partnership track length is not significantly associated with African American presence among partners, whereas it is for minorities overall. The coefficient on a developmental commitment is more negative for African Americans than it is for all minorities together, and the coefficient on the interaction between this cultural value and group presence among associates is nearly three times as large in absolute value for African Americans as it is for minorities overall. Finally, the negative impact of a norm of early responsibility is only marginally significant for African Americans.
Results for Latinos are reported in Table 14. In contrast to the results for all minorities together, formal mentoring programs are significantly negatively associated with Latino representation among partners. Interestingly, the negative impact of developmental commitment is only marginally significant for Latinos (p < .10), and the interaction between this cultural value and group presence among associates is not statistically significant here. A norm of early responsibility also has no significant effect.
17
The effect does not actually become positive until office size reaches 174, nearly the 90th percentile
of the office size distribution in our sample.

35
TABLE 13 Regressions of log-odds of proportion of African Americans among partners on selected organizational characteristics
Variable Model 1 Model 2 Model 3 Model 4
Formal practices Formal training program −.005
(.046) .001
(.046) −.024
(.044) Formal mentoring program .015
(.046) .013
(.045) .021
(.045) Partnership track length −.010
(.028) −.010
(.028) −.010
(.027) Informal practices
Developmental commitment −.123** (.042)
−.129** (.043)
−.119** (.042)
Developmental commitment × office size
.001* (.001)
Developmental commitment × group presence among associates
−2.983** (1.281)
Early responsibility norm −.057† (.038)
−.060† (.038)
−.051† (.038)
Collegiality .029 (.040)
.031 (.041)
.020 (.040)
Control variables Proportion African American
associates 2.717** (1.053)
2.875** (1.037)
2.882** (1.032)
2.425** (.786)
Establishment size −.005*** (.001)
−.005*** (.001)
−.005*** (.001)
−.005*** (.001)
AmLaw 200 .012 (.053)
.024 (.052)
.024 (.053)
.041 (.050)
Departments −.182** (.054)
−.158*** (.049)
−.149** (.050)
−.163*** (.048)
Starting salary (difference from city mean)
.000 (.000)
.000 (.000)
.000 (.000)
.000 (.000)
Two-tiered partnership −.016 (.043)
.011 (.046)
.018 (.046)
.019 (.046)
Leverage .332*** (.029)
.338*** (.030)
.338*** (.030)
.340*** (.028)
Branch .242*** (.064)
.286*** (.068)
.282*** (.068)
.273*** (.068)
Region Midwesta .179**
(.062) .172** (.063)
.170** (.064)
.175** (.063)
Region South .226*** (.056)
.183*** (.051)
.187*** (.051)
.188*** (.051)
Region West .103* (.053)
.097† (.056)
.102† (.056)
.094† (.056)
Constant −3.698*** (.106)
−3.646*** (.244)
−4.126*** (.244)
−3.585*** (.234)
R2 .428 .468 .473 .475
N 1,384 1,353 1,353 1,353
Note. Standard errors appear in parentheses. aComparison category is the Northeast region.
†p < .10; *p < .05; **p < .01; ***p < .001.
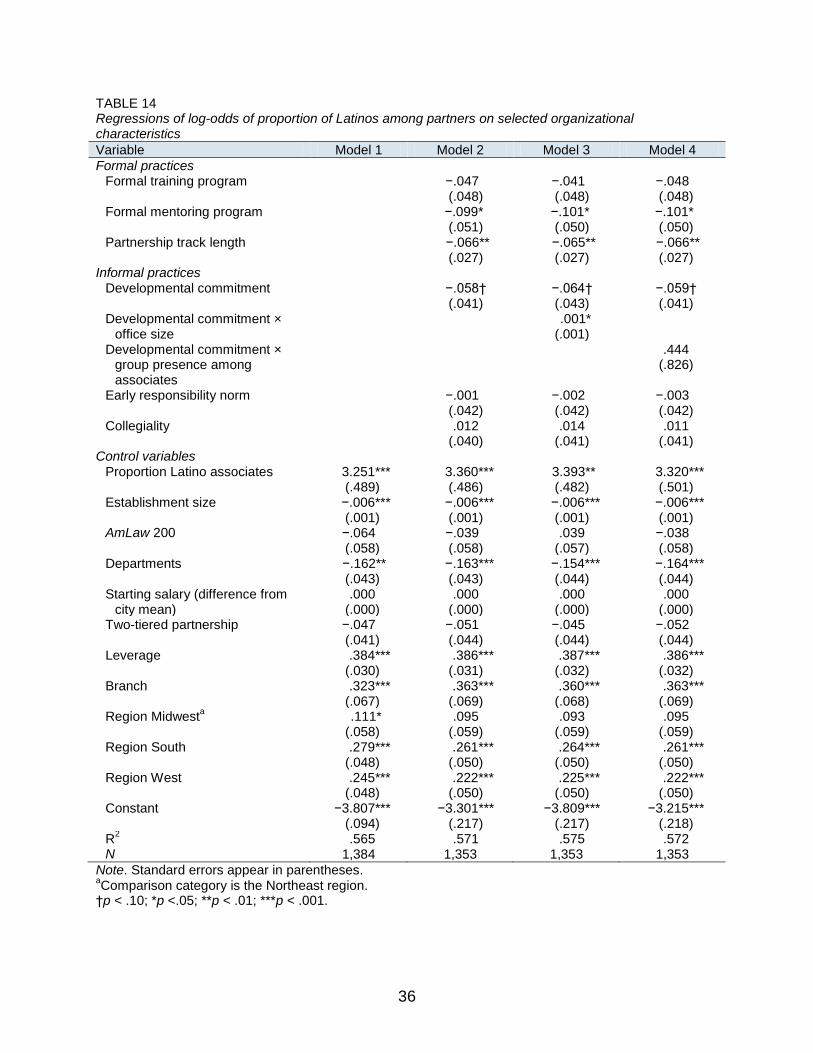
36
TABLE 14 Regressions of log-odds of proportion of Latinos among partners on selected organizational characteristics
Variable Model 1 Model 2 Model 3 Model 4
Formal practices Formal training program −.047
(.048) −.041
(.048) −.048
(.048) Formal mentoring program −.099*
(.051) −.101* (.050)
−.101* (.050)
Partnership track length −.066** (.027)
−.065** (.027)
−.066** (.027)
Informal practices Developmental commitment −.058†
(.041) −.064† (.043)
−.059† (.041)
Developmental commitment × office size
.001* (.001)
Developmental commitment × group presence among associates
.444 (.826)
Early responsibility norm −.001 (.042)
−.002 (.042)
−.003 (.042)
Collegiality .012 (.040)
.014 (.041)
.011 (.041)
Control variables Proportion Latino associates 3.251***
(.489) 3.360***
(.486) 3.393** (.482)
3.320*** (.501)
Establishment size −.006*** (.001)
−.006*** (.001)
−.006*** (.001)
−.006*** (.001)
AmLaw 200 −.064 (.058)
−.039 (.058)
.039 (.057)
−.038 (.058)
Departments −.162** (.043)
−.163*** (.043)
−.154*** (.044)
−.164*** (.044)
Starting salary (difference from city mean)
.000 (.000)
.000 (.000)
.000 (.000)
.000 (.000)
Two-tiered partnership −.047 (.041)
−.051 (.044)
−.045 (.044)
−.052 (.044)
Leverage .384*** (.030)
.386*** (.031)
.387*** (.032)
.386*** (.032)
Branch .323*** (.067)
.363*** (.069)
.360*** (.068)
.363*** (.069)
Region Midwesta .111*
(.058) .095
(.059) .093
(.059) .095
(.059) Region South .279***
(.048) .261***
(.050) .264***
(.050) .261***
(.050) Region West
.245*** (.048)
.222*** (.050)
.225*** (.050)
.222*** (.050)
Constant −3.807*** (.094)
−3.301*** (.217)
−3.809*** (.217)
−3.215*** (.218)
R2 .565 .571 .575 .572
N 1,384 1,353 1,353 1,353
Note. Standard errors appear in parentheses. aComparison category is the Northeast region.
†p < .10; *p <.05; **p < .01; ***p < .001.

37
Finally, Table 15 presents results for Asian Americans. Relative to the results for all minorities together, Asian Americans are distinctive in that the presence of a formal training program is negatively associated with their representation among partners. Intriguingly, developmental commitment has no significant impact for Asian Americans. However, similar to African Americans and unlike Latinos, the interaction between developmental commitment and group presence among associates is negative, indicating that the effect of this cultural emphasis becomes more negative as the Asian American share of associate positions increases. Finally, it is clear that Asian Americans primarily account for the negative impact of norms of early responsibility that we saw for all minorities together in Table 2. There is notable consistency across the different racial/ethnic groups when we examine the control variables. The proportions of all three groups among partners increase with their group’s current representation among associates. Both larger offices and establishments with departments have negative effects on the proportions of all three racial/ethnic groups among firm partners. Leverage and status as a branch office are both positively associated with presence among partners for all three racial/ethnic groups. Only the role of a two-tiered partnership varies: It is negatively linked to representation among partners for Asian Americans, but not for the other two groups.

38
TABLE 15 Regressions of log-odds of proportion of Asian Americans among partners on selected organizational characteristics
Variable Model 1 Model 2 Model 3 Model 4
Formal practices Formal training program −.077*
(.043) −.073* (.043)
−.080* (.043)
Formal mentoring program −.043 (.046)
−.044 (.046)
−.034 (.047)
Partnership track length −.074** (.026)
−.074** (.026)
−.075** (.026)
Informal practices Developmental commitment −.006
(.045) −.010
(.045) −.002
(.045) Developmental commitment ×
office size .001†
(.001)
Developmental commitment × group presence among associates
−1.181* (.513)
Early responsibility norm −.094** (.037)
−.096** (.037)
−.092** (.037)
Collegiality .040 (.037)
.041 (.037)
.039 (.037)
Control variables Proportion Asian American associates
1.625*** (.400)
1.582*** (.409)
1.597*** (.407)
1.570*** (.363)
Establishment size −.006*** (.001)
−.006*** (.001)
−.005*** (.001)
−.005*** (.001)
AmLaw 200 −.094† (.054)
−.072 (.055)
.072 (.054)
−.068 (.054)
Departments −.177** (.048)
−.179*** (.047)
−.173*** (.048)
−.192*** (.048)
Starting salary (difference from city mean)
.000 (.000)
.000 (.000)
.000 (.000)
.000 (.000)
Two-tiered partnership −.081* (.041)
−.092* (.046)
−.088† (.046)
−.094* (.046)
Leverage .337*** (.028)
.341*** (.029)
.341*** (.029)
.337*** (.029)
Branch .345*** (.068)
.388*** (.068)
.386*** (.068)
.397*** (.068)
Region Midwesta .055*
(.058) .034
(.059) .034
(.059) .036
(.058) Region South .027
(.047) −.009
(.047) −.005
(.047) −.009
(.046) Region West .330***
(.052) .297***
(.053) .299***
(.052) .300***
(.052) Constant −3.643***
(.093) −3.047***
(.216) −3.499***
(.212) −2.927***
(.209) R
2 .532 .538 .539 .541
N 1,384 1,353 1,353 1,353
Note. Standard errors appear in parentheses. aComparison category is the Northeast region.
†p < .10; *p < .05; **p < .01; ***p < .001.

39
Discussion
Firms that hope to fill a substantial number of their partner positions through internal promotion have an interest in the growth and development of their associates. Such organizations often maintain both formal and informal practices intended to bolster associates’ technical skills, interpersonal competencies, and social connections. Although these practices and values are not specifically aimed at fostering diversity, it is intuitively appealing to think that minority lawyers might derive particular benefit from them. Whites are likely to have better access to informal developmental opportunities in any event (Kay et al., 2009; Thomas, 1993), so organizational efforts to make developmental experiences uniformly available should help to “level the playing field.” Our findings suggest that this intuitive expectation is misguided. Strikingly, none of the practice characteristics considered here was positively associated with the presence of minorities among partners—the management tier of large law firms. All of them had either negative effects or no effects. Perhaps the most notable finding is that an organizational commitment to fostering and taking responsibility for associates’ professional development works to decrease the proportions of minorities in management. Yet, as institutional theorists have reminded us (Meyer & Rowan 1977), there is often a “loose coupling” between organizations’ formal pronouncements and their implementation. A firm may articulate and celebrate a cultural commitment to the growth and development of junior lawyers, but in practice that commitment may not be fully inclusive. Indeed, senior lawyers who receive cultural encouragement to nurture the progress of associates may simply direct their attention even more vigorously to protégés who are socially similar to themselves. If this interpretation is correct, it may help to explain the unanticipated finding that the negative effect of developmental commitment is strongest for African Americans, marginal for Latinos, and nonsignificant for Asian Americans. It is possible that White senior managers feel the least social dissimilarity and discomfort with Asian American protégés, somewhat more with Latinos, and considerably more with African Americans. Interestingly, we found that both office size and the representation of minorities among associates moderate the impact of commitment to professional development. In the case of office size, the interaction is positive: The negative effect of developmental commitment becomes weaker as office size increases. Although additional research is needed, it is possible that larger offices are better able to translate their values into actual behavior on the part of senior lawyers. Furthermore, in larger offices, mentors and sponsors may be more aware of the organizational context surrounding them and more likely to understand themselves as enacting organizational roles, rather than merely forming personal bonds with protégés. It is also worth noting that, conversely, developmental commitment lessens the negative effect of organizational size. The decline in the proportion of minority partners as office size increases hints that once a firm has demonstrated its political and institutional legitimacy by including a certain number of minorities in its management ranks, further increases in minority presence are seen as unnecessary, regardless of size. An emphasis on professional development may exert pressure to lessen this sort of tokenism.
40
The interaction between developmental commitment and group presence among associates is negative; the negative effect becomes stronger as a greater share of associates are minorities. More research is needed, but it seems that, as minority group presence among associates increases, senior lawyers have increasing difficulty in implementing this commitment in an even-handed way. Sociologists have long argued that racial/ethnic prejudice and discrimination increase as a minority group increases in size and is perceived to pose a greater threat to the dominant group (Blalock, 1967; Quillian, 1995). Consistent with this idea, it may be that, as minority presence among associates grows, White partners increasingly respond to their firm’s cultural mandate by concentrating their mentoring and sponsorship efforts on White protégés. Some research suggests that racial/ethnic minorities are often disadvantaged by a lack of opportunity to take on significant responsibility early in their careers (Sander, 2006). Because they are asked to prove their competence repeatedly before being trusted with challenging tasks, they have fewer opportunities to gain visibility and take longer to advance than their White counterparts (Thomas & Gabarro, 1999). However, early responsibility can be a two-edged sword for minority employees: If they are assigned responsibility and make mistakes, those mistakes are likely to be viewed much more negatively—and more conclusively attributed to weak ability—than the comparable missteps of Whites. Our finding that a norm of early responsibility is negatively associated with minority representation at the partner level suggests that the second process outweighs the first. Formal practices intended to aid associates in building and demonstrating skills and resources also fail to benefit minorities. One might expect that formal training and mentoring programs would help by offsetting minorities’ likely disadvantage in access to informal developmental opportunities. Yet, neither type of program has a positive effect on minority representation among partners. Although formal training programs may provide certain important information and limited opportunities to practice new skills, they likely fall far short of imparting the full range of technical and interpersonal skills that are vital to being perceived as having managerial potential—let alone the social connections and alliances that are essential for success. Formal mentoring programs, as well, are likely too limited in their effects to make a real difference. Research suggests that formal mentoring relationships tend to be shorter in duration, less close, and focused primarily on technical skills and procedures rather than on career planning, advice on office politics, emotional support, and reputation building within the firm (Kay et al., 2009; Ragins & Cotton, 1999; Underhill, 2006). In formal mentoring programs, where matches are assigned rather than arising from interpersonal compatibility, mentors may lack motivation to act on behalf of their associates. Studies have documented some of the challenges of formal mentoring programs, including unmet expectations (on the part of associates), lack of attraction or identification, unbalanced focus on the protégé, forging a post-program relationship, scheduling difficulties, geographic distance, mentor neglect, and feelings of personal inadequacy (by mentors) (Blake-Beard, 2001; Eby & Lockwood, 2005). Thus, while formal training and mentoring programs may be better than nothing, they typically yield more modest career outcomes than informal arrangements (Underhill, 2006). More difficult to understand are the unanticipated negative effects of formal training programs for Asian Americans and of formal mentoring programs for Latinos.
41
The length of the partnership track plays a striking role in shaping racial/ethnic minorities’ representation among managers. Longer probationary periods of this sort are sometimes thought to be beneficial to employees who face a disadvantage of some kind. For example, “mommy tracks” in corporations and paused tenure clocks in universities are meant to allow parents additional time to establish a strong record of performance. Moreover, there is evidence that minorities often require more time than Whites to attain promotion (Thomas & Gabarro, 1999). However, if the same lengthened period is also made available to employees who are not disadvantaged—in this case, Whites—then the extended period may worsen minorities’ promotion prospects by enabling repeated cycles of cumulative advantage for Whites and cumulative disadvantage for minorities. As a result, by the time the normative period to promotion expires, minority associates may, on average, have acquired fewer important skills than their White counterparts, thus limiting their prospects even if the promotion process is entirely fair. Moreover, minority associates, recognizing the compounding effects of being repeatedly passed over for career development experiences, are less likely than Whites to feel committed to a future with the firm and more likely to leave in search of better opportunities elsewhere. These interpretations of our results are necessarily tentative, because our data are subject to several important limitations. First, we lack information on processes at the individual and interactional level, such as characteristics of and ties between minority partners, their White peers, and the decision-makers who originally chose to admit them to the partnership. Second, our data are cross-sectional, so we are unable to determine causal order with certainty. However, the reverse causal order does not seem plausible; it is hard to see why a greater minority presence among partners would make firms less likely to establish practices or uphold values aimed at the internal growth and development of associates. Finally, we only have information on “stocks” and not on “flows.” In other words, we have data on the proportions of partners who were members of various minority groups at a given point in time, but we lack information on the numbers of minorities and Whites entering the partnership through promotion or external hiring and the numbers leaving the partnership through retirement or departure. Broadly speaking, our findings align with the view that the formalization of human resources policies furthers these ends by checking bias and introducing procedural fairness (Reskin & McBrier, 2000). Although formal developmental practices do little to help minorities, our findings suggest that informal, cultural approaches to professional development actively hurt them. No matter how well intentioned such approaches may be, day-to-day behavior in organizations is only loosely coupled to organizational ideals, and policies that are intended to be even handed may not be implemented in that same fashion. Hearing organizational encouragement to provide mentoring and support, senior managers may simply direct their efforts more energetically to aiding protégés who are socially similar to themselves.

42
Comparing the Effects of Developmental Practices Over Time
In a third phase of the project, we explored how the effects of developmental practices on minority representation changed over time between 1996 and 2005. Research Methods
For this comparative analysis, we made use of data from the 1996 edition of the NALP Directory. Because NALP’s questionnaire did not change between 1996 and 2005, we obtained data on the same variables that we utilized in the 2005 data. We again dropped non-firm employers (e.g., government agencies, public interest law offices), offices that provided only firm-wide data, offices located outside the United States, and offices with fewer than five lawyers. The final sample includes 888 law firm offices. Using the 1996 data, we again modeled the proportions of partners who belonged to all racial/ethnic minority groups as well as the proportions who were specifically African American, Latino, and Asian American. As we did with the 2005 data, we transformed those proportions into log-odds and utilized ordinary least-squares techniques to estimate linear models of the association between minority representation and establishment practices. All independent and control measures are the same as those used in the 2005 analyses. Findings and Discussion
Table 16 compares the means of key variables in 1996 and 2005. In the average law firm office in 1996, minority lawyers constituted 11% of associates and 3% of partners; by 2005, those figures had risen to 14% and 5%, respectively. For the most part, firms’ use of formal and informal developmental practices increased during the period between 1996 and 2005. In 1996, 8% of offices had formal mentoring programs and 33% had formal training programs; by 2005, these rates had increased to 23% and 50%, respectively. In 1996, 30% of offices reported a commitment to the development of associates; by 2005, this had risen to 41%. Contrary to widespread perceptions of a decline of collegiality, the share of offices reporting a collegiality norm rose from 32% to 45%. In an exception to this trend, offices reporting a norm of early responsibility dropped from 46% to 40%. The average partnership track length held steady at 7.6 years.

43
TABLE 16 Comparison of means on key variables, 1996 and 2005
Average Office in 1996 Average Office in 2005
Partner percent minority 3% 5%
Associate percent minority 11% 14%
Partnership track (years) 7.6 7.6
Formal mentoring program 8% 23%
Formal training program 33% 50%
Developmental commitment 30% 41%
Early responsibility norm 46% 40%
Collegiality 32% 45%
Tables 17–20 report selected regression results from both years (results for most control variables are omitted for clarity of presentation). The right-hand sides of these tables repeat the key results from Tables 12–15 for ease of comparison. Table 17 compares results for all minorities together. For 1996, the only result that reached statistical significance was the positive moderating effect of office size on the effect of developmental commitment. (In results not shown here, the coefficient for developmental commitment was negative and significant when office size equaled zero.) In comparison, the effects of partnership track length, developmental commitment (main effect), and a norm of early responsibility, all nonsignificant in 1996, became negative and significant in 2005.

44
TABLE 17 Regressions of log-odds of proportion of minorities among partners on selected organizational characteristics
1996 2005
Model 1 Model 2 Model 3 Model 1 Model 2 Model 3
Formal practices
Formal training program .071 .087 .095 .008 .012 −.001
Formal mentoring program
.095 .063 .071 −.079 −.081† −.066
Partnership track length −.005 −.009 −.005 −.076** −.076** −.074**
Informal practices
Developmental commitment
−.078 −.095 −.078 −.089* −.092* −.079*
Devel. commit. × office size
.001* .001*
Devel. commit. × group proportion of associates
−.000 −1.059*
Early responsibility .040 .047 .040 −.089* −.091* −.092*
Collegiality −.004 .003 −.004 .050 .051 .050
Controls
Group prop. of associates 2.587*** 2.582*** 2.587*** 2.703*** 2.716*** 2.639***
Office size −.003*** −.003*** −.003*** −.002*** −.002*** −.002***
Note. Standard errors appear in parentheses; models also include membership in the AmLaw 200, departments, starting salary, two-tiered partnership, leverage, branch office status, and geographical region. †p < .10; *p <.05; **p < .01; ***p < .001.

45
TABLE 18 Regressions of log-odds of proportion of African Americans among partners on selected organizational characteristics
1996 2005
Model 1 Model 2 Model 3 Model 1 Model 2 Model 3
Formal practices
Formal training program .066 .060 .068 −.005 .001 −.024
Formal mentoring program .134† .127† .132† .015 .013 .021
Partnership track length .011 .007 .011 −.010 −.010 −.010
Informal practices
Developmental commitment −.083† −.204* −.102† −.123** −.129** −.119**
Devel. commit. × office size .001† .001*
Devel. commit. × group proportion of associates
.469 ¤ −2.983**
Early responsibility .028 .035 .027 −.057† −.060† −.051†
Collegiality −.043 −.037 −.042 .029 .031 .020
Controls
Group prop. of associates .873* .879* .784 2.875*** 2.882*** 2.425***
Office size −.005*** −.005*** −.005*** −.005*** −.005*** −.005***
Note. Standard errors appear in parentheses; models also include membership in the AmLaw 200, departments, starting salary, two-tiered partnership, leverage, branch office status, and geographical region. †p < .10; *p <.05; **p < .01; ***p < .001.
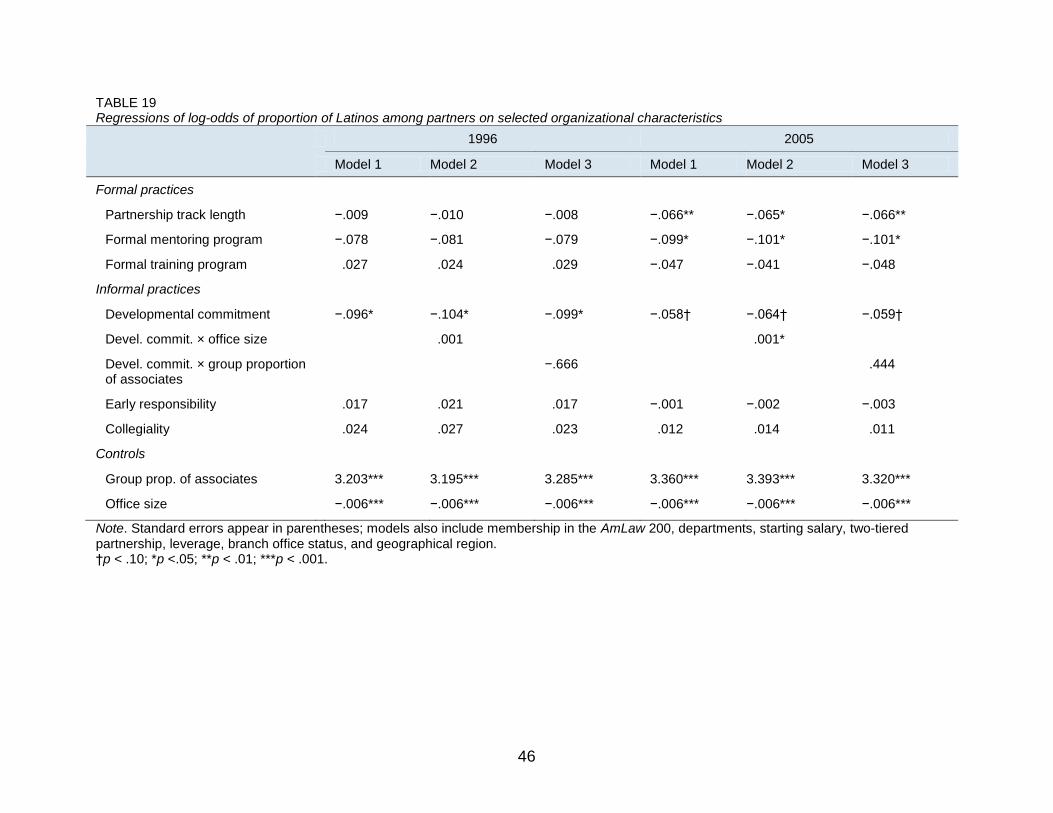
46
TABLE 19 Regressions of log-odds of proportion of Latinos among partners on selected organizational characteristics
1996 2005
Model 1 Model 2 Model 3 Model 1 Model 2 Model 3
Formal practices
Partnership track length −.009 −.010 −.008 −.066** −.065* −.066**
Formal mentoring program −.078 −.081 −.079 −.099* −.101* −.101*
Formal training program .027 .024 .029 −.047 −.041 −.048
Informal practices
Developmental commitment −.096* −.104* −.099* −.058† −.064† −.059†
Devel. commit. × office size .001 .001*
Devel. commit. × group proportion of associates
−.666 .444
Early responsibility .017 .021 .017 −.001 −.002 −.003
Collegiality .024 .027 .023 .012 .014 .011
Controls
Group prop. of associates 3.203*** 3.195*** 3.285*** 3.360*** 3.393*** 3.320***
Office size −.006*** −.006*** −.006*** −.006*** −.006*** −.006***
Note. Standard errors appear in parentheses; models also include membership in the AmLaw 200, departments, starting salary, two-tiered partnership, leverage, branch office status, and geographical region. †p < .10; *p <.05; **p < .01; ***p < .001.

47
TABLE 20 Regressions of log-odds of proportion of Asian Americans among partners on selected organizational characteristics
1996 2005
Model 1 Model 2 Model 3 Model 1 Model 2 Model 3
Formal practices
Partnership track length −.052† −.058* −.052† −.074** −.074** −.075**
Formal mentoring program .063 .052 .064 −.043 −.044 −.034
Formal training program .031 .022 .031 −.077* −.073* −.080*
Informal practices
Developmental commitment −.049 −.071 −.048 −.006 −.010 −.002
Devel. commit. × office size .002** .001*
Devel. commit. × group proportion of associates
−.089 −1.181*
Early responsibility .018 .028 .016 −.094** −.096* −.092**
Collegiality −.029 −.019 −.029 .040 .041 .039
Controls
Group prop. of associates 3.524*** 3.527*** 3.543*** 1.582*** 1.597*** 1.570***
Office size −.007*** −.007*** −.007*** −.006*** −.005*** −.005***
Note. Standard errors appear in parentheses; models also include membership in the AmLaw 200, departments, starting salary, two-tiered partnership, leverage, branch office status, and geographical region. †p < .10; *p <.05; **p < .01; ***p < .001.

48
For African Americans, Table 18 shows that a formal mentoring program had a positive effect on representation among partners in 1996, but that effect became nonsignificant by 2005. The main effect of developmental commitment (Model 1) was negative in both years. The proportion of African Americans among associates did not moderate the impact of developmental commitment in 1996, but in 2005 it had a significant negative moderating effect. Office size, on the other hand, positively moderated the impact of developmental commitment in both years. A norm of early responsibility had no significant effect in 1996, but showed a significant negative effect in 2005.
Among Latinos, both partnership track length and formal mentoring programs had nonsignificant coefficients in 1996, but shifted to significant negative effects in 2005 (Table 19). Developmental commitment had a negative association with representation among partners in both years. Office size did not moderate the effect of developmental commitment in 1996, but it did so in a positive and significant way in 2005. For Asian Americans, Table 20 reports a negative effect of partnership track length in both years. The impact of a formal training program was nonsignificant in 1996 but negative and significant in 2005. Developmental commitment has no significant main effect in either year. Asian American presence among associates did not moderate the effect of developmental commitment in 1996, but it did so in a negative and significant way in 2005. The moderating effect of office size was positive in both years. Despite some differences among the three groups, there is an overall trend toward more negative impacts on minority representation among partners between the two years, with many effects shifting from positive to nonsignificant or from nonsignificant to negative over time. During this period of major transformations in the large law firm world, formal and informal developmental practices apparently increasingly benefitted Whites at the expense of minorities.
Conclusion
To return to our point of departure, has the transformation of the large law firm in recent decades facilitated progress toward increasing racial/ethnic diversity among lawyers working in the big firms? While we cannot provide a definitive answer, our analyses did shed some light on that question. First of all, minority representation is generally strong at the entry level across dimensions of organizational variation. As firms have increasingly ceased to resemble the gentlemen’s clubs of Smigel’s day, both economic interests and institutional pressures have pushed law firms to broaden their recruitment pools. Clearly, large firms have opened the front door to invite minority lawyers over the threshold. Minority underrepresentation in large firms is driven primarily by the steep fall-off in their numbers with greater seniority and higher rank. It is also clear that many of the organizational characteristics associated with recent changes are associated with a greater minority presence. Minority representation tends to be greater in larger firms and in firms with higher revenues and profits. Minorities are also better represented in branch offices, offices with greater leverage, and offices with two-tiered partnerships.

49
On the other hand, a number of our findings suggest that caution is in order. Many law firm practices that are intended—or at least might be expected—to support associate professional development do not increase minority presence among partners; in some cases they actively decrease it. Developmental commitment and a norm of early responsibility apparently only accentuate White lawyers’ advantages. Formal mentoring and training programs do not compensate minorities for reduced access to informal developmental experiences. Longer partnership tracks do not give minorities more time to succeed, but instead allow them to fall further behind. Moreover, these effects seem to have become stronger over time. Although we are now submitting our final report under our grant, we expect to continue to work with these data. Plans for future work include longitudinal analyses of the consequences of organizational conditions in 1996 on minority representation among both partners and associates in 2005, and an investigation of the role of client characteristics on firms’ racial/ethnic and gender diversity. Beyond our own immediate plans, subject to the availability of suitable data, future research should pay particular attention to minority attrition and examine dynamic data on the outflows of racial/ethnic minorities from law firms, and especially from firm partnerships. Even after promotion to partnership, minorities likely face new processes of exclusion and marginalization. Wilkins (1999) has argued that minority partners face obstacles in three crucial areas—recruiting new clients, obtaining internal referrals for work from existing firm clients, and securing the services of adept subordinates—that limit their visibility and influence within their firms and may push them to leave. Future work should also examine how patterns of minority representation and attrition vary by gender.
References
Abel, R. (1989). American lawyers. New York: Oxford University Press.
Allen, T. D., Poteet, M. L., & Burroughs, S. M. (1997). The mentor’s perspective: A qualitative inquiry and future research agenda. Journal of Vocational Behavior, 51, 70–89.
Alon, S. (2004). The gender stratification of employment hardship: Queuing, opportunity structure and economic cycles. Research in Social Stratification and Mobility, 20, 115–143.
Althauser, R. P., & Kalleberg, A. L. (1981). Firms, occupations, and the structure of labor markets: A conceptual analysis. In I. Berg (Ed.), Sociological perspectives on labor markets (pp. 119–149), New York, NY: Academic Press.
American Bar Association. (1994). The burdens of both, the privileges of neither: A report of the Multicultural Women Attorneys’ Network. Chicago, IL: Author.
50
Barker, J. R. (1993). Tightening the iron cage: Concertive control in self-managing teams. Administrative Science Quarterly, 38, 408–437.
Barnhizer, D. (2003). Mentoring as duty and privilege. Michigan Bar Journal, 82, 46–47.
Baron, J. N., Hannan, M. T., Hsu, G., & Kocak, O. (2007). In the company of women: Gender inequality and the logic of bureaucracy in start-up firms. Work and Occupations, 34, 35–66.
Beckman, C. M., & Phillips, D. J. (2005). Interorganizational determinants of promotion: Client leadership and the attainment of women attorneys. American Sociological Review, 70, 678–701.
Bell, E., & Nkomo, S. (2001). Our separate ways: Black and white women and the struggle for professional identity. Boston, MA: Harvard Business School Press.
Blake-Beard, S. D. (2001). Taking a hard look at formal mentoring programs: A consideration of potential challenges facing women. The Journal of Management Development, 20(4), 331–345.
Blalock, H. M. (1967). Toward a theory of minority-group relations. New York, NY: John Wiley & Sons.
Blum, T. C., Fields, D. L., & Goodman, J. S. (1994). Organizational-level determinants of women in management. Academy of Management Journal, 37, 241–268.
Brockman, J. (2008). Racism and legal culture: Is there room for diversity in the legal profession? Alberta Law Review, 45, 75–81.
Center for Accounting Education. (2010). Upward mobility and retention of African Americans within the accounting profession. Washington, DC: Howard University School of Business.
Chambliss, E. (1997). Organizational determinants of law firm integration. American University Law Review, 46, 669–746.
Chambliss, E., & Uggen, C. (2000). Men and women of elite law firms: Reevaluating Kanter’s legacy. Law and Social Inquiry, 25, 41–68.
Clydesdale, T. T. (2004). A forked river runs through law school: Toward understanding race, gender, age, and related gaps in law school performance and bar passage. Law and Social Inquiry, 29, 711–769.
Cohen, P. N., & Huffman, M. L. (2007). Black under-representation in management across US labor markets. Annals of the American Academy of Political and Social Science, 609, 181–199.

51
Coleman, J., & Gulati, M. (2006). A response to Professor Sander: Is it really all about the grades? North Carolina Law Review, 84, 1823–1839.
Di Tomaso, N., Post, C., Smith, D. R., Farris, G., & Cordero, R. (2007). Effects of structural position on allocation and evaluation decisions for scientists and engineers in industrial R&D. Administrative Science Quarterly, 52, 175–207.
Eby, L. T., & Lockwood, A. (2005). Proteges’ and mentors’ reactions to participating in formal mentoring programs: A qualitative investigation. Journal of Vocational Behavior, 67, 441–458.
Eby, L. T., Lockwood, A. L., & Butts, M. (2006). Perceived support for mentoring: A multiple perspectives approach. Journal of Vocational Behavior, 68, 267–291.
Edelman, L. B. (1990). Legal environments and organizational governance: The expansion of due process in the workplace. American Journal of Sociology, 97, 1531–1576.
Edmondson, A., & McManus, S. (2007). Methodological fit in management field research. Academy of Management Review, 32, 1155–1179.
Elliott, J., & Smith, R. (2004). Race, gender, and workplace power. American Sociological Review, 69, 365–386.
Epstein, C. F., Sauté, R., Oglensky, B., & Gever, M. (1995). Glass ceilings and open doors: Women’s advancement in the legal profession. Fordham Law Review, 64, 291–449.
Fields, D. L., Goodman, J. S., & Blum, T. C. (2005). Human resource dependence and organizational demography: A study of minority employment in private sector companies. Journal of Management, 31, 167–185.
Foley, S., & Kidder, D. L. (2002). Hispanic law students’ perceptions of discrimination, justice, and career prospects. Hispanic Journal of Behavioral Sciences, 24(1), 23–37.
Foschi, M. (2009). Gender, performance level, and competence standards in task groups. Social Science Research, 33, 447–457.
Galanter, M., & Palay, T. (1991). Tournament of lawyers: The transformation of the big law firms. Chicago: University of Chicago Press.
García-López, G. (2008). Nunca te toman en cuenta [They never take you into account]: The challenges of inclusion and strategies for success of Chicana attorneys. Gender and Society, 22(5), 590–612.

52
Gorman, E. H. (2005). Gender stereotypes, same-gender preferences, and organizational variation in the hiring of women: Evidence from law firms. American Sociological Review, 70, 702–728.
Gorman, E. H. (2006). Work uncertainty and the promotion of professional women: The case of law firm partnership. Social Forces, 85, 864–890.
Gorman, E. H., & Kay, F. M. (2010). Racial and ethnic minority representation in large U.S. law firms. Studies in Law, Politics, and Society, 52, 211–238.
Gorman, E. H., & Kmec, J. A. (2009). Hierarchical rank and women’s organizational mobility: Glass ceilings in corporate law firms. American Journal of Sociology, 114, 1428–1474.Greenwood, R., & Empson, L. (2003). The professional partnership: Relic or exemplary form of governance? Organization Studies, 24, 909–933.
Hagan, J., & Kay, F. (1995). Gender in practice: A study of lawyers’ lives. Oxford, UK: Oxford University Press.
Hagan, J., Zatz, M., Arnold, B., & Kay, F. (1991). Cultural capital, gender and the structural transformation of legal practice. Law & Society Review, 25(2), 239–262.
Hamilton, N. H., & Brabbit, L. M. (2007). Fostering professionalism through mentoring. Journal of Legal Education, 57(1), 102–129.
James, E. H. (2000). Race-related differences in promotions and support: Underlying effects of human and social capital. Organization Science, 11, 493–508.
Kalev, A. (2009). Cracking the glass cages? Restructuring and ascriptive inequality at work. American Journal of Sociology, 114, 1591–1643.
Kalev, A., Dobbin, F., & Kelly, E. (2006). Best practices or best guesses? Assessing the efficacy of corporate affirmative action and diversity policies. American Sociological Review, 71, 589–617.
Kay, F. M., & Hagan, J. (2003). Building trust: Social capital, distributive justice and loyalty to the firm. Law & Social Inquiry, 28(2), 483–519.
Kay, F. M., Hagan, J., & Parker, P. (2009). Principals in practice: The importance of mentorship in the early stages of career development. Law & Policy, 31(1), 69–110.
Konrad, A., & Pfeffer, J. (1991). Understanding the hiring of women and minorities. Sociology of Education, 70, 151–173.
Kornhauser, L. A., & Revesz, R. L. (1995). Legal education and entry into the legal profession: The role of race, gender, and educational debt. New York University Law Review, 70, 829–964.

53
Kram, K. E. (1985). Mentoring at work: Developmental relationships in organizational life. Glenview, IL: Scott Foresman and Company.
Lazega, E. (2001). The collegial phenomenon: The social mechanisms of cooperation among peers in a corporate law partnership. New York, NY: Oxford University Press.
McGuire, G. M. (2000). Gender, race, ethnicity, and networks: The factors affecting the status of employees’ network members. Work and Occupations, 27, 501–523.
McManus, E. K. (2005). Intimidation and the culture of avoidance: Gender issues and mentoring in law firm practice. Fordham Urban Law Review, 33, 217–231.
Meyer, J., & Rowan, B. (1977). Institutionalized organizations: Formal structure as myth and ceremony. American Journal of Sociology, 83, 340–363.
Montgomery, J. E. (2008). The case for law firm mentoring programs. South Carolina Lawyer, 19, 40–43.
National Association for Law Placement. (1996). Directory of legal employers: 1996–1997. Washington, DC: Author.
National Association for Law Placement. (2005). Directory of legal employers: 2005–2006. Washington, DC: Author.
Nee, V., & Sanders, J. (2001). Understanding the diversity of immigrant incorporation: A forms-of-capital model. Ethnic and Racial Studies, 24(3), 386–411.
Noonan, M. C., Corcoran, M. E., & Courant, P. N. (2007). Is the partnership gap closing for women? Cohort differences in the sex gap in partnership chances. Social Science Research, 37, 156–179.
Ornstein, M. (2001). Lawyers in Ontario: Evidence from the 1996 Census, A Report to the Law Society of Upper Canada. Retrieved from http://rc.lsuc.on.ca/pdf/equity/lawyersinOntario1996.pdf.
Ornstein, M. (2004). The changing face of the legal profession, 1971–2001: A report to the Law Society of Upper Canada. Retrieved from http://www.lsuc.on.ca/media/convoct04_ornstein.pdf.
Ortiz-Walters, R., & Gilson, L. L. (2005). Mentoring in academia: An examination of the experiences of protégés of color. Journal of Vocational Behavior, 67, 459–475.
Quillian, L. (1995). Prejudice as a response to perceived group threat: Population composition and anti-immigrant and racial prejudice in Europe. American Sociological Review, 60, 586–611.

54
Ragins, B. R. (1997). Antecedents of diversified mentoring relationships. Journal of Vocational Behavior, 51, 90–109.
Ragins, B. R., & Cotton, J. L. (1999). Mentor functions and outcomes: A comparison of men and women in formal and informal mentoring relationships. Journal of Applied Psychology, 84, 529–550.
Reichman, N. J., & Sterling, J. S. (2002). Recasting the brass ring: Deconstructing and reconstructing workplace opportunities for women lawyers. Capital University Law Review, 29(4), 923–977.
Reskin, B. F. (2001). Rethinking employment discrimination and its remedies. In M. Guillén, R. Collins, P. England, & M. Meyer (Eds.), The new economic sociology: Developments in an emerging field (pp. 218–244). New York, NY: Russell Sage.
Reskin, B. F. (2003). Including mechanisms in our models of ascriptive inequality. American Sociological Review, 68, 1–21.
Reskin, B. F., & McBrier, D. B. (2000). Why not ascription? Organizations’ employment of male and female managers. American Sociological Review, 65, 210–233.
Reskin, B. F., & Roos, P. (1990). Job queues, gender queues: Explaining women’s inroads into male occupations. Philadelphia, PA: Temple University Press.
Roos, P. A., & Gatta, M. L. (2009). Gender (in)equity in the academy: Subtle mechanisms and the production of inequality. Research in Social Stratification and Mobility, 27, 177–200.
Saks, A. M. (1996). The relationship between the amount and helpfulness of entry training and work outcomes. Human Relations, 49(4), 429–451.
Sander, R. (2004). A systemic analysis of affirmative action in American law schools. Stanford Law Review, 57, 367–483.
Sander, R. (2006). The racial paradox of the corporate law firm. North Carolina Law Review, 84, 1755–1822.
Schleef, D. (2006). Managing elites: Professional socialization in law and business schools. Lanham, MD: Rowman & Littlefield.
Skaggs, S. (2009). Legal-political pressures and African American access to managerial jobs. American Sociological Review, 74, 225–244.
Smigel, E. O. (1969). The Wall Street Lawyer: Professional Organization Man? Bloomington, IN: Indiana University Press.

55
Smith, R. A. (2005). Do the determinants of promotion differ for white men versus women and minorities? An exploration of intersectionalism through sponsored and contest mobility processes. American Behavioral Scientist, 48, 1157–1181.
Smith-Doerr, L. (2004). Flexibility and fairness: Effects of the network form of organization on gender equity in life science careers. Sociological Perspectives, 47, 25–54.
Stainback, K., & Tomaskovic-Devey, D. (2009). Intersections of power and privilege: Long-term trends in managerial representation. American Sociological Review, 74, 800–820.
Tharenou, P., Latimer, S., & Conroy, D. (1994). How do you make it to the top? An examination of women’s and men’s managerial advancement. Academy of Management Journal, 37, 899–931.
Thomas, D. A. (1993). Racial dynamics in cross-race developmental relationships. Administrative Science Quarterly, 38, 169–194.
Thomas, D. A., & Gabarro, J. J. (1999). Breaking through: The making of minority executives in corporate America. Boston, MA: Harvard Business School Press.
Underhill, C. M. (2006). The effectiveness of mentoring programs in corporate settings: A meta-analytical review of the literature. Journal of Vocational Behavior, 68, 292–307.
U.S. Census Bureau. (2001). Mapping Census 2000: The geography of U.S. diversity. Washington, DC: U.S. Department of Commerce.
U.S. Census Bureau. (2002). The Asian population: 2000. Washington, DC: U.S. Department of Commerce.
Wallace, M., & Leicht, K. (2004). Culture wars in the workplace? Cultural antecedents of workers’ job entitlement. Work and Occupations, 31(1), 3–37.
Wanberg, C. R., Kammeyer-Mueller, J., & Marchese, M. (2006). Mentor and protégé predictors and outcomes of mentoring in a formal mentoring program. Journal of Vocational Behavior, 69, 410–423.
Waters, M. (1989). Collegiality, bureaucratization, and professionalization: A Weberian analysis. American Journal of Sociology, 94, 945–972.
Wholey, D. R. (1990). The effects of formal and informal training on tenure and mobility in manufacturing firms. Sociological Quarterly, 31, 37–57.

56
Wilkins, D. (1999). Partners without power? A preliminary look at Black partners in corporate law firms. Journal of the Institute for the Study of Legal Ethics, 2, 15–48.
Wilkins, D., & Gulati, M. (1996). Why are there so few Black lawyers in corporate law firms? An institutional analysis. California Law Review, 84, 493–625.Wilson, G., Sakura-Lemessy, I., & West, J. P. (1999). Reaching the top: Racial differences in mobility paths to upper-tiered occupations. Work and Occupations, 26, 165–186.