Launching Laser Sharp Improvement Projects QI/PCMH Roundtable WACHMC September 25, 2012 Pat Justis,...
50
Launching Laser Sharp Improvement Projects QI/PCMH Roundtable WACHMC September 25, 2012 Pat Justis, MA Medical Home Quality Improvement Manager, DOH
-
Upload
shawn-price -
Category
Documents
-
view
216 -
download
0
Transcript of Launching Laser Sharp Improvement Projects QI/PCMH Roundtable WACHMC September 25, 2012 Pat Justis,...

Launching Laser Sharp Improvement Projects
QI/PCMH Roundtable WACHMC
September 25, 2012Pat Justis, MA
Medical Home Quality Improvement Manager, DOH

Objectives• Examine the first few decisions about project
launch and why they matter.• Discuss scaling projects and how and why to
“chunk it up.”• Explore how measures fit into project
structure.• Practice chunking, sharpening aims and fitting
measures into the structure.• Sprinkle in tips, hints, practical ideas.

MagicIdea for improvement arises
Team launched with exactly the right scope, aim, measures, membership, tools and methods to achieve rapid measurable improvements
Magic occurs SHAZZAM

What are we trying toaccomplish?
How will we know that achange is an improvement?
What change can we make thatwill result in improvement?
Model for Improvement
Act Plan
Study Do

Pat’s traumatic team experience
• Improve the pre-op process

WHY DID THAT AIM STATEMENT PREDICT AGONY?
What do you think happened in the team?

And to measure improvement
How did we know we had improved the pre-op “process?”

The truth…
We were clueless.

Avoid system improvements like the plague.
Improve discrete processes.
Tip: Within every vague, huge sloppy aim…
…Lies a “gem.”
Increase the percentage of History and Physicals on the chart 24 hours prior to scheduled surgery to 100 percent within 3 months.

Not that simple…Patient-Centered Medical Home/ Health Home
• “fundamental reimagination and redesign of practice, replacing old patterns and processes with new ones.”
• “These multiple components of a PCMH are highly interdependent.”
• “ Each component, when implemented, ripples throughout the practice, affecting all other work processes and individual roles.”

Speaking the obvious
• Tasks linked together created processes.(please note: not all tasks are sequential)• Processes linked together create systems.• Often processes have sub-processes; little cul-
de-sacs of activity that emerge from decisions.• Systems linked together create “departments
or divisions” or organizations.

Tom Nolan and company…
Rapid cycle improvement• Chunk it up: ramp up and link small projects.• What can you do by next Tuesday?• Shorten diagnosis: data tells the story.• Spread the wealth…steal shamelessly.• Use change concepts.

The mantra of the paradigm shift
• If you think it will take a year…do it in six months.
• If you think it will take month…do it in a week.• If you think it will take a week…do it in a day.
TIP: Work backwards from a 90 day time frame.

Repeated Use of the PDSA Cycle
Proposals, Theories,
Ideas
Changes That Result in
Improvement
A P
S D
APS
D
A P
S DD S
P ALearn
ing from
Data

Reasons to launch small, rapid projects
• Clarity builds momentum.• A series of small projects aggregate to big
improvements.• Less wasted time and resources.• Action is refreshing and creates energy.

Real time data is closer to actions people feel they can influence.
• Big changes are more acceptable if they rest on small scale successful tests.
• Data builds will.• Frequent, real time data
builds more will than long cycling distant data dumps.
• Quick results inspire.

Aim
Measures
Scope

7
1. What are We Trying To Accomplish?
• The AIM is• Not just a vague desire to do better• A commitment to achieve measured
improvement– In a specific system– With a definite timeline– And numeric goals

20
Aim statement- moves us to action
4 parts–What? – For whom? –By when? –How much? – Measurable and concrete

Measure types
• Outcome; did we achieve the desired result?
• Process; did we consistently perform the process in the way we predict will achieve the desired result?
• Balanced: did our improvement have an unexpected effect downstream or upstream?

Chunking it up coexists with long term aims and outcomes to achieve
• Long term outcome aim:– Decrease complications from diabetes by 25 percent in WA State by 2015.
• Long term outcome aim; sharper– Increase percentage of patients with type 2 diabetes on our panel with BP,
LDL and A1C at targets to 60 percent by 12/2013.
• Process measure linked to improvement.– Percentage of patients with diabetes which meet “out of control” criteria
who have a treat to target contact documented within the last 3 weeks.
• Outcome measure medium term– Percentage of patients on protocol that have a decrease of any amount in
A1C percentage documented for the three month period

PDSA Cycles with process measures
Proposals, Theories,
Ideas
Changes That Result in
Improvement
A P
S D
APS
D
A P
S DD S
P ALearn
ing from
Data
% of providers who use the “out of control criteria” to identify the panel of patients to manage using treat to target protocols
# of provider teams who see or contact at least two patients per week for the treat to target protocol contact.
% of patients who have A1C results available prior to the Tx2Target appt.

Jus ‘saying
• Outcome measures tell us if we picked the right things to improve.
• Process measures tell us if we consistently did what we believe will improve the outcome.

A Brief look at Balancing measures
• Will people or materials flow downstream differently?
• Examples: l length of stay; ? Readmissions
Speed errors
Decisions
Sponsor questions:• Which decisions will be made before the team
launches?
• Which decisions will the team make?
• TIP:BE OVERT about decision making.

Case example
On a recent patient experience survey, a clinic learns 68% of patients are “unhappy” or “very unhappy” with the wait times at the clinic.

Two ways to launch
• The Clinic Administrator picked the front office coordinator to lead this team. Before selecting the team they:– Drew a high level flow
map of the process to determine the first and last step.
– Collected data to determine which steps in the process contributed the longest time in number of minutes.
(patient in room MA interaction completed, before provider enters)
– Wrote an aim, selected team members and defined the measure for the project.

Another way
• Clinic administer asked the front desk coordinator to pick a team.
• At the first meeting she told the team they had three months to improve the patient experience with waits and delays. The solution had to be cost neutral and it had to comply with all laws and regulatory standards. Beyond that, it was up to them.
Considerations
• What are the pros and cons of making most decisions prior to putting a team in the room?
• What are the pros and cons of making few decisions prior to putting a team in the room?

Variables
• Time sensitivity• Leadership capability• Level of commitment and agreement present and
needed to go forward.• Trust and morale• Team experience/tolerance with ambiguity• Passion quota• Risk to patients or employees• Others?

The team wrote their own aim, which would you pick
The Sponsor/Team Leader Aim:
• Reduce percentage of patients who say they are unhappy or very unhappy with wait times to 10 percent or less within three months.
The Team Aim
• Reduce the total number of minutes from the time the patient enters the clinic until they leave the clinic by 50 percent from baseline in three months or less.

Pragmatic work…
• No more long diagnostic journeys
• Analysis paralysis be gone!!
• We need to understand the problems or opportunities just deeply enough to generate reasonable improvement ideas to test.

But what if we fix the wrong thing?
The data will tell you…
AND, there is a role for root cause analysis…
When?

Dig for root causes when…
• …it is so unclear what is causing the effect, that you cannot generate ideas for improvements to test or you generate too many diffuse ideas about what to improve.
• There is a safety adverse event or near miss and you want to understand how to keep it from happening again.
• There is too much cost involved with testing to risk testing the wrong thing.
• There is potential risk or annoyance to patients or employees that makes testing undesirable.

Root cause analysis
• Cause/Effect diagrams• Also called the Fishbone or Ishikawa Diagram• Get in the thinking habit; why does the cause
have a connection to the effect? • Ask why? Five times.

Cause/Effect diagrams
http://www.ihi.org/knowledge/Pages/Tools/CauseandEffectDiagram.aspx

Another way to focus
• Pareto principle: the vital few and the important many
• 20% of the causes will account for 80 percent of the effect.
• Drawback: requires up-front data collection.• A tool of “old school” diagnosis but can be
useful.

Example
• Patient complaints take a sudden spike and stay increased.
• When you get together to figure out how to test improvements, every team member is advocating to fix a different thing, based on what they have personally observed.
• Assign complaint categories; agree on a sorting schema that is reliable.

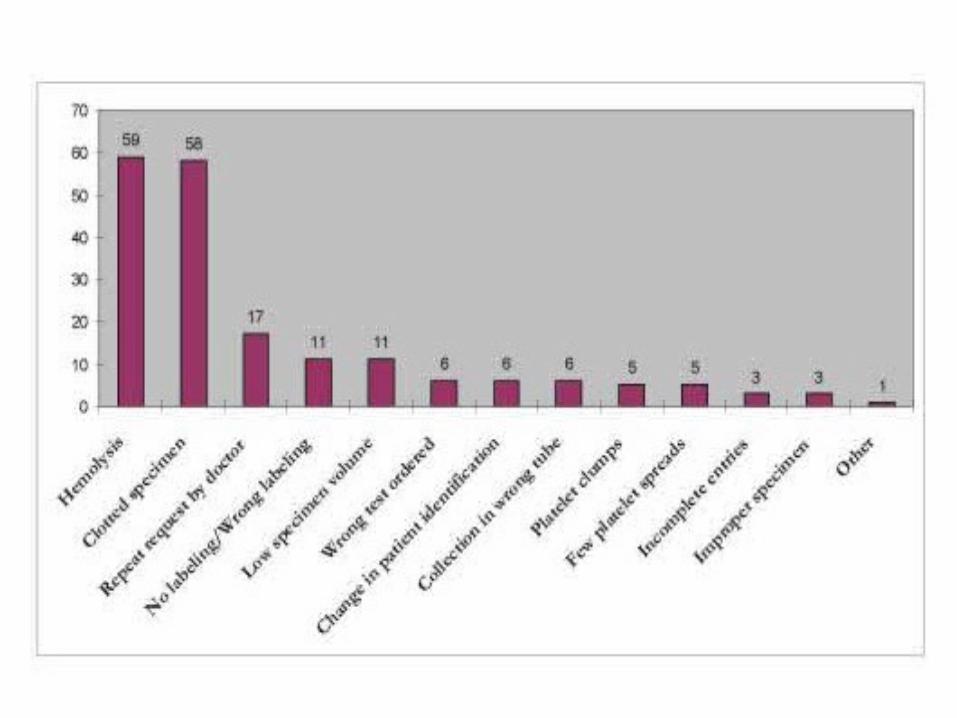
Pareto chart
• A Pareto chart, named after Vilfredo Pareto, is a type of chart that contains both bars and a line graph, where individual values are represented in descending order by bars, and the cumulative total is represented by the line.

Cumulative line graph always
=100 percent
Bars always in descending order


Scope
Always identify the first and last step of the process:
be clear about what you are not improving.

Examples
Improve patient billing• First step possibilities:– Clinical event generates a charge– Statement is generated.– Patient is sent an updated statement after
insurance issues payment and EOB.

Examples
• Increase breastfeeding rates for infants• First step possibilities:– First OB visit– Hospital medical clearance of newborn– First well baby visit

One more early questions:
Do we have a common, standardized process?

Yes or no?
1. If yes, will incremental improvement exceed customer expectations? (If no, see #2)
2. If no, new process or full redesign.

Practicum
• Pick a scenario and define the first and last step to determine the scope, and write an aim for the overall project, the outcome measure linked to the aim, and if you can, envision a first testing cycle and the process measure for the test.
• YOU may use a “real” case if you prefer.

Scenario choices
A:You have decided that your current scheduling system is creating unhappy patients and providers.
Hint: this scenario pushes out another early question: who are we improving the process for, who is the key customer?
B: You want to join the Million Hearts campaign and reduce tobacco use rates among adolescents on your panel.
C: You want to decrease the number of Emergency dept visits for children with asthma.
D: You decide to focus on prevention and want to increase the physical activity level of the patients on your panel.