Latino Demographic Growth in Metropolitan Chicago · Latino groups such as Mexicans and Puerto...
33
A series of papers by the Institute for Latino Studies and research associates Vol. 2004.2 December 2004 Reports Latino Demographic Growth in Metropolitan Chicago Rob Paral, Timothy Ready, Sung Chun, Wei Sun C R esearch Institute for Latino Studies
Transcript of Latino Demographic Growth in Metropolitan Chicago · Latino groups such as Mexicans and Puerto...

A series of papers by the Institute for Latino Studies and research associates
Vol. 2004.2 December 2004
Reports
Latino DemographicGrowth in
Metropolitan Chicago
Rob Paral, Timothy Ready, Sung Chun, Wei Sun
CResearch
Institute for Latino Studies

Institute for Latino Studies, University of Notre Dame230 McKenna Hall, Notre Dame, IN 46556-5685
(574) 631-4440 • email: [email protected] • www.nd.edu/~latino
Latino DemographicGrowth in
Metropolitan ChicagoRob Paral
Timothy ReadySung ChunWei Sun
The Research Reports series is a publication of the Institute for Latino Studies at the University of Notre Dame.Vol. 2004.2, December 2004

C The three wavy lines shown here are a symbol from ancient times representingthe human intellect in action. From The Book of Signs, collected, drawn, andexplained by Rudolf Koch (London: The First Edition Club, 1930, page 8).
The Institute for Latino Studies at the
University of Notre Dame conducts academic
research and public information programs on
the Latino community nationally, Latino
spirituality and culture, Latino religion, and
border and inter-American affairs. Through its
Metropolitan Chicago Initiative, the Institute
conducts data analysis, surveys, and other
research activities in partnership with local
institutions to paint a portrait of the Chicago-
area Latino community and identify its most
critical needs. Other Institute analyses of
Chicago-area Latinos as well as topics related
to the national Latino population may be
found at http://www.nd.edu/~latino/.
Research for this paper was generously
funded by the Chicago Community Trust with
additional support provided by the MacNeal
Health Foundation.

Executive Summary
• About 1.4 million Latinos reside in the Metropolitan Chicago area, comprising 17.4 percent of
area residents.
• The Latino population of Metropolitan Chicago increased by 568,000 between 1990 and 2000,
accounting for more than two-thirds of the region’s net population growth.
• Two-thirds of the region’s Latino population growth took place in the suburbs.
• The six-county metropolitan area has 25 places with a Latino population of at least 6,000
persons. The largest of these is Chicago, with 753,644 Latinos, followed by Cicero, 66,299, and
Aurora, 46,557.
• Although the Latino population grew faster in the suburbs than in Chicago, Latino population
growth in the city was still substantial. Were it not for an increase of more than 210,000
Latinos, the population of the city would have decreased between 1990 and 2000.
• More than half of Chicago’s Latino residents live in only 9 of the city’s 77 community areas;
more than three-fourths reside in 18 of the community areas.
• The 1.1 million people of Mexican origin living in Metropolitan Chicago comprise 75 percent
of the area’s entire Latino population.
• About 150,000 persons of Puerto Rican origin live in Metro Chicago, along with 37,000
Central Americans, 36,000 South Americans, and 17,000 Cubans.
• Some 665,000 Latinos in Metro Chicago are immigrants, representing 47 percent of all area
Latinos.
• During the 1990s the median household income of Chicago-area Latinos increased 10.9
percent, slightly more than that of non-Latino whites. Nevertheless, Latinos’ median
household income of $41,739 was nearly one-third lower than that of non-Latino whites.
• The poverty rate of Latinos in Metropolitan Chicago fell during the 1990s, from 19.9 percent
in 1989 to 16.3 percent in 1999.
• Despite the drop in the poverty rate among Latinos, both the number of Latinos who are poor
and the percentage of all people in poverty who are Latino increased because of the overall
growth in the Latino population during the 1990s.
• In 1990 the Latino population was only about 60 percent as large as the African American
population. By 2000 the two groups were approaching parity, with Latinos amounting to
about 91 percent of the size of the black population.
C 3

C4
About the Researchers
Rob Paral is a research fellow with the American Immigration Law Foundation
in Washington, DC, and with the Institute for Metropolitan Affairs at Roosevelt
University in Chicago. He is also a lecturer on immigration at the Department
of Sociology of DePaul University and may be reached at [email protected].
Timothy Ready, the Institute’s director of research, was a senior program
officer in the Division of Behavioral and Social Sciences and Education at the
National Academies in Washington, DC, prior to coming to Notre Dame. He
has served as assistant vice president for the Association of American Medical
Colleges, where he directed a ten-year national campaign to increase
racial/ethnic diversity in US medical schools and created a network of
community partnerships to increase the number of students pursuing careers in the health
professions. He was also a faculty member in the Department of Anthropology at the Catholic
University of America and has researched and written about Latino health and education issues.
Born in Seoul, Korea, research scientist Sung-Chang Chun received his PhD
from the University of Notre Dame. He was involved in creating the Chicago
Fact Finder and conducting the Chicago Area Survey (www.nd.edu/~latino). He
has written about Latino-origin group population underestimates, Latinos in
distressed communities, wave effect on Cuban political ideology, and black
Latinos. He is now conducting research on Latinos’ remittance behavior, Latinos’ religious
participation and ministry needs, and Latinos’ geographical mobility.
Wei Sun, research associate, received her PhD in economics from the University
of Notre Dame. She has been involved in many research projects within and
outside the Institute, including the Institute's annual Census Workshop, Chicago
Fact Finder, and the Chicago Area Survey. She has been working with Professor
Teresa Ghilarducci of Notre Dame’s Department of Economics for many years
on several pension projects funded by the Retirement Research Foundation. Her
research interests include household savings behavior, retirement income
security, employment benefits, and health economics.

C 5
Table of Contents
Introduction . . . . . . . . . . . . . . . . . . . . . . . . . . . . . . . . . . . . . . . . . . . . . . . . . . . . . . . . . . . . . . . . . . . . . . 6
Latinos and the Changing Racial/Ethnic Mix of Metropolitan Chicago . . . . . . . . . . . . . . . . . . . . . 6
Children . . . . . . . . . . . . . . . . . . . . . . . . . . . . . . . . . . . . . . . . . . . . . . . . . . . . . . . . . . . . . . . . . . . . 8
Places of Origin of Chicago-Area Latinos . . . . . . . . . . . . . . . . . . . . . . . . . . . . . . . . . . . . . . . . . . . . . . 8
The City of Chicago and Its Suburbs . . . . . . . . . . . . . . . . . . . . . . . . . . . . . . . . . . . . . . . . . . . . . . . . . 10
The Role of Immigration . . . . . . . . . . . . . . . . . . . . . . . . . . . . . . . . . . . . . . . . . . . . . . . . . . . . . 11
Income and Poverty Trends . . . . . . . . . . . . . . . . . . . . . . . . . . . . . . . . . . . . . . . . . . . . . . . . . . . 12
Latino Growth at the Local Level . . . . . . . . . . . . . . . . . . . . . . . . . . . . . . . . . . . . . . . . . . . . . . . . . . . . 14
Counties . . . . . . . . . . . . . . . . . . . . . . . . . . . . . . . . . . . . . . . . . . . . . . . . . . . . . . . . . . . . . . . . . . . 14
Places . . . . . . . . . . . . . . . . . . . . . . . . . . . . . . . . . . . . . . . . . . . . . . . . . . . . . . . . . . . . . . . . . . . . . 15
Chicago Neighborhoods. . . . . . . . . . . . . . . . . . . . . . . . . . . . . . . . . . . . . . . . . . . . . . . . . . . . . . 17
Changes at the Census-Tract Level . . . . . . . . . . . . . . . . . . . . . . . . . . . . . . . . . . . . . . . . . . . . . 19
Discussion . . . . . . . . . . . . . . . . . . . . . . . . . . . . . . . . . . . . . . . . . . . . . . . . . . . . . . . . . . . . . . . . . . . . . . . 21
Appendix 1 : Latinos Have Deep Roots in Chicago . . . . . . . . . . . . . . . . . . . . . . . . . . . . . . . . . . . . . 22
Appendix 2 : Tables on Social and Demographic Change in Metropolitan Chicago . . . . . . . . . . 24
Appendix 3 : Community Area Statistics for Chicago . . . . . . . . . . . . . . . . . . . . . . . . . . . . . . . . . . . 28

IntroductionWith 1.4 million members, the Latino community is a large and growing part of the Metropolitan
Chicago region.1 Latinos, who comprise one in six of the region’s residents, are found throughout
the area, from older Chicago neighborhoods to new suburban developments. The population
includes nearly as many foreign-born residents as native-born. While the Latino presence has
become an especially prominent part of the social fabric of the region in recent years, Latinos have
lived in Chicago since the early decades of the twentieth century. During the 1990s two-thirds of
all new residents in the region were Latino.
The Latino population has been
growing very rapidly for several
decades. Between 1970 and 2000 the
region’s Latino population increased
from a little under 330,000 to more
than 1.4 million.2 During this period
the percentage of metropolitan area
residents who are Latino also
increased. In 1970 less than 5 percent
of Metro Chicago residents were
Latino, but by 2000 Latinos were 17.4
percent of area residents.
Based primarily on data from Census 2000, this report profiles major demographic shifts
involving the Latino population in Metropolitan Chicago. These include different growth rates of
Latino groups such as Mexicans and Puerto Ricans, income and poverty trends, residential
patterns, and age distribution.1 Metropolitan Chicago is defined in this report as including Cook, DuPage, Kane, Lake, McHenry, and Will counties.2 The federal government did not develop terminology to classify Latino Census respondents until 1970 when the Census tabu-
lated “Persons of Spanish Language,” and thus our earliest and relatively most complete information on the Latino population(including native- and foreign-born persons of various national origins) dates to that year.
Latinos and the Changing Racial/Ethnic Mix of Metropolitan ChicagoMetropolitan Chicago is home to large numbers of each of the major racial and ethnic groups in
the United States including non-Latino whites, African Americans, Asians, and Latinos. Between
1990 and 2000 the population of Metro Chicago grew by 830,000 persons to reach 8.1 million,
despite the fact that the area’s largest group—non-Latino whites—decreased in number, falling by
119,000 persons.
C6
Figure 1Latino Population in Metro Chicago
329,900
579,914
839,905
1,405,11617.4%
11.5%
8.2%
4.8%
0
200,000
400,000
600,000
800,000
1,000,000
1,200,000
1,400,000
1,600,000
1970 1980 1990 2000
0%
2%
4%
6%
8%
10%
12%
14%
16%
18%
20%
LatinoPopulation
Latino Percentof Total Population

Figure 2Racial and Ethnic Composition of Metropolitan Chicago,
in Percentages: 1990 and 20001990
White 65.5%
Latino 11.5%
Black 19.4%
Other 0.2%
Asian 3.3%
2000Other 1.7%
Asian 4.6%
Latino 17.4%
Black 19.0%
White 57.3%
The size of these different populations is changing in different ways, causing shifts in the racial and
ethnic composition of Metro Chicago. As the non-Latino white population has become smaller in
the Chicago area, other groups have increased their numbers and added diversity to the region.
Chicago, of course, was founded by a man of African origin from the island of Hispanola, Jean
Baptiste Pointe DuSable. The African American population of the Chicago area has grown steadily
throughout the city’s history, with Chicago being one of the principal destinations of blacks
participating in the Great Migration from southern states to northern cities during the middle of
the twentieth century. During the 1990s the black population continued to grow, increasing
during the decade by 9.3 percent or 130,000 persons.
The Asian population in Metro Chicago has been present since the earliest decades of the
twentieth century, but the pace of growth of the Asian population has increased markedly,
beginning in the mid-1960s, when the passage of the 1965 amendments to the Immigration and
Nationality Act ended bias in favor of Europeans and offered persons from other parts of the
world a chance to emigrate to America. While the 1980s also saw numerous Southeast Asian
refugees resettled in the area, the greatest increase in the Asian population occurred during the
1990s, when the number of Asian residents of the area increased by 133,000 (54.9 percent). The
largest Asian groups in the area are Indians, Filipinos, Chinese, and Koreans.
The Latino community has resided in the metro area since the beginning of the last century,
although its largest population growth has occurred in recent decades. Mexican immigrants were
present in the earliest years of the twentieth century, while large numbers of Puerto Ricans arrived
in the years during and after the Second World War. In the latter decades of the twentieth century
new residents from Puerto Rico and especially Mexico continued to arrive in the area, along with
substantial numbers of immigrants from Cuba and South and Central America.
During the 1990s Latinos experienced the largest growth of any of the major racial/ethnic groups,
increasing in number by 568,000 persons (69 percent) during the decade.
C 7

In 1990 the Latino popula-
tion of the Chicago area was
only about 60 percent as large
as the African American
population. By 2000 the two
groups were approaching
parity as the largest minorities,
with the Latino population
equaling 91 percent of the
size of the black population.
Latinos, in fact, were responsible for most of the population growth in Metropolitan Chicago
during the 1990s. Of the regional net growth of approximately 830,000 persons in the 1990s more
than two-thirds, 568,000, is attributable to Latino growth. (See Figures 2 and 3; Table 1 of
Appendix 2.)
ChildrenThe dramatic growth of the Latino population, combined with out-migration and a relatively low
birth rate for non-Latino whites, is producing major shifts in the size and ethnic composition of
the child population. These shifts are most pronounced and have especially important
implications for schooling in those parts of the metropolitan area (urban neighborhoods and
suburbs) where the Latino population is growing the fastest.
The average age of Chicago-area Latinos is 25, 13 years younger than that of non-Latino whites.
In Chicago 35 percent of the Latino population is under 18, compared to only 26 percent of the
population overall. Were it not for an increase of 67,000 Latino children, the total number of
children in the city would have fallen by more than 30,000 (4 percent) during the 1990s.
In the suburbs 37 percent of the Latino population is under 18, compared to only 28 percent of
the population overall. The total number of suburban children increased during the 1990s by
113,852 (5 percent). Well over half of that increase (58 percent) is attributable to a rise in the
number of Latino children.
Places of Origin of Chicago-Area Latinos Mexicans are by far the largest Chicago-area Latino-origin group. The more than one million
Mexicans represent 75 percent of the region’s Latino population. Mexicans and Puerto Ricans, the
C8
Figure 3Population Changes in 1990–2000
9.3%
67.9%
11.4%
45.5%
123.8%
16.0%
-2.5% -1.9%
-14.1%
4.0%
38.1%
0.8%
-30%
-10%
10%
30%
50%
70%
90%
110%
130%
150%
54.9%
74.8%
26.0%
AsianBlackLatino WhiteTotal
Metro Chicago
City of Chicago
Suburbs

C 9
region’s second largest Latino group in the area, account for six of every seven of the region’s
Latino residents.
Substantial numbers of Chicago-area Latinos have roots in other parts of Latino America as well.
Approximately 36,000 Latinos of South American origin live in the area—over 90 percent of
whom are from Ecuador, Colombia, and Peru. More than 30,000 Central Americans also live in
the area, 60 percent of whom are from
Guatemala. The region also is home to
16,000 persons of Cuban origin.
Growth in the region’s Latino population
has been propelled primarily by Mexicans,
whose population increased by 497,487
(88 percent) between 1990 and 2000.
In marked contrast to the rapid growth of
the Mexican origin population, the region’s
second largest Latino origin group, Puerto
Ricans, increased by only 6,048 (4 percent) during the same period. The number of Cubans
increased by fewer than 300. Residents of South and Central American origin increased by 12,200
and 10,296, respectively. Because relatively few South and Central Americans lived in Metro
Chicago in 1990, the percentage increases for both groups between 1990 and 2000 were quite large.
The different rates of growth among Latino groups has led to a population that over the
1990s became increasingly Mexican. While Mexicans were 67.6 percent of area Latinos in 1990,
by 2000 their share
of the Latino pop-
ulation had in-
creased to 74.9 per-
cent. Puerto Ricans,
the next largest
Latino group, de-
creased from 17.1
percent of the
Chicago area Latino
population in 1990
to only 10.8 percent
in 2000.
Figure 4Place of Origin of Chicago-Area Latinos, 2000
Central America2.6%
Other*7.9%
Cuba1.2%
SouthAmerica
2.6%
Puerto Rico10.8%
Mexico74.9%
Figure 5Demographic Change among Major Latino Groups
1990–2000
57.4%
123.8%
143.1%
73.2%
42.9%
97.8%
47.4%
35.5%
1.6%4.2%
72.4%
87.9%
53.4%
38.1%
–8.0%
13.2%
–22.6%
34.2%
–35%
–15%
5%
25%
45%
65%
85%
105%
125%
145%
165%
All Latinos Mexicans Puerto Ricans Cubans SouthAmericans
CentralAmericans
Metro Chicago
City of Chicago
Suburbs

The City of Chicago and Its Suburbs Discussion of the Metro Chicago region inevitably includes comparisons between the city and
suburban areas. The dynamics of racial/ethnic change have played out differently in the central
city and the suburbs. Suburban areas have seen steady population growth for many decades, while
the city of Chicago lost population in the period 1940–90, only to see an increase in the 1990s. At
the same time, within the suburbs and the city, racial and ethnic groups have grown at different
rates, leading to shifting proportions of Latinos, whites, African Americans, and Asians.
Latinos account for much of the increasing diversity in the city of Chicago. The number of Latinos
increased by 208,000 in Chicago in the 1990s, while the non-Latino white population fell in
number by 149,000 persons in the period. The black population also declined in Chicago during
the 1990s, by 21,000. The Asian population grew by nearly 26,000 persons in Chicago in the 1990s,
significant growth but only a small fraction of the Latino increase.
The percentage growth of Latinos in Chicago stands in stark contrast to the declines among non-
Latino whites and African Americans, and it exceeds the growth rate of Asians. Latinos in the
1990s in Chicago grew in number by 38.1 percent, while non-Latino whites declined by 14.1
percent and African Americans fell by 1.9 percent. Asians grew by 26.0 percent.
The suburban areas of Metropolitan Chicago have been growing steadily in recent decades. All
major groups have increased their numbers in the suburbs over the last ten years, but Latinos have
had the fastest growth. In the 1990s some 360,419 Latinos were added to the suburban areas
compared to 151,130 African Americans, 107,422 Asians, and 29,478 non-Latino whites. The
Latino growth rate in the suburbs was 123.8 percent compared to 45.5 percent for African
Americans, 74.8 percent for Asians, and 0.8 percent for non-Latino whites. By 2000 Latinos were
12.5 percent of all suburban residents, compared to only 6.5 percent in 1990.
In the 1990s the Latino suburban population grew more rapidly in percentage and numeric terms
than Latinos in Chicago, and as a result the region’s Latino population is becoming increasingly
‘suburbanized’. In 2000 46.4 percent of Latinos lived in the Chicago suburbs, compared to only
24.0 percent in 1970. Although a
majority (53 percent) of Chicago-
area Latinos lived in the city in 2000,
two-thirds of the region’s Latino
population growth during the 1990s
took place in the suburbs.
Latino population growth in the
suburbs was propelled primarily by
the dramatic increase of more than
C10
Figure 6 Proportion of Metro Chicago Latinos in the Suburbs
46.4%
34.3%
27.0%24.0%
0%
10%
20%
30%
40%
50%
1970 1980 1990 2000

300,000 people of Mexican origin, although the
suburban population increased for every other
Latino origin group as well. The Mexican origin
population increased by nearly 200,000 in the city
of Chicago, and the number of Central and South
American residents of the city also increased.
However, the number of Puerto Rican and Cuban
residents of the city decreased between 1990 and
2000.
Every major Latino group except South Americans saw an increase in the percentage of its
population living in the suburbs during the 1990s. Between 1990 and 2000 the percentage of
Chicago-area Latinos living in the suburbs increased from 35 percent to 46 percent. Despite the
trend toward suburbanization, a majority of every Latino origin group except for Cubans still lived
in the city in 2000.
The Role of ImmigrationImmigration plays an important role in
the demography of the Latino
community and is responsible for the
majority (54.2 percent) of the growth of
the metro Latino population. Some
665,000 Latinos in Metro Chicago are
immigrants, representing nearly half
(47.2 percent) of the Latino population.
This overall figure (47.2 percent),
however, masks huge differences in the
percentages of Latino children and adults
who are foreign-born. Nearly two-thirds
of Chicago-area Latino adults are foreign-born (64.7 percent), compared to only 16 percent of
Latino children. In the city of Chicago 45.6 percent of Latinos are foreign born, while in the
suburbs nearly half (49.4 percent) of Latino residents were born outside of the United States.
In Metropolitan Chicago the number of foreign-born Latinos increased by 92.6 percent during the
1990s, almost doubling, compared to an increase of 57.5 percent for native-born Latinos. In
suburban Chicago the number of Latino foreign-born grew by a remarkable 175 percent in the
1990s. As a result of high levels of immigration, the Latino population included a greater
proportion of immigrants than at the beginning of the decade. While 42 percent of suburban
C 11
Figure 7Chicago-Area Latinos Living in the Suburbs,
in Percent, 1990–2000
1990 2000
Latino total 35.1% 46.4%
Mexican 38.5% 49.8%
Puerto Rican 15.1% 25.1%
Cuban 37.1% 52.0%
South American 42.9% 39.0%
Central American 26.4% 38.5%
16.0%
64.7%
47.2%
0.0%
10.0%
20.0%
30.0%
40.0%
50.0%
60.0%
70.0%
Children Adults Total
Figure 8Metro Chicago Latino Children & Adults
Who Are Foreign Born, 2000

C12
Latino residents were foreign born
in 1990, by the year 2000 this
number had risen to 46 percent
(Figures 8 and 9).
Nearly two-thirds of Chicago-area
Latinos are citizens. Because of the
disproportionate settlement of
Latino immigrants in the suburbs
during the 1990s, a higher
percentage of Latino residents of
Chicago are citizens than in the
suburbs. Also, a much higher
percentage of Latino children than
adults are citizens, corresponding
to the fact that many more Latino
children than adults were born in
the United States.
Income and Poverty TrendsHousehold IncomeIn the 1990s Latino median
household income grew by 10.9
percent in Metropolitan Chicago,
from $37,622 in 1989 to $41,739 in
1999 (all dollar amounts are adjusted to 1999 dollars). The growth rate for Latinos marginally
outpaced that of non-Latino whites, who saw their median household income grow by 10.5
percent. In 1989 Latino household income was 69.1 percent of that of non-Latino whites. By 1999
Latino income had risen to 69.4 percent of that of non-Latino whites.
When income data are disaggregrated by city and suburban areas, however, we find that Latino
income growth lagged behind that of whites both in the city of Chicago and in the suburbs. This
seemingly paradoxical finding is due to the more rapid Latino population growth during the
1990s in the suburbs, where average incomes are higher. In Chicago the median Latino household
income grew by 11.7 percent in the 1990s, from $32,726 to $36,543. Non-Latino white income
increased 17.7 percent in the city, from $41,808 to $49,222. In the suburbs Latino median
household incomes grew by only 3.3 percent in the 1990s, from $46,753 to $48,281, while non-
Figure 9Growth Rates of Native- and Foreign-Born
Latinos in the 1900s
57.5
32.3
100.992.6
52.6
175.1
0.0
20.0
40.0
60.0
80.0
100.0
120.0
140.0
160.0
180.0
200.0
Metro Chicago Suburbs
Native Born
Foreign Born
85.6%
53.9%
65.3%
0.0%
10.0%
20.0%
30.0%
40.0%
50.0%
60.0%
70.0%
80.0%
90.0%
Children Adults Total
Figure 10Metro Chicago Latino Children & Adults
Who Are Citizens, 2000

Latino white income increased by 8.6 percent, from $58,536 to $63,564. In 1989 in Chicago the
median household income of Latinos equaled 78.3 percent of that of non-Latino whites; by 1999
this had fallen to 74.2 percent. Similarly, in the suburbs, Latino median household income was
79.9 percent of non-Latino white income in 1989, but by 1999 Latino income had fallen to 76.0
percent of white income.
Latino household income
in Metro Chicago in-
creased more slowly than
that of either African
Americans or Asians. In
the metro area overall
African American median
household income grew
by 14.1 percent and Asian
income increased by 11.6
percent, compared to the
10.9 percent growth rate
for Latinos.
In the city of Chicago
Latino median income
growth slightly exceeded
that of Asians, increasing
11.7 percent compared to
10.1 percent for Asians. African American income grew by 13.2 percent. In suburban areas Latino
household income grew more slowly than that of all other major groups. Besides lagging behind
the rate of growth of non-Latino whites, the 3.3 percent Latino income growth rate in the suburbs
was less than the 4.8 percent income growth for African American and the 4.5 percent income
growth for Asian residents of the suburbs.
Poverty RatesPoverty statistics tell us whether an individual or family falls above or below a threshold of income
set by the federal government. In 2003 a family of four was below the poverty level if their income
was less than $18,979. The poverty threshold is an important factor in determining the extent to
which a person or family has an income that does not allow them to pay for basic needs. Poverty
levels also determine eligibility for safety net programs and permit measuring the relative
economic status of different groups.
C 13
1990 2000NumericChange
Percent Change
TotalMetro Chicago 48,222$ 52,185$ 3,962$ 8.2% Chicago city 34,652$ 38,625$ 3,973$ 11.5%Suburbs 57,113$ 60,325$ 3,211$ 5.6%
LatinoMetro Chicago 37,622$ 41,739$ 4,117$ 10.9% Chicago city 32,726$ 36,543$ 3,817$ 11.7%Suburbs 46,753$ 48,281$ 1,527$ 3.3%
Non-Latino whiteMetro Chicago 54,407$ 60,128$ 5,721$ 10.5% Chicago city 41,808$ 49,222$ 7,414$ 17.7%Suburbs 58,536$ 63,564$ 5,028$ 8.6%
Non-Latino blackMetro Chicago 29,672$ 33,866$ 4,194$ 14.1% Chicago city 25,692$ 29,086$ 3,394$ 13.2%Suburbs 42,629$ 44,665$ 2,036$ 4.8%
Non-Latino AsianMetro Chicago 53,465$ 59,659$ 6,194$ 11.6% Chicago city 36,818$ 40,519$ 3,701$ 10.1%Suburbs 67,671$ 70,685$ 3,014$ 4.5%
Table 1Change in Median Household Income in Metro Chicago
Note: All dollar amounts are adjusted to 1999 dollars.

The poverty rate of Latinos in
Metropolitan Chicago fell during
the 1990s, from 19.9 percent in
1989 to 16.3 percent in 1999. In
Chicago the decline in the Latino
poverty rate was even more
pronounced, falling from 24.2 to
20.0 percent over the decade.
This trend was not replicated in
the suburbs, however, where
Latino poverty increased slightly
during the 1990s, from 11.7
percent to 12.1 percent. In fact, Latinos were the only suburban group to experience an increase
in poverty in the suburbs (Table 6 in appendix 2).
One implication of the rapid growth of the Latino population, overall, is that a much larger
number of Latino residents of the area were poor at the end of the 1990s than at the start of the
decade. Even with declining poverty rates, the number of Latinos in poverty has increased and
Latinos constituted a larger percentage of the population in poverty in 2000 than in 1990. Latinos
were almost 20 percent of all persons in poverty in the metropolitan area in 1989, but by 1999
Latinos were 27 percent of persons in poverty. Similar increases are seen among both Chicago and
suburban poverty populations (See Figure 11 above).
Latino Growth at the Local LevelCountiesLatino population growth is occur-
ring throughout the metropolitan
region. Among the six counties that
make up Metropolitan Chicago the
largest numeric growth has occurred
in Cook County, where Latinos
increased by nearly 378,000 persons
in the 1990s. Kane and Lake Counties
both had Latino population growth
that of more than 50,000 persons
(Table 2).
C14
MetropolitanChicago
City Suburbs
Figure 11Latinos as a Percentage of All Persons
in Poverty, 1989 and 1999
19.9%21.7%
14.9%
27.0% 26.9% 27.3%
0%
5%
10%
15 %
20%
25 %
30%19891999
1990 2000Numeric Change
PercentChange
Metro Area 836,905 1,405,116 568,211 67.9% Cook 694,194 1,071,740 377,546 54.4% DuPage 34,567 81,366 46,799 135.4% Kane 43,535 95,924 52,389 120.3% Lake 38,570 92,716 54,146 140.4% McHenry 6,066 19,602 13,536 223.1% Will 19,973 43,768 23,795 119.1%
Table 2Latino Population Growth in Metro Chicago Counties

The fastest Latino growth in the
1990s took place in McHenry
County in the northwest corner
of the region. Latinos in
McHenry grew by 223 percent,
followed by Lake County (140
percent) and DuPage County
(135 percent). In Cook County
Latinos increased by 54 percent,
which is an impressive rate of
growth considering that the base
population of Latinos in 1990
was nearly 700,000.
Latino representation among county populations is strongest in Kane County, where Latinos are
almost one of four residents (23.7 percent). Latinos are almost 20 percent of Cook County
residents and more than 14 percent of Lake County. The sharpest increase in the presence of
Latinos occurred in DuPage and
McHenry Counties. In these
counties Latino representation
(i.e., their percent of the popu-
lation) more than doubled in the
1990s. In DuPage Latinos went
from being 4.4 percent of the
county to 9.0 percent ten years
later. In McHenry Latinos were
3.3 percent of residents in 1990
but 7.5 percent in the year 2000.
PlacesThe six-county metropolitan area
has 25 places with a Latino
population of at least 6,000
persons. The largest of these
places is Chicago, with 753,644
Latinos, followed by Cicero,
66,299, and Aurora, 46,557.
C 15
Figure 12Latino Percent of Metro Chicago Counties
7.5%
5.6%
17.4%
19.9%
9.0%
23.7%
7.5%8.7%
13.6%
11.5%
4.4%3.3%
13.7% 14.4%
0%
5%
10%
15%
20%
25%
Metro Area Cook DuPage Kane Lake McHenry Will
1990
2000
County 2000 LatinoChicago city Cook, DuPage 753,644Cicero town Cook 66,299Aurora city Dupage, Kane, Will 46,557Waukegan city Lake 39,396Elgin Cook, Kane 32,430Berwyn Cook 20,543Joliet city Will 19,552Melrose Park Cook 12,485Carpentersville village Kane 12,410West Chicago city Dupage 11,405Hanover Park Cook, DuPage 10,233Addison village Dupage 10,198Palatine Cook 9,247Blue Island Cook 8,899Des Plaines Cook 8,229Round Lake Beach village Lake 8,084Chicago Heights Cook 7,790Bensenville village Dupage 7,690Mundelein village Lake 7,487Franklin Park Cook 7,399Bolingbrook village Dupage, Will 7,371Wheeling Cook, Lake 7,135Mount Prospect Cook 6,620North Chicago Lake 6,552Streamwood Cook 6,108
Table 325 Largest Latino Places in Metro Chicago: 2000

Of these 25 places more than half, or 14 places, are located wholly or partially in Cook County, yet
some of the largest Latino population centers are found in the collar counties, including Aurora,
Waukegan, Elgin, and Joliet.
Latinos are at least 26 percent of the population in some 25 places in the metro area. Places with
the highest Latino percentage are Stone Park, where Latinos are 79.1 percent of the population,
Cicero, 77.4 percent, and Melrose Park, 53.9 percent. Fourteen of the 25 places are located at least
partially in Cook County, although some places with high concentrations of Latinos are found
outside Cook County, for example in West Chicago (DuPage County), Waukegan (Lake County),
and Carpentersville (Kane County).
The largest numeric growth of Latino population during the 1990s is found mostly in places of
relatively large population such as Chicago, Aurora, Elgin, and Waukegan. The number of Latinos
in Cicero, whose population is quite close to Waukegan’s, grew by more than 41,000 over the
decade. Some suburbs with more modest overall size, such as Berwyn and Melrose Park, also saw
their Latino communities grow significantly.
C16
County Total Latino Latino
Percent
Stone Park Cook 5,127 4,057 79.1%Cicero town Cook 85,616 66,299 77.4%Melrose Park Cook 23,171 12,485 53.9%West Chicago city Dupage 23,469 11,405 48.6%Summit Cook 10,637 5,156 48.5%Waukegan city Lake 87,901 39,396 44.8%Hodgkins Cook 2,134 933 43.7%Carpentersville village Kane 30,586 12,410 40.6%Highwood city Lake 4,143 1,584 38.2%Franklin Park Cook 19,434 7,399 38.1%Berwyn Cook 54,016 20,543 38.0%Blue Island Cook 23,463 8,899 37.9%Harvard city McHenry 7,996 3,023 37.8%Park City city Lake 6,637 2,506 37.8%Bensenville village Dupage 20,703 7,690 37.1%Rosemont Cook 4,224 1,493 35.3%Northlake Cook 11,878 4,133 34.8%Elgin Cook, DuPage 94,487 32,430 34.3%Aurora city Dupage, Kane, Will 142,990 46,557 32.6%Round Lake Beach village Lake 25,859 8,084 31.3%Addison village Dupage 35,914 10,198 28.4%Prospect Heights Cook 17,081 4,711 27.6%Hanover Park Cook, DuPage 38,278 10,233 26.7%Round Lake Park village Lake 6,038 1,584 26.2%Chicago Cook, DuPage 2,896,016 753,644 26.0%
Table 425 Metro Chicago Places with Largest Percentage Latino: 2000

In terms of the percentage increase in Latino population, some of the fastest growth in the
metro area during the 1990s occurred in Palatine, where Latinos increased in size by 556 percent.
Berwyn experienced a 475 percent growth among Latinos, and the increase in Round Lake Beach
was 244 percent.
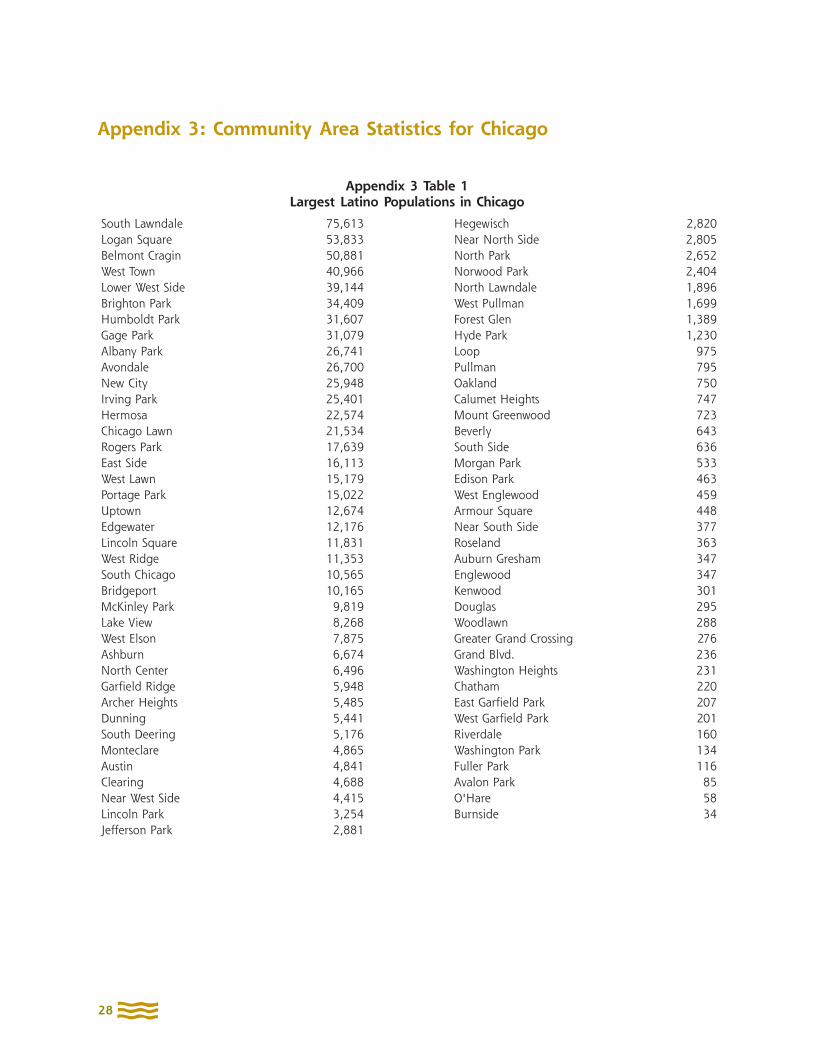
Chicago NeighborhoodsIn the year 2000 24 of the 77 community areas in the city of Chicago had at least 10,000 Latinos
(Table 1 in appendix 3 provides these statistics). The largest Latino population by community area
was in South Lawndale, with 75,600 Latinos, followed by Logan Square (53,800) and Belmont
Cragin (50,800). The dispersion of Latinos across the city is seen in the fact that 14 of the 24 com-
munity areas with 10,000 or more Latinos are on the city’s north side and 10 are on the south side.
The following map shows the locations of the community areas described above and also
illustrates the general pattern of Latino communities in Chicago. The largest Latino communities
are found in two major settlement areas, one on the north side and one on the city’s south side.
Logan Square and Belmont Cragin are found on the north side, along with West Town (40,966
C 17
CountyLatino 1990
Latino 2000
Numeric change
Percent Change
Chicago Cook, DuPage 545,852 753,644 207,792 38.1%Cicero Cook 24,931 66,299 41,368 165.9%Aurora city Dupage, Kane, Will 22,864 46,557 23,693 103.6%Waukegan city Lake 16,443 39,396 22,953 139.6%Elgin city Cook, Kane 14,576 32,430 17,854 122.5%Berwyn Cook 3,573 20,543 16,970 475.0%Joliet city Will 9,741 19,552 9,811 100.7%Melrose Park Cook 6,303 12,485 6,182 98.1%Carpentersville village Kane 3,840 12,410 8,570 223.2%West Chicago city Dupage 4,510 11,405 6,895 152.9%Hanover Park village Dupage 3,616 10,233 6,617 183.0%Addison village Dupage 4,287 10,198 5,911 137.9%Palatine Cook 1,410 9,247 7,837 555.8%Blue Island Cook 5,280 8,899 3,619 68.5%Des Plaines Cook 3,520 8,229 4,709 133.8%Round Lake Beach village Lake 2,347 8,084 5,737 244.4%Chicago Heights Cook 4,976 7,790 2,814 56.6%Bensenville village Dupage 3,333 7,690 4,357 130.7%Mundelein village Lake 2,867 7,487 4,620 161.1%Franklin Park Cook 3,849 7,399 3,550 92.2%Bolingbrook village Dupage, Will 2,391 7,371 4,980 208.3%Wheeling village Lake 2,508 7,135 4,627 184.5%Mount Prospect Cook 3,411 6,620 3,209 94.1%North Chicago city Lake 3,213 6,552 3,339 103.9%Streamwood Cook 2,298 6,108 3,810 165.8%
Based on 25 places of largest Latino population
Table 5Latino Growth in Metro Chicago Places: 1990–2000

Latinos), Humboldt
Park (31,607 Latinos),
and others. On the south
side, along with South
Lawndale, the major
Latino areas include the
Lower West Side (also
known as ‘Pilsen’ with
39,144 Latinos) and
Brighton Park (34,409
Latinos).
The most heavily Latino
community areas in
Chicago, measured by
Latinos as a percentage
of the overall popu-
lation, are the Lower
West Side (Pilsen),
which is 88.9 percent
Latino; Hermosa on the
city’s near northwest
side, which is 83.9 per-
cent Latino; and South
Lawndale, which is 83.0
percent Latino. Data for
these areas are found
in an appendix to this
report. In all 12 commu-
nity areas are at least half
Latino, and 26 areas are
at least one-quarter
Latino. Map 2 shows the
Latino percentage of the
77 Chicago community
areas.
C18
Map 1Latino Population by Chicago Community Area: 2000
Map 2Latino Percent of Population: 2000
34–499
500–9999
10000–24999
25000–75613
76
51
25
28
55
70
61
49
10
30
24
56
15
19
71
17
53
23
22
69
02
66
54
46
75
16
12
72
29
07
67
06
68
31
6543
44
5273
08
58
74
64
04
13
03
11
50
63
42
05
60
21
57
27
14
01
33
38
77
48
35
32
4140
59
26
45
62
20
09
39
18
37
47
36
76
51
25
28
55
70
61
49
10
30
24
56
15
19
71
17
53
23
22
69
02
66
54
46
75
16
12
72
29
07
67
06
68
31
6543
44
5273
08
58
74
64
0413
03
11
50
6342
05
60
21
57
27
14
01
33
38
77
48
35
32
4140
59
26
45
62
20
09
39
18
37
47
36
0.6–2.1%
2.2–8.9%
9.0–35.1%
35.2–88.9%

The principal Latino population centers in Chicago have been migrating somewhat over the past
decade. The maps below compare the neighborhoods with large current populations of Latinos
with those neighborhoods that have had large Latino growth in the 1990s.
It will be seen that the areas of Latino growth have been on the north, west, southwest, and south
portions of the major Latino settlement areas, and the areas of declining Latino population are to
the east of the current large Latino community areas. The overall pattern is of Latino migration
or expansion away from the lakefront and away from downtown. Exceptions to this trend are
Rogers Park and West Ridge on the far north side of the city and the East Side community on the
city’s far south side, bordering Indiana. These neighborhoods are near the lake, though they are
far from the downtown area. Table 3 in appendix 3 provides data on the numeric change of
Latinos by community area.
Change at the Census-Tract LevelCensus tracts are groups of city blocks, and their smaller size—there are 835 tracts in Chicago—
permits an even more detailed understanding of the demographic changes involving the Latino
community than an analysis based on community areas. On average there are about 3,300 persons
per census tract in Chicago.
Some 65.6 percent or two-thirds of Chicago census tracts experienced an increase in Latino
population in the 1990s. Latinos grew in number by more than 1,000 in 81 tracts. The tract with
C 19
76
51
25
28
55
70
61
49
10
30
24
56
15
19
71
17
53
23
22
69
02
66
54
46
75
16
12
72
29
07
67
06
68
31
65 43
44
5273
08
58
74
64
0413
0311
50
6342
05
60
21
57
27
14
01
33
38
77
48
35
32
4140
59
26
45
62
20
09
39
18
37
47
36
Map 3Latino Population Change
by Community Area
Map 4Latino Population Change
by Community Area 1990–2000
76
51
25
28
55
70
61
49
10
30
24
56
15
19
71
17
53
23
22
69
02
66
54
46
75
16
12
72
29
07
67
06
68
31
65 43
44
5273
08
58
74
64
0413
0311
50
6342
05
60
21
57
27
14
01
33
38
77
48
35
32
4140
59
26
45
62
20
09
39
18
37
47
36
34–499
500–9999
10000–24999
25000–75613
(13,395)–56
60–269
296–3,666
4,343–33,815

the largest numerical increase—5,888 persons—was in the heart of the Brighton Park community
area, south of Pershing Road and bounded on the east and west, respectively, by California and
Kedzie Avenues. Conversely, the largest decline in Latino population took place in West Town, in
a tract located east of Ashland Avenue and bounded on the north by North Avenue and on the
south by Division Street; this area lost 1,170 Latinos in the 1990s.
C20
76
51
25
28
55
70
61
49
10
30
24
56
15
19
71
17
53
23
22
69
02
66
54
46
75
16
12
72
29
07
67
06
68
31
6543
44
5273
08
58
74
64
04
13
03
11
50
63
42
05
60
21
57
27
14
01
33
38
77
48
35
32
4140
59
26
45
62
20
09
39
18
37
47
36
34
Map 5Latino Population Change by Census Tract: 1990–2000
(1170)–(1)
0–999
1000–2499
2500 and over

DiscussionThe Latino community of just three decades ago, in 1970, consisted of 330,000 persons who were
equal to less than five percent of the Metropolitan Chicago population. Now, at the beginning of
the new millennium, it is clear that our 1.4 million–strong Latino community is demographically
one of the most significant groups in the region. It is not only the overall growth of the Latino
population that has significance but also the spatial redistribution of the community, as Latinos
move into new areas of Chicago and into a wide range of suburbs scattered across the six-county
area. Coupled with this growth are some almost unique features of the Latino community, such as
the fact that a growing portion is comprised of immigrants, who have linguistic and cultural
characteristics that distinguish them from the larger population.
The growth and diverse nature of the Latino community have implications across a broad range
of social, economic, and political areas. Social policies in the areas of public education, health, and
safety must be increasingly re-thought in terms of how these efforts can best be implemented
among Latinos. For example, as Latinos move into new suburban areas and new neighborhoods
in Chicago, schools will encounter children who come from families where English is a second
language at home. Hospitals, fire departments, police forces, and other agencies and institutions
will need to interact with Latinos in culturally competent ways, using Spanish-language services
when appropriate and acting with an understanding of the role of family life among Latinos and
other culturally important characteristics.
Economically, as Latinos become a major segment of the labor force, particularly in certain areas
such as service and manufacturing, planners will need to consider ways to best address the needs
of Latino workers. Mexican immigrants, for example, have become a growing percentage of all
manufacturing workers in Metro Chicago, their representation in that industry rising from 6.1 in
1980 to 18.5 in 2000. As the manufacturing sector becomes more reliant on Latino workers, these
workers will need to be a target for workforce training and upgrading of skills.
Politically, Latinos lay claim to the attention of policymakers and elected officials not only in terms
of their growing presence within the electorate but also by the fact that elected officials across the
region are finding Latinos to be a growing portion of their overall constituencies. Elected and
appointed officials at the local and state government levels will find that certain issues are
particularly important to the Latino community, including attention to school policies to address
dropout rates, the possible issuance of drivers licenses without requiring a social security card, and
neighborhood safety issues in areas facing poverty and disinvestment. The demographic data
displayed and analyzed in this report should be a springboard from which a larger public
discussion can arise about the importance of the Metro Chicago Latino population.
C 21

3 Louise Ano Nuevo Kerr, “Chicano Settlements in Chicago: A BriefHistory,” Journal of Ethnic Studies (winter 1975).
4 1940 is the earliest period for which Census data are available onMexicans (for foreign-born Mexicans) in Census tracts that closelyapproximate current Census tract boundaries.
Appendix 1: Latinos Have Deep Roots in ChicagoLatino populations have been growing in suburban towns and city neighborhoods, so much so
that outside observers might think that the Latino presence in Metro Chicago is ‘new’. Mexicans
and Puerto Ricans, however, have a long history of living in this region. A look at when and where
the earliest Mexican and Puerto Rican settlement areas existed is helpful to gain an appreciation
of these groups’ many decades of residence in Chicago. Data on early residential patterns are also
available to persons interested in the historical development of the communities.
Among the Latino national-origin groups Mexicans have the longest history of living in the
Chicago area. Some 1,755 Mexican immigrants were recorded in the six-county area by the 1920
census. Many of the original Mexican migrants were employed by the railroad companies to repair
and maintain railroad tracks and equipment. Others were employed in the steel mills of South
Chicago and the meatpacking operations of the Chicago stock yards.3 Signs of community
organizations were evident as early as 1919 with the founding of the Sociedad Benito Juarez in the
Back of the Yards neighborhood.
A review of historical census data shows that the earliest Mexican communities of the beginning
decades of the 1900s were located in the Chicago community areas of New City, South Chicago,
and the Near West Side. The New City community was home to the Chicago stock yards which
were a major source of employment. The Near West Side was a central location that included some
of the city’s oldest housing, much of which now lies under the Dan Ryan Expressway, industrial
sites, and the University of Illinois at Chicago. South Chicago was a center of labor-intensive steel
production and numerous manufacturing jobs. By
the 1960s and 1970s, however, the Lower West Side
and South Lawndale community areas emerged as
the center of Mexican population, a position they
continue to hold, even as Mexicans have spread out
across the region.
By 1940 the largest number of Mexican immigrants
in Chicago were in the Near West Side, where 2,742
were counted by the census of that year.4 Following in
size were South Chicago, 1,319, and New City, 419. As
of 1970, however, the largest community areas for
C
Appendix 1 Map 1Leading Areas of Mexican Residence
2000
1940
Appendices
22

Mexicans (both persons born here and abroad) were the Lower West Side, South Lawndale, and
West Town. By 2000 the leading areas were South Lawndale, Lower West Side, and Brighton Park.
The earliest Puerto Rican migrants to the Chicago area arrived in the 1940s, and the population
grew rapidly in the 1950s and 1960s. Emigration from the island was prompted by substantial
economic restructuring there that included change from multi-crop low-tech agriculture to large-
scale single-crop agriculture involving consolidated land ownership and an accompanying loss of
rural jobs.5 Especially in the war years there were employment opportunities in manufacturing in
many cities of the Northeast and Midwest, including Chicago. By 1960 there were 32,371 Puerto
Ricans in the city of Chicago, a number which rose to 78,963 just ten years later.
Puerto Rican population growth in the Chicago area began slowing in the 1980s. Between 1980
and 1990 the number of Puerto Ricans in the metro area grew from 126,700 to only 142,000. In
the 1990s the Puerto Rican population fell in Cook County by –0.4 percent, while in Chicago the
population fell by nearly –7 percent. At the six-county metro level, the community increased by 6
percent, showing a trend toward suburbanization. Some 128,896 Puerto Ricans lived in Cook
County in 2000.
Over the decades the main residential areas for the Puerto Rican community have shifted
somewhat north and west in the city. In 1960 the largest Puerto Rican communities were located
in West Town (about 7,960 persons), the Near West Side (6,204), and East Garfield Park (3,678).
The Near North Side was home to 2,718 Puerto Ricans in 1960, most of whom were eventually
displaced by the construction of the Sandburg
Terrace middle-class housing complex near
Clark and North Avenues and by rising
housing costs in the area. By the year 2000 the
largest Puerto Rican communities were Logan
Square (18,601), West Town (14,567), and
Belmont Cragin (12,960).
C 23
Appendix 1 Map 2Leading Areas of Puerto Rican Residence
2000
1960
5 Felix Padilla, Latino Ethnic Consciousness: The Case ofMexican Americans and Puerto Ricans in Chicago (NotreDame, Indiana: University of Notre Dame Press, 1985).

C24
Appendix 2: Tables on Social and Demographic Change in Metropolitan Chicago
Appendix 2 Table 1Change in Major Race/Ethnic Groups
Metropolitan Chicago
1990 2000 # Change % ChangeTotal population 7,261,176 8,091,720 830,544 11.4% Latino 836,905 1,405,116 568,211 67.9% White, non-Latino 4,757,986 4,638,582 –119,404 –2.5%
Other, non-Latino 17,410 135,667 118,257 679.2%
Chicago City
1990 2000 # Change % ChangeTotal population 2,783,726 2,896,016 112,290 4.0% Latino 545,852 753,644 207,792 38.1% White, non-Latino 1,056,048 907,166 –148,882 –14.1%
Other, non-Latino 8,578 57,030 48,452 564.8%
Suburbs
1990 2000 # Change % ChangeTotal population 4,477,450 5,195,704 718,254 16.0%
Asian, non-Latino 242,432 375,514 133,082 54.9%
Asian, non-Latino 98,777 124,437 25,660 26.0%
Asian, non-Latino 143,655 251,077 107,422 74.8%
Black, non-Latino 1,406,443 1,536,841 130,398 9.3%
Black, non-Latino 1,074,471 1,053,739 –20,732 –1.9%
Black, non-Latino 331,972 483,102 151,130 45.5%
Latino 291,053 651,472 360,419 123.8% White, non-Latino 3,701,938 3,731,416 29,478 0.8%
Other, non-Latino 8,832 78,637 69,805 790.4%

Appendix 2 Table 3
Place of Origin of Metro Chicago Latinos, 1990 and 2000
1990 2000
All Latinos 836,905 (100%) 1,405,116 (100%)
Mexicans 565,737 (67.6%) 1,052,878 (74.9%)
Puerto Ricans 142,745 (17.1%) 151,351 (10.8%)
Cubans 16,624 (2.0%) 16,891 (1.2%)
South Americans 25,714 (3.1%) 37,211 (2.6%)
Central Americans 15,771 (1.9%) 36,080 (2.6%)
Other* 70,314 (8.5%) 111,042 (7.9%)
* The ‘Other’ category comprises respondents who did not self-identify in any of the above categories but whose other data give reason to believe they are Latinos.
C 25
Appendix 2 Table 2
Place of Origin of the Chicago-Area Latino Groups
# in 2000 Percent of Total
All Latinos 1,405,116 100%
Mexico 1,052,878 75%
Puerto Rico 151,351 11%
Cuba 16,554 1%
Central America 37,211
3%South America 36,080
3%
Other* 111,042 7%
* The ‘Other’ category comprises respondents who did not self-identify in any of the above categories but whose other data give reason to believe they are Latinos .

C26
Appendix 2 Table 5Latinos Who Are Foreign Born, 2000
Chicago City SuburbsSix-CountyMetro Area
N % N % N %
Children under 18 41,451 14.8% 39,668 17.5%81,115 16.0%
Adults 321,285 62.3% 263,721 67.9%585,009 64.7%
Total 362,736 45.6% 303,389 49.4%666,124 47.2%
Appendix 2 Table 4Demographic Change among Major Latino Groups:
Chicago, the Suburbs, and the Metropolitan Area, 1990–2000
Chicago City Suburbs Metro Chicago
N % % %N N
All Latinos 207,792 38.1% 360,419 123.8%589,979 72.4%
Mexicans 186,005 53.4% 311,482 143.1%497,487 87.9%
PuertoRicans
–9,722 –8.0% 15,770 73.2%6,048 4.2%
Cubans –2,367 –22.6% 2,364 42.9%267 1.6%
SouthAmericans
8,426 57.4% 3,774 34.2%12,200 47.4%
CentralAmericans
2,808 13.2% 7,488 97.8%10,296 35.5%

C 27
Appendix 2 Table 6Percent of Persons with Incomes below the Poverty Level
Metropolitan Chicago1989 1999
Total population 11.3% 10.6%
Asian, non-Latino 9.7% 8.6% Black, non-Latino 29.4% 24.6%
Latino 19.9% 16.3% White, non-Latino 4.6% 4.3%
Chicago City1989 1999
Total population 21.6% 19.6%
Asian, non-Latino 17.4% 18.0% Black, non-Latino 33.2% 29.4%
Latino 24.2% 20.0% White, non-Latino 9.0% 8.2%
Suburbs1989 1999
Total population 4.9% 5.6%
Asian, non-Latino 4.3% 4.0% Black, non-Latino 16.9% 14.1%
Latino 11.7% 12.1% White, non-Latino 3.4% 3.4%
C28
South Lawndale 75,613 Logan Square 53,833 Belmont Cragin 50,881 West Town 40,966 Lower West Side 39,144 Brighton Park 34,409 Humboldt Park 31,607 Gage Park 31,079 Albany Park 26,741 Avondale 26,700 New City 25,948 Irving Park 25,401 Hermosa 22,574 Chicago Lawn 21,534 Rogers Park 17,639 East Side 16,113 West Lawn 15,179 Portage Park 15,022 Uptown 12,674 Edgewater 12,176 Lincoln Square 11,831 West Ridge 11,353 South Chicago 10,565 Bridgeport 10,165 McKinley Park 9,819 Lake View 8,268 West Elson 7,875 Ashburn 6,674 North Center 6,496 Garfield Ridge 5,948 Archer Heights 5,485 Dunning 5,441 South Deering 5,176 Monteclare 4,865 Austin 4,841 Clearing 4,688 Near West Side 4,415 Lincoln Park 3,254 Jefferson Park 2,881
Hegewisch 2,820 Near North Side 2,805 North Park 2,652 Norwood Park 2,404 North Lawndale 1,896 West Pullman 1,699 Forest Glen 1,389 Hyde Park 1,230 Loop 975 Pullman 795 Oakland 750 Calumet Heights 747 Mount Greenwood 723 Beverly 643 South Side 636 Morgan Park 533 Edison Park 463 West Englewood 459 Armour Square 448 Near South Side 377 Roseland 363 Auburn Gresham 347 Englewood 347 Kenwood 301 Douglas 295 Woodlawn 288 Greater Grand Crossing 276 Grand Blvd. 236 Washington Heights 231 Chatham 220 East Garfield Park 207 West Garfield Park 201 Riverdale 160 Washington Park 134 Fuller Park 116 Avalon Park 85 O'Hare 58 Burnside 34
Appendix 3: Community Area Statistics for Chicago
Appendix 3 Table 1Largest Latino Populations in Chicago

C 29
Lower West Side 44,031 39,144 88.9%Hermosa 26,908 22,574 83.9%South Lawndale 91,071 75,613 83.0%Gage Park 39,193 31,079 79.3%Brighton Park 44,912 34,409 76.6%East Side 23,653 16,113 68.1%Belmont Cragin 78,144 50,881 65.1%Logan Square 82,715 53,833 65.1%Avondale 43,083 26,700 62.0%McKinley Park 15,962 9,819 61.5%West Lawn 29,235 15,179 51.9%New City 51,721 25,948 50.2%West Elson 15,921 7,875 49.5%Humboldt Park 65,836 31,607 48.0%West Town 87,435 40,966 46.9%Albany Park 57,655 26,741 46.4%Archer Heights 12,644 5,485 43.4%Irving Park 58,643 25,401 43.3%Monteclare 12,646 4,865 38.5%Chicago Lawn 61,412 21,534 35.1%South Deering 16,990 5,176 30.5%Bridgeport 33,694 10,165 30.2%Hegewisch 9,781 2,820 28.8%Rogers Park 63,484 17,639 27.8%South Chicago 38,596 10,565 27.4%Lincoln Square 44,574 11,831 26.5%Portage Park 65,340 15,022 23.0%Clearing 22,331 4,688 21.0%North Center 31,895 6,496 20.4%Uptown 63,551 12,674 19.9%Edgewater 62,198 12,176 19.6%Ashburn 39,584 6,674 16.9%Garfield Ridge 36,101 5,948 16.5%West Ridge 73,199 11,353 15.5%North Park 18,514 2,652 14.3%Dunning 42,164 5,441 12.9%Jefferson Park 25,859 2,881 11.1%Near West Side 46,419 4,415 9.5%Pullman 8,921 ,795 8.9%
Lake View 94,817 8,268 8.7%Forest Glen 18,165 1,389 7.6%Norwood Park 37,452 2,404 6.4%Oakland 11,639 ,750 6.4%Loop 16,388 ,975 5.9%Lincoln Park 64,320 3,254 5.1%Calumet Heights 15,974 ,747 4.7%West Pullman 36,649 1,699 4.6%North Lawndale 41,768 1,896 4.5%Austin 117,527 4,841 4.1%Hyde Park 29,920 1,230 4.1%Edison Park 11,259 ,463 4.1%Near South Side 9,509 ,377 4.0%Near North Side 72,811 ,2,805 3.9%Mount Greenwood 18,820 ,723 3.8%Armour Square 12,032 ,448 3.7%Fuller Park 3,420 ,116 3.4%Beverly 21,992 ,643 2.9%Morgan Park 25,226 ,533 2.1%Kenwood 18,363 ,301 1.6%Riverdale 9,809 ,160 1.6%Woodlawn 27,086 ,288 1.1%Douglas 26,470 ,295 1.1%South Side 61,556 ,636 1.0%West Englewood 45,282 ,459 1.0%East Garfield Park 20,881 ,207 1.0%Burnside 3,294 , 34 1.0%Englewood 40,222 ,347 0.9%Washington Park 14,146 ,134 0.9%West Garfield Park 23,019 ,201 0.9%O’Hare 6,110 , 58 0.9%Washington Heights 29,843 ,231 0.8%Grand Blvd. 28,006 ,236 0.8%Avalon Park 11,147 , 85 0.8%Greater Grand Crossing 38,619 ,276 0.7%Roseland 52,723 ,363 0.7%Auburn Gresham 55,928 ,347 0.6%Chatham 37,275 ,220 0.6%
Appendix 3, Table 2Chicago Community Areas: Highest Percentage Latino
Total Latino Latino Total Latino Latino 2000 Percent 2000 Percent
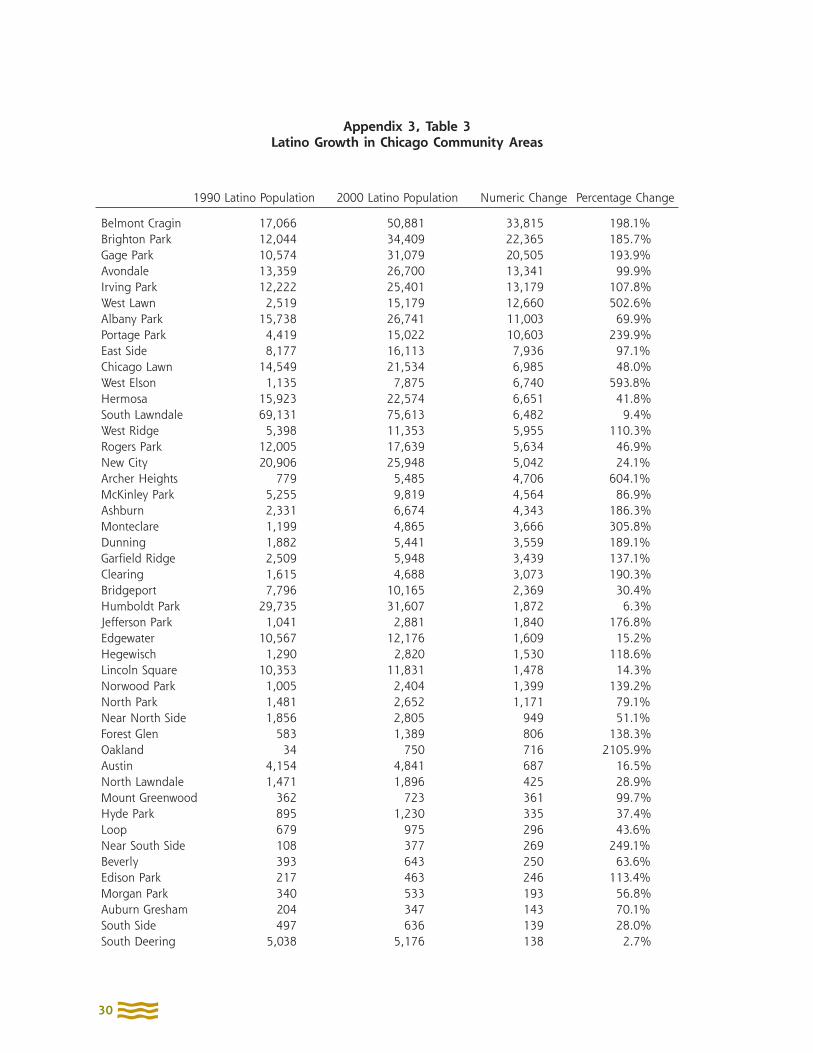
C30
1990 Latino Population 2000 Latino Population Numeric Change Percentage Change
Belmont Cragin 17,066 50,881 33,815 198.1%Brighton Park 12,044 34,409 22,365 185.7%Gage Park 10,574 31,079 20,505 193.9%Avondale 13,359 26,700 13,341 99.9%Irving Park 12,222 25,401 13,179 107.8%West Lawn 2,519 15,179 12,660 502.6%Albany Park 15,738 26,741 11,003 69.9%Portage Park 4,419 15,022 10,603 239.9%East Side 8,177 16,113 7,936 97.1%Chicago Lawn 14,549 21,534 6,985 48.0%West Elson 1,135 7,875 6,740 593.8%Hermosa 15,923 22,574 6,651 41.8%South Lawndale 69,131 75,613 6,482 9.4%West Ridge 5,398 11,353 5,955 110.3%Rogers Park 12,005 17,639 5,634 46.9%New City 20,906 25,948 5,042 24.1%Archer Heights 779 5,485 4,706 604.1%McKinley Park 5,255 9,819 4,564 86.9%Ashburn 2,331 6,674 4,343 186.3%Monteclare 1,199 4,865 3,666 305.8%Dunning 1,882 5,441 3,559 189.1%Garfield Ridge 2,509 5,948 3,439 137.1%Clearing 1,615 4,688 3,073 190.3%Bridgeport 7,796 10,165 2,369 30.4%Humboldt Park 29,735 31,607 1,872 6.3%Jefferson Park 1,041 2,881 1,840 176.8%Edgewater 10,567 12,176 1,609 15.2%Hegewisch 1,290 2,820 1,530 118.6%Lincoln Square 10,353 11,831 1,478 14.3%Norwood Park 1,005 2,404 1,399 139.2%North Park 1,481 2,652 1,171 79.1%Near North Side 1,856 2,805 949 51.1%Forest Glen 583 1,389 806 138.3%Oakland 34 750 716 2105.9%Austin 4,154 4,841 687 16.5%North Lawndale 1,471 1,896 425 28.9%Mount Greenwood 362 723 361 99.7%Hyde Park 895 1,230 335 37.4%Loop 679 975 296 43.6%Near South Side 108 377 269 249.1%Beverly 393 643 250 63.6%Edison Park 217 463 246 113.4%Morgan Park 340 533 193 56.8%Auburn Gresham 204 347 143 70.1%South Side 497 636 139 28.0%South Deering 5,038 5,176 138 2.7%
Appendix 3, Table 3Latino Growth in Chicago Community Areas

C 31
West Englewood 331 459 128 38.7%Englewood 231 347 116 50.2%Woodlawn 178 288 110 61.8%Washington Heights 140 231 91 65.0%Grand Blvd. 146 236 90 61.6%Greater Grand Crossing 189 276 87 46.0%Washington Park 48 134 86 179.2%Roseland 283 363 80 28.3%Fuller Park 41 116 75 182.9%West Garfield Park 133 201 68 51.1%Kenwood 241 301 60 24.9%East Garfield Park 151 207 56 37.1%Douglas 253 295 42 16.6%Chatham 198 220 22 11.1%Burnside 16 34 18 112.5%Pullman 780 795 15 1.9%Riverdale 150 160 10 6.7%Avalon Park 81 85 4 4.9%Near West Side 4,416 4,415 –1 0.0%Armour Square 471 448 –23 –4.9%West Pullman 1,771 1,699 –72 –4.1%Calumet Heights 920 747 –173 –18.8%O’Hare 525 58 –467 –89.0%Lincoln Park 3,981 3,254 –727 –18.3%Logan Square 54,740 53,833 –907 –1.7%Lower West Side 40,227 39,144 –1,083 –2.7%Uptown 14,398 12,674 –1,724 –12.0%North Center 9,048 6,496 –2,552 –28.2%South Chicago 13,644 10,565 –3,079 –22.6%Lake View 12,932 8,268 –4,664 –36.1%West Town 54,361 40,966 –13,395 –24.6%
1990 Latino Population 2000 Latino Population Numeric Change Percentage Change

Institute for Latino Studies, University of Notre Dame230 McKenna Hall, Notre Dame, IN 46556-5685
(574) 631-4440 • email: [email protected] • www.nd.edu/~latino
FPO: indicates position ofembossed area