
Latinas in New York City: A Comparison of Education and ... · A Comparison of Education and...
68
CLACLS Center for Latin American, Caribbean & Latino Studies Center for Latin American, Caribbean & Latino Studies Graduate Center City University of New York 365 Fifth Avenue Room 5419 New York, New York 10016 212-817-8438 [email protected] http://web.gc.cuny.edu/lastudies Latino Data Project - Report 53 - September 2013 Latinas in New York City: A Comparison of Education and Income, 1990 – 2010 Justine Calcagno Ph.D. Candidate Social-Personality Psychology
Transcript of Latinas in New York City: A Comparison of Education and ... · A Comparison of Education and...

CLACLS Center for Latin American, Caribbean & Latino Studies
Center for Latin American, Caribbean & Latino Studies Graduate Center City University of New York 365 Fifth Avenue Room 5419 New York, New York 10016 212-817-8438 [email protected] http://web.gc.cuny.edu/lastudies
Latino Data Project - Report 53 - September 2013
Latinas in New York City:
A Comparison of Education and
Income, 1990 – 2010
Justine Calcagno
Ph.D. Candidate Social-Personality Psychology

The Center for Latin American, Caribbean and Latino Studies is a research institute that works for the advancement of the study of Latin America, the Caribbean, and Latinos in the United States in the doctoral programs at the CUNY Graduate Center. One of its major priorities is to provide funding and research opportunities to Latino students at the Ph.D. level. The Center established and helps administer an interdisciplinary specialization in Latin American, Caribbean and Latino Studies in the Masters of Arts in Liberal Studies program. The Latino Data Project was developed with the goal of making information available on the dynamically growing Latino population of the United States and especially New York City through the analysis of extant data available from a variety of sources such as the U.S. Census Bureau, the National Institute for Health, the Bureau of Labor Statistics, and state and local-level data sources. All Latino Data Project reports are available at http://web.gc.cuny.edu/lastudies/
For additional information you may contact the Center at 212-817-8438 or by e-mail at [email protected].
Staff:
Laird W. Bergad, Distinguished Professor, Latin American and Puerto Rican Studies, Lehman College, Ph.D. Program in History, Executive Director, CLACLS Teresita Levy, Assistant Professor, Department of Latin American, Latino and Puerto Rican Studies, Lehman College, Associate Director Laura Limonic, Administrative Director and Director of Quantitative Research Victoria Stone-Cadena, Director of Outreach and Special Projects Lawrence Cappello, Research Associate Justine Calcagno, Quantitative Research Associate Mila Burns, Website Developer
Copyright @ 2013 Center for Latin American, Caribbean and Latino Studies
Room 5419 Graduate Center
City University of New York 365 Fifth Avenue
New York, New York 10016 212-817-8438 [email protected]
http://web.gc.cuny.edu/lastudies
ALL RIGHTS RESERVED

Latinas in New York City, Education and Income 3
Latino Data Project Report 53 September 2013
Table of Contents
Executive Summary .............................................................................................................................. 4 Educational Attainment ......................................................................................................................... 5 Personal Income ................................................................................................................................. 17 Household Income .............................................................................................................................. 30 The Relation between Personal Income and Education ...................................................................... 46 The Relation between Household Income and Education ................................................................... 56 Concluding Highlights ......................................................................................................................... 66

Latinas in New York City, Education and Income 4
Latino Data Project Report 53 September 2013
EXECUTIVE SUMMARY
This report analyzes data from the 1990, 2000, and 2010 American Community Surveys on
educational attainment, and personal and household income among Latinas in New York City.0F
1 It
considers the differences between Latinas and Latinos; among the five largest Latino nationalities in
New York City; between foreign- and domestic-born Latinas; compares females of four major
racial/ethnic groups (Non-Hispanic White, Non-Hispanic Black, Latino, and Asian); and between
Latina-headed households and households headed by other demographic groups.
From 1990 to 2010 Latinas’ educational attainment and income levels both rose. Disparities
between Latinas and Latinos in yearly personal income have persisted. From 1990 to 2010, women
earned lower levels of yearly personal income than men. Hispanic women not only experienced
increasingly higher levels of educational attainment between 1990 and 2010, but they surpassed the
educational attainment levels of Hispanic men. Yet, despite higher educational attainment than
Latinos, Latinas continued to earn less personal yearly income than Latinos. Reasons for this trend
are discussed in the report.
Disparities in education and income between Latinas and women of other racial/ethnic groups
persisted between 1990 and 2010. While Latinas achieved increases in higher educational attainment
and greater levels of income, these have not been fast enough to catch up with women of other
racial/ethnic groups, who also experienced increasing educational attainment and income after 1990.
Among the largest Hispanic national-origin groups there were increased educational attainment
and personal income levels among the City’s Puerto Rican, Colombian, Ecuadorian, and Dominican
females, but this was not the case among Mexican females, for whom educational attainment and
income level remained stable or declined over these three decades.
From 1990 to 2010, there were disparities between New York City’s foreign- and domestic-born
Latinas in educational attainment levels and median personal income. Domestic-born Latinas
consistently attained higher levels of education and income than foreign-born Latinas. This differential
by nativity widened between 1990 and 2010.
With respect to household income, Latino households headed by women earned lower levels of
income than households headed by men. Patterns among households headed by women from the
five largest Latino nationalities in New York City were similar to patterns found among Latinas in
personal income levels from 1990. Households headed by Puerto Rican, Colombian, Ecuadorian, and
Dominican women trended toward higher levels of household income, while Mexican households
headed by women had consistently lower levels of income, relative to the other four national-origin
groups. Sharp differences between households headed by the City’s Latinas and female-headed
households of the other major racial/ethnic groups were evident from1990 to 2010. After 1990 Latina-
1 Among the population 25 years of age and higher. All dollar values have been adjusted for inflation and are in 2010
dollars.

Latinas in New York City, Education and Income 5
Latino Data Project Report 53 September 2013
headed households had lower levels of household income than female-headed households of the
other major racial/ethnic groups.
Educational Attainment
Educational Attainment within the Latino/a Population by Sex in New York City
In both 1990 and 2000, over 50% of Latinas above the age of 25 years in New York City had
not completed high school.1F
2 In 1990, among Latino/as, men were slightly more likely to obtain a high
school degree or its equivalent than women. By 2010 the pattern reversed: a greater proportion of
Latino/a women than men received a high school degree or equivalent. (See figure 1).
Between 1990 and 2010, adult Latinas completed college in ever-increasing percentages. In
1990, Latinas and Latinos had essentially equal college graduation rates and for each type of post
baccalaureate degree. However, in 2000 and 2010, women’s rates of completion of higher education
degrees surpassed those of men. (See figures 2 through 4).
The available data indicate that from 1990 to 2010, growing numbers of Latinas did not drop
out of high school, completed high school, and continued to higher education degrees. Moreover,
trends in higher education show women increasingly attained higher education degrees at greater
rates than men in the City. In 2010, men only had higher rates of Ph.D. attainment than women. For
all other post-secondary educational attainment levels women had higher rates. (See table 1).
2 All analyses exclude individuals below 25 years of age since educational attainment is calculated by the Census
Bureau for this population. The term Latinas refers to women who have identified as Latino or Hispanic. The term Latino/a refers to both male and female Latinos. Whites not of Latino origin are designated as Non-Hispanic whites, Blacks or African-Americans are Non-Hispanic blacks. High School completion refers to either completing high school or obtaining a GED. Latino nationalities were calculated by CLACLS using ancestry data and birthplace data to reduce the number of ‘other Hispanics’ to national-origin groups. Thus, the data supplied by IPUMS and the U.S. Census Bureau have been recoded. In these calculations all Europeans, Spaniards, Canary Islanders etc. have been eliminated and Brazilians added as Latinos.
50.3%54.4%
37.8%
52.3% 53.6%
36.2%
0%
10%
20%
30%
40%
50%
60%
1990 2000 2010
Figure 1Percentage of Latino/a Population which did not Graduate High School
by Sex, 1990 – 2010 (in percentages of population 25 years of age and higher)
Male Female

Latinas in New York City, Education and Income 6
Latino Data Project Report 53 September 2013
3.6%
5.5%
2.0%
1.2%
0.4%
4.6%
5.3%
1.9%
0.7%0.3%
0%
2%
4%
6%
8%
Associates Degree B.A. Degree M.A. Degree Professional Degree Ph.D.
Figure 2Percentage of Latino/a Population which Attained Degrees Beyond
High School by Sex, 1990 (in percentages of population 25 years of age and higher)
Male Female
4.5%
7.5%
2.6%
1.9%
0.5%
6.4%
8.2%
3.0%
1.8%
0.4%
0%
2%
4%
6%
8%
10%
Associates Degree B.A. Degree M.A. Degree Professional Degree Ph.D.
Figure 3Percentage of Latino/a Population which Attained Degrees Beyond
High School by Sex, 2000 (in percentages of population 25 years of age and higher)
Male Female

Latinas in New York City, Education and Income 7
Latino Data Project Report 53 September 2013
Male Female Male Female Male Female
Did not Graduate High School 50.3% 52.3% 54.4% 53.6% 37.8% 36.2%
High School Graduate 37.1% 34.9% 28.6% 26.7% 44.3% 40.0%
Associates Degree 3.6% 4.6% 4.5% 6.4% 4.9% 6.7%
B.A. Degree 5.5% 5.3% 7.5% 8.2% 8.9% 12.0%
M.A. Degree 2.0% 1.9% 2.6% 3.0% 2.7% 3.8%
Professional Degree 1.2% 0.7% 1.9% 1.8% 1.0% 1.0%
Ph.D. 0.4% 0.3% 0.5% 0.4% 0.4% 0.2%
Total 100.0% 100.0% 100.0% 100.0% 100.0% 100.0%
1990 2000 2010
Table 1
Latino/a Educational Attainment Levels by Sex, 1990 – 2010
(in percentages of population 25 years of age and higher)
4.9%
8.9%
2.7%
1.0%0.4%
6.7%
12.0%
3.8%
1.0%0.2%
0%
5%
10%
15%
Associates Degree B.A. Degree M.A. Degree Professional Degree Ph.D.
Figure 4Percentage of Latino/a Population which Attained Degrees Beyond
High School by Sex, 2010 (in percentages of population 25 years of age and higher)
Male Female

Latinas in New York City, Education and Income 8
Latino Data Project Report 53 September 2013
Educational Attainment among the Female Population By Race/Ethnicity in New York City
From 1990 to 2010, Latinas did not complete high school at higher rates than all other
racial/ethnic groups in New York City, followed by Asian, Non-Hispanic Black, and Non-Hispanic
White women. The largest disparity in high school completion was between Latinas and Non-Hispanic
White women. However, that gap narrowed slightly from 1990 to 2010. From 1990 to 2010, rates at
which women of all racial/ethnic groups did not graduate high school declined. (See figure 5).
Since 1990 the college graduation has increased for women in all ethnic/racial groups in the
City. However, relative to other racial/ethnic groups, Latinas continued to have the lowest rates of
college graduation. Following the pattern of high school non-completion rates, the largest disparity in
higher education attainment from 1990 to 2010 was between Latinas and Non-Hispanic White
women. This differential between Latinas and Non-Hispanic White women decreased slightly from
1990 to 2010. The disparities between Latina and Non-Hispanic Black and Asian women remained
stable. (See figure 6 and table 2).
The available data suggest the City’s Latinas had consistently lower rates of high school
completion and lower rates of higher education attainment compared to Non-Hispanic White, Non-
Hispanic Black, and Asian women. Even though Latinas have made strides in educational attainment,
the rate of improvement has not been fast enough to catch up with other racial/ethnic groups in the
near future. This was likely related to foreign-born immigration patterns. Relative to other racial/ethnic
groups, an increasing and large proportion of Latinas were foreign-born, and foreign-born adults tend
to arrive in the U.S. with lower educational attainment. (See table 3).
23.0%
33.1%
52.3%
34.4%
18.4%
34.6%
53.6%
35.7%
8.7%
18.5%
36.2%
26.6%
0%
10%
20%
30%
40%
50%
60%
70%
Non-Hispanic White Non-Hispanic Black Latina Asian
Figure 5Female Population which did not Graduate High School by Race/Ethnicity, 1990 – 2010
(in percentages of population 25 years of age and higher)
1990 2000 2010

Latinas in New York City, Education and Income 9
Latino Data Project Report 53 September 2013
28.6%
12.9%8.2%
31.9%
45.7%
21.3%
13.3%
38.7%
51.6%
21.8%17.1%
39.8%
0%
10%
20%
30%
40%
50%
60%
Non-Hispanic White Non-Hispanic Black Latina Asian
Figure 6Female Population which Attained B.A. Degrees or Higher by Race/Ethnicity,
1990 – 2010 (in percentages of population 25 years of age and higher)
1990 2000 2010
Male Female Male Female Male Female Male Female
1990 Did not Graduate High School 21.0% 23.0% 34.5% 33.1% 50.3% 52.3% 28.2% 34.4%
High School Graduate 38.4% 44.2% 48.0% 47.5% 37.1% 34.9% 30.6% 28.2%
Associates degree 4.0% 4.2% 5.0% 6.6% 3.6% 4.6% 5.6% 5.6%
B.A. Degree 19.1% 15.8% 8.2% 8.3% 5.5% 5.3% 20.5% 22.3%
M.A. Degree 9.6% 9.5% 2.8% 3.6% 2.0% 1.9% 10.2% 6.5%
Professional Degree 6.0% 2.3% 1.1% 0.8% 1.2% 0.7% 3.5% 2.5%
Ph.D. 2.0% 1.0% 0.4% 0.2% 0.4% 0.3% 1.4% 0.5%
Total 100.0% 100.0% 100.0% 100.0% 100.0% 100.0% 100.0% 100.0%
2000 Did not Graduate High School 17.4% 18.4% 37.0% 34.6% 54.4% 53.6% 32.5% 35.7%
High School Graduate 24.8% 30.3% 36.2% 34.9% 28.6% 26.7% 20.7% 20.1%
Associates degree 5.3% 5.6% 7.3% 9.2% 4.5% 6.4% 4.9% 5.5%
B.A. Degree 28.2% 24.5% 12.9% 13.8% 7.5% 8.2% 25.3% 25.9%
M.A. Degree 13.9% 15.2% 4.4% 5.7% 2.6% 3.0% 10.4% 8.0%
Professional Degree 7.4% 4.2% 1.4% 1.4% 1.9% 1.8% 4.4% 3.8%
Ph.D. 2.9% 1.8% 0.8% 0.4% 0.5% 0.4% 1.8% 1.0%
Total 100.0% 100.0% 100.0% 100.0% 100.0% 100.0% 100.0% 100.0%
2010 Did not Graduate High School 8.3% 8.7% 19.7% 18.5% 37.8% 36.2% 23.3% 26.6%
High School Graduate 34.9% 34.6% 55.6% 51.3% 44.3% 40.0% 30.1% 28.1%
Associates degree 5.1% 5.1% 6.5% 8.5% 4.9% 6.7% 5.6% 5.5%
B.A. Degree 28.6% 28.0% 12.7% 14.5% 8.9% 12.0% 25.8% 25.6%
M.A. Degree 14.0% 17.1% 3.8% 6.1% 2.7% 3.8% 9.9% 9.7%
Professional Degree 6.3% 4.4% 1.2% 0.9% 1.0% 1.0% 3.5% 3.2%
Ph.D. 2.7% 2.1% 0.5% 0.3% 0.4% 0.2% 1.8% 1.3%
Total 100.0% 100.0% 100.0% 100.0% 100.0% 100.0% 100.0% 100.0%
Non-Hispanic
White
Non-Hispanic
Black Latino Asian
Year Educational Attainment

Latinas in New York City, Education and Income 10
Latino Data Project Report 53 September 2013
Educational Attainment among the Latina Population by Nationality in New York City
Among Latinas of all five of the largest Latino nationalities in New York City between 1990 and
2010, the non-high school graduation declined. From 1990 to 2010, the City’s Colombian women had
high school non-completion rates consistently lower than all other nationalities, with only a quarter of
Colombian women 25 years of age and older not graduating high school in 2010. In 1990, Dominican
women had the highest high school non-completion rate (62%), which remained high until 2000
(61%), and declined sharply in 2010 to 39%. This trend is likely related to the decreasing proportion of
foreign-born Dominicans. (See table 4). While in 1990 Mexican women had non-high school
graduation rates which were relatively similar to other nationalities (48%), in 2000 and 2010, the rates
at which the City’s Mexican women did not graduate high school were greater than all of the other five
largest Latino nationalities. This trend is likely related to increased proportion of foreign-born
Mexicans. In 2010, the largest difference in high school non-completion was between Mexican and
Colombian women. In 2000, Mexican women’s high school non-completion rate increased sharply to
64%, but declined to 52% in 2010. Puerto Rican, Colombian, Ecuadorian, and Dominican women’s
high school non-completion rates declined from 2000 to 2010 as indicated in Figure 7. Overall, these
trends were likely related to foreign-born immigration patterns. While the percentage of foreign-born
Mexican women in New York City increased from 1990 to 2010, the percentage of foreign-born Puerto
Rican, Colombian, Ecuadorian and Dominican women decreased. As foreign-born women may be
less likely to arrive in the U.S. with a high school degree, the increase in foreign-born Mexican women
after 1990 may explain the overall decline in their educational attainment rates over the last three
decades, while the decrease in foreign-born women of the other nationalities may explain the overall
increase in their educational attainment. (See table 4).
Year Nativity
Non-Hispanic
White
Non-Hispanic
Black Latina Asian
1990 Foreign-Born 18.7% 22.4% 56.6% 76.2%
Domestic-Born 81.3% 77.6% 43.4% 23.8%
2000 Foreign-Born 24.3% 29.5% 57.1% 79.0%
Domestic-Born 75.7% 70.5% 42.9% 21.0%
2010 Foreign-Born 24.2% 34.1% 53.7% 39.2%
Domestic-Born 75.8% 65.9% 46.3% 65.9%
Table 3
Female Population Nativity by Race/Ethnicity, 1990 – 2010
(in percentages of population 25 years of age and older)

Latinas in New York City, Education and Income 11
Latino Data Project Report 53 September 2013
College graduation rates among Latinas within the five largest Latino nationalities in New York
City increased from 1990 to 2000 among all nationalities with the exception of Mexican women.
Mexican women’s attainment of a B.A. degree or higher declined from 15% to 11% over this decade.
In 1990, Mexican women had the highest rate of higher education degree attainment of all
nationalities, followed by Colombian, Ecuadorian, Puerto Rican and Dominican women. Yet, in 2000
and 2010 Colombian women had the highest rate of higher education degree attainment of the five
largest NYC nationalities followed by Ecuadorian, Mexican, Puerto Rican, and Dominican women. By
2010, a quarter of all Colombian women earned Bachelor’s degrees or beyond, while achievement of
a B.A. degree or higher among other nationalities was approximately 15%. (See figure 8 and table 5).
Mexican women’s lower rate of attainment of Bachelor’s degrees or beyond may be again attributed
to their increased foreign-born population; as foreign-born women were less likely to have arrived in
the U.S. with even a high-school degree, and were thus less likely to enroll in a university or
community college. The increased attainment of a B.A. degree or higher among Puerto Rican,
Colombian, Ecuadorian, and Dominican may be attributed to their decreased foreign-born population
in New York City.
Latinas of all five of the largest Latino nationalities in New York City have increasingly
graduated high school and attained higher education degrees. Mexican women, however, had the
same college graduation rate in 1990 (15%) as in 2010. Again this may be related to the arrival of
foreign-born Mexican women in New York City. In 2010, Colombian women had significantly higher
college graduation rates than all other nationalities.
Among males 25 years of age and older, of the five largest Latino nationalities in New York
City, high school non-completion rates dropped from 1990 to 2010. In 2010, Mexican males had the
highest high school non-completion rate (49%). Colombian males had the lowest rate of high school
non-completion at 18%, which was significantly lower than males of all of the other Latino nationalities
considered here. These patterns may be attributed to Mexicans’ increased foreign-born population
and the decreased foreign-born population among Puerto Rican, Colombian, Ecuadorian, and
Dominican Latinos.
Nativity Nationality 1990 2000 2010
Foreign-Born Mexican 64.4% 85.3% 84.8%
Puerto Rican 65.6% 58.7% 46.2%
Colombian 92.9% 93.5% 87.7%
Ecuadorian 92.7% 94.1% 89.0%
Dominican 91.4% 93.5% 88.5%
Domestic-Born Mexican 35.6% 14.7% 15.2%
Puerto Rican 34.4% 41.3% 53.8%
Colombian 7.1% 6.5% 12.3%
Ecuadorian 7.3% 5.9% 11.0%
Dominican 8.6% 6.5% 11.5%
Note: For Puerto Ricans 'foreign-born' means born on the island.
Table 4
Latina Population Nativity by Five Largest Latino
Nationalities in New York City, 1990 – 2010
(in percentages of population 25 years of age and older)

Latinas in New York City, Education and Income 12
Latino Data Project Report 53 September 2013
47.7%
54.0%
44.5%47.9%
62.4%63.6%
53.6%
41.6%
52.4%
61.5%
52.5%
35.4%
24.6%
37.1%39.5%
0%
10%
20%
30%
40%
50%
60%
70%
Mexican Puerto Rican Colombian Ecuadorian Dominican
Figure 7Latina Population which did not Graduate High School by Nationality for Five Largest Latino
Nationalities in New York City, 1990 – 2010 (in percentages of population 25 years of age and higher)
1990 2000 2010
15.4%
6.2%
9.1%7.7%
5.8%
10.6% 11.0%
19.7%
12.4%
10.4%
15.3% 15.2%
26.3%
15.6%
13.3%
0%
5%
10%
15%
20%
25%
30%
Mexican Puerto Rican Colombian Ecuadorian Dominican
Figure 8Latina Population which Attained B.A. Degrees or Higher for Five Largest Latino Nationalities in
New York City, 1990 – 2010 (in percentages of population 25 years of age and higher)
1990 2000 2010

Latinas in New York City, Education and Income 13
Latino Data Project Report 53 September 2013
Male Female Male Female Male Female
Mexican Did not graduate High School 56.0% 47.7% 64.7% 63.6% 49.5% 52.5%
High School Grad 29.3% 33.3% 24.2% 23.7% 38.7% 29.4%
Associates degree 2.1% 3.6% 2.1% 2.1% 2.8% 2.8%
B.A. degree 6.3% 9.8% 5.5% 6.6% 6.4% 10.9%
M.A. degree 3.7% 3.1% 2.0% 3.1% 2.2% 3.1%
Professional degree 1.6% 1.4% 1.2% 0.6% 0.4% 1.3%
Ph.D. 1.1% 1.1% 0.4% 0.3% 0.1% 0.1%
Total 100.0% 100.0% 100.0% 100.0% 100.0% 100.0%
Puerto Rican Did not graduate High School 54.3% 54.0% 52.8% 53.6% 37.7% 35.4%
High School Grad 37.0% 35.5% 32.1% 28.1% 47.3% 42.3%
Associates degree 2.7% 4.3% 5.0% 7.3% 5.4% 7.1%
B.A. degree 4.0% 4.0% 6.9% 7.2% 6.7% 10.9%
M.A. degree 1.3% 1.7% 2.1% 2.7% 2.4% 3.7%
Professional degree 0.5% 0.3% 0.9% 0.8% 0.2% 0.6%
Ph.D. 0.2% 0.1% 0.3% 0.3% 0.2% 0.0%
Total 100.0% 100.0% 100.0% 100.0% 100.0% 100.0%
Colombian Did not graduate High School 35.8% 44.5% 39.9% 41.6% 17.8% 24.6%
High School Grad 47.3% 41.1% 32.9% 32.1% 54.6% 41.6%
Associates degree 5.2% 5.3% 6.0% 6.7% 5.7% 7.5%
B.A. degree 8.0% 6.6% 11.1% 11.1% 15.5% 16.5%
M.A. degree 2.4% 1.7% 4.2% 3.7% 3.6% 5.8%
Professional degree 1.2% 0.6% 5.0% 4.3% 2.2% 3.0%
Ph.D. 0.1% 0.3% 0.8% 0.5% 0.6% 1.1%
Total 100.0% 100.0% 100.0% 100.0% 100.0% 100.0%
Ecuadorian Did not graduate High School 46.2% 47.9% 54.3% 52.4% 38.6% 37.1%
High School Grad 39.6% 38.3% 29.9% 29.2% 47.0% 43.0%
Associates degree 5.3% 6.1% 5.3% 5.9% 3.3% 4.3%
B.A. degree 6.0% 6.6% 6.2% 8.1% 8.5% 12.3%
M.A. degree 1.6% 0.5% 2.1% 2.1% 2.4% 2.7%
Professional degree 1.0% 0.5% 1.9% 2.1% 0.2% 0.6%
Ph.D. 0.2% 0.2% 0.3% 0.2% 0.1% 0.0%
Total 100.0% 100.0% 100.0% 100.0% 100.0% 100.0%
Dominican Did not graduate High School 57.4% 62.4% 63.6% 61.5% 40.1% 39.5%
High School Grad 31.5% 27.6% 22.8% 21.9% 42.4% 40.1%
Associates degree 4.0% 4.3% 4.1% 6.1% 5.7% 7.1%
B.A. degree 4.5% 3.9% 5.7% 6.5% 8.4% 10.3%
M.A. degree 1.0% 0.8% 1.6% 1.8% 2.0% 2.2%
Professional degree 1.5% 1.0% 1.8% 1.8% 0.9% 0.7%
Ph.D. 0.3% 0.1% 0.4% 0.3% 0.5% 0.1%
Total 100.0% 100.0% 100.0% 100.0% 100.0% 100.0%
Table 5
Educational Attainment Rates by Sex for Five Largest Latino/a Nationalities in New York City, 1990 – 2010
(in percentages of population 25 years of age and older)
1990 2000 2010
Nationality Educational Attainment

Latinas in New York City, Education and Income 14
Latino Data Project Report 53 September 2013
Educational Attainment among the Latino Population by Nativity in New York City
The rates at which Latinas did not graduate high school from 1990 to 2010 decreased among
both the foreign-born and domestic-born in New York City.2F
3 However, foreign-born women have
consistently had higher high school non-completion rates than domestic-born women. This may be
attributed to foreign-born women being less likely to arrive in the U.S. with a high school degree. Even
though the high-school graduation rate has increased among foreign-born women in the City, the
disparity by nativity has increased. In 1990, foreign-born Latinas’ rate of high school non-completion
was 57%, compared with 37% of domestic-born Latinas; in 2010, foreign-born Latinas’ rate of high
school non-completion was 43% compared with 18% of domestic-born Latinas. (See figure 9).
From 1990 to 2010, college graduation rates increased among both foreign- and domestic-born
Latinas. However, the City’s domestic-born Latinas consistently had higher rates of higher education
degree attainment than foreign-born Latinas. The disparity between the two groups increased. While
in 1990, foreign-born Latinas’ college graduation rate was 7%, compared with12% among domestic-
born Latinas, in 2010, foreign-born Latinas’ rate of higher education attainment was 13%, relative to
30% of domestic-born Latinas. (See figure 10). Foreign-born women’s lower rate of attainment of B.A.
degrees or beyond may be related to foreign-born women being less likely to arrive in the U.S. with a
high school degree.
The available data suggest that domestic-born Latinas have had consistently higher levels of
education than foreign-born Latinas over the last three decades in New York City. Foreign-born
women did not have higher rates of educational attainment in any level of education in 1990, 2000, or
2010. This suggests second and third generation Latinas have greater educational, and potentially
economic, opportunities than first generation Latinas in New York City. (See table 6).
3 For Puerto Ricans 'foreign-born' means born on the island.
57.0% 58.7%
42.7%
37.0%33.7%
18.2%
0%
10%
20%
30%
40%
50%
60%
70%
1990 2000 2010
Figure 9Latina Population which did not Graduate High School by Nativity, 1990 – 2010
(in percentages of population 25 years of age and higher)
Foreign-Born Domestic-Born

Latinas in New York City, Education and Income 15
Latino Data Project Report 53 September 2013
7.1%
10.7%12.5%11.8%
23.6%
29.8%
0%
10%
20%
30%
40%
1990 2000 2010
Figure 10Latina Population which Attained B.A. Degrees or Beyond by Nativity, 1990 – 2010
(in percentages of population 25 years of age and higher)
Foreign-Born Domestic-Born
Note: For Puerto Ricans 'foreign-born' means born on the island.
Male Female Male Female Male Female
Foreign-Born Did not Graduate High School 53.8% 57.0% 59.5% 58.7% 43.9% 42.7%
High School Graduate 34.3% 31.9% 26.3% 25.6% 41.5% 39.3%
Associates Degree 3.4% 4.1% 3.5% 5.0% 3.7% 5.5%
B.A. Degree 4.9% 4.6% 5.9% 6.3% 7.4% 8.9%
M.A. Degree 1.9% 1.6% 2.3% 2.5% 2.0% 2.6%
Professional Degree 1.3% 0.6% 1.9% 1.7% 1.1% 0.9%
Ph.D. 0.4% 0.3% 0.5% 0.3% 0.4% 0.2%
Total 100.0% 100.0% 100.0% 100.0% 100.0% 100.0%
Domestic-Born Did not Graduate High School 39.6% 37.0% 36.0% 33.7% 21.7% 18.2%
High School Graduate 45.3% 44.7% 36.7% 30.9% 51.5% 41.9%
Associates Degree 4.4% 6.5% 8.1% 11.8% 8.0% 10.1%
B.A. Degree 7.1% 7.5% 12.9% 15.8% 12.9% 20.9%
M.A. Degree 2.2% 3.1% 3.7% 5.2% 4.4% 7.2%
Professional Degree 1.1% 0.9% 2.0% 2.1% 1.0% 1.4%
Ph.D. 0.3% 0.3% 0.6% 0.5% 0.5% 0.3%
Total 100.0% 100.0% 100.0% 100.0% 100.0% 100.0%
Table 6
Latino/a Educational Attainment Levels by Nativity and Sex, 1990 – 2010
(in percentages of population 25 years of age and higher)
Nativity Educational Attainment
1990 2000 2010

Latinas in New York City, Education and Income 16
Latino Data Project Report 53 September 2013
Educational Attainment among the Latino Population by Sex and Nativity in New York City
In 1990 and 2000, over half of foreign-born Latino/a men and women had not finished high school.
In 2010, around 40% of the City’s foreign-born Latino/as had not completed high school. Foreign-born
women were the most likely to not complete high school in 1990. In 2000 and 2010 foreign-born men
and women in New York City had nearly equal rates of high school non-completion. From 1990 to
2010, domestic-born women were the least likely to not complete high school, relative to domestic-
born men and foreign-born men and women. (See figure 11).
In 1990, foreign-born women were the least likely to attain a B.A. or beyond (7.1%), relative to
foreign-born men (8.5%), domestic-born men (10.7%), and domestic-born women (11.8%). By 2010,
a greater proportion of foreign-born women attained higher education degrees compared to foreign-
born men. However, a lower proportion of foreign-born women attained higher education degrees
compared to both domestic-born men and women. From 1990 to 2010, domestic-born women were
more likely to attain B.A. degrees or beyond than foreign-born men and domestic-born men.
Domestic-born women had the greatest increase in proportion attaining higher education degrees
from 1990 to 2010. (See figure 12).
The available data indicate that growing numbers of domestic-born Latinas completed high
school and continued to higher education from 1990 to 2010 in New York City. Trends in higher
education show domestic-born women are increasingly attaining higher education at greater rates
than men. In contrast, foreign-born Latinas’ educational attainment has remained low and has only
increased slightly across three decades. As foreign-born women may be less likely to arrive in the
U.S. with a high school degree, the increase in foreign-born Mexican women after 1990 may explain
foreign-born women’s stagnant and lower educational attainment rates of the last three decades. (See
table 6). This suggests second and third generation Latinas have greater educational opportunities
than first generation Latinas in New York City.
53.8%57.0%
39.6%37.0%
59.5% 58.7%
36.0% 33.7%
43.9% 42.7%
21.7%18.2%
0%
10%
20%
30%
40%
50%
60%
70%
Male Female Male Female
Foreign-Born Domestic-Born
Figure 11Latino/a Population which did not Graduate High School by Sex and Nativity, 1990 – 2010
(in percentages of population 25 years of age and higher)
1990 2000 2010

Latinas in New York City, Education and Income 17
Latino Data Project Report 53 September 2013
Personal Income
Personal Income among the Latino Population by Sex in New York City
Latinas above the age of 25 years had lower median personal incomes from 1990 to 2010 than
Latinos in New York City. Median personal incomes increased among women, as did the median
incomes among men, indicating that while median incomes among all Latinos is increasing, women
have consistently had lower median income than men over three decades. (See figure 13).
Between 1990 and 2010, the City’s Latinas were more likely than Latinos to earn below
$20,000 annually, while Latinas were less likely than Latinos to earn levels of income above $20,000
annually. This differential between men and women was stable from 1990 to 2010.3F
4 However,
women’s annual income shifted to higher levels from 1990 to 2010. Fewer Latinas earned below
$20,000 in 1990 (63%) than in 2010 (56%), while more Latinas attained higher levels of income. In
contrast, men’s annual personal income trended in the opposite direction. More Latinos earned less
than $20,000 from 1990 (38%) to 2010 (41%). (See figures 14 through 16, and table 7). These trends
in increasing income reflect the increasingly higher levels of educational attainment among Latino/as.
4 1990 and 2000 Income has been adjusted for inflation and converted into 2010 dollars.
8.5%7.1%
10.7% 11.8%10.7% 10.7%
19.2%
23.6%
10.9%12.5%
18.8%
29.8%
0%
10%
20%
30%
40%
Male Female Male Female
Foreign-Born Domestic-Born
Figure 12Latino/a Population which Attained B.A. Degrees or Beyond by Sex and Nativity,
1990 – 2010 (in percentages of population 25 years of age and higher)
1990 2000 2010

Latinas in New York City, Education and Income 18
Latino Data Project Report 53 September 2013
37.9%
33.1%
23.5%
3.5% 2.0%
63.0%
23.5%
11.7%
1.2% 0.7%0%
10%
20%
30%
40%
50%
60%
70%
Less than 20,000 20,000-39,999 40,000-74,999 75,000-99,999 100,000+
Figure 14Distribution of Personal Income among Latino/a Population by Sex, 1990
(in percentages of population 25 years of age and higher)
Male Female
$25,000
$28,250
$15,000
$25,000
$13,559
$28,050
$0 $10,000 $20,000 $30,000 $40,000
Female
Male
Figure 13Median Personal Income among Latino/a Population by Sex, 1990 - 2010
(in inflation adjusted 2010 dollars)
1990 2000 2010

Latinas in New York City, Education and Income 19
Latino Data Project Report 53 September 2013
39.9%
31.3%
21.8%
3.9% 3.2%
59.8%
23.4%
13.1%
2.1% 1.7%
0%
10%
20%
30%
40%
50%
60%
70%
Less than 20,000 20,000-39,999 40,000-74,999 75,000-99,999 100,000+
Figure 15Distribution of Personal Income among Latino/a Population by Sex, 2000
(in percentages of population 25 years of age and higher)
Male Female
40.8%
31.2%
20.5%
4.0% 3.5%
56.3%
23.3%
15.2%
3.1% 2.1%
0%
10%
20%
30%
40%
50%
60%
70%
Less than 20,000 20,000-39,999 40,000-74,999 75,000-99,999 100,000+
Figure 16Distribution of Personal Income among Latino/a Population by Sex, 2010
(in percentages of population 25 years of age and higher
Male Female

Latinas in New York City, Education and Income 20
Latino Data Project Report 53 September 2013
Personal Income among the Female Population by Race/Ethnicity in New York City
Latinas had the lowest median annual personal income from 1990 to 2010 compared with
women of the other major race/ethnic groups. Median income increased among the City’s Latinas, as
did the median incomes among Non-Hispanic White, Non-Hispanic Black, and Asian females. (See
figure 17).
From 1990 to 2010, Latinas were more likely than any other racial/ethnic group to earn less
than $20,000 annually. (See figure 18). Latinas were also less likely than all other racial/ethnic groups
to earn above $100,000 annually from 1990 to 2010. In 2010, the City’s Latinas earned more
than$100,000 (2%) at a lower rate than Non-Hispanic White (6%) and Asian (3%) women did in 1990.
(See figure 19). From 1990 to 2010, relative to females of the other major racial/ethnic groups, not
only did a greater portion of Latinas earn less than $20,000 annually, but Latinas also had lower
percentages earning at every other income level. With exception, from 1990 to 2010, essentially equal
percentages of Latinas and Non-Hispanic White females earned between $20,000 and $40,000. (See
table 8). Overall, Latinas earning less than women of other racial/ethnic groups may be attributed to
Latinas’ lower levels of educational attainment and the increasing number of foreign-born Latinas in
New York City.
Across these three decades, there was disparity in annual personal income between Latinas
and females of the other major racial/ethnic groups. From 1990 to 2010, Latinas were more likely to
earn less than $20,000 and less likely to earn greater than $20,000 relative to females of other major
racial/ethnic groups. While the City’s Latinas achieved greater levels of income, these have not been
fast enough to catch up with the levels of income of females of other racial/ethnic groups, who also
experienced higher levels of income over the three decades.
Male Female Male Female Male Female
Less than 20,000 37.9% 63.0% 39.9% 59.8% 40.8% 56.3%
20,000-39,999 33.1% 23.5% 31.3% 23.4% 31.2% 23.3%
40,000-74,999 23.5% 11.7% 21.8% 13.1% 20.5% 15.2%
75,000-99,999 3.5% 1.2% 3.9% 2.1% 4.0% 3.1%
100,000+ 2.0% 0.7% 3.2% 1.7% 3.5% 2.1%
Total 100.0% 100.0% 100.0% 100.0% 100.0% 100.0%
2010
Table 7
Distribution of Personal Income Among Latino/a Population by Sex,
1990 – 2010 (population 25 years of age and higher)
1990 2000

Latinas in New York City, Education and Income 21
Latino Data Project Report 53 September 2013
40.1%43.5%
63.0%
46.3%
35.9%
41.3%
59.8%
46.2%
33.0%
40.4%
56.3%
44.3%
0%
10%
20%
30%
40%
50%
60%
70%
Non-Hispanic White Non-Hispanic Black Latina Asian
Figure 18Percentage of Female Population which made Less than $20,000 in Yearly Personal
Income by Race/Ethnicity, 1990 – 2010 (in percentages of population 25 years of age and higher)
1990 2000 2010
$32,000
$25,000
$32,000
$45,800
$22,938
$15,000
$25,125
$31,250
$23,100
$13,559
$24,750
$27,027
$0 $10,000 $20,000 $30,000 $40,000 $50,000 $60,000
Asian
Latina
Non-Hispanic Black
Non-Hispanic White
Figure 17Median Personal Income among the Female Population by Race/Ethnicity, 1990 - 2010
(in inflation adjusted 2010 dollars)
1990 2000 2010

Latinas in New York City, Education and Income 22
Latino Data Project Report 53 September 2013
5.7%
0.9% 0.7%
3.0%
10.3%
2.6%
1.7%
5.7%
12.1%
2.7%2.1%
7.6%
0%
2%
4%
6%
8%
10%
12%
14%
Non-Hispanic White Non-Hispanic Black Latina Asian
Figure 19Percentage of Female Population which made More than $100,000 in Yearly Personal
Income by Race/Ethnicity, 1990 – 2010 (in percentages of population 25 years of age and higher)
1990 2000 2010
Male Female Male Female Male Female Male Female
1990 Less than 20,000 19.8% 40.1% 32.9% 43.5% 37.9% 63.0% 36.6% 46.3%
20,000-39,999 19.9% 23.0% 30.6% 31.7% 33.1% 23.5% 27.4% 24.2%
40,000-74,999 32.9% 25.2% 29.4% 21.5% 23.5% 11.7% 24.8% 23.1%
75,000-99,999 12.2% 6.0% 4.9% 2.4% 3.5% 1.2% 6.0% 3.4%
100,000+ 15.2% 5.7% 2.2% 0.9% 2.0% 0.7% 5.3% 3.0%
Total 100.0% 100.0% 100.0% 100.0% 100.0% 100.0% 100.0% 100.0%
2000 Less than 20,000 20.6% 35.9% 33.5% 41.3% 39.9% 59.8% 36.4% 46.2%
20,000-39,999 19.7% 22.2% 29.9% 30.3% 31.3% 23.4% 27.9% 22.5%
40,000-74,999 28.4% 24.2% 27.1% 22.0% 21.8% 13.1% 21.8% 19.3%
75,000-99,999 11.3% 7.5% 5.7% 3.9% 3.9% 2.1% 5.8% 6.3%
100,000+ 20.0% 10.3% 3.8% 2.6% 3.2% 1.7% 8.1% 5.7%
Total 100.0% 100.0% 100.0% 100.0% 100.0% 100.0% 100.0% 100.0%
2010 Less than 20,000 20.5% 33.0% 35.4% 40.4% 40.8% 56.3% 36.0% 44.3%
20,000-39,999 20.2% 21.9% 27.7% 30.5% 31.2% 23.3% 25.1% 20.9%
40,000-74,999 26.9% 24.4% 27.3% 21.7% 20.5% 15.2% 22.7% 21.1%
75,000-99,999 10.0% 8.6% 5.7% 4.7% 4.0% 3.1% 6.4% 6.1%
100,000+ 22.4% 12.1% 3.9% 2.7% 3.5% 2.1% 9.8% 7.6%
Total 100.0% 100.0% 100.0% 100.0% 100.0% 100.0% 100.0% 100.0%
Table 8
Distribution of Personal Income by Sex and Race/Ethnicity, 1990 – 2010
(in percentages of population 25 years of age and older)
Non-Hispanic
White
Non-Hispanic
Black Latino Asian
Year Income

Latinas in New York City, Education and Income 23
Latino Data Project Report 53 September 2013
Personal Income among the Latina Population by Nationality in New York City
Among females of the five largest Latino Nationalities in New York City median annual incomes
increased from 1990 to 2010. Puerto Rican women had the largest increase in median income,
income increases among Colombian, Ecuadorian, and Dominican women were relatively modest, and
the income increase among Mexican women was small. (See figure 20). As Mexican women had
relatively lower educational attainment and foreign-born Mexican women may be less likely to arrive
in the U.S. with a high school degree, the increase in foreign-born Mexican women after 1990 and
their overall decline in educational attainment rates over the last three decades likely contributed to
their stagnant changes in median income. The decrease in foreign-born women of other Latino
nationalities in New York City and overall increase in educational attainment likely contributed to their
increased median incomes.
Between 1990 and 2010, the percentage of Puerto Rican, Colombian, Ecuadorian, and
Dominican women earning less than $20,000 in annual personal income decreased. In 1990, 52% of
Mexican women reported income of less than $20,000 annually. However, the percentage of Mexican
women earning less than $20,000 increased from 1990 to 2010, with a peak in 2000 (65%). In each
census year from 1990 to 2010, Dominican women were most likely to earn less than $20,000
annually. As of 2010, Colombian women were the least likely to earn less than $20,000 annually
(55%), followed by Ecuadorian (56%) and Puerto Rican women (56%), Mexican women (61%), and
Dominican women (62%). (See figure 21). Among Latinas, annual personal incomes above $100,000
among the five largest Latino nationalities in New York City varied greatly by national group from 1990
to 2010. The percentages of Mexican, Puerto Rican, and Ecuadorian women earning above $100,000
increased from 1990 to 2010. The percentage of Colombian and Dominican earning above $100,000
increased from 1990 to 2000, but decreased in 2010. (See table 9 and figure 22).
$19,000
$19,400
$25,000
$32,000
$16,800
$13,125
$15,375
$17,500
$13,500
$14,250
$12,375
$16,355
$17,637
$11,550
$17,160
$0 $10,000 $20,000 $30,000 $40,000
Dominican
Ecuadorian
Colombian
Puerto Rican
Mexican
Figure 20Median Personal Income among Latina Population of the Five Largest Latino Nationalities in
New York City, 1990 – 2010 (in inflation adjusted 2010 dollars)
1990 2000 2010

Latinas in New York City, Education and Income 24
Latino Data Project Report 53 September 2013
52.4%
64.6%
57.1%60.1%
73.2%
65.0%59.6%
53.8%59.9%
66.6%61.1%
55.5% 54.7% 56.4%62.0%
0%
20%
40%
60%
80%
100%
Mexican Puerto Rican Colombian Ecuadorian Dominican
Figure 21Percentage of Latina Population which made Less than $20,000 in Yearly Personal Income for
Five Largest Latino Nationalities in New York City, 1990 – 2010 (in percentages of population 25 years of age and higher)
1990 2000 2010
1.9%
0.4%
0.8%
0.2%0.4%
2.4%
1.4%
2.4%
0.8%1.1%
3.5%
2.4%
1.6%
2.0%
0.9%
0%
1%
2%
3%
4%
5%
Mexican Puerto Rican Colombian Ecuadorian Dominican
Figure 22Percentage of Latina Population which made More than $100,000 in Yearly Personal Income by Nationality for Five Largest Latino Nationalities in New York City, 1990 – 2010 (in percentages of
population 25 years of age and higher)
1990 2000 2010

Latinas in New York City, Education and Income 25
Latino Data Project Report 53 September 2013
Male Female Male Female Male Female
Mexican Less than 20,000 45.5% 52.4% 46.6% 65.0% 44.2% 61.1%
20,000-39,999 33.9% 29.3% 34.9% 20.1% 35.9% 20.8%
40,000-74,999 15.7% 14.3% 12.8% 10.2% 15.0% 12.3%
75,000-99,999 2.6% 2.0% 2.8% 2.3% 2.2% 2.4%
100,000+ 2.4% 1.9% 2.8% 2.4% 2.7% 3.5%
Total 100.0% 100.0% 100.0% 100.0% 100.0% 100.0%
Puerto Rican Less than 20,000 40.4% 64.6% 40.1% 59.6% 42.5% 55.5%
20,000-39,999 29.5% 21.9% 27.1% 22.2% 25.6% 23.1%
40,000-74,999 24.8% 11.9% 25.3% 14.6% 22.1% 15.6%
75,000-99,999 3.8% 1.1% 4.7% 2.1% 5.6% 3.3%
100,000+ 1.6% 0.4% 2.8% 1.4% 4.2% 2.4%
Total 100.0% 100.0% 100.0% 100.0% 100.0% 100.0%
Colombian Less than 20,000 30.1% 57.1% 32.5% 53.8% 25.7% 54.7%
20,000-39,999 38.8% 29.2% 34.9% 27.3% 34.3% 27.3%
40,000-74,999 25.6% 12.0% 23.4% 13.5% 26.7% 12.0%
75,000-99,999 3.6% 0.9% 5.4% 2.9% 7.4% 4.3%
100,000+ 1.9% 0.8% 3.9% 2.4% 5.9% 1.6%
Total 100.0% 100.0% 100.0% 100.0% 100.0% 100.0%
Ecuadorian Less than 20,000 35.7% 60.1% 37.7% 59.9% 36.7% 56.4%
20,000-39,999 39.5% 28.9% 39.2% 26.8% 35.4% 23.7%
40,000-74,999 21.8% 9.6% 19.0% 10.8% 22.1% 14.8%
75,000-99,999 2.2% 1.2% 2.4% 1.7% 3.1% 3.1%
100,000+ 0.8% 0.2% 1.6% 0.8% 2.7% 2.0%
Total 100.0% 100.0% 100.0% 100.0% 100.0% 100.0%
Dominican Less than 20,000 43.5% 73.2% 44.7% 66.6% 46.5% 62.0%
20,000-39,999 35.6% 19.1% 32.4% 22.5% 31.3% 22.6%
40,000-74,999 17.8% 6.8% 18.5% 8.9% 18.3% 12.6%
75,000-99,999 2.3% 0.5% 2.3% 1.0% 2.8% 2.0%
100,000+ 0.9% 0.4% 2.1% 1.1% 1.1% 0.9%
Total 100.0% 100.0% 100.0% 100.0% 100.0% 100.0%
Table 9
Distribution of Personal Income among Latino/a Population by Sex and Nationality for
Five Largest Latino Nationalities in New York City, 1990 – 2010
(in percentages of population 25 years of age and higher)
Nationality Income
1990 2000 2010

Latinas in New York City, Education and Income 26
Latino Data Project Report 53 September 2013
Personal Income among the Latino Population by Nativity in New York City
Foreign-born Latinas had lower median incomes compared to domestic-born Latinas from 1990 to
2010 in New York City. While both groups’ median incomes increased across the years, domestic-
born women’s median income increased at a greater rate. Domestic-born women’s greater
improvement in higher education attainment compared to foreign-born women likely contributed to
this increasing disparity. (See figure 23).
From 1990 to 2010, foreign-born women earned less than domestic-born women, as a
significantly larger percentage of foreign-born women earned less than $20,000 in annual personal
income. This difference between the City’s foreign- and domestic-born women increased from 1990 to
2010 mainly because of decreasing percentages of domestic-born Latinas who earned less than
$20,000 annually. (See figure 24). A greater share of both foreign- and domestic-born Latinas earned
above $100,000 annually in 2010 than in 1990. Domestic-born Latinas were more likely than foreign-
born to earn above $100,000 in all census years. The disparity between the two groups increased
from 1990 to 2010. Again, this difference is likely attributed to domestic-born women achieving higher
education at greater rates than foreign-born women. (See figure 25 and table 10).
$35,000
$20,000
$25,000
$12,875
$19,800
$12,695
$0 $10,000 $20,000 $30,000 $40,000 $50,000
Domestic-Born
Foreign-Born
Figure 23Median Personal Income among Latina Population by Nativity, 1990 - 2010
(in inflation adjusted 2010 dollars)
1990 2000 2010

Latinas in New York City, Education and Income 27
Latino Data Project Report 53 September 2013
Note: For Puerto Ricans 'foreign-born' means born on the island.
Note: For Puerto Ricans 'foreign-born' means born on the island.
0.6%
1.4% 1.5%
0.8%
2.4%
3.8%
0%
1%
2%
3%
4%
5%
1990 2000 2010
Figure 25Percentage of Latina Population which made More than $100,000 in Yearly Personal
Income by Nativity, 1990 – 2010 (in percentages of population 25 years of age and higher)
Foreign-Born Domestic-Born
66.9% 65.3% 63.4%
50.6%
42.5%38.5%
0%
20%
40%
60%
80%
1990 2000 2010
Figure 24Percentage of Latina Population which made Less than $20,000 in Yearly Personal Income
by Nativity 1990 – 2010 (in percentages of population 25 years of age and higher)
Foreign-Born Domestic-Born
Latinas in New York City, Education and Income 28
Latino Data Project Report 53 September 2013
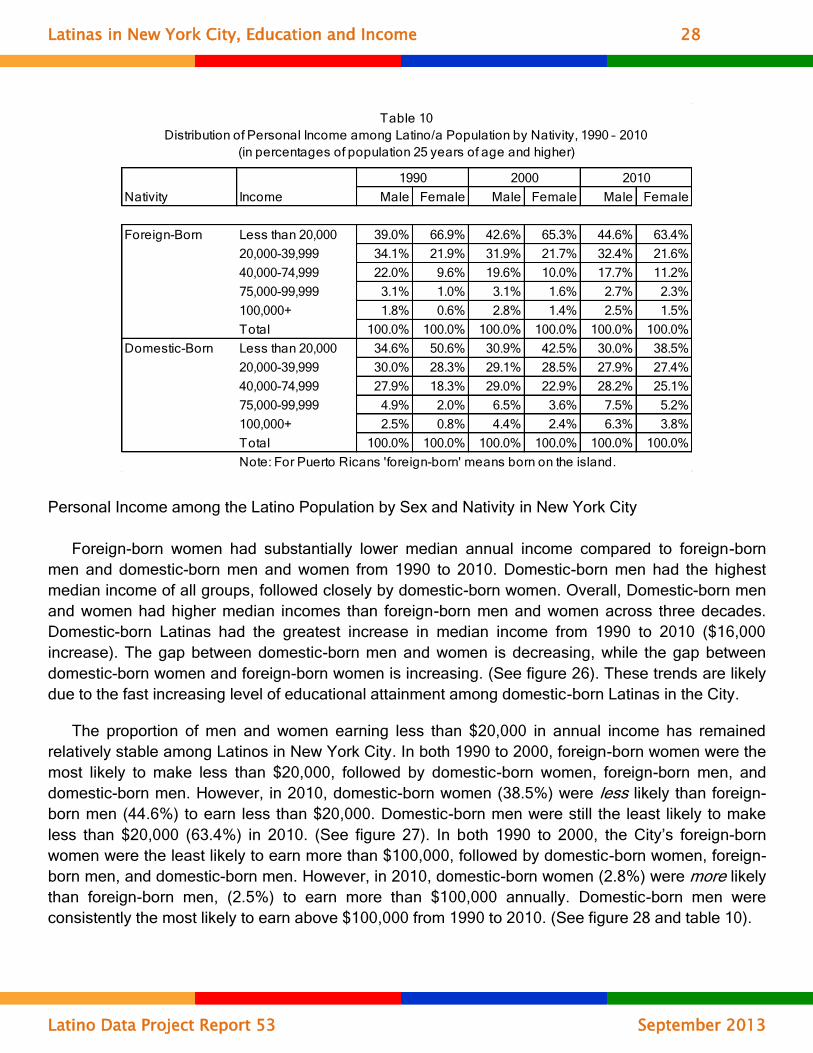
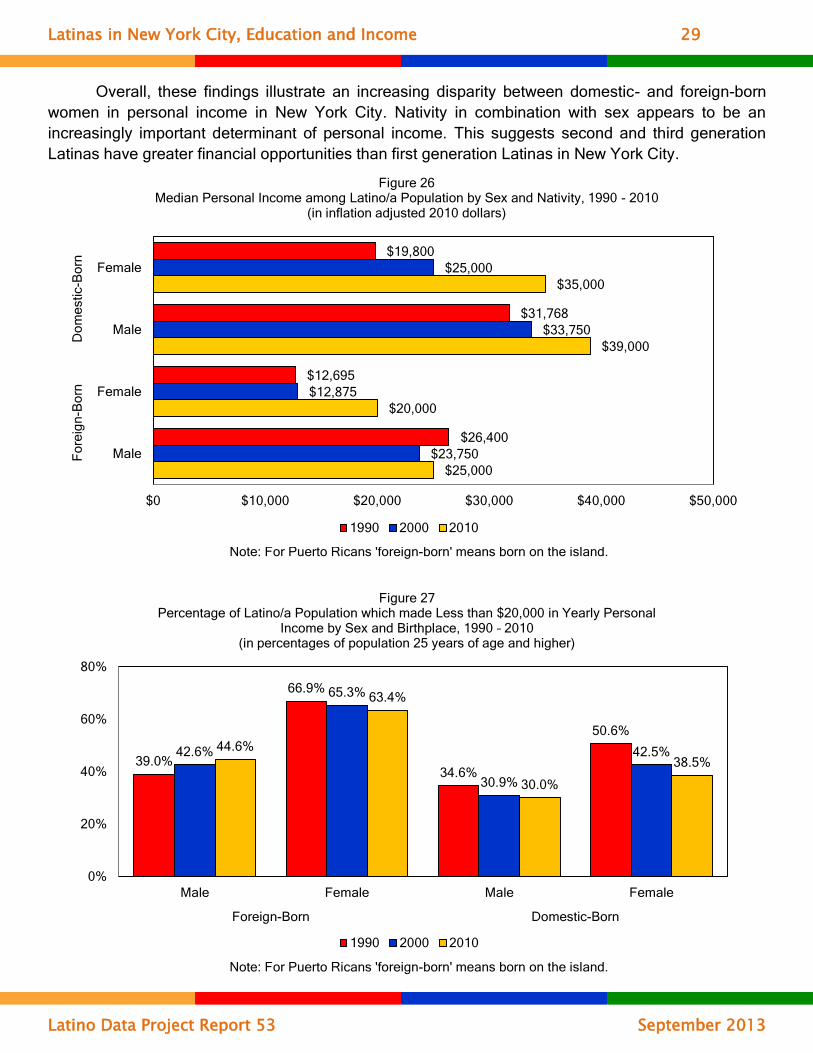
Personal Income among the Latino Population by Sex and Nativity in New York City
Foreign-born women had substantially lower median annual income compared to foreign-born
men and domestic-born men and women from 1990 to 2010. Domestic-born men had the highest
median income of all groups, followed closely by domestic-born women. Overall, Domestic-born men
and women had higher median incomes than foreign-born men and women across three decades.
Domestic-born Latinas had the greatest increase in median income from 1990 to 2010 ($16,000
increase). The gap between domestic-born men and women is decreasing, while the gap between
domestic-born women and foreign-born women is increasing. (See figure 26). These trends are likely
due to the fast increasing level of educational attainment among domestic-born Latinas in the City.
The proportion of men and women earning less than $20,000 in annual income has remained
relatively stable among Latinos in New York City. In both 1990 to 2000, foreign-born women were the
most likely to make less than $20,000, followed by domestic-born women, foreign-born men, and
domestic-born men. However, in 2010, domestic-born women (38.5%) were less likely than foreign-
born men (44.6%) to earn less than $20,000. Domestic-born men were still the least likely to make
less than $20,000 (63.4%) in 2010. (See figure 27). In both 1990 to 2000, the City’s foreign-born
women were the least likely to earn more than $100,000, followed by domestic-born women, foreign-
born men, and domestic-born men. However, in 2010, domestic-born women (2.8%) were more likely
than foreign-born men, (2.5%) to earn more than $100,000 annually. Domestic-born men were
consistently the most likely to earn above $100,000 from 1990 to 2010. (See figure 28 and table 10).
Male Female Male Female Male Female
Foreign-Born Less than 20,000 39.0% 66.9% 42.6% 65.3% 44.6% 63.4%
20,000-39,999 34.1% 21.9% 31.9% 21.7% 32.4% 21.6%
40,000-74,999 22.0% 9.6% 19.6% 10.0% 17.7% 11.2%
75,000-99,999 3.1% 1.0% 3.1% 1.6% 2.7% 2.3%
100,000+ 1.8% 0.6% 2.8% 1.4% 2.5% 1.5%
Total 100.0% 100.0% 100.0% 100.0% 100.0% 100.0%
Domestic-Born Less than 20,000 34.6% 50.6% 30.9% 42.5% 30.0% 38.5%
20,000-39,999 30.0% 28.3% 29.1% 28.5% 27.9% 27.4%
40,000-74,999 27.9% 18.3% 29.0% 22.9% 28.2% 25.1%
75,000-99,999 4.9% 2.0% 6.5% 3.6% 7.5% 5.2%
100,000+ 2.5% 0.8% 4.4% 2.4% 6.3% 3.8%
Total 100.0% 100.0% 100.0% 100.0% 100.0% 100.0%
Note: For Puerto Ricans 'foreign-born' means born on the island.
Table 10
Distribution of Personal Income among Latino/a Population by Nativity, 1990 – 2010
(in percentages of population 25 years of age and higher)
Nativity Income
1990 2000 2010
Latinas in New York City, Education and Income 29
Latino Data Project Report 53 September 2013
Overall, these findings illustrate an increasing disparity between domestic- and foreign-born
women in personal income in New York City. Nativity in combination with sex appears to be an
increasingly important determinant of personal income. This suggests second and third generation
Latinas have greater financial opportunities than first generation Latinas in New York City.
Note: For Puerto Ricans 'foreign-born' means born on the island.
Note: For Puerto Ricans 'foreign-born' means born on the island.
39.0%
66.9%
34.6%
50.6%
42.6%
65.3%
30.9%
42.5%44.6%
63.4%
30.0%
38.5%
0%
20%
40%
60%
80%
Male Female Male Female
Foreign-Born Domestic-Born
Figure 27Percentage of Latino/a Population which made Less than $20,000 in Yearly Personal
Income by Sex and Birthplace, 1990 – 2010 (in percentages of population 25 years of age and higher)
1990 2000 2010
$25,000
$20,000
$39,000
$35,000
$23,750
$12,875
$33,750
$25,000
$26,400
$12,695
$31,768
$19,800
$0 $10,000 $20,000 $30,000 $40,000 $50,000
Male
Female
Male
Female
Fo
reig
n-B
orn
Do
me
stic-B
orn
Figure 26Median Personal Income among Latino/a Population by Sex and Nativity, 1990 - 2010
(in inflation adjusted 2010 dollars)
1990 2000 2010

Latinas in New York City, Education and Income 30
Latino Data Project Report 53 September 2013
Household Income
Household Income among Latino Households Headed by Women in New York City
Among households headed by Latinas in New York City, median annual income increased
from 1990 to 2010. However, this increase was only modest. The percentage of households headed
by Latinas earning income below $20,000 decreased from 1990 to 2010. In 1990, 47% of Latina-
headed households earned less than $20,000. This rate decreased in 2000 to 41%, and again in 2010
to 36%. From 1990 to 2010, the percentage of households headed by Latinas earning above
$100,000 increased. In1990, only 5% of households headed by Latinas in New York City earned more
than $100,000 annually. This increased in 2000 to 7%, and to 10% in 2010. (See figures 29 through
31 and table 11).
Note: For Puerto Ricans 'foreign-born' means born on the island.
1.8%
0.6%
2.5%
0.8%
2.8%
1.4%
4.4%
2.4%2.5%
1.5%
6.3%
3.8%
0%
2%
4%
6%
8%
Male Female Male Female
Foreign-Born Domestic-Born
Figure 28Percentage of Latino/a Population which made More than $100,000 in Yearly Personal
Income by Sex and Nativity, 1990 – 2010 (in percentages of population 25 years of age and higher)
1990 2000 2010

Latinas in New York City, Education and Income 31
Latino Data Project Report 53 September 2013
46.7%
40.7%
36.1%
0%
10%
20%
30%
40%
50%
60%
1990 2000 2010
Figure 30Latina-Headed Households with Household Income Less than $20,000, 1990 – 2010 (in
percentages of population 25 years of age and higher)
$30,100
$45,000
$26,875
$47,738
$23,305
$49,500
$0 $10,000 $20,000 $30,000 $40,000 $50,000 $60,000
Female
Male
Figure 29Median Household Income among Latino/as who were Household Heads by Sex,
1990 - 2010 (in inflation adjusted 2010 dollars)
1990 2000 2010

Latinas in New York City, Education and Income 32
Latino Data Project Report 53 September 2013
Male Female Male Female Male Female
Household Head Less than 20,000 17.7% 46.7% 19.2% 40.7% 21.1% 36.1%
20,000-39,999 22.6% 22.4% 22.6% 23.3% 24.0% 23.5%
40,000-74,999 33.3% 20.9% 31.2% 22.2% 29.7% 22.6%
75,000-99,999 13.4% 5.4% 12.1% 6.8% 10.3% 7.5%
100,000+ 12.9% 4.5% 14.9% 7.0% 14.9% 10.1%
Total 100.0% 100.0% 100.0% 100.0% 100.0% 100.0%
Less than 20,000 14.0% 12.6% 13.5% 12.8% 10.2% 11.5%
20,000-39,999 19.0% 20.0% 20.0% 20.4% 17.9% 20.0%
40,000-74,999 29.5% 32.8% 31.5% 32.4% 30.7% 29.8%
75,000-99,999 13.3% 14.8% 15.3% 14.0% 12.2% 12.3%
100,000+ 24.1% 19.8% 19.7% 20.3% 29.0% 26.5%
Total 100.0% 100.0% 100.0% 100.0% 100.0% 100.0%
Not Household
Head
1990 2000
Position Income
Table 11
Distribution of Household Income among Latino/a Population by Household Head and Sex, 1990 – 2010
(in percentages of population 25 years of age and older)
2010
4.5%
7.0%
10.1%
0%
2%
4%
6%
8%
10%
12%
1990 2000 2010
Figure 31Latina-Headed Households with Household Income More than $100,000, 1990 – 2010 (in
percentages of population 25 years of age and higher)

Latinas in New York City, Education and Income 33
Latino Data Project Report 53 September 2013
Household Income among Latino/a Households By Sex in New York City
Among Latino/a households, households headed by Latinas had lower median annual incomes
compared to households headed by Latinos. However, households headed by women have increased
in median income, while households headed by men have decreased in median income, from 1990 to
2010. (See figure 29). This is likely attributable to the increasingly greater levels of higher education
attainment among the City’s Latinas compared to Latinos.
Among all Latino/as, households headed by women were more likely than households headed
by men to earn less than $20,000 annually from 1990 to 2010. Households headed by women were
less likely than men to earn above $100,000 annually. Households headed by women earning more
than $100,000 annually increased from 1990 (5%) to 2010 (10%). Households headed by men
earning more than $100,000 also increased from 1990 (13%) to 2010 (15%). (See figures 32 and 33,
and table 11).
From 1990 to 2010, there were consistent differences between Latino households headed by
men or women at all levels of income, with the exception of fairly equal rates between men and
women at the $20,000 and $40,000 level. This difference between the sexes is likely due to higher
percentages of households headed by women earning lower levels of income and higher percentages
of households headed by, men earning higher levels (above $40,000). The magnitude of the
differentials has narrowed in the past three decades, across all levels of income in the City.
17.7% 19.2%21.1%
46.7%
40.7%
36.1%
0%
10%
20%
30%
40%
50%
60%
1990 2000 2010
Figure 32Percentage of Latino/a Households with Household Income Less than $20,000 by Sex,
1990 – 2010 (in percentages of population 25 years of age and higher)
Male Female

Latinas in New York City, Education and Income 34
Latino Data Project Report 53 September 2013
Household Income among Female-Headed Households by Race/Ethnicity in New York City
Among household headed by women of all racial/ethnic groups, Latinas had the lowest median
household income from 1990 to 2010 compared with women of the other major race/ethnic groups.
Median income increased among the City’s Latinas, as did median incomes among households
headed by Non-Hispanic White, Non-Hispanic Black, and Asian women. Non-Hispanic White women
had the greatest increase, while Asian women had relatively high but stable levels of household
income across the census years. (See figure 34).
From 1990 to 2010, the percentage of Latina-headed households earning less than $20,000 in
yearly household income in New York City was consistently greater than the percentage of
households headed by women of the other major racial/ethnic groups. The percentage of households
headed by Latinas earning less than $20,000 in 2010 was 36%. (See figure 35). The percentage of
Latina-headed households earning more than $100,000 was lower than households headed by
women of the other racial/ethnic groups from 1990 to 2010. In 2010, the percentage of Latina-headed
households with income greater than $100,000 was 10%. (See figure 36 and table 12).
From 1990 through 2010 there was a consistent disparity in yearly household income between
Latina-headed households and households headed by women of the major racial/ethnic groups. From
1990 to 2010, greater percentages of Latina-headed households earned less than $20,000 and fewer
Latina-headed households earned greater than $100,000, relative to the female-headed households
of other racial/ethnic groups. These trends are likely due to Latinas’ lower levels of educational
attainment compared to women of the other racial/ethnic groups. This suggests Latinas have less
financial opportunity than women of other racial/ethnic groups.
12.9%
14.9% 14.9%
4.5%
7.0%
10.1%
0%
5%
10%
15%
20%
1990 2000 2010
Figure 33Percentage of Latino/a Households with Household Incomes More than $100,000 by Sex,
1990 – 2010 (in percentages of population 25 years of age and higher)
Male Female

Latinas in New York City, Education and Income 35
Latino Data Project Report 53 September 2013
26.8%
33.4%
46.7%
8.8%
22.4%
30.9%
40.7%
11.9%
17.8%
27.6%
36.1%
11.7%
0%
10%
20%
30%
40%
50%
60%
Non-Hispanic White Non-Hispanic Black Latina Asian
Figure 35Female-Headed Households with Household Income Less than $20,000 by
Race/Ethnicity, 1990 – 2010 (in percentages of population 25 years of age and higher)
1990 2000 2010
$52,400
$30,100
$37,500
$58,800
$51,250
$26,875
$35,725
$50,000
$51,150
$23,305
$34,556
$42,900
$0 $10,000 $20,000 $30,000 $40,000 $50,000 $60,000 $70,000
Asian
Latina
Non-Hispanic Black
Non-Hispanic White
Figure 34Median Household Income among Female Population who were Household Heads by
Race/Ethnicity, 1990 - 2010 (in inflation adjusted 2010 dollars)
1990 2000 2010

Latinas in New York City, Education and Income 36
Latino Data Project Report 53 September 2013
16.1%
7.5%
4.5%
18.8%
22.9%
10.0%
7.0%
21.9%
30.4%
11.6%10.1%
23.4%
0%
10%
20%
30%
40%
Non-Hispanic White Non-Hispanic Black Latina Asian
Figure 36Female-Headed Households with Household Incomes More than $100,000 by
Race/Ethnicity, 1990 – 2010 (in percentages of population 25 years of age and higher)
1990 2000 2010
Household
Head
Not
Household
Head
Household
Head
Not
Household
Head
Household
Head
Not
Household
Head
Household
Head
Not
Household
Head
1990 Less than 20,000 26.8% 5.9% 33.4% 8.0% 46.7% 12.6% 20.3% 8.8%
20,000-39,999 19.3% 11.0% 24.1% 13.7% 22.4% 20.0% 20.4% 17.0%
40,000-74,999 27.4% 23.9% 26.7% 27.4% 20.9% 32.8% 27.5% 29.3%
75,000-99,999 10.5% 15.9% 8.2% 18.0% 5.4% 14.8% 13.0% 15.7%
100,000+ 16.1% 43.4% 7.5% 32.9% 4.5% 19.8% 18.8% 29.2%
Total 100.0% 100.0% 100.0% 100.0% 100.0% 100.0% 100.0% 100.0%
2000 Less than 20,000 22.4% 7.5% 30.9% 9.0% 40.7% 12.8% 21.0% 11.9%
20,000-39,999 18.2% 11.5% 23.9% 14.9% 23.3% 20.4% 18.3% 17.8%
40,000-74,999 25.0% 22.2% 26.4% 28.5% 22.2% 32.4% 26.7% 26.8%
75,000-99,999 11.4% 15.0% 8.8% 17.0% 6.8% 14.0% 12.1% 13.6%
100,000+ 22.9% 43.8% 10.0% 30.6% 7.0% 20.3% 21.9% 30.0%
Total 100.0% 100.0% 100.0% 100.0% 100.0% 100.0% 100.0% 100.0%
2010 Less than 20,000 17.8% 6.0% 27.6% 7.4% 36.1% 11.5% 19.5% 11.7%
20,000-39,999 18.6% 11.5% 25.6% 15.0% 23.5% 20.0% 20.3% 17.1%
40,000-74,999 22.3% 20.2% 26.4% 26.9% 22.6% 29.8% 25.2% 24.8%
75,000-99,999 10.9% 13.4% 8.8% 13.7% 7.5% 12.3% 11.7% 13.4%
100,000+ 30.4% 49.0% 11.6% 37.0% 10.1% 26.5% 23.4% 33.0%
Total 100.0% 100.0% 100.0% 100.0% 100.0% 100.0% 100.0% 100.0%
Table 12
Distribution of Household Income among the Female Population by Household Head and Race/Ethnicity, 1990 – 2010
(in percentages of population 25 years of age and older)
Asian
Year Income
Non-Hispanic White Non-Hispanic Black Latina

Latinas in New York City, Education and Income 37
Latino Data Project Report 53 September 2013
Household Income among Latina-Headed Households by Nationality in New York City
Among households headed by females of the five largest Latino Nationalities in New York City,
median incomes increased among Puerto Rican, Ecuadorian, and Dominican women from 1990 to
2010. Ecuadorian women had the greatest increase in median household income, while Puerto Rican
and Dominican women had modest increases. Income among households headed by Colombian
women was stable, while income among Mexican women decreased from 1990 to 2010 (by over
$10,000). (See figure 37). Foreign-born Mexican women may be less likely to arrive in the U.S. with a
high school degree. It is likely that the increased foreign-born Mexican population after 1990, along
with Mexican women’s overall decline in educational attainment over the last three decades,
contributed to their decline in household income. Increases in median income among Latina-headed
households of the other nationalities are likely related to the increase in domestic-born Latinas within
these groups in New York City.
Among Latinas, households headed by Puerto Rican and Dominican women were more likely
than households headed by Mexican, Colombian, and Ecuadorian women to earn below $20,000
annually from 1990 to 2010. In 2010, households headed by Puerto Rican women were most likely to
earn below $20,000 (44%), followed by Dominican (37%), Mexican (28%), Ecuadorian (27%), and
Colombian (25%) women. (See figure 38 and table 13).
The percentage of households headed by Puerto Rican, Colombian, Ecuadorian, and
Dominican women with earnings over $100,000 increased from 1990 to 2010. Among households
headed by the City’s Mexican women there was a decline in those earning over $100,000 annually.
By 2010, 16% of Colombian females heading households earned over $100,000, followed by
Ecuadorian (14%), Mexican (12%), Puerto Rican (10%), and Dominican (6%) females. (See figure 39
and table 13).
Among households headed by Latinas of the five largest Latina nationalities in New York City,
there was a great deal of variation and change in household income, both across time and among the
nationalities. While female Puerto Rican, Colombian, Ecuadorian, and Dominican headed households
increasingly earned higher levels of income, households headed by Mexican women trended toward
lower levels of income. This is likely due to an influx in arrival of foreign-born Mexicans in recent
years.

Latinas in New York City, Education and Income 38
Latino Data Project Report 53 September 2013
24.2%
52.5%
28.2%
36.6%
47.0%
25.9%
47.5%
24.9%
29.8%
39.2%
28.4%
44.4%
25.0%27.0%
37.3%
0%
10%
20%
30%
40%
50%
60%
Mexican Puerto Rican Colombian Ecuadorian Dominican
Figure 38Latina-headed Households with Household Income Less than $20,000 by Nationality for Five Largest
Latino Nationalities in New York City, 1990 – 2010 (in percentages of population 25 years of age and higher)
1990 2000 2010
$28,000
$42,200
$40,000
$25,000
$32,900
$27,500
$36,250
$40,000
$21,250
$37,313
$22,440
$32,109
$36,300
$18,533
$45,045
$0 $10,000 $20,000 $30,000 $40,000 $50,000 $60,000
Dominican
Ecuadorian
Colombian
Puerto Rican
Mexican
Figure 37Median Household Income among Latinas who were Household Heads by Nationality,
1990 – 2010 (in inflation adjusted 2010 dollars)
1990 2000 2010

Latinas in New York City, Education and Income 39
Latino Data Project Report 53 September 2013
13.6%
3.7%
5.5%
3.3%3.8%
11.1%
5.5%
12.6%
9.7%
5.8%
11.9%
10.1%
15.8%
13.5%
6.2%
0%
5%
10%
15%
20%
Mexican Puerto Rican Colombian Ecuadorian Dominican
Figure 39Latina-Headed Households with Household Incomes More than $100,000 by Nationality for Five Largest
Latino Nationalities in New York City, 1990 – 2010(in percentages of population 25 years of age and higher)
1990 2000 2010

Latinas in New York City, Education and Income 40
Latino Data Project Report 53 September 2013
Household
Head
Not
Household
Head
Household
Head
Not
Household
Head
Household
Head
Not
Household
Head
Mexican Less than 20,000 24.2% 7.2% 25.9% 13.9% 28.4% 10.4%
20,000-39,999 19.0% 17.5% 29.7% 24.2% 24.9% 26.4%
40,000-74,999 32.6% 32.5% 23.6% 32.0% 26.5% 34.9%
75,000-99,999 10.7% 15.2% 9.7% 13.6% 8.3% 8.3%
100,000+ 13.6% 27.5% 11.1% 16.3% 11.9% 20.1%
Total 100.0% 100.0% 100.0% 100.0% 100.0% 100.0%
Puerto Rican Less than 20,000 52.5% 15.9% 47.5% 16.0% 44.4% 12.9%
20,000-39,999 20.6% 17.9% 21.5% 17.4% 21.6% 16.8%
40,000-74,999 18.5% 31.5% 19.3% 30.3% 17.8% 23.4%
75,000-99,999 4.7% 15.5% 6.2% 15.0% 5.9% 15.3%
100,000+ 3.7% 19.3% 5.5% 21.3% 10.1% 31.6%
Total 100.0% 100.0% 100.0% 100.0% 100.0% 100.0%
Colombian Less than 20,000 28.2% 8.0% 24.9% 8.0% 25.0% 8.6%
20,000-39,999 28.0% 23.0% 23.9% 20.5% 27.4% 22.4%
40,000-74,999 28.6% 37.6% 29.2% 35.1% 25.2% 28.8%
75,000-99,999 9.7% 13.8% 9.3% 14.4% 6.6% 12.9%
100,000+ 5.5% 17.6% 12.6% 22.1% 15.8% 27.3%
Total 100.0% 100.0% 100.0% 100.0% 100.0% 100.0%
Ecuadorian Less than 20,000 36.6% 10.2% 29.8% 10.2% 27.0% 8.8%
20,000-39,999 24.5% 21.1% 24.4% 19.9% 19.7% 18.0%
40,000-74,999 26.0% 34.1% 25.7% 32.6% 30.2% 26.7%
75,000-99,999 9.5% 15.1% 10.4% 17.3% 9.6% 12.4%
100,000+ 3.3% 19.4% 9.7% 20.0% 13.5% 34.1%
Total 100.0% 100.0% 100.0% 100.0% 100.0% 100.0%
Dominican Less than 20,000 47.0% 14.3% 39.2% 13.5% 37.3% 13.4%
20,000-39,999 24.9% 24.4% 25.6% 23.2% 25.7% 21.1%
40,000-74,999 19.6% 34.6% 23.6% 34.8% 23.5% 36.9%
75,000-99,999 4.7% 12.6% 5.8% 12.4% 7.3% 9.8%
100,000+ 3.8% 14.0% 5.8% 16.1% 6.2% 18.7%
Total 100.0% 100.0% 100.0% 100.0% 100.0% 100.0%
Table 13
Distribution of Household Income among Latina Population by Household Head and Nationality for Five Largest Latino
Nationalities in New York City, 1990 – 2010 (in percentages of population 25 years of age and older)
1990 2000 2010
Nationality Income

Latinas in New York City, Education and Income 41
Latino Data Project Report 53 September 2013
Household Income among Female-Headed Households by Nativity in New York City
Among households headed by Latinas, foreign-born women had lower median household
income compared to domestic-born women from 1990 to 2010. While both groups’ median incomes
increased across the years, the City’s domestic-born women increased at a greater rate. Domestic-
born women’s greater improvement in higher education attainment compared to foreign-born women
likely contributed to this increasing disparity. (See figure 40).
From 1990 to 2010, households in New York City that were headed by foreign-born Latinas
earned less than domestic-born Latinas across all levels of income. Domestic-born women were less
likely to earn less than $20,000 in household income compared to foreign-born women. This
difference between foreign- and domestic-born women was relatively stable from 1990 to 2010. (See
figure 41). A greater share of households headed by both foreign- and domestic-born women earned
above $100,000 annually in 2010 than in 1990. Households with domestic-born Latinas as the head
were more likely than foreign-born Latinas to earn above $100,000. The disparity between the two
groups in proportion earning above $100,000 increased from 1990 to 2010. (See figure 42 and table
14). This pattern is likely related to the increasing and higher attainment of higher education among
domestic-born Latinas.
Note: For Puerto Ricans 'foreign-born' means born on the island.
$27,000
$25,000
$21,886
$40,000
$34,306
$27,225
$0 $5,000 $10,000 $15,000 $20,000 $25,000 $30,000 $35,000 $40,000 $45,000
2010
2000
1990
Figure 40Median Household Income among Latinas who were Household Heads by Nativity, 1990 –
2010 (in inflation adjusted 2010 dollars)
Domestic-born Foreign-born

Latinas in New York City, Education and Income 42
Latino Data Project Report 53 September 2013
Note: For Puerto Ricans 'foreign-born' means born on the island.
Note: For Puerto Ricans 'foreign-born' means born on the island.
48.2%
43.1%
38.5%41.4%
33.4%30.4%
0%
20%
40%
60%
1990 2000 2010
Figure 41Latina-Headed Households with Household Income Less than $20,000 by Nativity,
1990 – 2010 (in percentages of population 25 years of age and higher)
Foreign-Born Domestic-Born
4.3%
6.5%
8.0%
5.3%
8.5%
15.4%
0%
5%
10%
15%
20%
1990 2000 2010
Figure 42Latina-Headed Households with Household Income more than $100,000 by Nativity,
1990 – 2010 (in percentages of population 25 years of age and higher)
Foreign-Born Domestic-Born

Latinas in New York City, Education and Income 43
Latino Data Project Report 53 September 2013
Household Income among Latino/a-Headed Households by Sex and Nativity in New York City
Among Latino/a households, households headed by foreign-born women had substantially lower
median household income compared to households headed by foreign-born men, domestic-born
men, and domestic-born women from 1990 to 2010. Domestic-born and foreign-born men in the City
had the highest and second highest median incomes of all groups, and this was stable across the
census years. Households headed by domestic-born women had the greatest increase in median
income from 1990 to 2010 ($17,000 increase). This is likely due to increasing higher education
attainment among domestic-born women. The gap income between households headed by domestic-
born Hispanic men and women is decreasing. However, the difference in household income between
domestic-born Latinas and foreign-born Latinas is increasing. (See figure 43). This pattern is
consistent with patterns in personal income between domestic- and foreign-born men and women.
From 1990 to 2010, Latino households in New York City headed by domestic- and foreign-born
women were more likely to earn less than $20,000 annually compared to domestic- and foreign-born
men. Foreign-born women were the most likely to earn less than $20,000. Domestic- and foreign-born
men had similar proportions of the population earning less than $20,000 from 1990 to 2010. (See
figure 44 and table 14).
Male Female Male Female Male Female
Foreign-Born Less than 20,000 18.6% 48.2% 20.5% 43.1% 21.6% 38.5%
20,000-39,999 23.4% 22.3% 23.7% 23.2% 27.3% 24.8%
40,000-74,999 33.0% 20.1% 31.1% 20.9% 29.4% 22.2%
75,000-99,999 12.9% 5.0% 11.1% 6.3% 8.9% 6.5%
100,000+ 12.0% 4.3% 13.6% 6.5% 12.7% 8.0%
Total 100.0% 100.0% 100.0% 100.0% 100.0% 100.0%
Domestic-Born Less than 20,000 14.2% 41.4% 14.4% 33.4% 19.9% 30.4%
20,000-39,999 19.3% 22.8% 18.4% 23.4% 14.7% 20.5%
40,000-74,999 34.7% 23.8% 31.5% 26.3% 30.2% 23.8%
75,000-99,999 15.2% 6.7% 15.8% 8.4% 14.2% 10.0%
100,000+ 16.6% 5.3% 19.9% 8.5% 21.0% 15.4%
Total 100.0% 100.0% 100.0% 100.0% 100.0% 100.0%
Note: For Puerto Ricans 'foreign-born' means born on the island.
Nativity Income
1990 2000 2010
Table 14
Distribution of Household Income among Latino/a Population by Household Head, Nativity, and
Sex, 1990 – 2010 (in percentages of population 25 years of age and older)

Latinas in New York City, Education and Income 44
Latino Data Project Report 53 September 2013
In both 1990 to 2000, households headed by the City’s foreign-born women were the least likely to
earn more than $100,000, followed by domestic-born women, foreign-born men, and domestic-born
men. However, in 2010, households headed by domestic-born women (15.4%) were more likely than
foreign-born men (12.7%) to earn more than $100,000. Households headed by domestic-born men
were consistently the most likely to earn above $100,000 from 1990 to 2010. Households headed by
domestic-born women had the largest increase in proportion earning more than $100,000 annually.
These findings suggest an increasing household income disparity in New York City between
domestic- and foreign-born women. This pattern is likely due to the increased higher education
attainment among domestic-born Latinas. Nativity in combination with sex appears to be an
increasingly important determinant of household income. (See figure 45 and table 14).
$41,750
$27,000
$57,000
$40,000
$45,625
$25,000
$57,000
$34,306
$47,850
$21,886
$57,668
$27,225
$0 $10,000 $20,000 $30,000 $40,000 $50,000 $60,000 $70,000
Male
Female
Male
Female
Fo
reig
n-b
orn
Do
me
stic-b
orn
Figure 43Median Household Income among Latino/as who were Household Heads by Sex and
Nativity, 1990 – 2010 (in inflation adjusted 2010 dollars)
1990 2000 2010

Latinas in New York City, Education and Income 45
Latino Data Project Report 53 September 2013
18.6%
48.2%
14.2%
41.4%
20.5%
43.1%
14.4%
33.4%
21.6%
38.5%
19.9%
30.4%
0%
20%
40%
60%
Male Female Male Female
Foreign-Born Domestic-Born
Figure 44Latino/a-Headed Households with Household Income Less than $20,000 by Sex
and Nativity, 1990 – 2010 (in percentages of population 25 years of age and higher)
1990 2000 2010
12.0%
4.3%
16.6%
5.3%
13.6%
6.5%
19.9%
8.5%
12.7%
8.0%
21.0%
15.4%
0%
5%
10%
15%
20%
25%
Male Female Male Female
Foreign-Born Domestic-Born
Figure 45Latino/a-Headed Households with Household Incomes More than $100,000 by
Sex and Nativity, 1990 – 2010 (in percentages of population 25 years of age and higher)
1990 2000 2010

Latinas in New York City, Education and Income 46
Latino Data Project Report 53 September 2013
The Relation between Personal Income and Education
Personal Income and Education among Latinas in New York City
Level of educational attainment was an important factor in Latinas’ level of annual personal
income from 1990 to 2010. As Latinas’ level of educational attainment increased, so did their level of
income. Among Latinas in the City who did not graduate high school, median income levels increased
from 1990 to 2010. However, the median level of income was relatively low. (See figure 46). Earning a
high school degree raised Latinas’ median income by about $6,000 in 1990 and $8,000 in 2010,
compared to not earning a high school degree. (See figure 47). At all levels of education, median
income increased from 1990 to 2010, with the exception of Ph.D. degrees, which had relatively stable
median income. By 2010, Latinas with professional degrees had the highest level of median income.
(See table 15).
$14,000
$9,125
$9,662
$22,000
$16,250
$19,800
$0 $10,000 $20,000 $30,000
2010
2000
1990
Figure 46Median Personal Income among Latina Population by High School Graduation, 1990 – 2010
(in population 25 years of age and older and inflation adjusted 2010 dollars)
High School Graduate Did not Graduate High School

Latinas in New York City, Education and Income 47
Latino Data Project Report 53 September 2013
Personal Income and Education by Sex among Latino/as in New York City
From 1990 to 2010, and across all levels of education, Latinas had lower median income than
Latinos at equivalent levels of education in New York City. With exception, men and women with M.A.
degrees had relatively similar median personal income Women who graduated high school had
considerably lower personal median income from 1990 to 2010 compared to men who graduated high
school. Women who did not graduate high school had slightly lower levels of median income than
equivalently educated men. (See figure 48). Among those who attained B.A. degrees, men had
consistently higher median income than women, and the disparity between the two groups increased
across census years. (See figure 49). From 1990 to 2010, among men and women with Ph.D. and
professional degrees, the disparity in median income decreased. These patterns illustrate that despite
attainting equivalent levels of education as men, women earn less personal income. (See table 15).
Male Female Male Female Male Female
Did not Graduate High School 19,996 9,662 18,125 9,125 21,000 14,000
High School Graduate 33,000 19,800 28,750 16,250 30,000 22,000
Associates Degree 34,930 28,050 37,500 28,019 40,000 32,000
B.A. Degree 42,900 37,950 45,000 38,125 47,350 40,000
M.A. Degree 52,800 51,150 51,938 47,500 60,000 60,000
Professional Degree 51,150 41,412 48,750 37,500 71,000 65,000
Ph.D. 63,113 47,850 50,000 51,500 62,000 51,000
Table 15
Median Personal Income among Latino/a Population by Educational Attainment,
1990 – 2010 (in population 25 years of age and older and inflation adjusted 2010 dollars)
1990 2000 2010
$32,000
$40,000
$60,000
$65,000
$51,000
$28,019
$38,125
$47,500
$37,500
$51,500
$28,050
$37,950
$51,150
$41,412
$47,850
$0 $20,000 $40,000 $60,000 $80,000
Associates Degree
B.A. Degree
M.A. Degree
Professional Degree
Ph.D.
Figure 47Median Personal Income among Latina Population which Attained Degrees Beyond
High School, 1990 – 2010 (in inflation adjusted 2010 dollars)
1990 2000 2010

Latinas in New York City, Education and Income 48
Latino Data Project Report 53 September 2013
$21,000
$18,125
$19,996
$14,000
$9,125
$9,662
$0 $5,000 $10,000 $15,000 $20,000 $25,000
2010
2000
1990
Figure 48Median Personal Income among Latino/a Population which did not Graduate High School, 1990 – 2010 (in population 25 years of age and older and inflation adjusted 2010 dollars)
Female Male
$47,350
$45,000
$42,900
$40,000
$38,125
$37,950
$0 $10,000 $20,000 $30,000 $40,000 $50,000 $60,000
2010
2000
1990
Figure 49Median Personal Income among Latino/a Population which Attained a B.A. Degree, 1990 –
2010 (in population 25 years of age and older and inflation adjusted 2010 dollars)
Female Male

Latinas in New York City, Education and Income 49
Latino Data Project Report 53 September 2013
Personal Income and Education among Female Population by Race/Ethnicity in New York City
In New York City, Latinas had consistently lower personal income compared to women of other
racial/ethnic groups at equivalent levels of education. From 1990 to 2010, of all females who did not
graduate high school, Latinas had the lowest annual income. (See figure 50). This pattern occurred
across levels of education. From 1990 to 2010, of all females who attained B.A. degrees, Latinas had
the lowest annual income. (See figure 51 and table 16). Latinas continue to earn less personal
income than women of other racial/ethnic groups at equivalent levels of education. The most dramatic
difference across levels of education and years is between Latinas and Non-Hispanic White women.
By 2010, Non-Hispanic White women with professional degrees had the highest median income of all
women ($82,500), while Latinas with professional degrees made nearly $20,000 less than Non-
Hispanic White women in that year. These patterns demonstrate that, despite being equivalently
educated as women of other racial/ethnic group, Latinas in the City continue to have lower income
levels compared to these groups of women.
$14,050
$14,000
$20,000
$17,350
$10,000
$9,125
$11,250
$12,000
$11,550
$9,662
$10,806
$11,623
$0 $5,000 $10,000 $15,000 $20,000 $25,000
Asian
Latina
Non-Hispanic Black
Non-Hispanic White
Figure 50Median Personal Income among Female Population which did not
Graduate High School, 1990 – 2010 (in population 25 years of age and older and inflation adjusted 2010 dollars)
1990 2000 2010
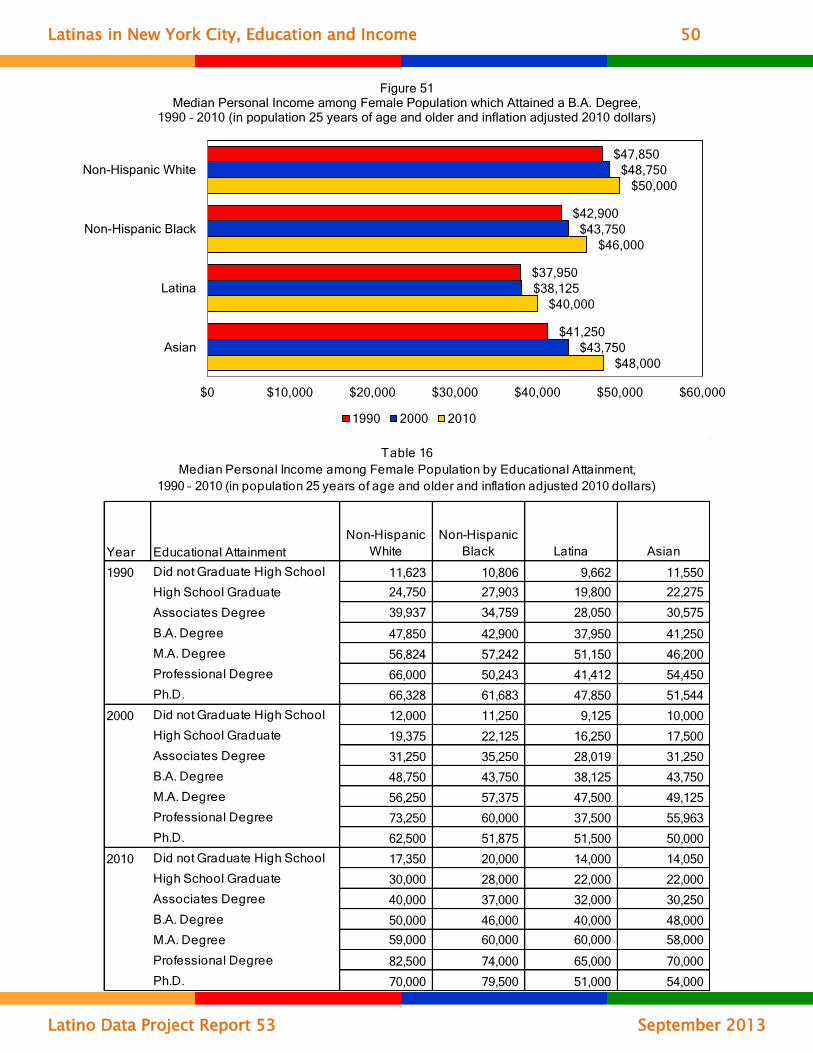
Latinas in New York City, Education and Income 50
Latino Data Project Report 53 September 2013
‘
$48,000
$40,000
$46,000
$50,000
$43,750
$38,125
$43,750
$48,750
$41,250
$37,950
$42,900
$47,850
$0 $10,000 $20,000 $30,000 $40,000 $50,000 $60,000
Asian
Latina
Non-Hispanic Black
Non-Hispanic White
Figure 51Median Personal Income among Female Population which Attained a B.A. Degree,
1990 – 2010 (in population 25 years of age and older and inflation adjusted 2010 dollars)
1990 2000 2010
Year Educational Attainment
Non-Hispanic
White
Non-Hispanic
Black Latina Asian
1990 Did not Graduate High School 11,623 10,806 9,662 11,550
High School Graduate 24,750 27,903 19,800 22,275
Associates Degree 39,937 34,759 28,050 30,575
B.A. Degree 47,850 42,900 37,950 41,250
M.A. Degree 56,824 57,242 51,150 46,200
Professional Degree 66,000 50,243 41,412 54,450
Ph.D. 66,328 61,683 47,850 51,544
2000 Did not Graduate High School 12,000 11,250 9,125 10,000
High School Graduate 19,375 22,125 16,250 17,500
Associates Degree 31,250 35,250 28,019 31,250
B.A. Degree 48,750 43,750 38,125 43,750
M.A. Degree 56,250 57,375 47,500 49,125
Professional Degree 73,250 60,000 37,500 55,963
Ph.D. 62,500 51,875 51,500 50,000
2010 Did not Graduate High School 17,350 20,000 14,000 14,050
High School Graduate 30,000 28,000 22,000 22,000
Associates Degree 40,000 37,000 32,000 30,250
B.A. Degree 50,000 46,000 40,000 48,000
M.A. Degree 59,000 60,000 60,000 58,000
Professional Degree 82,500 74,000 65,000 70,000
Ph.D. 70,000 79,500 51,000 54,000
Table 16
Median Personal Income among Female Population by Educational Attainment,
1990 – 2010 (in population 25 years of age and older and inflation adjusted 2010 dollars)

Latinas in New York City, Education and Income 51
Latino Data Project Report 53 September 2013
Personal Income and Education by Nationality among Latinas in New York City
Among Latinas of the five largest Latino nationalities in New York City, there was variability in the
relation between personal income and education. From 1990 to 2010, the median income among
Mexican women who did not graduate high school was relatively stable, whereas the median income
among Puerto Rican, Colombian, Ecuadorian, and Dominican women who did not graduate high
school increased across the census years. The most notable increase was among the City’s Puerto
Rican women who did not graduate high school, whose median income jumped from $8,950 in 1990
to $16,800 in 2010. Puerto Rican women had the greatest median income of all Latinas who did not
graduate high school in 2010. (See figure 52).
Patterns are slightly different among Latinas with higher education. The median annual income
among New York City’s Mexican women who attain B.A. degrees increased substantially from 1990 to
2010. Puerto Rican, Ecuadorian, and Dominican women in the City who attained B.A. degrees had a
modest increase in annual income from 1990 to 2010. Median income among Colombian women who
attained B.A. degrees was relatively stable. By 2010, Mexican women had the greatest median
income of all Latinas with B.A. degrees, followed by Puerto Rican, Dominican, Ecuadorian, and
Colombian. (See figure 53).
By 2010, Mexican women who have attained Ph.D. Degrees have the highest median personal
income of all Latinas ($83,000), followed by Puerto Rican women with Ph.D. ($76,000) and
professional degrees ($73,000). These patterns suggest higher educated Mexican and Puerto Rican
women are increasingly earning greater annual income than Colombian, Ecuadorian, and Dominican
women with the same levels of education. (See table 17).
$13,500
$13,750
$15,000
$16,800
$12,200
$9,500
$10,938
$11,875
$8,875
$11,375
$10,735
$13,200
$13,200
$8,950
$12,705
$0 $5,000 $10,000 $15,000 $20,000
Dominican
Ecuadorian
Colombian
Puerto Rican
Mexican
Figure 52Median Personal Income among Latinas of the Five Largest Latino Nationalities in New York
City which did not Graduate High School, 1990 – 2010 (in population 25 years of age and older and inflation adjusted 2010 dollars)
1990 2000 2010

Latinas in New York City, Education and Income 52
Latino Data Project Report 53 September 2013
$38,000
$37,500
$35,000
$43,000
$48,000
$33,000
$37,500
$34,625
$40,000
$42,375
$33,000
$33,018
$35,261
$39,600
$35,992
$0 $20,000 $40,000 $60,000
Dominican
Ecuadorian
Colombian
Puerto Rican
Mexican
Figure 53Median Personal Income among Latinas of the Five Largest Latino Nationalities in New York City which attained a B.A. Degree, 1990 – 2010 (in population 25 years of age and older and
inflation adjusted 2010 dollars)
1990 2000 2010
Year Educational Attainment Mexican Puerto Rican Colombian Ecuadorian Dominican
1990 Did not Graduate High School 12,705 8,950 13,200 13,200 10,735
High School Graduate 24,750 21,450 19,800 19,800 14,661
Associates Degree 24,750 31,086 26,070 24,833 28,048
B.A. Degree 35,992 39,600 35,261 33,018 33,000
M.A. Degree 31,093 55,523 47,603 23,100 48,022
Professional Degree 54,021 46,200 43,313 37,521 13,223
Ph.D. 82,500 47,982 21,120 2,261 42,587
2000 Did not Graduate High School 11,375 8,875 11,875 10,938 9,500
High School Graduate 13,750 16,625 16,188 16,000 14,750
Associates Degree 40,000 30,000 28,188 30,500 22,125
B.A. Degree 42,375 40,000 34,625 37,500 33,000
M.A. Degree 47,625 50,000 44,875 37,250 41,250
Professional Degree 30,375 50,000 25,000 25,000 19,375
Ph.D. 61,750 63,781 49,875 13,875 30,000
2010 Did not Graduate High School 12,200 16,800 15,000 13,750 13,500
High School Graduate 18,000 30,000 18,000 19,450 18,000
Associates Degree 28,050 40,500 30,000 28,500 30,100
B.A. Degree 48,000 43,000 35,000 37,500 38,000
M.A. Degree 45,500 64,500 54,500 57,000 57,500
Professional Degree 43,000 73,000 48,000 39,200 45,000
Ph.D. 83,000 76,000 41,500 N/A 18,000
Note: The “n/a” entry indicates no data is available.
Table 17
Median Personal Income among Latinas of the Five Largest Latino Nationalities in New York City by Educational
Attainment, 1990 – 2010 (in population 25 years of age and older and inflation adjusted 2010 dollars)

Latinas in New York City, Education and Income 53
Latino Data Project Report 53 September 2013
Personal Income and Education by Nativity among Latinas in New York City
Foreign-born Latinas had generally lower levels of median income than domestic-born Latinas at
equivalent levels of education from 1990 to 2010. With exception, in 1990 and 2000, foreign-born
women who did not graduate high school earned more than domestic-born women who did not
graduate high school. (See figure 54). By 2010, across all levels of education, domestic-born women
had higher income than foreign-born women at equivalent levels of education. The disparity between
equivalently educated foreign- and domestic-born women’s annual income increased, across most
levels of education. While in 1990, domestic-born women who attained B.A. degrees earned about
$2,000 more than did foreign-born women, in 2010, domestic-born women who attained B.A. degrees
earned about $10,000 more than did foreign-born women. This pattern is consistent at even higher
levels of education (See figure 55 and table 18).
$14,000
$10,125
$11,550
$15,350
$9,000
$8,976
$0 $5,000 $10,000 $15,000 $20,000
2010
2000
1990
Figure 54Median Personal Income among Latina Population which did not Graduate High School by
Nativity, 1990 – 2010 (in population 25 years of age and older and inflation adjusted 2010 dollars)
Domestic-Born Foreign-Born
$35,000
$33,125
$36,937
$45,250
$41,250
$39,290
$0 $20,000 $40,000 $60,000
2010
2000
1990
Figure 55Median Personal Income among Latina Population which Attained a B.A. Degree by
Nativity, 1990 – 2010 (in population 25 years of age and older and inflation adjusted 2010 dollars)
Domestic-Born Foreign-Born

Latinas in New York City, Education and Income 54
Latino Data Project Report 53 September 2013
Personal Income and Education by Sex and Nativity among Latino/as in New York City
Among both foreign- and domestic-born Latino/as in New York City, women had consistently
lower personal income compared to men at equivalent levels of education, at nearly every level of
education. The gap in median income between women and men, among both foreign- and domestic-
born, is smaller at higher levels of education. However, the magnitude of the difference between
women and men has decreased from 1990 to 2010. (See table 18).
Among the Latino/a population which did not graduate high school, both foreign- and domestic-
born women had lower median income, relative to men, across all census years. (See figure 56). Both
foreign- and domestic-born women who obtained B.A. degrees had lower income from 1990 to 2010,
compared to men. There is one exception in 2010, where the City’s domestic-born women who
obtained B.A. degrees earned greater median income than equivalently educated foreign-born men.
Foreign-born women with B.A. degrees had the lowest median income compared to other foreign- and
domestic-born men with B.A. across all census years. (See figure 57). Despite the fact that by 2010
domestic-born women surpassed educational attainment compared to all other foreign- and domestic-
Male Female Male Female
1990 Did not Graduate High School 21,957 11,550 18,315 8,976
High School Graduate 30,030 18,150 35,640 21,575
Associates Degree 33,318 25,042 37,950 31,110
B.A. Degree 41,250 36,937 46,365 39,290
M.A. Degree 49,500 49,327 57,750 54,450
Professional Degree 49,500 33,000 62,205 47,850
Ph.D. 64,249 39,015 60,390 61,388
2000 Did not Graduate High School 18,750 10,125 15,000 9,000
High School Graduate 26,250 15,275 31,250 17,000
Associates Degree 35,000 25,000 40,000 30,000
B.A. Degree 42,125 33,125 47,769 41,250
M.A. Degree 50,000 45,388 53,750 50,000
Professional Degree 40,000 25,375 62,500 50,875
Ph.D. 44,813 31,250 71,250 65,063
2010 Did not Graduate High School 20,800 14,000 24,500 15,350
High School Graduate 26,000 19,000 35,000 29,050
Associates Degree 30,350 30,100 47,000 33,150
B.A. Degree 41,000 35,000 50,000 45,250
M.A. Degree 52,000 52,500 63,000 63,000
Professional Degree 60,000 46,000 95,000 72,500
Ph.D. 45,000 41,500 71,000 76,000
Table 18
Median Personal Income among Latino/a Population by Sex, Nativity and Educational
Attainment, 1990 – 2010
(in population 25 years of age and older and inflation adjusted 2010 dollars)
Year Educational Attainment
Foreign-Born Domestic-Born
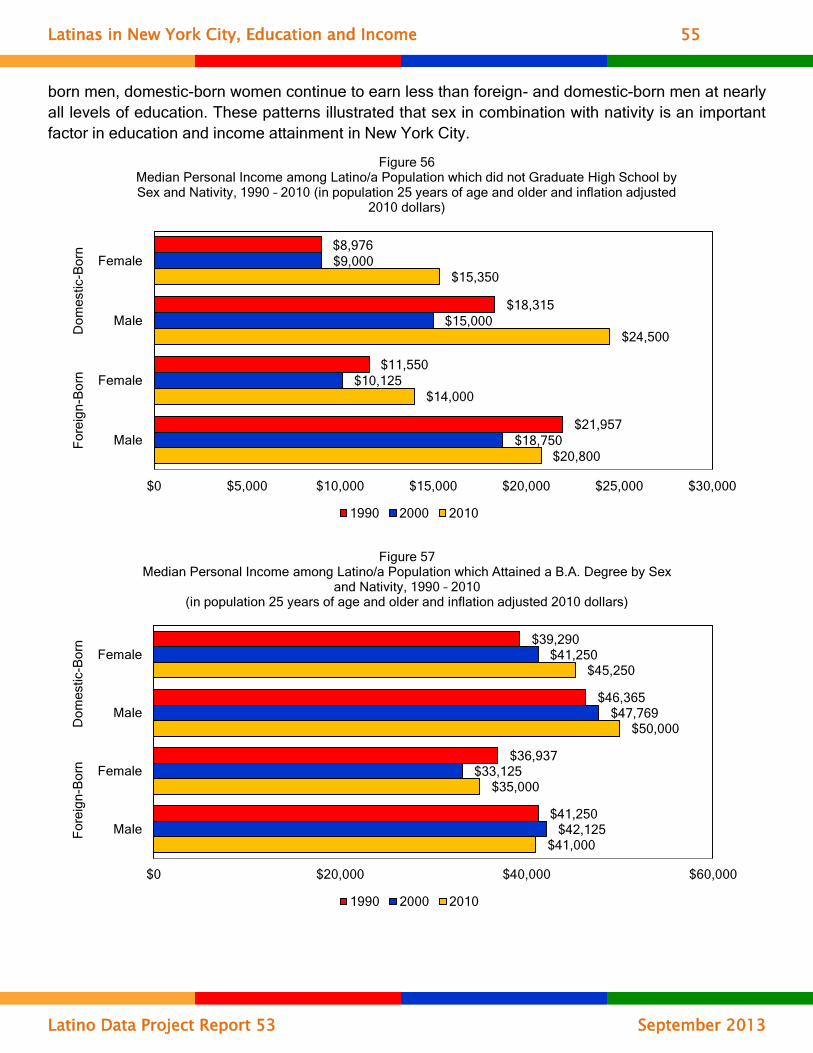
Latinas in New York City, Education and Income 55
Latino Data Project Report 53 September 2013
born men, domestic-born women continue to earn less than foreign- and domestic-born men at nearly
all levels of education. These patterns illustrated that sex in combination with nativity is an important
factor in education and income attainment in New York City.
$20,800
$14,000
$24,500
$15,350
$18,750
$10,125
$15,000
$9,000
$21,957
$11,550
$18,315
$8,976
$0 $5,000 $10,000 $15,000 $20,000 $25,000 $30,000
Male
Female
Male
Female
Fo
reig
n-B
orn
Do
me
stic-B
orn
Figure 56Median Personal Income among Latino/a Population which did not Graduate High School by Sex and Nativity, 1990 – 2010 (in population 25 years of age and older and inflation adjusted
2010 dollars)
1990 2000 2010
$41,000
$35,000
$50,000
$45,250
$42,125
$33,125
$47,769
$41,250
$41,250
$36,937
$46,365
$39,290
$0 $20,000 $40,000 $60,000
Male
Female
Male
Female
Fo
reig
n-B
orn
Do
me
stic-B
orn
Figure 57Median Personal Income among Latino/a Population which Attained a B.A. Degree by Sex
and Nativity, 1990 – 2010 (in population 25 years of age and older and inflation adjusted 2010 dollars)
1990 2000 2010

Latinas in New York City, Education and Income 56
Latino Data Project Report 53 September 2013
The Relation between Household Income and Education
Household Income and Education among Latina-Headed Households in New York City
In New York City, among Latino/a households that had female heads, educational attainment
was an important factor in median annual household income from 1990 to 2010. Greater educational
attainment of the household head related to greater income levels. At all levels of education, median
household income among Latina-headed households increased from 1990 to 2010. With exception,
Latina household heads who only graduated high school had relatively stable incomes. Households
headed by Latinas who did not graduate high school had the lowest incomes, with only a small
increase in median income from 1990 to 2010. Those who graduated high school had substantially
higher incomes than those who did not (See figures 58 and 59). The greatest increase in median
income from 1990 to 2010 was among household headed by Latinas who attained Ph.D. degrees,
followed by those with professional degrees, B.A. degrees, M.A.degrees, and then associates
degrees. (See figure 60). This suggests an increasing disparity in New York City in median income
among household with Latina househeads: those with higher levels of education are increasingly
obtaining higher levels of income, whereas income among households headed by Latinas with lower
levels of education saw little change in income levels across the census years. (See table 19).
$18,000
$17,375
$15,840
$0 $10,000 $20,000 $30,000
2010
2000
1990
Figure 58Median Household Income among Latina Household Heads who did not Graduate High
School, 1990 – 2010 (in inflation adjusted 2010 dollars)
$31,000
$29,250
$30,002
$0 $10,000 $20,000 $30,000 $40,000
2010
2000
1990
Figure 59Median Household Income among Latina Household Heads which Graduated High School,
1990 – 2010 (in inflation adjusted 2010 dollars)

Latinas in New York City, Education and Income 57
Latino Data Project Report 53 September 2013
$42,050
$60,000
$76,400
$81,000
$91,850
$40,500
$56,250
$65,000
$54,813
$75,188
$38,510
$52,155
$70,950
$62,129
$54,685
$0 $20,000 $40,000 $60,000 $80,000 $100,000
Associates Degree
B.A. Degree
M.A. Degree
Professional Degree
Ph.D.
Figure 60Median Household Income among Latina Population which Attained Degrees Beyond High
School, 1990 – 2010 (in inflation adjusted 2010 dollars)
1990 2000 2010
Male Female Male Female Male Female
Did not Graduate High School 39,600 15,840 35,781 17,375 31,680 18,000
High School Graduate 56,100 30,002 50,000 29,250 45,250 31,000
Associates Degree 58,059 38,510 61,500 40,500 51,000 42,050
B.A. Degree 71,775 52,155 67,625 56,250 66,150 60,000
M.A. Degree 80,570 70,950 81,250 65,000 85,000 76,400
Professional Degree 89,100 62,129 75,000 54,813 93,750 81,000
Ph.D. 74,638 54,685 94,075 75,188 68,000 91,850
Table 19
Median Household Income among Latino/a household heads by Sex and Educational Attainment,
1990 – 2010 (in population 25 years of age and older and inflation adjusted 2010 dollars)
1990 2000 2010

Latinas in New York City, Education and Income 58
Latino Data Project Report 53 September 2013
Household Income and Education among Latino/a Headed Households by Sex in New York City
At equivalent levels of education, households in New York City that were headed by Latinas had
generally lower median household incomes compared to households headed by Latinos, from 1990 to
2010. In 1990, households headed by women who did not graduate high school had substantially
lower median income compared to men who did not graduate high school. (See figure 61). The
difference between the two groups decreased from 1990 to 2010. Households headed by women who
attained B.A. degrees had substantially lower median income than men who attained B.A. degrees,
although this difference decreased from 1990 compared to 2010. (See figure 62). As of 2010, when
considering the City’s Latina and Latino household heads at equivalent educational attainment,
household headed by women earned lower income than men at all levels of education. There is one
exception, in 2010, where households headed by women who attained Ph.D. had greater median
income than men with a Ph.D. This is the only instance where households headed by women earned
more than those headed by men at equivalent levels of education at any time from 1990 to 2010.
These patterns suggest that, at equivalent levels of education, the disparity in household income
between households headed by Latinas and Latinos may be less drastic at higher levels of education.
These patterns are consistent with differences in personal median income found between Latinas and
Latinos who are equivalently educated. (See table 19).
$31,680
$35,781
$39,600
$18,000
$17,375
$15,840
$0 $10,000 $20,000 $30,000 $40,000 $50,000
2010
2000
1990
Figure 61Median Household Income among Latino/a Household Heads which did not Graduate High
School by Sex, 1990 – 2010 (in inflation adjusted 2010 dollars)
Female Male

Latinas in New York City, Education and Income 59
Latino Data Project Report 53 September 2013
Household Income and Education among Female-Headed Households by Race/Ethnicity in New York
City
From 1990 to 2010, households with Latina heads in New York City had lower median household
incomes compared to households headed by women of the other major race/ethnic groups, at
equivalent levels of education. Households with Latina heads who did not graduate high school had
relatively similar median income to Non-Hispanic Black women who did not graduate high school from
1990 to 2010. However, these Latinas had relatively lower income compared to Non-Hispanic White
and Asian women who did not graduate high school across census years. (See figure 63).
This pattern was apparent at higher levels of education as well. Households headed by Latinas
who attained B.A. degrees had relatively similar median incomes compared to Non-Hispanic Black
women who attained B.A. degrees. However, the City’s Latinas had substantially lower levels of
income compared to households headed by Non-Hispanic White and Asian women who attained B.A
degrees. (See figure 64). By 2010, households headed by Non-Hispanic White women who attained
B.A. degrees earned median income that was $18,000 greater than Latinas who attained B.A.
degrees. In 2010, Non-Hispanic White women who were household heads with professional degrees
earned the greatest household income of all women ($132,000), a level of education at which Latinas
earned only $81,000 in 2010. (See table 20). This suggests Latinas have lesser financial opportunity
relative to Non-Hispanic White and Asian women, despite increasing educational opportunity and
attainment.
$66,150
$67,625
$71,775
$60,000
$56,250
$52,155
$0 $20,000 $40,000 $60,000 $80,000
2010
2000
1990
Figure 62Median Household Income among Latino/a Household Heads which Attained a B.A. Degree
by Sex, 1990 – 2010 (in inflation adjusted 2010 dollars)
Female Male
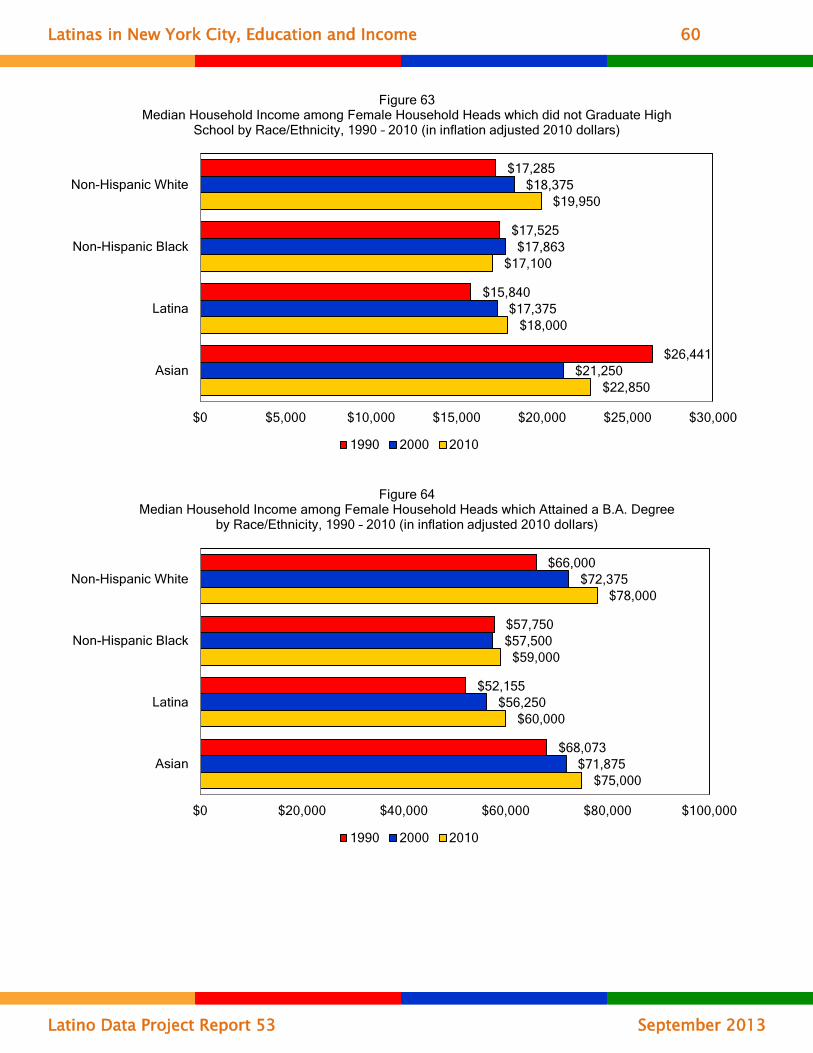
Latinas in New York City, Education and Income 60
Latino Data Project Report 53 September 2013
$22,850
$18,000
$17,100
$19,950
$21,250
$17,375
$17,863
$18,375
$26,441
$15,840
$17,525
$17,285
$0 $5,000 $10,000 $15,000 $20,000 $25,000 $30,000
Asian
Latina
Non-Hispanic Black
Non-Hispanic White
Figure 63Median Household Income among Female Household Heads which did not Graduate High
School by Race/Ethnicity, 1990 – 2010 (in inflation adjusted 2010 dollars)
1990 2000 2010
$75,000
$60,000
$59,000
$78,000
$71,875
$56,250
$57,500
$72,375
$68,073
$52,155
$57,750
$66,000
$0 $20,000 $40,000 $60,000 $80,000 $100,000
Asian
Latina
Non-Hispanic Black
Non-Hispanic White
Figure 64Median Household Income among Female Household Heads which Attained a B.A. Degree
by Race/Ethnicity, 1990 – 2010 (in inflation adjusted 2010 dollars)
1990 2000 2010
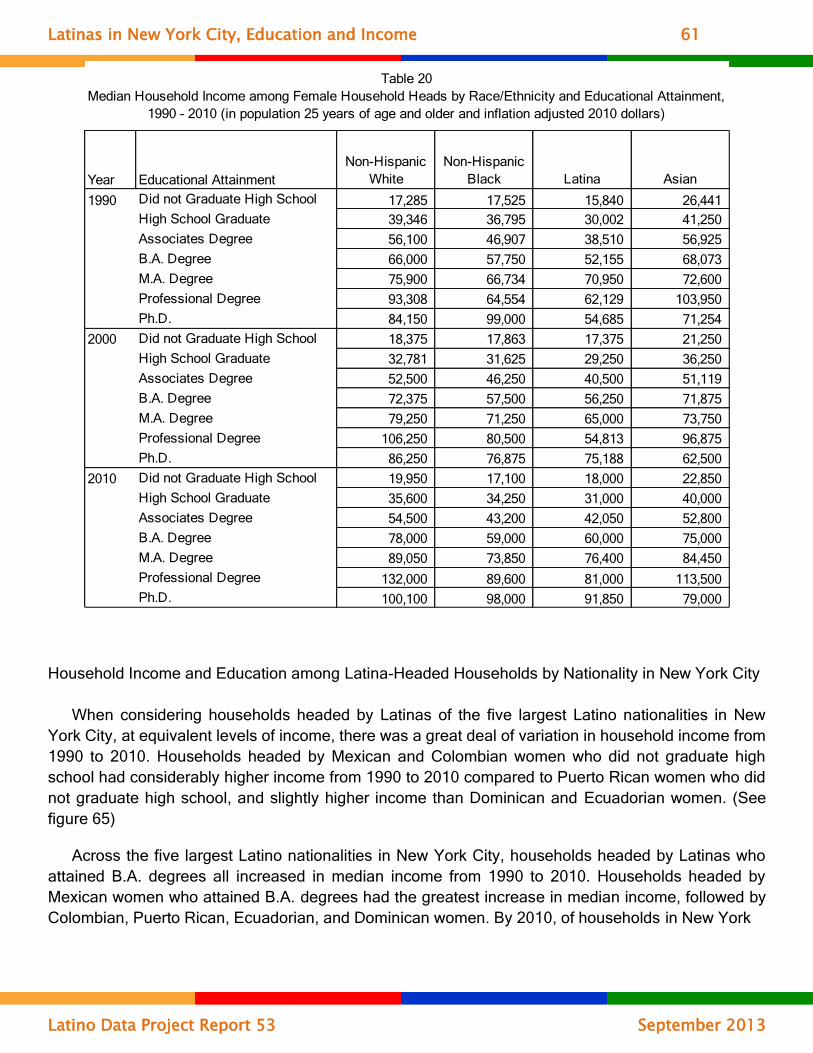
Latinas in New York City, Education and Income 61
Latino Data Project Report 53 September 2013
Household Income and Education among Latina-Headed Households by Nationality in New York City
When considering households headed by Latinas of the five largest Latino nationalities in New
York City, at equivalent levels of income, there was a great deal of variation in household income from
1990 to 2010. Households headed by Mexican and Colombian women who did not graduate high
school had considerably higher income from 1990 to 2010 compared to Puerto Rican women who did
not graduate high school, and slightly higher income than Dominican and Ecuadorian women. (See
figure 65)
Across the five largest Latino nationalities in New York City, households headed by Latinas who
attained B.A. degrees all increased in median income from 1990 to 2010. Households headed by
Mexican women who attained B.A. degrees had the greatest increase in median income, followed by
Colombian, Puerto Rican, Ecuadorian, and Dominican women. By 2010, of households in New York
Year Educational Attainment
Non-Hispanic
White
Non-Hispanic
Black Latina Asian
1990 Did not Graduate High School 17,285 17,525 15,840 26,441
High School Graduate 39,346 36,795 30,002 41,250
Associates Degree 56,100 46,907 38,510 56,925
B.A. Degree 66,000 57,750 52,155 68,073
M.A. Degree 75,900 66,734 70,950 72,600
Professional Degree 93,308 64,554 62,129 103,950
Ph.D. 84,150 99,000 54,685 71,254
2000 Did not Graduate High School 18,375 17,863 17,375 21,250
High School Graduate 32,781 31,625 29,250 36,250
Associates Degree 52,500 46,250 40,500 51,119
B.A. Degree 72,375 57,500 56,250 71,875
M.A. Degree 79,250 71,250 65,000 73,750
Professional Degree 106,250 80,500 54,813 96,875
Ph.D. 86,250 76,875 75,188 62,500
2010 Did not Graduate High School 19,950 17,100 18,000 22,850
High School Graduate 35,600 34,250 31,000 40,000
Associates Degree 54,500 43,200 42,050 52,800
B.A. Degree 78,000 59,000 60,000 75,000
M.A. Degree 89,050 73,850 76,400 84,450
Professional Degree 132,000 89,600 81,000 113,500
Ph.D. 100,100 98,000 91,850 79,000
Table 20
Median Household Income among Female Household Heads by Race/Ethnicity and Educational Attainment,
1990 – 2010 (in population 25 years of age and older and inflation adjusted 2010 dollars)

Latinas in New York City, Education and Income 62
Latino Data Project Report 53 September 2013
City headed by Latinas with B.A. degrees, Mexican women had the highest level of income and
Dominican women had the lowest level of income. (See figure 66).
At levels of education greater than B.A. degrees, households headed by Latinas of the five largest
Latino nationalities in New York City increased in median income from 1990 to 2010. Notably, in
2010, while households headed by Mexican women with professional degrees had substantially lower
median income, Mexican women with Ph.D. degrees had substantially higher income compared to all
other national groups reported here at equivalent levels of education. (See table 21).
These data show that at lower levels of education, households headed by Puerto Rican women
made substantially less than women of other nationalities who were equivalently educated. However,
at higher levels of education, there is more equality in pay across groups. With exception, at higher
levels of education, households headed by Dominican women who were equivalently educated made
substantially less than women of other nationalities.
$19,790
$28,800
$28,800
$12,700
$26,145
$22,500
$27,250
$31,625
$12,750
$30,875
$19,995
$25,631
$31,601
$12,712
$30,771
$0 $10,000 $20,000 $30,000 $40,000
Dominican
Ecuadorian
Colombian
Puerto Rican
Mexican
Figure 65Median Household Income among Latina Household Heads of the Five Largest Latino
Nationalities in New York City which did not Graduate High School, 1990 – 2010 (in inflation adjusted 2010 dollars)
1990 2000 2010

Latinas in New York City, Education and Income 63
Latino Data Project Report 53 September 2013
Year Educational Attainment Mexican
Puerto
Rican Colombian Ecuadorian Dominican
1990 Did not Graduate High School 30,771 12,712 31,601 25,631 19,995
High School Graduate 51,150 29,700 40,425 32,556 23,452
Associates Degree 43,671 41,415 29,535 32,056 32,171
B.A. Degree 45,891 52,800 52,696 63,254 41,499
M.A. Degree 44,951 75,085 67,779 32,075 72,105
Professional Degree 92,097 57,750 84,480 75,059 26,400
Ph.D. 165,000 44,446 n/a n/a 40,784
2000 Did not Graduate High School 30,875 12,750 31,625 27,250 22,500
High School Graduate 31,750 26,125 35,000 36,250 28,250
Associates Degree 54,438 40,750 39,750 49,125 34,875
B.A. Degree 60,813 56,250 60,688 69,625 47,438
M.A. Degree 69,125 66,875 81,625 76,750 49,375
Professional Degree 112,500 54,625 65,000 41,706 40,000
Ph.D. 167,500 74,969 64,406 n/a 43,750
2010 Did not Graduate High School 26,145 12,700 28,800 28,800 19,790
High School Graduate 26,950 30,000 35,115 35,115 28,305
Associates Degree 30,000 50,000 61,500 61,500 35,500
B.A. Degree 77,000 64,500 72,000 72,000 49,400
M.A. Degree 85,450 74,000 57,450 57,450 68,500
Professional Degree 52,150 93,400 96,100 96,100 109,200
Ph.D. 223,000 99,000 71,700 n/a 92,200
Note: The “n/a” entry indicates no data is available.
Table 21
Median Household Income among Female Household Heads of the Five Largest Latino Nationalities in New
York City by Educational Attainment, 1990 – 2010
(in population 25 years of age and older and inflation adjusted 2010 dollars)
$49,400
$72,000
$72,000
$64,500
$77,000
$47,438
$69,625
$60,688
$56,250
$60,813
$41,499
$63,254
$52,696
$52,800
$45,891
$0 $20,000 $40,000 $60,000 $80,000 $100,000
Dominican
Ecuadorian
Colombian
Puerto Rican
Mexican
Figure 66Median Household Income among Latina Household Heads of the Five Largest Latino
Nationalities in New York City which Attained a B.A. Degree, 1990 – 2010 (in inflation adjusted 2010 dollars)
1990 2000 2010

Latinas in New York City, Education and Income 64
Latino Data Project Report 53 September 2013
Household Income and Education among Latinas by Nativity in New York City
Among households headed by Latinas, foreign-born women who did not graduate high school had
substantially higher household income compared to domestic-born women who did not graduate high
school. This difference was stable from 1990 to 2010. In 2010, households headed by foreign-born
Latinas who did not graduate high school earned $10,000 more annually than domestic-born Latinas.
This is a reversal in the typical patterns seen between foreign- and domestic-born Latinas in New
York City, where domestic-born women had higher income levels. This pattern may be attributed to
migration patterns, as it is likely that foreign-born women come to the U.S. with less education, but for
the primary purpose of employment. (See figure 67).
At higher educational levels (B.A. degree and Ph.D.), this pattern reversed. Households
headed by the City’s domestic-born women earned more than foreign-born women, at equivalent
levels of education. This difference increased from 1990 to 2010. By 2010, domestic-born women with
B.A. degrees earned $15,500 more than foreign-born women, (See figure 68). However, households
headed by foreign- and domestic-born women with either M.A. degrees or professional degrees have
increasingly equivalent household income. (See table 22).
$22,750
$23,938
$23,196
$12,770
$13,000
$12,811
$0 $10,000 $20,000 $30,000
2010
2000
1990
Figure 67Median Household Income among Latina Household Heads which did not Graduate High
School by Nativity, 1990 – 2010 (in inflation adjusted 2010 dollars)
Domestic-Born Foreign-Born
$49,200
$54,250
$49,012
$64,700
$60,000
$55,440
$0 $20,000 $40,000 $60,000 $80,000
2010
2000
1990
Figure 68Median Household Income among Latina Household Heads which Attained a B.A. Degree
by Nativity, 1990 – 2010 (in inflation adjusted 2010 dollars)
Domestic-Born Foreign-Born

Latinas in New York City, Education and Income 65
Latino Data Project Report 53 September 2013
Household Income and Education among Latino/as by Sex and Nativity in New York City
From 1990 to 2010, households with Latina heads, both foreign- and domestic-born, had
generally lower median household incomes compared to households headed by men, at equivalent
levels of education. This gap persisted across all census years in New York City. (See table 22).
Households with domestic-born Latina heads who did not graduate high school had lower
income than all other domestic- and foreign-born men and women from 1990 to 2010. The City’s
domestic- and foreign-born men who did not graduate high school decreased in median household
income across the census years. In 2000, however, households headed by foreign-born women who
did not graduate high school earned equivalent income to households headed by domestic-born men.
(See figure 69).
Among households headed by domestic-born women who obtained B.A. degrees, median
income increased from 1990 to 2010. Across those years, household incomes decreased among both
foreign- and domestic-born men with B.A. degrees. By 2010, households headed by domestic-born
women with B.A. degrees had higher income than foreign-born men with B.A. degrees. Households
headed by foreign-born women with B.A. degrees had stable income across census years, which was
consistently lower than all other groups. (See figure 70). By 2010, households headed by domestic-
born men had the greatest median household income. (See table 22).
Male Female Male Female
1990 Did not Graduate High School 43,525 23,196 36,225 12,811
High School Graduate 53,625 31,350 58,694 29,700
Associates Degree 57,420 34,033 57,803 42,030
B.A. Degree 67,667 49,012 78,623 55,440
M.A. Degree 82,706 68,403 78,953 74,250
Professional Degree 84,688 58,232 90,750 62,898
Ph.D. 76,526 56,991 68,912 53,591
2000 Did not Graduate High School 40,250 23,938 28,250 13,000
High School Graduate 49,250 31,250 51,250 26,625
Associates Degree 60,000 38,531 62,875 41,250
B.A. Degree 63,594 54,250 74,375 60,000
M.A. Degree 77,375 61,250 83,775 68,938
Professional Degree 67,625 54,500 93,900 55,000
Ph.D. 79,750 63,313 108,188 76,625
2010 Did not Graduate High School 37,800 22,750 21,600 12,770
High School Graduate 46,250 30,600 45,000 31,000
Associates Degree 42,400 39,500 59,600 50,000
B.A. Degree 62,000 49,200 72,000 64,700
M.A. Degree 82,200 73,000 93,500 78,500
Professional Degree 83,870 85,000 146,100 80,500
Ph.D. 35,000 73,100 89,840 95,600
Table 22
Median Household Income among Latino/a Household Heads by Sex, Nativity and
Educational Attainment, 1990 – 2010 (in population 25 years of age and older and inflation
adjusted 2010 dollars)
Educational Attainment
Foreign-Born Domestic-Born
Year

Latinas in New York City, Education and Income 66
Latino Data Project Report 53 September 2013
$62,000
$49,200
$72,000
$64,700
$63,594
$54,250
$74,375
$60,000
$67,667
$49,012
$78,623
$55,440
$0 $20,000 $40,000 $60,000 $80,000 $100,000
Male
Female
Male
Female
Fo
reig
n-B
orn
Do
me
stic-B
orn
Figure 70Median Household Income among Latino/a Household Heads which Attained a B.A. Degree
by Nativity, 1990 – 2010 (in inflation adjusted 2010 dollars)
1990 2000 2010
$37,800
$22,750
$21,600
$12,770
$40,250
$23,938
$28,250
$13,000
$43,525
$23,196
$36,225
$12,811
$0 $10,000 $20,000 $30,000 $40,000 $50,000
Male
Female
Male
Female
Fo
reig
n-B
orn
Do
me
stic-B
orn
Figure 69Median Household Income among Latino/a Household Heads which did not Graduate High
School by Nativity, 1990 – 2010 (in inflation adjusted 2010 dollars)
1990 2000 2010

Latinas in New York City, Education and Income 67
Latino Data Project Report 53 September 2013
Concluding Highlights
From 1990 to 2010, in New York City, Latinas’ educational attainment and income levels
increased.
Among the City’s Latino/as, women consistently earned lower levels of yearly personal income
than men from 1990 to 2010, even at equivalent levels of education.
Among Latino/as, women increasingly surpassed men’s level of education from 1990 to 2010.
Latinas in New York City earned lower levels of education and yearly personal income than Non-
Hispanic White, Non-Hispanic Black, and Asian women from 1990 to 2010, with few exceptions.
This persisted at equivalent levels of education.
Puerto Rican, Colombian, Ecuadorian, and Dominican women in the City increased educational
attainment and personal income levels. However, Mexican women’s educational attainment and
income levels remained stable or declined over these three decades.
Among Latinas, domestic-born women consistently and increasingly attained higher levels of
education and income than foreign-born women from 1990 to 2010, even at equivalent levels of
education.
Among Latino/as in the City, domestic-born women began to surpass foreign-born men in income,
but a gap between domestic-born women and men remained.
In New York City, among Latino/as, households headed by women earned lower levels of yearly
household income than households headed by men from 1990 to 2010, with few exceptions. This
persisted at equivalent levels of education.
Households headed by Latinas earned lower levels of household income than Non-Hispanic
White, Non-Hispanic Black, and Asian women from 1990 to 2010, with few exceptions. This
persisted at equivalent levels of education.
Households headed by Puerto Rican, Colombian, Ecuadorian, and Dominican women increased
household income from 1990 to 2010. However, households headed by Mexican tended to
decrease income levels.
Households headed by domestic-born women earned higher levels of household income than
households headed by foreign-born women.
Households headed by domestic-born women began to surpass foreign-born men in household
income, but a gap between domestic-born women and men remained.

Latinas in New York City, Education and Income 68
Latino Data Project Report 53 September 2013
Many of these patterns are likely attributed to migration patterns. As the foreign-born Mexican
population increased, the influx of individuals with lower educational attainment likely contributed
to lower education and income levels. As the foreign-born Puerto Rican, Colombian, Ecuadorian,
and Dominican population decreased, their education and income levels rose.