Latin American Equity Research Sector Report€¦ · Mexico City, October 26, 2010 Mexico ... The...
24
Important disclosures/certifications are in the “Important Disclosures” section of this report. U.S. investors’ inquiries should be directed to Santander Investment Securities Inc. at (212) 583-4629/ (212) 350-3918. * Employed by a non-US affiliate of Santander Investment Securities Inc. and is not registered/qualified as a research analyst under FINRA rules. Latin American Equity Research Sector Report Mexico City, October 26, 2010 Mexico – Telecom & Media AMX AND TMX OCTOBER 2010 No Bargains; Introducing YE2011 Target Prices; Revising Ratings Gregorio Tomassi*, CFA Valder Nogueira* Diana Leyva* Mexico: Banco Santander S.A. Brazil: Banco Santander S.A. Mexico: Banco Santander S.A. +5255 5269-2102 +5511 3012-5747 +5255 5269-2200 [email protected] [email protected] [email protected] In this report, we are downgrading our ratings on AMX and TMX to Hold and Underperform, from Buy and Hold, respectively, while introducing our 2011 year-end target prices of US$62.00 per ADS for AMX and US$15.00 per ADS for TMX. The two recommendation changes each had different drivers. For AMX, the downgrade is mostly a valuation call, as our estimates have not changed substantially, but we believe that the 13.6% stock-price increase in U.S. dollar terms since mid- September reduces the upside potential to an estimated 13.4% through year-end 2011. For TMX, we reduced our estimates based on what we believe to be a downward trend in revenue, mostly from traditional voice services to the residential segment, being more persistent than we previously expected. For AMX, we recommend that investors seek a neutral (equal-weight) position in AMX relative to the Mexbol, as we approach the upcoming Investor Day on November 18. We see no near-term catalysts for the stock to over- or underperform the market, while from a global telecom perspective, the stock does not look cheap. For TMX, we believe that a low 3.1% total-return potential will be driven by an estimated 5.3% dividend yield through year-end 2011, partially offset by a drop in the share price. The market may have overblown expectations that TMX will soon be granted authorization to offer TV services. We believe that such authorization will not happen quickly. In our view, this is being effectively negotiated in exchange for TMX’s commitment to provide better interconnection conditions under a new interconnection framework and cost model. Considering current regulatory demands, our view is that TMX has more to lose than to gain from this negotiation and that the process will drag while Telmex and the government continue to measure their relative strengths in legal battles in the courts. Minority interests are better represented in AMX than in TMX. The consolidation of TMX into AMX inverted the relative interests that Mr. Carlos Slim, the common controlling partner, has in each. Mr. Slim went from having equity interests of 19% and 49% in AMX and TMX, respectively, to 30% and 18%. In matters involving strategies and resources shared between the two companies, we believe that Mr. Slim’s interests would be more inclined to favor AMX over TMX. AMX is no longer our top pick in the Mexican telecom & media stocks that we cover. We now expect more upside in Televisa than in AMX. In contrast with what we believe is lack of catalysts in AMX, two recent important and favorable decisions could unlock additional value for Televisa: the deal with Univision and the withdrawal from the agreement with Nextel. The two decisions combined strengthen Televisa’s strategic and financial focus. We believe some of the potential benefits have already been priced in, but we also believe there is upside risk. Company Metrics (U.S. Dollars in Millions a ) Growth Curr. Price EBITDA EPS/ADS FV/EBITDA P/E Company Ticker Rec. 20-Oct Target Price (US$) Ups./ Down. ’11E ’12E ’11E ’12E ’10E ’11E ’10E ’11E Market Cap (US$ Mn) America Movil AMX HOLD 56.88 62.00 13% 25% 2% 14% 7% 8.5 6.6 17.7 14.3 114,002 Axtel AXTELCPO HOLD 0.61 0.68 12% 3% 6% 97% -65% 5.6 5.5 NM NM 766 Megacable MEGACPO UNDERP. 2.43 2.58 6% 9% 12% 10% 10% 8.6 7.5 14.0 12.7 2,089 Televisa TV HOLD 21.90 26.00 21% 6% 5% 28% 1% 9.2 9.2 21.5 16.8 12,221 Telmex TMX UNDERP. 15.35 15.00 3% -8% -4% -11% 3% 5.4 5.4 11.5 12.9 13,962 Average 13% 20% 2% 13% 6% 8.2 6.7 17.3 14.3 143,040 a Except per share/ADR amounts. NM: Not meaningful. Sources: Company reports and Santander estimates.
Transcript of Latin American Equity Research Sector Report€¦ · Mexico City, October 26, 2010 Mexico ... The...

Important disclosures/certifications are in the “Important Disclosures” section of this report. U.S. investors’ inquiries should be directed to Santander Investment Securities Inc. at (212) 583-4629/ (212) 350-3918.
* Employed by a non-US affiliate of Santander Investment Securities Inc. and is not registered/qualified as a research analyst under FINRA rules.
Latin American Equity Research Sector Report
Mexico City, October 26, 2010 Mexico – Telecom & Media
AMX AND TMX OCTOBER 2010No Bargains; Introducing YE2011 Target Prices; Revising Ratings Gregorio Tomassi*, CFA Valder Nogueira* Diana Leyva*Mexico: Banco Santander S.A. Brazil: Banco Santander S.A. Mexico: Banco Santander S.A.+5255 5269-2102 +5511 3012-5747 +5255 [email protected] [email protected] [email protected]
In this report, we are downgrading our ratings on AMX and TMX to Hold and Underperform, from Buy and Hold, respectively, while introducing our 2011 year-end target prices of US$62.00 per ADS for AMX and US$15.00 per ADS for TMX. The two recommendation changes each had different drivers. For AMX, the downgrade is mostly a valuation call, as our estimates have not changed substantially, but we believe that the 13.6% stock-price increase in U.S. dollar terms since mid-September reduces the upside potential to an estimated 13.4% through year-end 2011. For TMX, we reduced our estimates based on what we believe to be a downward trend in revenue, mostly from traditional voice services to the residential segment, being more persistent than we previously expected. For AMX, we recommend that investors seek a neutral (equal-weight) position in AMX relative to the Mexbol, as we approach the upcoming Investor Day on November 18. We see no near-term catalysts for the stock to over- or underperform the market, while from a global telecom perspective, the stock does not look cheap. For TMX, we believe that a low 3.1% total-return potential will be driven by an estimated 5.3% dividend yield through year-end 2011, partially offset by a drop in the share price. The market may have overblown expectations that TMX will soon be granted authorization to offer TV services. We believe that such authorization will not happen quickly. In our view, this is being effectively negotiated in exchange for TMX’s commitment to provide better interconnection conditions under a new interconnection framework and cost model. Considering current regulatory demands, our view is that TMX has more to lose than to gain from this negotiation and that the process will drag while Telmex and the government continue to measure their relative strengths in legal battles in the courts. Minority interests are better represented in AMX than in TMX. The consolidation of TMX into AMX inverted the relative interests that Mr. Carlos Slim, the common controlling partner, has in each. Mr. Slim went from having equity interests of 19% and 49% in AMX and TMX, respectively, to 30% and 18%. In matters involving strategies and resources shared between the two companies, we believe that Mr. Slim’s interests would be more inclined to favor AMX over TMX. AMX is no longer our top pick in the Mexican telecom & media stocks that we cover. We now expect more upside in Televisa than in AMX. In contrast with what we believe is lack of catalysts in AMX, two recent important and favorable decisions could unlock additional value for Televisa: the deal with Univision and the withdrawal from the agreement with Nextel. The two decisions combined strengthen Televisa’s strategic and financial focus. We believe some of the potential benefits have already been priced in, but we also believe there is upside risk.
Company Metrics (U.S. Dollars in Millionsa)
Growth
Curr. Price
EBITDA EPS/ADS FV/EBITDA P/E
Company Ticker Rec. 20-Oct
Target Price (US$)
Ups./ Down. ’11E ’12E ’11E ’12E ’10E ’11E ’10E ’11E
Market Cap
(US$ Mn) America Movil AMX HOLD 56.88 62.00 13% 25% 2% 14% 7% 8.5 6.6 17.7 14.3 114,002Axtel AXTELCPO HOLD 0.61 0.68 12% 3% 6% 97% -65% 5.6 5.5 NM NM 766Megacable MEGACPO UNDERP. 2.43 2.58 6% 9% 12% 10% 10% 8.6 7.5 14.0 12.7 2,089Televisa TV HOLD 21.90 26.00 21% 6% 5% 28% 1% 9.2 9.2 21.5 16.8 12,221
Telmex TMX UNDERP. 15.35 15.00 3% -8% -4% -11% 3% 5.4 5.4 11.5 12.9 13,962
Average 13% 20% 2% 13% 6% 8.2 6.7 17.3 14.3 143,040aExcept per share/ADR amounts. NM: Not meaningful. Sources: Company reports and Santander estimates.
AMX and TMX: No Bargains; Introducing YE2011 Target Prices; Revising Ratings
2 Important disclosures/certifications are in the “Important Disclosures” section of this report. U.S. investors’ inquiries should be directed to Santander Investment Securities Inc. at (212) 583-4629/ (212) 350-3918.
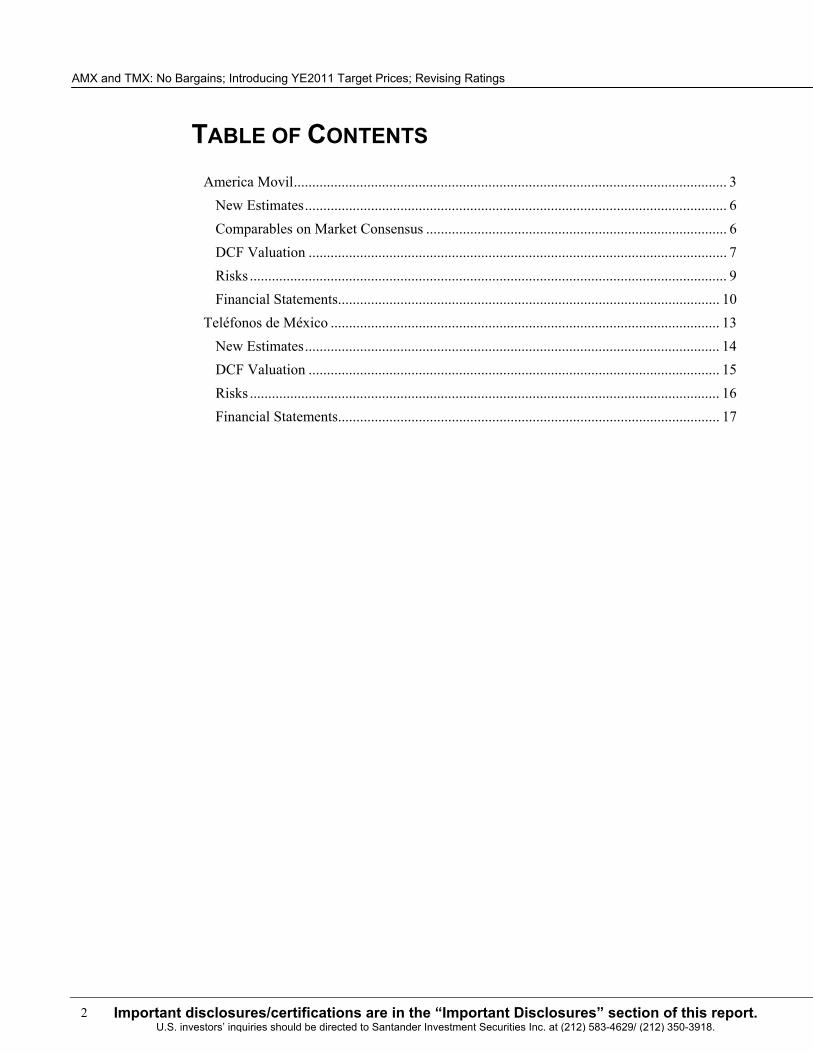
TABLE OF CONTENTS
America Movil...................................................................................................................... 3 New Estimates................................................................................................................... 6 Comparables on Market Consensus .................................................................................. 6 DCF Valuation .................................................................................................................. 7 Risks .................................................................................................................................. 9 Financial Statements........................................................................................................ 10
Teléfonos de México .......................................................................................................... 13 New Estimates................................................................................................................. 14 DCF Valuation ................................................................................................................ 15 Risks ................................................................................................................................ 16 Financial Statements........................................................................................................ 17
3Important disclosures/certifications are in the “Important Disclosures” section of this report. U.S. investors’ inquiries should be directed to Santander Investment Securities Inc. at (212) 583-4629/ (212) 350-3918.
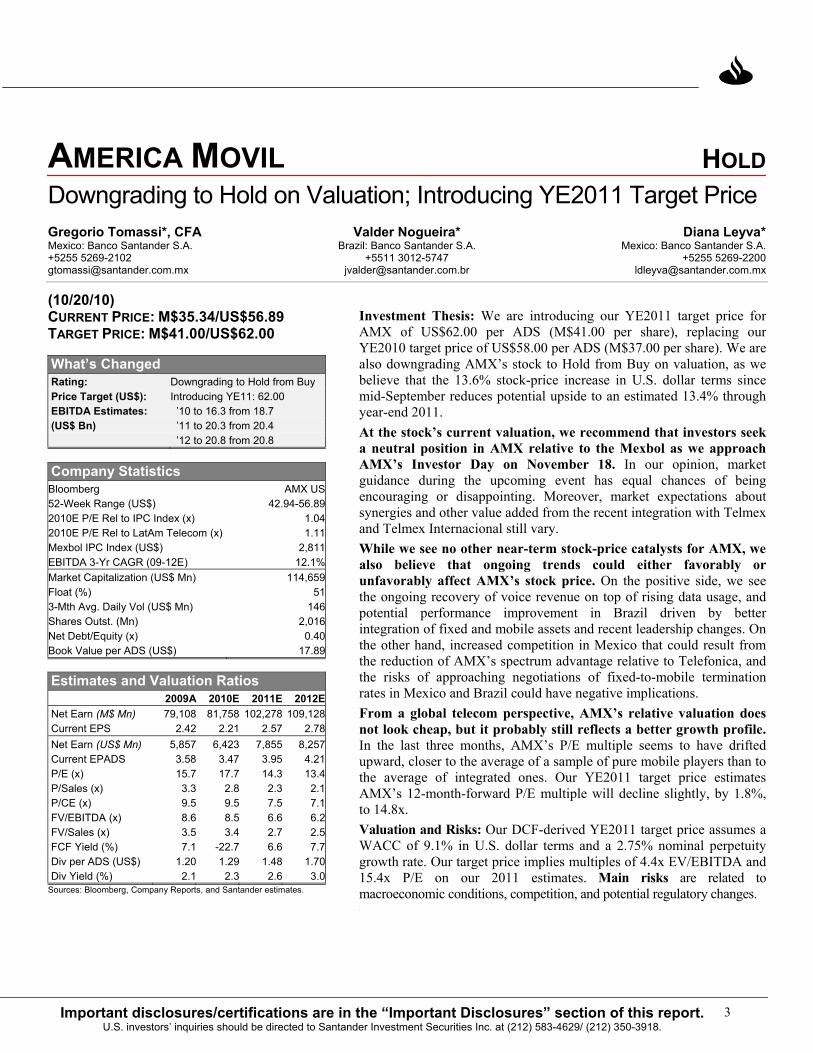
AMERICA MOVIL HOLDDowngrading to Hold on Valuation; Introducing YE2011 Target Price Gregorio Tomassi*, CFA Valder Nogueira* Diana Leyva*Mexico: Banco Santander S.A. Brazil: Banco Santander S.A. Mexico: Banco Santander S.A.+5255 5269-2102 +5511 3012-5747 +5255 [email protected] [email protected] [email protected]
(10/20/10) CURRENT PRICE: M$35.34/US$56.89 TARGET PRICE: M$41.00/US$62.00
What’s Changed Rating: Downgrading to Hold from Buy Price Target (US$): Introducing YE11: 62.00 EBITDA Estimates: ’10 to 16.3 from 18.7 (US$ Bn) ’11 to 20.3 from 20.4 ’12 to 20.8 from 20.8
Company Statistics Bloomberg AMX US52-Week Range (US$) 42.94-56.89 2010E P/E Rel to IPC Index (x) 1.04 2010E P/E Rel to LatAm Telecom (x) 1.11Mexbol IPC Index (US$) 2,811 EBITDA 3-Yr CAGR (09-12E) 12.1%Market Capitalization (US$ Mn) 114,659 Float (%) 513-Mth Avg. Daily Vol (US$ Mn) 146 Shares Outst. (Mn) 2,016 Net Debt/Equity (x) 0.40 Book Value per ADS (US$) 17.89
Estimates and Valuation Ratios 2009A 2010E 2011E 2012ENet Earn (M$ Mn) 79,108 81,758 102,278 109,128Current EPS 2.42 2.21 2.57 2.78Net Earn (US$ Mn) 5,857 6,423 7,855 8,257Current EPADS 3.58 3.47 3.95 4.21P/E (x) 15.7 17.7 14.3 13.4P/Sales (x) 3.3 2.8 2.3 2.1P/CE (x) 9.5 9.5 7.5 7.1FV/EBITDA (x) 8.6 8.5 6.6 6.2FV/Sales (x) 3.5 3.4 2.7 2.5FCF Yield (%) 7.1 -22.7 6.6 7.7Div per ADS (US$) 1.20 1.29 1.48 1.70Div Yield (%) 2.1 2.3 2.6 3.0
Sources: Bloomberg, Company Reports, and Santander estimates.
Investment Thesis: We are introducing our YE2011 target price for AMX of US$62.00 per ADS (M$41.00 per share), replacing our YE2010 target price of US$58.00 per ADS (M$37.00 per share). We are also downgrading AMX’s stock to Hold from Buy on valuation, as we believe that the 13.6% stock-price increase in U.S. dollar terms since mid-September reduces potential upside to an estimated 13.4% through year-end 2011. At the stock’s current valuation, we recommend that investors seek a neutral position in AMX relative to the Mexbol as we approach AMX’s Investor Day on November 18. In our opinion, market guidance during the upcoming event has equal chances of being encouraging or disappointing. Moreover, market expectations about synergies and other value added from the recent integration with Telmex and Telmex Internacional still vary. While we see no other near-term stock-price catalysts for AMX, we also believe that ongoing trends could either favorably or unfavorably affect AMX’s stock price. On the positive side, we see the ongoing recovery of voice revenue on top of rising data usage, and potential performance improvement in Brazil driven by better integration of fixed and mobile assets and recent leadership changes. On the other hand, increased competition in Mexico that could result from the reduction of AMX’s spectrum advantage relative to Telefonica, and the risks of approaching negotiations of fixed-to-mobile termination rates in Mexico and Brazil could have negative implications. From a global telecom perspective, AMX’s relative valuation does not look cheap, but it probably still reflects a better growth profile. In the last three months, AMX’s P/E multiple seems to have drifted upward, closer to the average of a sample of pure mobile players than to the average of integrated ones. Our YE2011 target price estimates AMX’s 12-month-forward P/E multiple will decline slightly, by 1.8%, to 14.8x. Valuation and Risks: Our DCF-derived YE2011 target price assumes a WACC of 9.1% in U.S. dollar terms and a 2.75% nominal perpetuity growth rate. Our target price implies multiples of 4.4x EV/EBITDA and 15.4x P/E on our 2011 estimates. Main risks are related to macroeconomic conditions, competition, and potential regulatory changes. w
AMX and TMX: No Bargains; Introducing YE2011 Target Prices; Revising Ratings
4 Important disclosures/certifications are in the “Important Disclosures” section of this report. U.S. investors’ inquiries should be directed to Santander Investment Securities Inc. at (212) 583-4629/ (212) 350-3918.
America Movil is Latin America’s largest mobile phone service operator, with over 200 million mobile subscribers as of December 2009. After completion in June 2010 of tender offers for shares in Carso Global Telecom and Telmex Internacional, it owned directly or indirectly approximately 94.6% of Telmex Internacional, and 59.4% of Telmex (TMX). The company started consolidating these two operations on July 1, 2010. AMX’s business involves mobile, fixed line, and pay-TV operations, with a presence in several countries in Latin America and in the U.S. In 2009, AMX reported sales of US$29.2 billion, EBITDA of US$11.8 billion (on a margin of 40.3%), and net debt of US$6.4 billion. Combined annual sales and EBITDA of Telmex and Telmex Internacional in 2009 are equivalent to 54% and 48% of AMX’s that same year. The company is controlled by the Slim family, which, as of June 2010, owned over 50.5% of the voting shares and over 29% of the total capital. AT&T holds an equity stake in AMX equivalent to 8.9%.
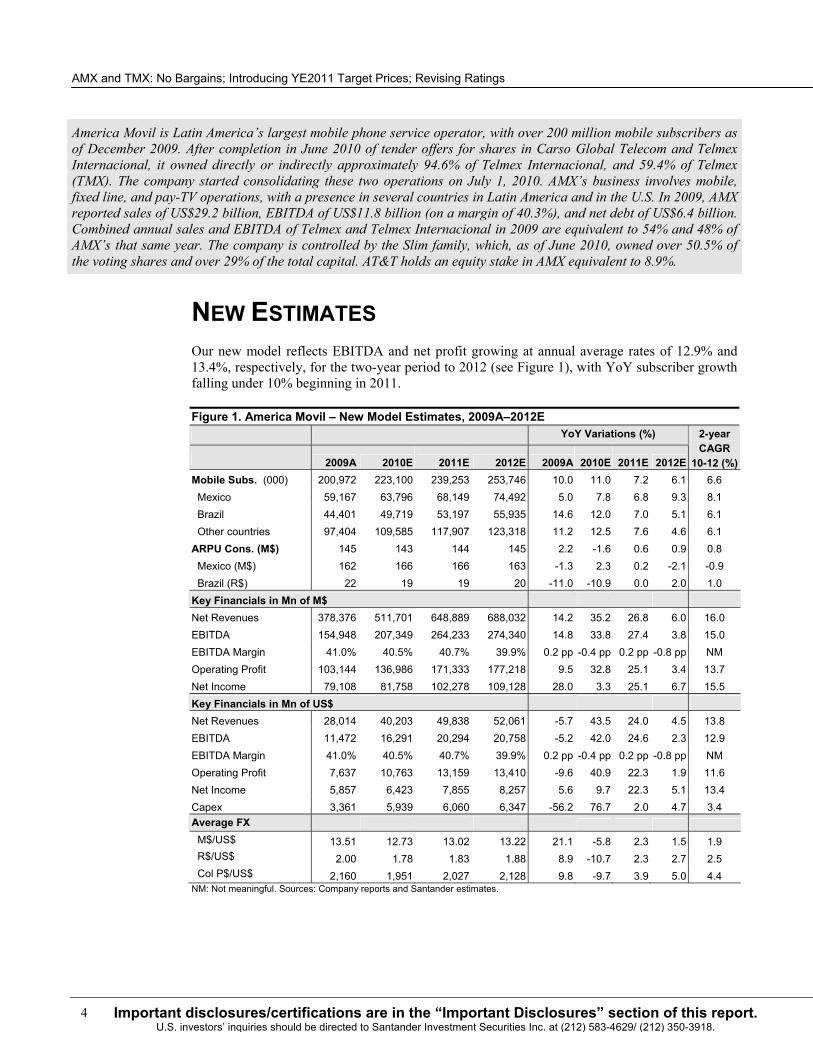
NEW ESTIMATES Our new model reflects EBITDA and net profit growing at annual average rates of 12.9% and 13.4%, respectively, for the two-year period to 2012 (see Figure 1), with YoY subscriber growth falling under 10% beginning in 2011.
Figure 1. America Movil – New Model Estimates, 2009A–2012E YoY Variations (%)
2009A 2010E 2011E 2012E 2009A 2010E 2011E 2012E
2-year CAGR
10-12 (%)Mobile Subs. (000) 200,972 223,100 239,253 253,746 10.0 11.0 7.2 6.1 6.6 Mexico 59,167 63,796 68,149 74,492 5.0 7.8 6.8 9.3 8.1 Brazil 44,401 49,719 53,197 55,935 14.6 12.0 7.0 5.1 6.1 Other countries 97,404 109,585 117,907 123,318 11.2 12.5 7.6 4.6 6.1 ARPU Cons. (M$) 145 143 144 145 2.2 -1.6 0.6 0.9 0.8 Mexico (M$) 162 166 166 163 -1.3 2.3 0.2 -2.1 -0.9 Brazil (R$) 22 19 19 20 -11.0 -10.9 0.0 2.0 1.0 Key Financials in Mn of M$ Net Revenues 378,376 511,701 648,889 688,032 14.2 35.2 26.8 6.0 16.0 EBITDA 154,948 207,349 264,233 274,340 14.8 33.8 27.4 3.8 15.0 EBITDA Margin 41.0% 40.5% 40.7% 39.9% 0.2 pp -0.4 pp 0.2 pp -0.8 pp NM Operating Profit 103,144 136,986 171,333 177,218 9.5 32.8 25.1 3.4 13.7 Net Income 79,108 81,758 102,278 109,128 28.0 3.3 25.1 6.7 15.5 Key Financials in Mn of US$ Net Revenues 28,014 40,203 49,838 52,061 -5.7 43.5 24.0 4.5 13.8 EBITDA 11,472 16,291 20,294 20,758 -5.2 42.0 24.6 2.3 12.9 EBITDA Margin 41.0% 40.5% 40.7% 39.9% 0.2 pp -0.4 pp 0.2 pp -0.8 pp NM Operating Profit 7,637 10,763 13,159 13,410 -9.6 40.9 22.3 1.9 11.6 Net Income 5,857 6,423 7,855 8,257 5.6 9.7 22.3 5.1 13.4 Capex 3,361 5,939 6,060 6,347 -56.2 76.7 2.0 4.7 3.4 Average FX M$/US$ 13.51 12.73 13.02 13.22 21.1 -5.8 2.3 1.5 1.9 R$/US$ 2.00 1.78 1.83 1.88 8.9 -10.7 2.3 2.7 2.5 Col P$/US$ 2,160 1,951 2,027 2,128 9.8 -9.7 3.9 5.0 4.4 NM: Not meaningful. Sources: Company reports and Santander estimates.
5Important disclosures/certifications are in the “Important Disclosures” section of this report. U.S. investors’ inquiries should be directed to Santander Investment Securities Inc. at (212) 583-4629/ (212) 350-3918.
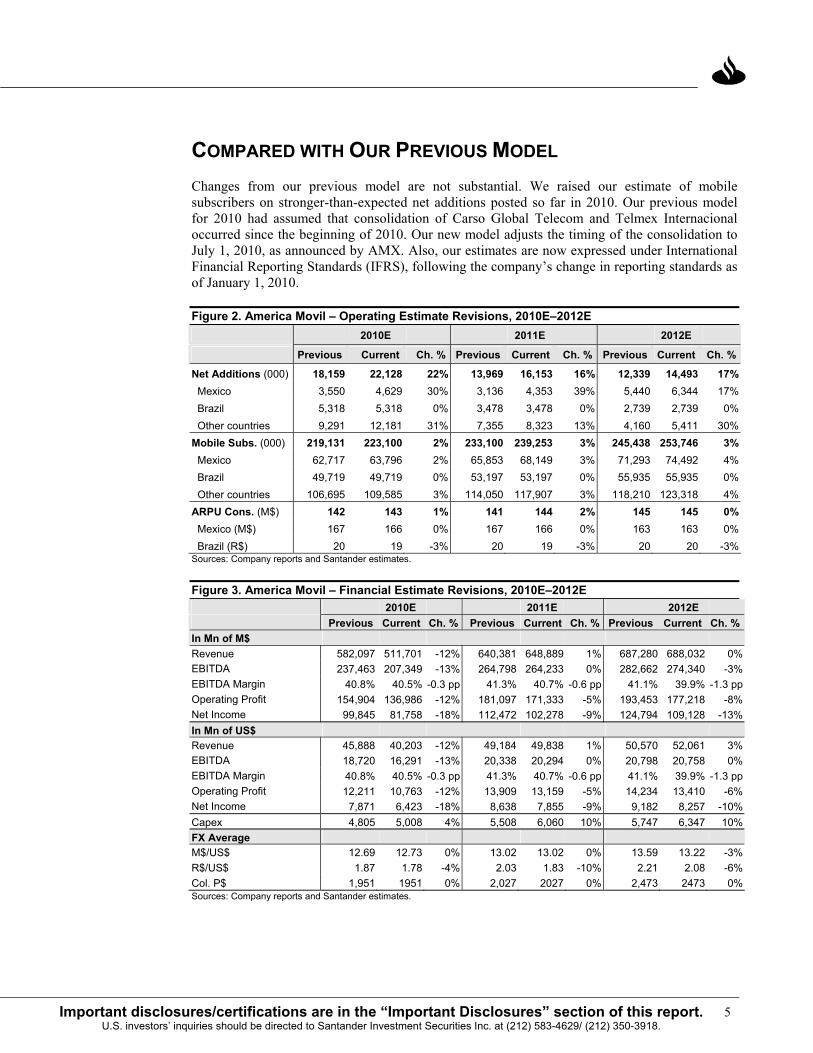
COMPARED WITH OUR PREVIOUS MODEL Changes from our previous model are not substantial. We raised our estimate of mobile subscribers on stronger-than-expected net additions posted so far in 2010. Our previous model for 2010 had assumed that consolidation of Carso Global Telecom and Telmex Internacional occurred since the beginning of 2010. Our new model adjusts the timing of the consolidation to July 1, 2010, as announced by AMX. Also, our estimates are now expressed under International Financial Reporting Standards (IFRS), following the company’s change in reporting standards as of January 1, 2010.
Figure 2. America Movil – Operating Estimate Revisions, 2010E–2012E 2010E 2011E 2012E
Previous Current Ch. % Previous Current Ch. % Previous Current Ch. %
Net Additions (000) 18,159 22,128 22% 13,969 16,153 16% 12,339 14,493 17% Mexico 3,550 4,629 30% 3,136 4,353 39% 5,440 6,344 17% Brazil 5,318 5,318 0% 3,478 3,478 0% 2,739 2,739 0% Other countries 9,291 12,181 31% 7,355 8,323 13% 4,160 5,411 30%Mobile Subs. (000) 219,131 223,100 2% 233,100 239,253 3% 245,438 253,746 3% Mexico 62,717 63,796 2% 65,853 68,149 3% 71,293 74,492 4% Brazil 49,719 49,719 0% 53,197 53,197 0% 55,935 55,935 0% Other countries 106,695 109,585 3% 114,050 117,907 3% 118,210 123,318 4%ARPU Cons. (M$) 142 143 1% 141 144 2% 145 145 0% Mexico (M$) 167 166 0% 167 166 0% 163 163 0% Brazil (R$) 20 19 -3% 20 19 -3% 20 20 -3%Sources: Company reports and Santander estimates.
Figure 3. America Movil – Financial Estimate Revisions, 2010E–2012E 2010E 2011E 2012E Previous Current Ch. % Previous Current Ch. % Previous Current Ch. %
In Mn of M$ Revenue 582,097 511,701 -12% 640,381 648,889 1% 687,280 688,032 0%EBITDA 237,463 207,349 -13% 264,798 264,233 0% 282,662 274,340 -3%EBITDA Margin 40.8% 40.5% -0.3 pp 41.3% 40.7% -0.6 pp 41.1% 39.9% -1.3 ppOperating Profit 154,904 136,986 -12% 181,097 171,333 -5% 193,453 177,218 -8%Net Income 99,845 81,758 -18% 112,472 102,278 -9% 124,794 109,128 -13%In Mn of US$ Revenue 45,888 40,203 -12% 49,184 49,838 1% 50,570 52,061 3%EBITDA 18,720 16,291 -13% 20,338 20,294 0% 20,798 20,758 0%EBITDA Margin 40.8% 40.5% -0.3 pp 41.3% 40.7% -0.6 pp 41.1% 39.9% -1.3 ppOperating Profit 12,211 10,763 -12% 13,909 13,159 -5% 14,234 13,410 -6%Net Income 7,871 6,423 -18% 8,638 7,855 -9% 9,182 8,257 -10%Capex 4,805 5,008 4% 5,508 6,060 10% 5,747 6,347 10%FX Average M$/US$ 12.69 12.73 0% 13.02 13.02 0% 13.59 13.22 -3%R$/US$ 1.87 1.78 -4% 2.03 1.83 -10% 2.21 2.08 -6%Col. P$ 1,951 1951 0% 2,027 2027 0% 2,473 2473 0%Sources: Company reports and Santander estimates.
AMX and TMX: No Bargains; Introducing YE2011 Target Prices; Revising Ratings
6 Important disclosures/certifications are in the “Important Disclosures” section of this report. U.S. investors’ inquiries should be directed to Santander Investment Securities Inc. at (212) 583-4629/ (212) 350-3918.
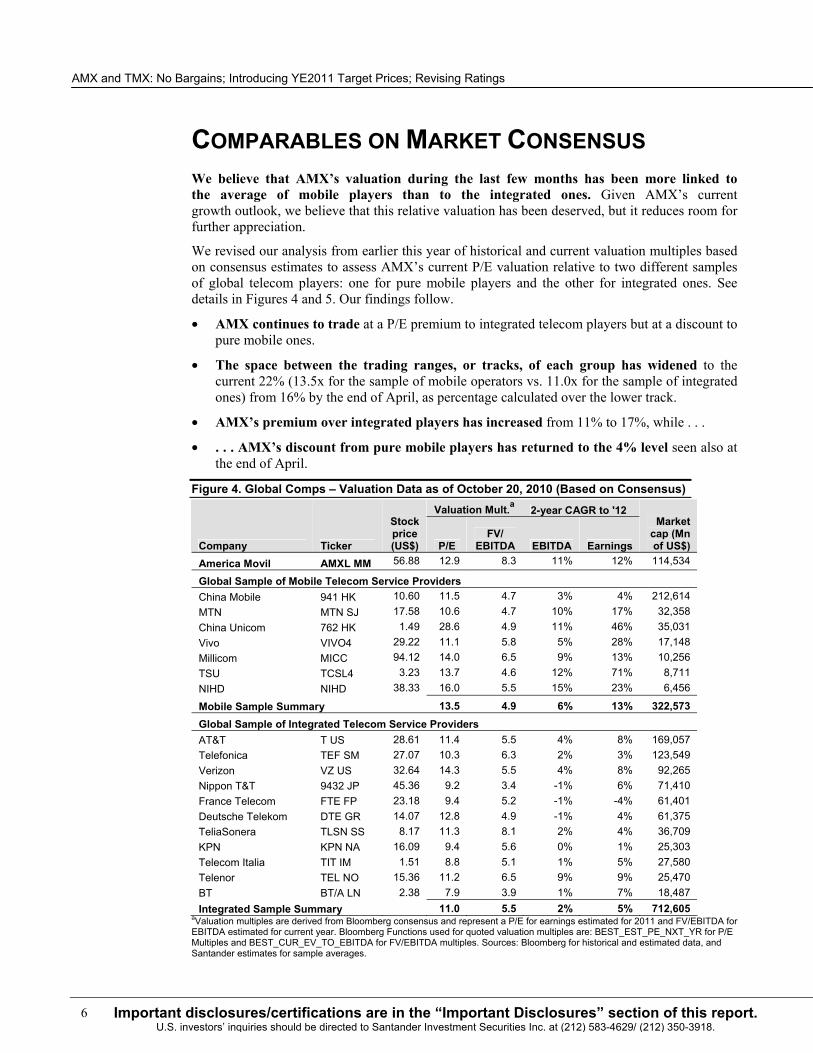
COMPARABLES ON MARKET CONSENSUS We believe that AMX’s valuation during the last few months has been more linked to the average of mobile players than to the integrated ones. Given AMX’s current growth outlook, we believe that this relative valuation has been deserved, but it reduces room for further appreciation.
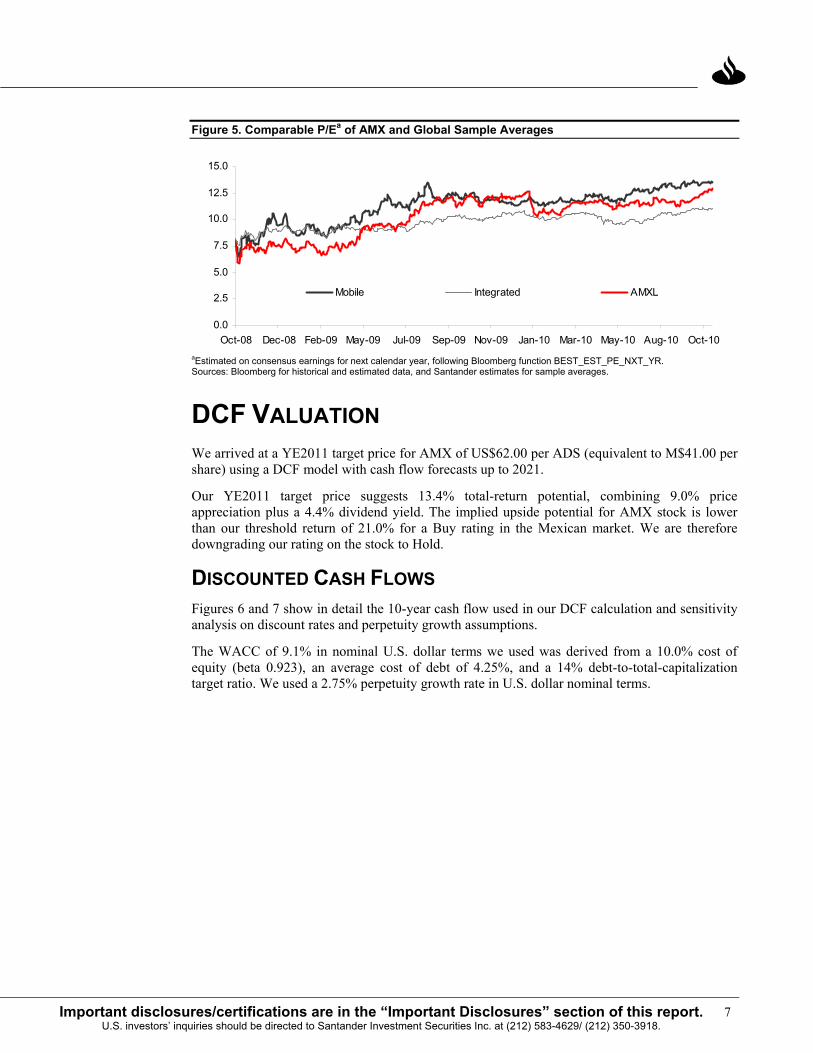
We revised our analysis from earlier this year of historical and current valuation multiples based on consensus estimates to assess AMX’s current P/E valuation relative to two different samples of global telecom players: one for pure mobile players and the other for integrated ones. See details in Figures 4 and 5. Our findings follow.
• AMX continues to trade at a P/E premium to integrated telecom players but at a discount to pure mobile ones.
• The space between the trading ranges, or tracks, of each group has widened to the current 22% (13.5x for the sample of mobile operators vs. 11.0x for the sample of integrated ones) from 16% by the end of April, as percentage calculated over the lower track.
• AMX’s premium over integrated players has increased from 11% to 17%, while . . .
• . . . AMX’s discount from pure mobile players has returned to the 4% level seen also at the end of April.
Figure 4. Global Comps – Valuation Data as of October 20, 2010 (Based on Consensus)
Valuation Mult.a 2-year CAGR to '12
Company Ticker
Stock price (US$) P/E
FV/ EBITDA EBITDA Earnings
Market cap (Mn of US$)
America Movil AMXL MM 56.88 12.9 8.3 11% 12% 114,534
Global Sample of Mobile Telecom Service Providers China Mobile 941 HK 10.60 11.5 4.7 3% 4% 212,614 MTN MTN SJ 17.58 10.6 4.7 10% 17% 32,358 China Unicom 762 HK 1.49 28.6 4.9 11% 46% 35,031 Vivo VIVO4 29.22 11.1 5.8 5% 28% 17,148 Millicom MICC 94.12 14.0 6.5 9% 13% 10,256 TSU TCSL4 3.23 13.7 4.6 12% 71% 8,711 NIHD NIHD 38.33 16.0 5.5 15% 23% 6,456
Mobile Sample Summary 13.5 4.9 6% 13% 322,573 Global Sample of Integrated Telecom Service Providers AT&T T US 28.61 11.4 5.5 4% 8% 169,057 Telefonica TEF SM 27.07 10.3 6.3 2% 3% 123,549 Verizon VZ US 32.64 14.3 5.5 4% 8% 92,265 Nippon T&T 9432 JP 45.36 9.2 3.4 -1% 6% 71,410 France Telecom FTE FP 23.18 9.4 5.2 -1% -4% 61,401 Deutsche Telekom DTE GR 14.07 12.8 4.9 -1% 4% 61,375 TeliaSonera TLSN SS 8.17 11.3 8.1 2% 4% 36,709 KPN KPN NA 16.09 9.4 5.6 0% 1% 25,303 Telecom Italia TIT IM 1.51 8.8 5.1 1% 5% 27,580 Telenor TEL NO 15.36 11.2 6.5 9% 9% 25,470 BT BT/A LN 2.38 7.9 3.9 1% 7% 18,487 Integrated Sample Summary 11.0 5.5 2% 5% 712,605
aValuation multiples are derived from Bloomberg consensus and represent a P/E for earnings estimated for 2011 and FV/EBITDA for EBITDA estimated for current year. Bloomberg Functions used for quoted valuation multiples are: BEST_EST_PE_NXT_YR for P/E Multiples and BEST_CUR_EV_TO_EBITDA for FV/EBITDA multiples. Sources: Bloomberg for historical and estimated data, and Santander estimates for sample averages.
7Important disclosures/certifications are in the “Important Disclosures” section of this report. U.S. investors’ inquiries should be directed to Santander Investment Securities Inc. at (212) 583-4629/ (212) 350-3918.
Figure 5. Comparable P/Ea of AMX and Global Sample Averages
0.0
2.5
5.0
7.5
10.0
12.5
15.0
Oct-08 Dec-08 Feb-09 May-09 Jul-09 Sep-09 Nov-09 Jan-10 Mar-10 May-10 Aug-10 Oct-10
Mobile Integrated AMXL
aEstimated on consensus earnings for next calendar year, following Bloomberg function BEST_EST_PE_NXT_YR. Sources: Bloomberg for historical and estimated data, and Santander estimates for sample averages.
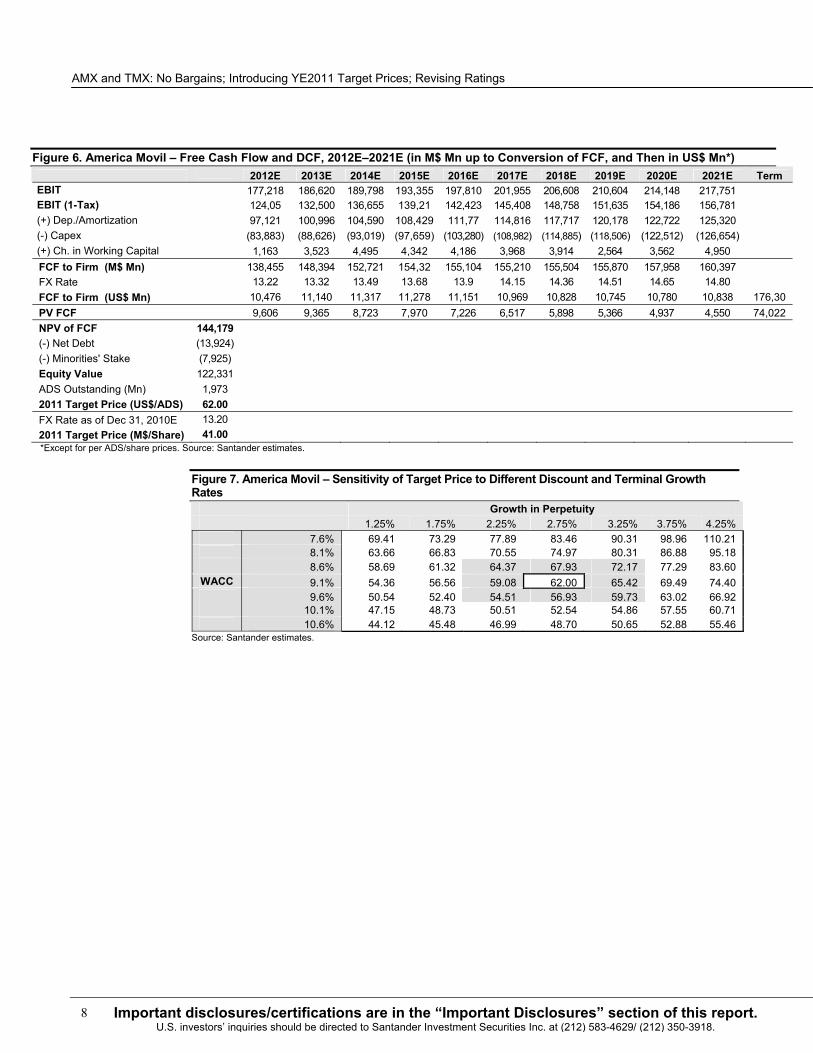
DCF VALUATION We arrived at a YE2011 target price for AMX of US$62.00 per ADS (equivalent to M$41.00 per share) using a DCF model with cash flow forecasts up to 2021.
Our YE2011 target price suggests 13.4% total-return potential, combining 9.0% price appreciation plus a 4.4% dividend yield. The implied upside potential for AMX stock is lower than our threshold return of 21.0% for a Buy rating in the Mexican market. We are therefore downgrading our rating on the stock to Hold.
DISCOUNTED CASH FLOWS Figures 6 and 7 show in detail the 10-year cash flow used in our DCF calculation and sensitivity analysis on discount rates and perpetuity growth assumptions.
The WACC of 9.1% in nominal U.S. dollar terms we used was derived from a 10.0% cost of equity (beta 0.923), an average cost of debt of 4.25%, and a 14% debt-to-total-capitalization target ratio. We used a 2.75% perpetuity growth rate in U.S. dollar nominal terms.
AMX and TMX: No Bargains; Introducing YE2011 Target Prices; Revising Ratings
8 Important disclosures/certifications are in the “Important Disclosures” section of this report. U.S. investors’ inquiries should be directed to Santander Investment Securities Inc. at (212) 583-4629/ (212) 350-3918.
Figure 6. America Movil – Free Cash Flow and DCF, 2012E–2021E (in M$ Mn up to Conversion of FCF, and Then in US$ Mn*) 2012E 2013E 2014E 2015E 2016E 2017E 2018E 2019E 2020E 2021E Term
EBIT 177,218 186,620 189,798 193,355 197,810 201,955 206,608 210,604 214,148 217,751 EBIT (1-Tax) 124,05 132,500 136,655 139,21 142,423 145,408 148,758 151,635 154,186 156,781 (+) Dep./Amortization 97,121 100,996 104,590 108,429 111,77 114,816 117,717 120,178 122,722 125,320 (-) Capex (83,883) (88,626) (93,019) (97,659) (103,280) (108,982) (114,885) (118,506) (122,512) (126,654) (+) Ch. in Working Capital 1,163 3,523 4,495 4,342 4,186 3,968 3,914 2,564 3,562 4,950
FCF to Firm (M$ Mn) 138,455 148,394 152,721 154,32 155,104 155,210 155,504 155,870 157,958 160,397 FX Rate 13.22 13.32 13.49 13.68 13.9 14.15 14.36 14.51 14.65 14.80
FCF to Firm (US$ Mn) 10,476 11,140 11,317 11,278 11,151 10,969 10,828 10,745 10,780 10,838 176,30PV FCF 9,606 9,365 8,723 7,970 7,226 6,517 5,898 5,366 4,937 4,550 74,022 NPV of FCF 144,179 (-) Net Debt (13,924) (-) Minorities' Stake (7,925) Equity Value 122,331 ADS Outstanding (Mn) 1,973 2011 Target Price (US$/ADS) 62.00 FX Rate as of Dec 31, 2010E 13.20 2011 Target Price (M$/Share) 41.00 *Except for per ADS/share prices. Source: Santander estimates.
Figure 7. America Movil – Sensitivity of Target Price to Different Discount and Terminal Growth Rates
Growth in Perpetuity 1.25% 1.75% 2.25% 2.75% 3.25% 3.75% 4.25% 7.6% 69.41 73.29 77.89 83.46 90.31 98.96 110.21 8.1% 63.66 66.83 70.55 74.97 80.31 86.88 95.18 8.6% 58.69 61.32 64.37 67.93 72.17 77.29 83.60
WACC 9.1% 54.36 56.56 59.08 62.00 65.42 69.49 74.40 9.6% 50.54 52.40 54.51 56.93 59.73 63.02 66.92 10.1% 47.15 48.73 50.51 52.54 54.86 57.55 60.71 10.6% 44.12 45.48 46.99 48.70 50.65 52.88 55.46
Source: Santander estimates.
9Important disclosures/certifications are in the “Important Disclosures” section of this report. U.S. investors’ inquiries should be directed to Santander Investment Securities Inc. at (212) 583-4629/ (212) 350-3918.
RISKS • The economic environment. Although we believe that AMX’s business is relatively more
defensive than the basket of economic sectors represented in the Mexbol, the mobile industry is also exposed to and affected by macroeconomic conditions.
• Competition. Competitive forces in AMX’s markets may lead to greater downward price pressure, or costs associated with customer retention and acquisition could increase, driving profitability lower. The potential changes in competitive intensity in Mexico are, in our view, related to the impact that the addition of new capacity by competitors may have in the market (additional spectrum licensed recently and the additional fiber optics network being deployed over the infrastructure of the national electricity company CFE).
• Change in regulatory conditions. Potential changes in the regulatory framework from processes that are under way (e.g., Cofeco’s decision on mobile termination rates, and consolidation of local service areas), or uncertainty related to the conditions that will prevail in the renewal of licenses, might hurt AMX’s cash flows in ways that our estimates have not projected.
AMX and TMX: No Bargains; Introducing YE2011 Target Prices; Revising Ratings
10 Important disclosures/certifications are in the “Important Disclosures” section of this report. U.S. investors’ inquiries should be directed to Santander Investment Securities Inc. at (212) 583-4629/ (212) 350-3918.
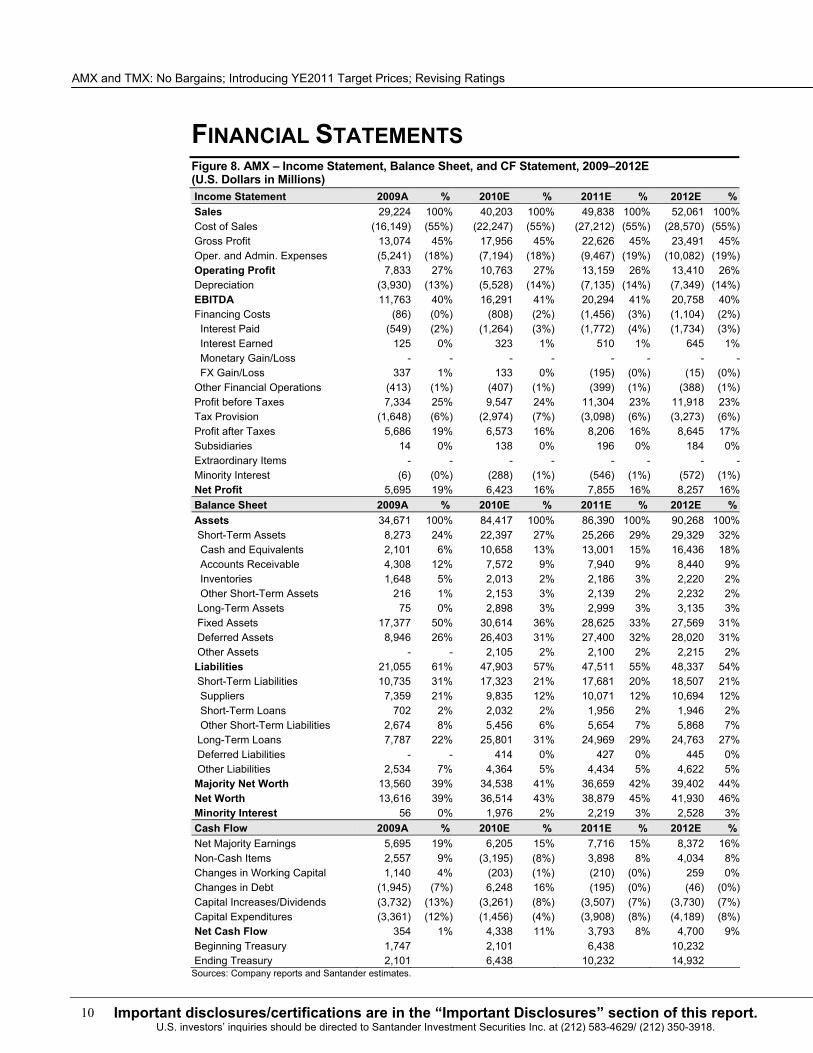
FINANCIAL STATEMENTS Figure 8. AMX – Income Statement, Balance Sheet, and CF Statement, 2009–2012E (U.S. Dollars in Millions) Income Statement 2009A % 2010E % 2011E % 2012E %Sales 29,224 100% 40,203 100% 49,838 100% 52,061 100% Cost of Sales (16,149) (55%) (22,247) (55%) (27,212) (55%) (28,570) (55%)Gross Profit 13,074 45% 17,956 45% 22,626 45% 23,491 45% Oper. and Admin. Expenses (5,241) (18%) (7,194) (18%) (9,467) (19%) (10,082) (19%)Operating Profit 7,833 27% 10,763 27% 13,159 26% 13,410 26% Depreciation (3,930) (13%) (5,528) (14%) (7,135) (14%) (7,349) (14%)EBITDA 11,763 40% 16,291 41% 20,294 41% 20,758 40% Financing Costs (86) (0%) (808) (2%) (1,456) (3%) (1,104) (2%) Interest Paid (549) (2%) (1,264) (3%) (1,772) (4%) (1,734) (3%) Interest Earned 125 0% 323 1% 510 1% 645 1% Monetary Gain/Loss - - - - - - - - FX Gain/Loss 337 1% 133 0% (195) (0%) (15) (0%)Other Financial Operations (413) (1%) (407) (1%) (399) (1%) (388) (1%)Profit before Taxes 7,334 25% 9,547 24% 11,304 23% 11,918 23% Tax Provision (1,648) (6%) (2,974) (7%) (3,098) (6%) (3,273) (6%)Profit after Taxes 5,686 19% 6,573 16% 8,206 16% 8,645 17% Subsidiaries 14 0% 138 0% 196 0% 184 0% Extraordinary Items - - - - - - - -Minority Interest (6) (0%) (288) (1%) (546) (1%) (572) (1%)Net Profit 5,695 19% 6,423 16% 7,855 16% 8,257 16% Balance Sheet 2009A % 2010E % 2011E % 2012E %Assets 34,671 100% 84,417 100% 86,390 100% 90,268 100% Short-Term Assets 8,273 24% 22,397 27% 25,266 29% 29,329 32% Cash and Equivalents 2,101 6% 10,658 13% 13,001 15% 16,436 18% Accounts Receivable 4,308 12% 7,572 9% 7,940 9% 8,440 9% Inventories 1,648 5% 2,013 2% 2,186 3% 2,220 2% Other Short-Term Assets 216 1% 2,153 3% 2,139 2% 2,232 2% Long-Term Assets 75 0% 2,898 3% 2,999 3% 3,135 3% Fixed Assets 17,377 50% 30,614 36% 28,625 33% 27,569 31% Deferred Assets 8,946 26% 26,403 31% 27,400 32% 28,020 31% Other Assets - - 2,105 2% 2,100 2% 2,215 2% Liabilities 21,055 61% 47,903 57% 47,511 55% 48,337 54% Short-Term Liabilities 10,735 31% 17,323 21% 17,681 20% 18,507 21% Suppliers 7,359 21% 9,835 12% 10,071 12% 10,694 12% Short-Term Loans 702 2% 2,032 2% 1,956 2% 1,946 2% Other Short-Term Liabilities 2,674 8% 5,456 6% 5,654 7% 5,868 7% Long-Term Loans 7,787 22% 25,801 31% 24,969 29% 24,763 27% Deferred Liabilities - - 414 0% 427 0% 445 0% Other Liabilities 2,534 7% 4,364 5% 4,434 5% 4,622 5% Majority Net Worth 13,560 39% 34,538 41% 36,659 42% 39,402 44% Net Worth 13,616 39% 36,514 43% 38,879 45% 41,930 46% Minority Interest 56 0% 1,976 2% 2,219 3% 2,528 3% Cash Flow 2009A % 2010E % 2011E % 2012E %Net Majority Earnings 5,695 19% 6,205 15% 7,716 15% 8,372 16% Non-Cash Items 2,557 9% (3,195) (8%) 3,898 8% 4,034 8% Changes in Working Capital 1,140 4% (203) (1%) (210) (0%) 259 0% Changes in Debt (1,945) (7%) 6,248 16% (195) (0%) (46) (0%)Capital Increases/Dividends (3,732) (13%) (3,261) (8%) (3,507) (7%) (3,730) (7%)Capital Expenditures (3,361) (12%) (1,456) (4%) (3,908) (8%) (4,189) (8%)Net Cash Flow 354 1% 4,338 11% 3,793 8% 4,700 9% Beginning Treasury 1,747 2,101 6,438 10,232Ending Treasury 2,101 6,438 10,232 14,932
Sources: Company reports and Santander estimates.
11Important disclosures/certifications are in the “Important Disclosures” section of this report. U.S. investors’ inquiries should be directed to Santander Investment Securities Inc. at (212) 583-4629/ (212) 350-3918.
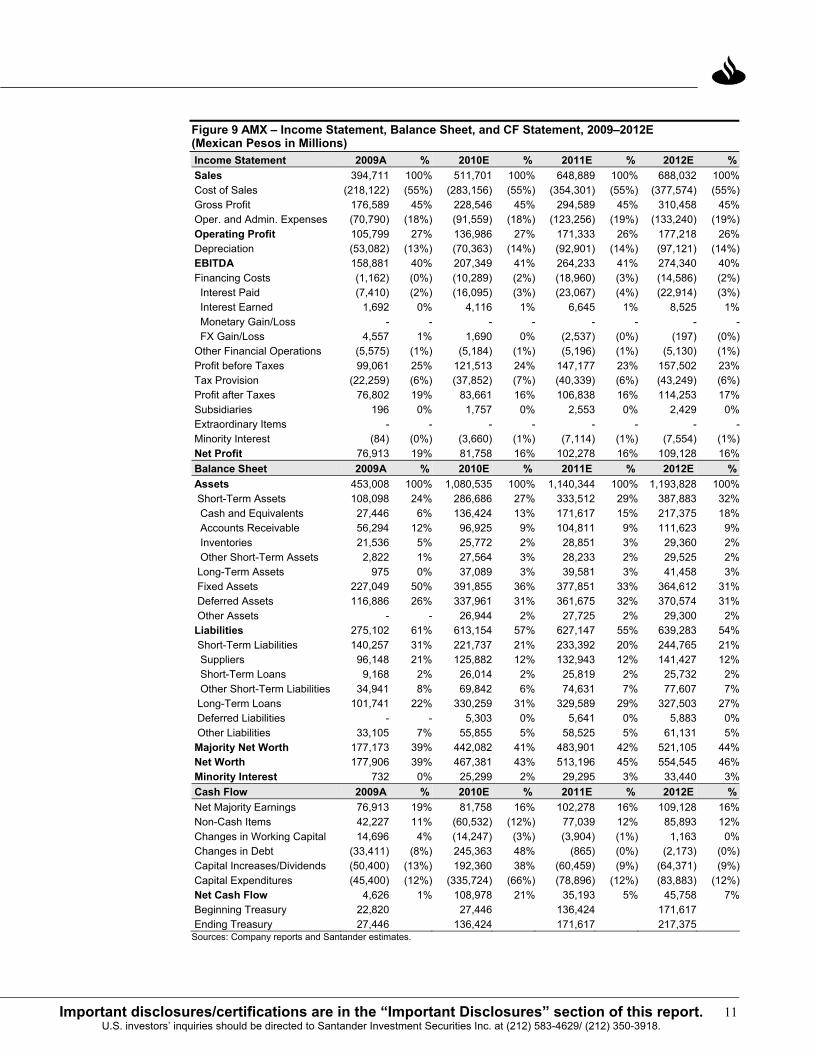
Figure 9 AMX – Income Statement, Balance Sheet, and CF Statement, 2009–2012E (Mexican Pesos in Millions) Income Statement 2009A % 2010E % 2011E % 2012E %Sales 394,711 100% 511,701 100% 648,889 100% 688,032 100% Cost of Sales (218,122) (55%) (283,156) (55%) (354,301) (55%) (377,574) (55%)Gross Profit 176,589 45% 228,546 45% 294,589 45% 310,458 45% Oper. and Admin. Expenses (70,790) (18%) (91,559) (18%) (123,256) (19%) (133,240) (19%)Operating Profit 105,799 27% 136,986 27% 171,333 26% 177,218 26% Depreciation (53,082) (13%) (70,363) (14%) (92,901) (14%) (97,121) (14%)EBITDA 158,881 40% 207,349 41% 264,233 41% 274,340 40% Financing Costs (1,162) (0%) (10,289) (2%) (18,960) (3%) (14,586) (2%) Interest Paid (7,410) (2%) (16,095) (3%) (23,067) (4%) (22,914) (3%) Interest Earned 1,692 0% 4,116 1% 6,645 1% 8,525 1% Monetary Gain/Loss - - - - - - - - FX Gain/Loss 4,557 1% 1,690 0% (2,537) (0%) (197) (0%)Other Financial Operations (5,575) (1%) (5,184) (1%) (5,196) (1%) (5,130) (1%)Profit before Taxes 99,061 25% 121,513 24% 147,177 23% 157,502 23% Tax Provision (22,259) (6%) (37,852) (7%) (40,339) (6%) (43,249) (6%)Profit after Taxes 76,802 19% 83,661 16% 106,838 16% 114,253 17% Subsidiaries 196 0% 1,757 0% 2,553 0% 2,429 0% Extraordinary Items - - - - - - - -Minority Interest (84) (0%) (3,660) (1%) (7,114) (1%) (7,554) (1%)Net Profit 76,913 19% 81,758 16% 102,278 16% 109,128 16% Balance Sheet 2009A % 2010E % 2011E % 2012E %Assets 453,008 100% 1,080,535 100% 1,140,344 100% 1,193,828 100% Short-Term Assets 108,098 24% 286,686 27% 333,512 29% 387,883 32% Cash and Equivalents 27,446 6% 136,424 13% 171,617 15% 217,375 18% Accounts Receivable 56,294 12% 96,925 9% 104,811 9% 111,623 9% Inventories 21,536 5% 25,772 2% 28,851 3% 29,360 2% Other Short-Term Assets 2,822 1% 27,564 3% 28,233 2% 29,525 2% Long-Term Assets 975 0% 37,089 3% 39,581 3% 41,458 3% Fixed Assets 227,049 50% 391,855 36% 377,851 33% 364,612 31% Deferred Assets 116,886 26% 337,961 31% 361,675 32% 370,574 31% Other Assets - - 26,944 2% 27,725 2% 29,300 2% Liabilities 275,102 61% 613,154 57% 627,147 55% 639,283 54% Short-Term Liabilities 140,257 31% 221,737 21% 233,392 20% 244,765 21% Suppliers 96,148 21% 125,882 12% 132,943 12% 141,427 12% Short-Term Loans 9,168 2% 26,014 2% 25,819 2% 25,732 2% Other Short-Term Liabilities 34,941 8% 69,842 6% 74,631 7% 77,607 7% Long-Term Loans 101,741 22% 330,259 31% 329,589 29% 327,503 27% Deferred Liabilities - - 5,303 0% 5,641 0% 5,883 0% Other Liabilities 33,105 7% 55,855 5% 58,525 5% 61,131 5% Majority Net Worth 177,173 39% 442,082 41% 483,901 42% 521,105 44% Net Worth 177,906 39% 467,381 43% 513,196 45% 554,545 46% Minority Interest 732 0% 25,299 2% 29,295 3% 33,440 3% Cash Flow 2009A % 2010E % 2011E % 2012E %Net Majority Earnings 76,913 19% 81,758 16% 102,278 16% 109,128 16% Non-Cash Items 42,227 11% (60,532) (12%) 77,039 12% 85,893 12% Changes in Working Capital 14,696 4% (14,247) (3%) (3,904) (1%) 1,163 0% Changes in Debt (33,411) (8%) 245,363 48% (865) (0%) (2,173) (0%)Capital Increases/Dividends (50,400) (13%) 192,360 38% (60,459) (9%) (64,371) (9%)Capital Expenditures (45,400) (12%) (335,724) (66%) (78,896) (12%) (83,883) (12%)Net Cash Flow 4,626 1% 108,978 21% 35,193 5% 45,758 7% Beginning Treasury 22,820 27,446 136,424 171,617 Ending Treasury 27,446 136,424 171,617 217,375
Sources: Company reports and Santander estimates.
AMX and TMX: No Bargains; Introducing YE2011 Target Prices; Revising Ratings
12 Important disclosures/certifications are in the “Important Disclosures” section of this report. U.S. investors’ inquiries should be directed to Santander Investment Securities Inc. at (212) 583-4629/ (212) 350-3918.
NOTES
13Important disclosures/certifications are in the “Important Disclosures” section of this report. U.S. investors’ inquiries should be directed to Santander Investment Securities Inc. at (212) 583-4629/ (212) 350-3918.
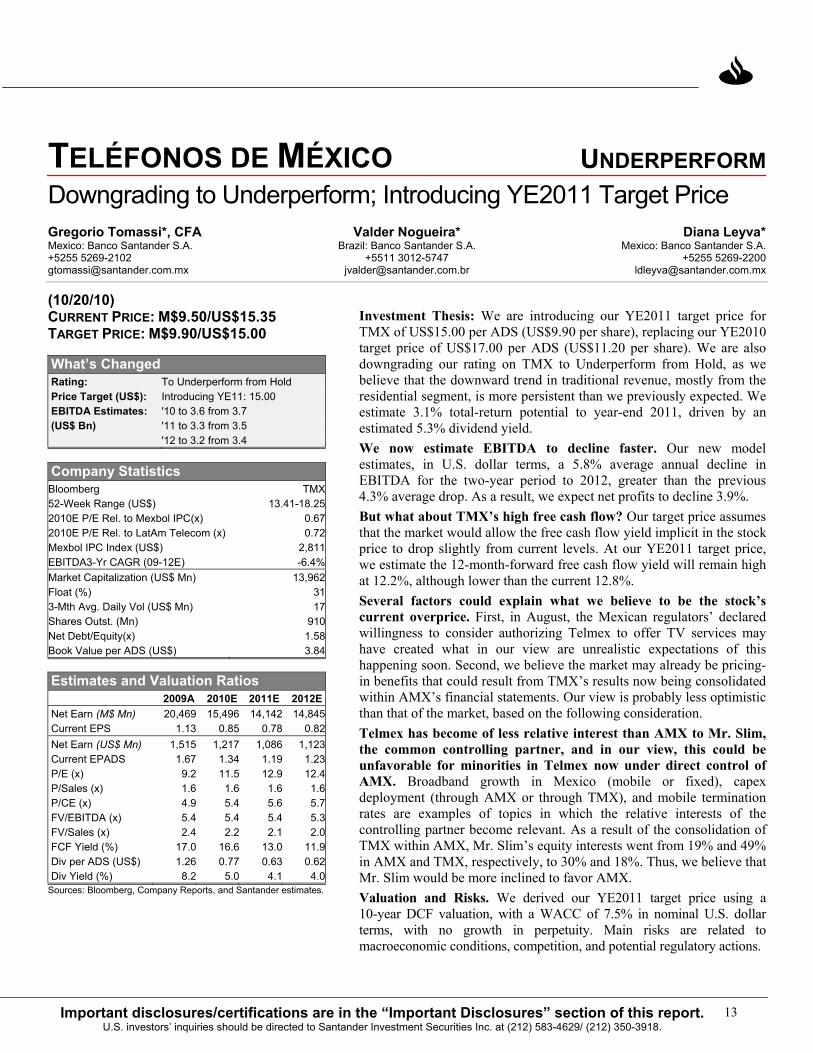
TELÉFONOS DE MÉXICO UNDERPERFORMDowngrading to Underperform; Introducing YE2011 Target Price Gregorio Tomassi*, CFA Valder Nogueira* Diana Leyva*Mexico: Banco Santander S.A. Brazil: Banco Santander S.A. Mexico: Banco Santander S.A.+5255 5269-2102 +5511 3012-5747 +5255 [email protected] [email protected] [email protected]
(10/20/10) CURRENT PRICE: M$9.50/US$15.35 TARGET PRICE: M$9.90/US$15.00
What’s Changed Rating: To Underperform from Hold Price Target (US$): Introducing YE11: 15.00 EBITDA Estimates: '10 to 3.6 from 3.7 (US$ Bn) '11 to 3.3 from 3.5 '12 to 3.2 from 3.4
Company Statistics Bloomberg TMX 52-Week Range (US$) 13.41-18.25 2010E P/E Rel. to Mexbol IPC(x) 0.67 2010E P/E Rel. to LatAm Telecom (x) 0.72Mexbol IPC Index (US$) 2,811 EBITDA3-Yr CAGR (09-12E) -6.4%Market Capitalization (US$ Mn) 13,962 Float (%) 313-Mth Avg. Daily Vol (US$ Mn) 17 Shares Outst. (Mn) 910 Net Debt/Equity(x) 1.58 Book Value per ADS (US$) 3.84
Estimates and Valuation Ratios 2009A 2010E 2011E 2012E Net Earn (M$ Mn) 20,469 15,496 14,142 14,845Current EPS 1.13 0.85 0.78 0.82Net Earn (US$ Mn) 1,515 1,217 1,086 1,123Current EPADS 1.67 1.34 1.19 1.23P/E (x) 9.2 11.5 12.9 12.4P/Sales (x) 1.6 1.6 1.6 1.6P/CE (x) 4.9 5.4 5.6 5.7FV/EBITDA (x) 5.4 5.4 5.4 5.3FV/Sales (x) 2.4 2.2 2.1 2.0FCF Yield (%) 17.0 16.6 13.0 11.9Div per ADS (US$) 1.26 0.77 0.63 0.62Div Yield (%) 8.2 5.0 4.1 4.0
Sources: Bloomberg, Company Reports, and Santander estimates.
Investment Thesis: We are introducing our YE2011 target price for TMX of US$15.00 per ADS (US$9.90 per share), replacing our YE2010 target price of US$17.00 per ADS (US$11.20 per share). We are also downgrading our rating on TMX to Underperform from Hold, as we believe that the downward trend in traditional revenue, mostly from the residential segment, is more persistent than we previously expected. We estimate 3.1% total-return potential to year-end 2011, driven by an estimated 5.3% dividend yield. We now estimate EBITDA to decline faster. Our new model estimates, in U.S. dollar terms, a 5.8% average annual decline in EBITDA for the two-year period to 2012, greater than the previous 4.3% average drop. As a result, we expect net profits to decline 3.9%. But what about TMX’s high free cash flow? Our target price assumes that the market would allow the free cash flow yield implicit in the stock price to drop slightly from current levels. At our YE2011 target price, we estimate the 12-month-forward free cash flow yield will remain high at 12.2%, although lower than the current 12.8%. Several factors could explain what we believe to be the stock’s current overprice. First, in August, the Mexican regulators’ declared willingness to consider authorizing Telmex to offer TV services may have created what in our view are unrealistic expectations of this happening soon. Second, we believe the market may already be pricing-in benefits that could result from TMX’s results now being consolidated within AMX’s financial statements. Our view is probably less optimistic than that of the market, based on the following consideration. Telmex has become of less relative interest than AMX to Mr. Slim, the common controlling partner, and in our view, this could be unfavorable for minorities in Telmex now under direct control of AMX. Broadband growth in Mexico (mobile or fixed), capex deployment (through AMX or through TMX), and mobile termination rates are examples of topics in which the relative interests of the controlling partner become relevant. As a result of the consolidation of TMX within AMX, Mr. Slim’s equity interests went from 19% and 49% in AMX and TMX, respectively, to 30% and 18%. Thus, we believe that Mr. Slim would be more inclined to favor AMX. Valuation and Risks. We derived our YE2011 target price using a 10-year DCF valuation, with a WACC of 7.5% in nominal U.S. dollar terms, with no growth in perpetuity. Main risks are related to macroeconomic conditions, competition, and potential regulatory actions.

AMX and TMX: No Bargains; Introducing YE2011 Target Prices; Revising Ratings
14 Important disclosures/certifications are in the “Important Disclosures” section of this report. U.S. investors’ inquiries should be directed to Santander Investment Securities Inc. at (212) 583-4629/ (212) 350-3918.
Teléfonos de México (Telmex or TMX) is Mexico’s largest fixed-service telecommunications provider, with 15.9 million lines in service and 6.5 million broadband subscribers as of December 2009. In 2009, the company reported sales of US$8.8 billion, EBITDA of US$3.9 billion (EBITDA margin of 43.9%), and net debt of US$6.8 billion. The largest shareholders as of January 15, 2010, were Carso Global Telecom, a holding company controlled by the Slim family, with 59.4% (71.6% of voting shares), and AT&T International, with a 9.9% stake (21.1% of voting shares).
NEW ESTIMATES Following 1H10 results and what we believe is a slower-than-expected recovery in revenue streams mainly from traditional services (local and long distance telephony) offered to residential segments, we have revised our estimates. Average annual decline rates for the two-year period to 2012, in U.S. dollar terms, are now 2.1% in revenue, 5.8% in EBITDA, and 3.9% in net profits.
Figure 10. Telefonos de Mexico – Estimate Revisions, 2010E–2012E 2010E 2011E 2012E Previous Current Change Previous Current Change Previous Current Change
Lines and subscribers (in thousands) Lines in service 15,321 15,509 1% 14,871 15,202 2% 14,534 14,973 3% Net adds (561) (373) -33% (449) (306) -32% (337) (230) -32%Broadband subs 7,541 7,459 -1% 8,477 8,057 -5% 8,852 8,460 -4% Net adds 1,017 935 -8% 935 598 -36% 375 402 7%Revenue breakdown (Millions of M$) Local service 42,504 40,791 -4% 40,742 39,625 -3% 39,306 38,197 -3% Long distance 19,269 17,522 -9% 18,646 16,785 -10% 18,100 16,080 -11% Domestic 12,893 12,228 -5% 12,566 11,949 -5% 12,319 11,643 -5% International 6,376 5,294 -17% 6,080 4,836 -20% 5,782 4,437 -23% Interconnection 14,852 15,242 3% 13,365 14,350 7% 12,205 13,514 11% Corporate 17,114 17,201 1% 19,346 18,921 -2% 21,347 20,541 -4% Internet access 16,856 17,183 2% 17,779 17,922 1% 19,683 19,571 -1% Other 5,742 6,439 12% 5,704 6,101 7% 5,457 5,963 9%Financials (Millions of M$) Sales 116,338 114,378 -2% 115,583 113,703 -2% 116,098 113,867 -2%EBITDA 48,830 45,612 -7% 47,264 43,114 -9% 47,722 41,997 -12%EBITDA margin 42.0% 39.9% -209 bp 40.9% 37.9% -297 bp 41.1% 36.9% -422 bpOp. profit 31,070 27,898 -10% 29,664 24,872 -16% 30,767 24,481 -20%Net income 17,903 15,496 -13% 17,294 14,142 -18% 18,413 14,845 -19%Financials (Millions of US$a) Sales 8,907 8,986 1% 8,637 8,733 1% 8,329 8,616 3%EBITDA 3,738 3,584 -4% 3,532 3,311 -6% 3,424 3,178 -7%EBITDA margin 42.0% 39.9% -209 bp 40.9% 37.9% -297 bp 41.1% 36.9% -422 bpOp. profit 2,379 2,192 -8% 2,217 1,910 -14% 2,207 1,852 -16%Net income 1,371 1,217 -11% 1,292 1,086 -16% 1,321 1,123 -15%EPADS 1.56 1.34 -14% 1.51 1.19 -21% 1.58 1.23 -22%Capex 746 766 3% 733 761 4% 711 766 8%FX EOP (M$/US$) 13.20 12.80 -3% 13.60 13.20 -3% 14.30 13.23 -8%FX Avg. (M$/US$) 13.06 12.73 -3% 13.38 13.02 -3% 13.94 13.22 -5%
aExcept per ADS data. Sources: Company reports and Santander estimates.
Our new model does not include actual 3Q10 figures released on October 25 by Telmex. However, including them would not represent a material change in our estimates or recommendations. EBITDA and net income in 3Q10 both came in 3% over our model estimates for the quarter, but capex guidance of around M$11.0 billion came in over 12% higher than we estimated.
15Important disclosures/certifications are in the “Important Disclosures” section of this report. U.S. investors’ inquiries should be directed to Santander Investment Securities Inc. at (212) 583-4629/ (212) 350-3918.
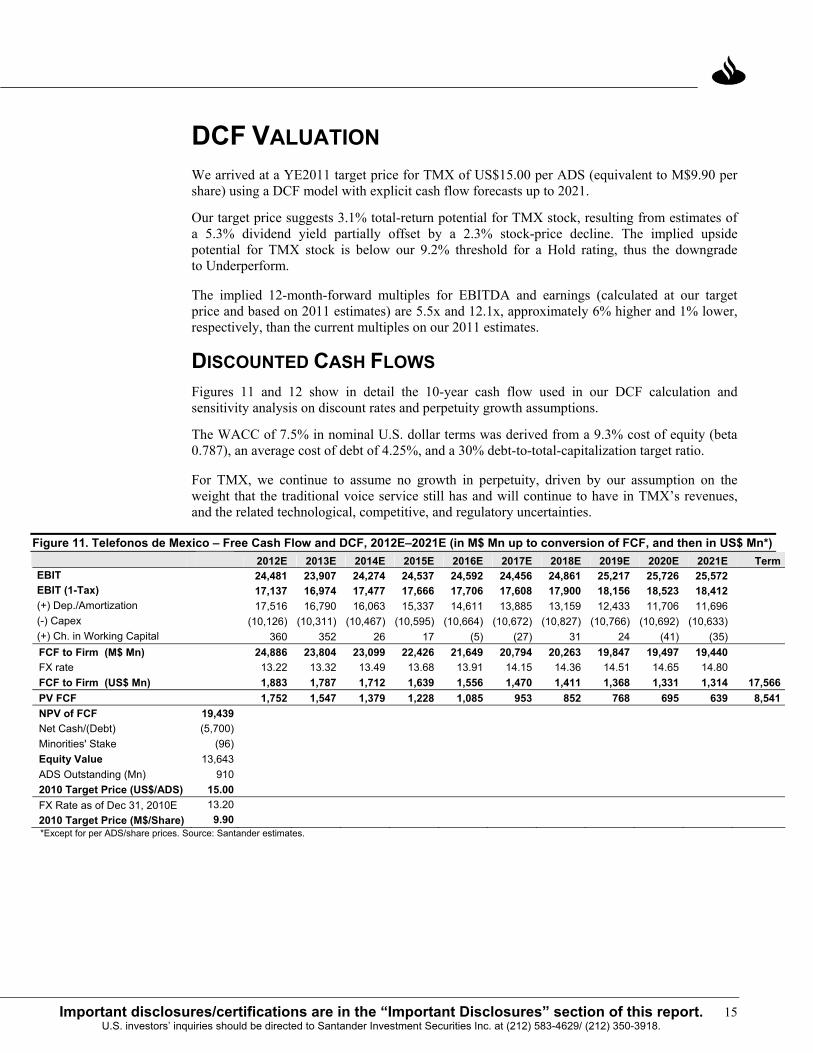
DCF VALUATION We arrived at a YE2011 target price for TMX of US$15.00 per ADS (equivalent to M$9.90 per share) using a DCF model with explicit cash flow forecasts up to 2021.
Our target price suggests 3.1% total-return potential for TMX stock, resulting from estimates of a 5.3% dividend yield partially offset by a 2.3% stock-price decline. The implied upside potential for TMX stock is below our 9.2% threshold for a Hold rating, thus the downgrade to Underperform.
The implied 12-month-forward multiples for EBITDA and earnings (calculated at our target price and based on 2011 estimates) are 5.5x and 12.1x, approximately 6% higher and 1% lower, respectively, than the current multiples on our 2011 estimates.
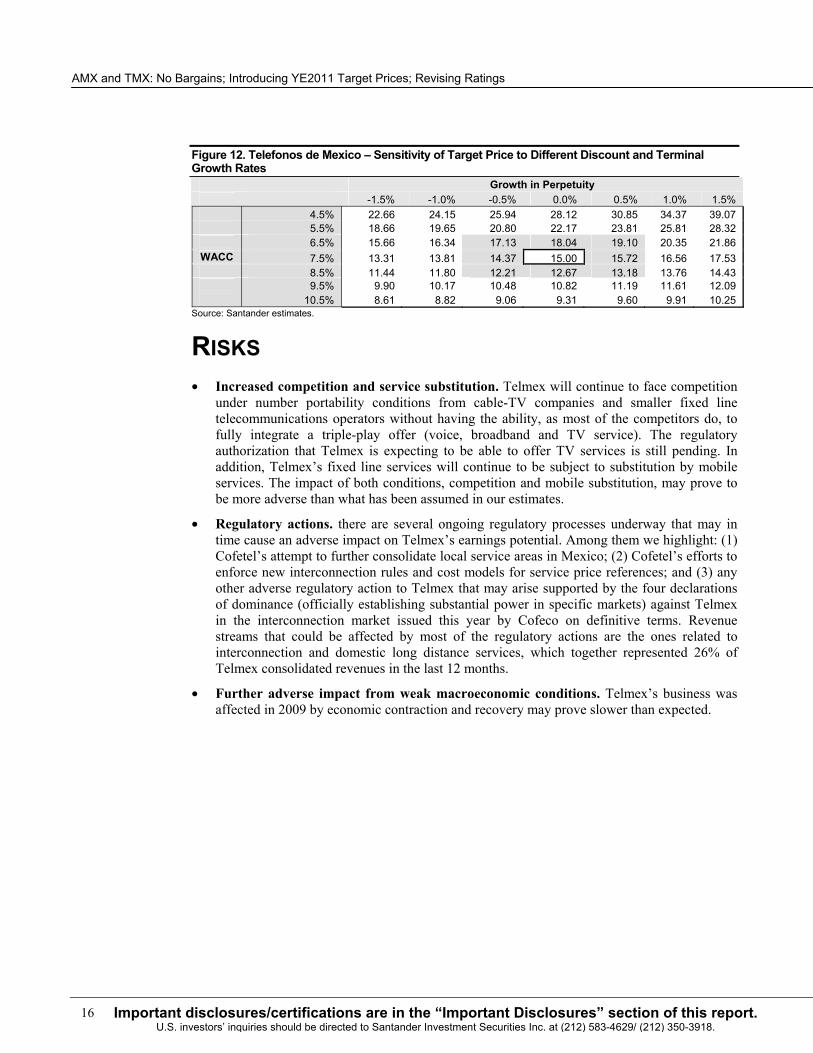
DISCOUNTED CASH FLOWS Figures 11 and 12 show in detail the 10-year cash flow used in our DCF calculation and sensitivity analysis on discount rates and perpetuity growth assumptions.
The WACC of 7.5% in nominal U.S. dollar terms was derived from a 9.3% cost of equity (beta 0.787), an average cost of debt of 4.25%, and a 30% debt-to-total-capitalization target ratio.
For TMX, we continue to assume no growth in perpetuity, driven by our assumption on the weight that the traditional voice service still has and will continue to have in TMX’s revenues, and the related technological, competitive, and regulatory uncertainties.
Figure 11. Telefonos de Mexico – Free Cash Flow and DCF, 2012E–2021E (in M$ Mn up to conversion of FCF, and then in US$ Mn*) 2012E 2013E 2014E 2015E 2016E 2017E 2018E 2019E 2020E 2021E Term
EBIT 24,481 23,907 24,274 24,537 24,592 24,456 24,861 25,217 25,726 25,572EBIT (1-Tax) 17,137 16,974 17,477 17,666 17,706 17,608 17,900 18,156 18,523 18,412(+) Dep./Amortization 17,516 16,790 16,063 15,337 14,611 13,885 13,159 12,433 11,706 11,696(-) Capex (10,126) (10,311) (10,467) (10,595) (10,664) (10,672) (10,827) (10,766) (10,692) (10,633)(+) Ch. in Working Capital 360 352 26 17 (5) (27) 31 24 (41) (35)FCF to Firm (M$ Mn) 24,886 23,804 23,099 22,426 21,649 20,794 20,263 19,847 19,497 19,440FX rate 13.22 13.32 13.49 13.68 13.91 14.15 14.36 14.51 14.65 14.80FCF to Firm (US$ Mn) 1,883 1,787 1,712 1,639 1,556 1,470 1,411 1,368 1,331 1,314 17,566PV FCF 1,752 1,547 1,379 1,228 1,085 953 852 768 695 639 8,541NPV of FCF 19,439 Net Cash/(Debt) (5,700) Minorities' Stake (96) Equity Value 13,643 ADS Outstanding (Mn) 910 2010 Target Price (US$/ADS) 15.00 FX Rate as of Dec 31, 2010E 13.20 2010 Target Price (M$/Share) 9.90 *Except for per ADS/share prices. Source: Santander estimates.
AMX and TMX: No Bargains; Introducing YE2011 Target Prices; Revising Ratings
16 Important disclosures/certifications are in the “Important Disclosures” section of this report. U.S. investors’ inquiries should be directed to Santander Investment Securities Inc. at (212) 583-4629/ (212) 350-3918.
Figure 12. Telefonos de Mexico – Sensitivity of Target Price to Different Discount and Terminal Growth Rates
Growth in Perpetuity -1.5% -1.0% -0.5% 0.0% 0.5% 1.0% 1.5% 4.5% 22.66 24.15 25.94 28.12 30.85 34.37 39.07 5.5% 18.66 19.65 20.80 22.17 23.81 25.81 28.32 6.5% 15.66 16.34 17.13 18.04 19.10 20.35 21.86
WACC 7.5% 13.31 13.81 14.37 15.00 15.72 16.56 17.53 8.5% 11.44 11.80 12.21 12.67 13.18 13.76 14.43 9.5% 9.90 10.17 10.48 10.82 11.19 11.61 12.09 10.5% 8.61 8.82 9.06 9.31 9.60 9.91 10.25
Source: Santander estimates.
RISKS • Increased competition and service substitution. Telmex will continue to face competition
under number portability conditions from cable-TV companies and smaller fixed line telecommunications operators without having the ability, as most of the competitors do, to fully integrate a triple-play offer (voice, broadband and TV service). The regulatory authorization that Telmex is expecting to be able to offer TV services is still pending. In addition, Telmex’s fixed line services will continue to be subject to substitution by mobile services. The impact of both conditions, competition and mobile substitution, may prove to be more adverse than what has been assumed in our estimates.
• Regulatory actions. there are several ongoing regulatory processes underway that may in time cause an adverse impact on Telmex’s earnings potential. Among them we highlight: (1) Cofetel’s attempt to further consolidate local service areas in Mexico; (2) Cofetel’s efforts to enforce new interconnection rules and cost models for service price references; and (3) any other adverse regulatory action to Telmex that may arise supported by the four declarations of dominance (officially establishing substantial power in specific markets) against Telmex in the interconnection market issued this year by Cofeco on definitive terms. Revenue streams that could be affected by most of the regulatory actions are the ones related to interconnection and domestic long distance services, which together represented 26% of Telmex consolidated revenues in the last 12 months.
• Further adverse impact from weak macroeconomic conditions. Telmex’s business was affected in 2009 by economic contraction and recovery may prove slower than expected.

17Important disclosures/certifications are in the “Important Disclosures” section of this report. U.S. investors’ inquiries should be directed to Santander Investment Securities Inc. at (212) 583-4629/ (212) 350-3918.
FINANCIAL STATEMENTS Figure 13. Telefonos de Mexico – Income Statement, Balance Sheet, and CF Statement, 2009–2012E (U.S. Dollars in Millions) Income Statement 2009A % 2010E % 2011E % 2012E %Sales 8,818 100% 8,986 100% 8,733 100% 8,616 100% Cost of Sales (4,731) (54%) (5,001) (56%) (4,966) (57%) (4,962) (58%)Gross Profit 4,087 46% 3,985 44% 3,767 43% 3,654 42% Oper. and Admin. Expenses (1,543) (17%) (1,794) (20%) (1,857) (21%) (1,802) (21%)Operating Profit 2,544 29% 2,192 24% 1,910 22% 1,852 22% Depreciation (1,329) (15%) (1,392) (15%) (1,401) (16%) (1,325) (15%)EBITDA 3,873 44% 3,584 40% 3,311 38% 3,178 37% Financing Costs (319) (4%) (386) (4%) (294) (3%) (181) (2%) Interest Paid (453) (5%) (463) (5%) (372) (4%) (346) (4%) Interest Earned 53 1% 46 1% 84 1% 166 2% Monetary Gain/Loss - - - - - - - - FX Gain/Loss 81 1% 30 0% (5) (0%) (0) (0%)Other Financial Operations (100) (1%) (39) (0%) (47) (1%) (46) (1%)Profit before Taxes 2,125 24% 1,766 20% 1,569 18% 1,626 19% Tax Provision (628) (7%) (562) (6%) (497) (6%) (515) (6%)Profit after Taxes 1,497 17% 1,204 13% 1,072 12% 1,111 13% Subsidiaries 19 0% 13 0% 14 0% 14 0% Extraordinary Items - - - - - - - -Minority Interest (0) (0%) (0) (0%) (0) (0%) (1) (0%)Net Profit 1,515 17% 1,217 14% 1,086 12% 1,123 13% Balance Sheet 2009A % 2010E % 2011E % 2012E %Assets 13,650 100% 13,082 100% 12,904 100% 13,325 100% Short-Term Assets 3,967 29% 3,894 30% 4,593 36% 5,534 42% Cash and Equivalents 1,101 8% 910 7% 1,773 14% 2,715 20% Accounts Receivable 1,248 9% 1,385 11% 1,291 10% 1,290 10% Inventories 118 1% 116 1% 108 1% 108 1% Other Short-Term Assets 1,501 11% 1,483 11% 1,422 11% 1,421 11% Long-Term Assets 136 1% 148 1% 143 1% 148 1% Fixed Assets 7,983 58% 7,559 58% 6,726 52% 6,154 46% Deferred Assets 181 1% 203 2% 197 2% 197 1% Other Assets 1,384 10% 1,278 10% 1,245 10% 1,291 10% Liabilities 10,718 79% 9,512 73% 8,934 69% 8,801 66% Short-Term Liabilities 2,854 21% 2,065 16% 2,030 16% 2,049 15% Suppliers 1,172 9% 1,619 12% 1,612 12% 1,638 12% Short-Term Loans 1,513 11% 278 2% 255 2% 248 2% Other Short-Term Liabilities 169 1% 167 1% 164 1% 164 1% Long-Term Loans 6,360 47% 5,941 45% 5,445 42% 5,294 40% Deferred Liabilities 36 0% 42 0% 41 0% 41 0% Other Liabilities 1,467 11% 1,464 11% 1,417 11% 1,417 11% Majority Net Worth 2,930 21% 3,545 27% 3,945 31% 4,498 34% Net Worth 2,933 21% 3,570 27% 3,970 31% 4,523 34% Minority Interest 3 0% 25 0% 25 0% 26 0% Cash Flow 2009A % 2010E % 2011E % 2012E %Net Majority Earnings 1,515 17% 1,217 14% 1,086 12% 1,123 13% Non-Cash Items 1,305 15% 1,401 16% 1,532 18% 1,280 15% Changes in Working Capital (182) (2%) 312 3% 94 1% 27 0% Changes in Debt 134 2% (1,654) (18%) (519) (6%) (158) (2%)Capital Increases/Dividends (1,449) (16%) (701) (8%) (571) (7%) (563) (7%)Capital Expenditures (666) (8%) (766) (9%) (761) (9%) (766) (9%)Net Cash Flow 657 7% (190) (2%) 862 10% 942 11% Beginning Treasury 444 1,101 910 1,773Ending Treasury 1,101 910 1,773 2,715Sources: Company reports and Santander estimates.
AMX and TMX: No Bargains; Introducing YE2011 Target Prices; Revising Ratings
18 Important disclosures/certifications are in the “Important Disclosures” section of this report. U.S. investors’ inquiries should be directed to Santander Investment Securities Inc. at (212) 583-4629/ (212) 350-3918.
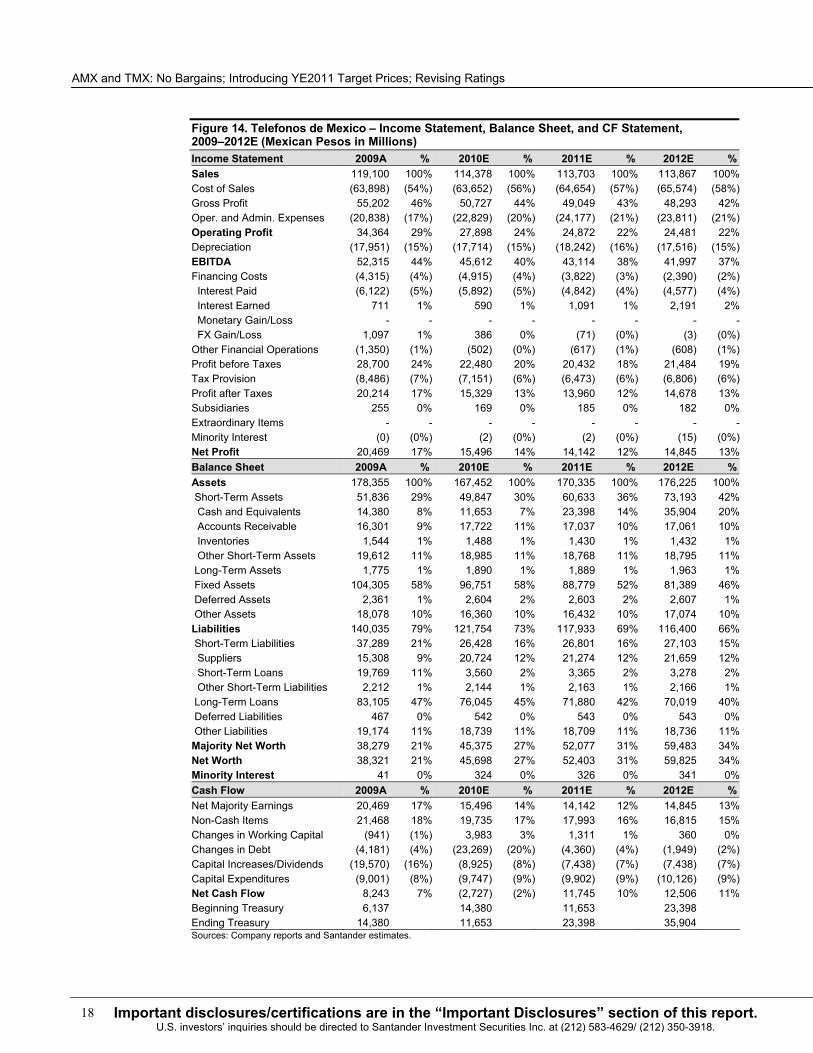
Figure 14. Telefonos de Mexico – Income Statement, Balance Sheet, and CF Statement, 2009–2012E (Mexican Pesos in Millions) Income Statement 2009A % 2010E % 2011E % 2012E %Sales 119,100 100% 114,378 100% 113,703 100% 113,867 100% Cost of Sales (63,898) (54%) (63,652) (56%) (64,654) (57%) (65,574) (58%)Gross Profit 55,202 46% 50,727 44% 49,049 43% 48,293 42% Oper. and Admin. Expenses (20,838) (17%) (22,829) (20%) (24,177) (21%) (23,811) (21%)Operating Profit 34,364 29% 27,898 24% 24,872 22% 24,481 22% Depreciation (17,951) (15%) (17,714) (15%) (18,242) (16%) (17,516) (15%)EBITDA 52,315 44% 45,612 40% 43,114 38% 41,997 37% Financing Costs (4,315) (4%) (4,915) (4%) (3,822) (3%) (2,390) (2%) Interest Paid (6,122) (5%) (5,892) (5%) (4,842) (4%) (4,577) (4%) Interest Earned 711 1% 590 1% 1,091 1% 2,191 2% Monetary Gain/Loss - - - - - - - - FX Gain/Loss 1,097 1% 386 0% (71) (0%) (3) (0%)Other Financial Operations (1,350) (1%) (502) (0%) (617) (1%) (608) (1%)Profit before Taxes 28,700 24% 22,480 20% 20,432 18% 21,484 19% Tax Provision (8,486) (7%) (7,151) (6%) (6,473) (6%) (6,806) (6%)Profit after Taxes 20,214 17% 15,329 13% 13,960 12% 14,678 13% Subsidiaries 255 0% 169 0% 185 0% 182 0% Extraordinary Items - - - - - - - -Minority Interest (0) (0%) (2) (0%) (2) (0%) (15) (0%)Net Profit 20,469 17% 15,496 14% 14,142 12% 14,845 13% Balance Sheet 2009A % 2010E % 2011E % 2012E %Assets 178,355 100% 167,452 100% 170,335 100% 176,225 100% Short-Term Assets 51,836 29% 49,847 30% 60,633 36% 73,193 42% Cash and Equivalents 14,380 8% 11,653 7% 23,398 14% 35,904 20% Accounts Receivable 16,301 9% 17,722 11% 17,037 10% 17,061 10% Inventories 1,544 1% 1,488 1% 1,430 1% 1,432 1% Other Short-Term Assets 19,612 11% 18,985 11% 18,768 11% 18,795 11% Long-Term Assets 1,775 1% 1,890 1% 1,889 1% 1,963 1% Fixed Assets 104,305 58% 96,751 58% 88,779 52% 81,389 46% Deferred Assets 2,361 1% 2,604 2% 2,603 2% 2,607 1% Other Assets 18,078 10% 16,360 10% 16,432 10% 17,074 10% Liabilities 140,035 79% 121,754 73% 117,933 69% 116,400 66% Short-Term Liabilities 37,289 21% 26,428 16% 26,801 16% 27,103 15% Suppliers 15,308 9% 20,724 12% 21,274 12% 21,659 12% Short-Term Loans 19,769 11% 3,560 2% 3,365 2% 3,278 2% Other Short-Term Liabilities 2,212 1% 2,144 1% 2,163 1% 2,166 1% Long-Term Loans 83,105 47% 76,045 45% 71,880 42% 70,019 40% Deferred Liabilities 467 0% 542 0% 543 0% 543 0% Other Liabilities 19,174 11% 18,739 11% 18,709 11% 18,736 11% Majority Net Worth 38,279 21% 45,375 27% 52,077 31% 59,483 34% Net Worth 38,321 21% 45,698 27% 52,403 31% 59,825 34% Minority Interest 41 0% 324 0% 326 0% 341 0% Cash Flow 2009A % 2010E % 2011E % 2012E %Net Majority Earnings 20,469 17% 15,496 14% 14,142 12% 14,845 13% Non-Cash Items 21,468 18% 19,735 17% 17,993 16% 16,815 15% Changes in Working Capital (941) (1%) 3,983 3% 1,311 1% 360 0% Changes in Debt (4,181) (4%) (23,269) (20%) (4,360) (4%) (1,949) (2%)Capital Increases/Dividends (19,570) (16%) (8,925) (8%) (7,438) (7%) (7,438) (7%)Capital Expenditures (9,001) (8%) (9,747) (9%) (9,902) (9%) (10,126) (9%)Net Cash Flow 8,243 7% (2,727) (2%) 11,745 10% 12,506 11% Beginning Treasury 6,137 14,380 11,653 23,398 Ending Treasury 14,380 11,653 23,398 35,904 Sources: Company reports and Santander estimates.
19Important disclosures/certifications are in the “Important Disclosures” section of this report. U.S. investors’ inquiries should be directed to Santander Investment Securities Inc. at (212) 583-4629/ (212) 350-3918.
VALUATION AND RISKS FOR AXTEL, MEGACABLE, AND TELEVISA
Axtel. Our YE2011 target price is based on a 10-year DCF valuation, using a WACC of 9.1% in nominal U.S. dollar terms, and 1.25% nominal growth in perpetuity. Main risks include the competitive environment, macroeconomic conditions, technology choices, and potential block sales of the relatively large equity stakes in Axtel currently held by financial investors. Megacable. Our YE2011 target price is based on a 10-year DCF valuation, using a WACC of 9.5% in nominal U.S. dollar terms and a 2.5% nominal growth in perpetuity. Main risks relate to competition, macroeconomic conditions, reduced float, and high management turnover. Televisa. Our YE2011 target price is based on a DCF model applied to a 10-year cash-flow forecast. For the DCF, we used a U.S. dollar WACC of 8.6%, and 2.5% U.S. dollar nominal growth in perpetuity. Main risks are related to macroeconomic conditions and competition in the pay-TV and telecom businesses.

AMX and TMX: No Bargains; Introducing YE2011 Target Prices; Revising Ratings
20 Important disclosures/certifications are in the “Important Disclosures” section of this report. U.S. investors’ inquiries should be directed to Santander Investment Securities Inc. at (212) 583-4629/ (212) 350-3918.
IMPORTANT DISCLOSURES America Movil – 12-Month Relative Performance (U.S. Dollars)
America Movil
IPC
80
85
90
95
100105
110
115
120
125
O-09 D-09 F-10 A-10 J-10 A-10 O-10
Sources: Bloomberg and Santander.
America Movil – Three-Year Stock Performance (U.S. Dollars)
0.0
10.0
20.0
30.0
40.0
50.0
60.0
70.0
S-07 D-07 M-08 J-08 S-08 D-08 M-09 J-09 S-09 D-09 M-10 J-10 S-10400
900
1,400
1,900
2,400
2,900
3,400
America Movil (L Axis) IPC (R Axis)
H $53.0012/8/09
B $69.009/10/08
B $76.4012/13/07
H $31.002/23/09
H $47.006/8/09
B $41.0012/1/08
B $58.005/2/10
Source: Santander.
Analyst Recommendations and Price Objectives B: Buy H: Hold UP: Underperform UR: Under Review
21Important disclosures/certifications are in the “Important Disclosures” section of this report. U.S. investors’ inquiries should be directed to Santander Investment Securities Inc. at (212) 583-4629/ (212) 350-3918.
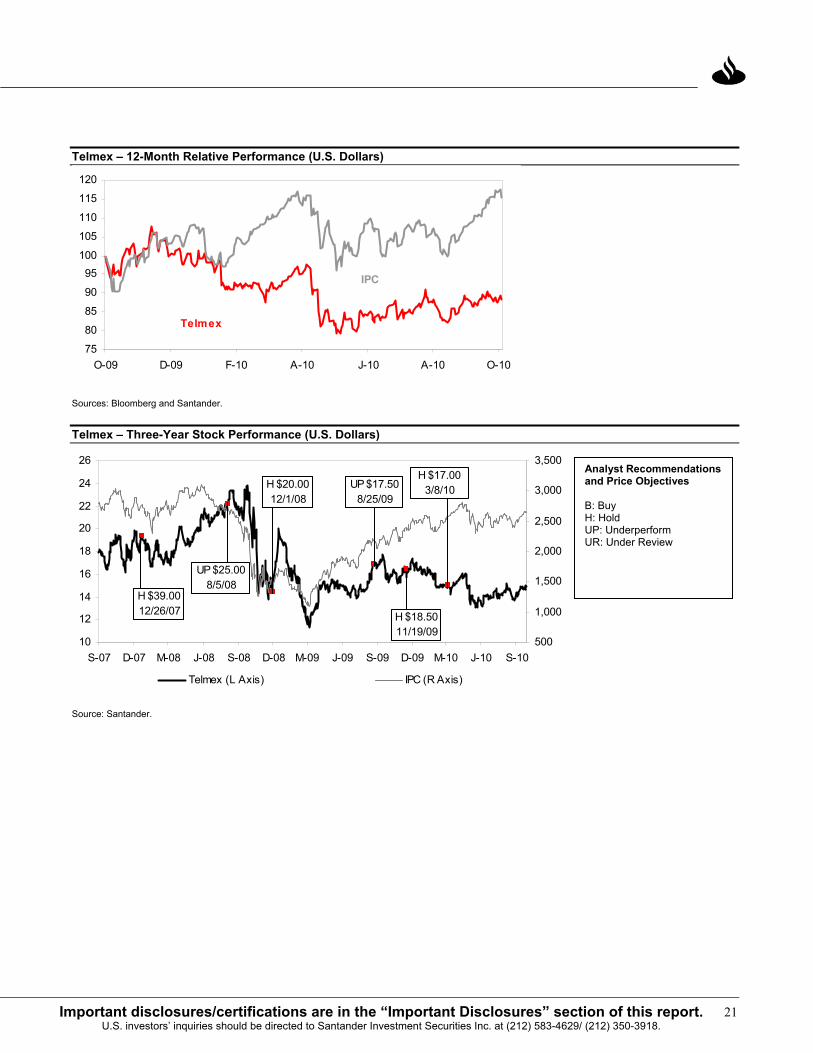
Telmex – 12-Month Relative Performance (U.S. Dollars)
Telmex
IPC
75
80
85
90
95100
105
110
115
120
O-09 D-09 F-10 A-10 J-10 A-10 O-10
Sources: Bloomberg and Santander.
Telmex – Three-Year Stock Performance (U.S. Dollars)
10
12
14
16
18
20
22
24
26
S-07 D-07 M-08 J-08 S-08 D-08 M-09 J-09 S-09 D-09 M-10 J-10 S-10500
1,000
1,500
2,000
2,500
3,000
3,500
Telmex (L Axis) IPC (R Axis)
UP $25.008/5/08
H $39.0012/26/07
H $20.0012/1/08
UP $17.508/25/09
H $18.5011/19/09
H $17.003/8/10
Source: Santander.
Analyst Recommendations and Price Objectives B: Buy H: Hold UP: Underperform UR: Under Review
AMX and TMX: No Bargains; Introducing YE2011 Target Prices; Revising Ratings
22 Important disclosures/certifications are in the “Important Disclosures” section of this report. U.S. investors’ inquiries should be directed to Santander Investment Securities Inc. at (212) 583-4629/ (212) 350-3918.
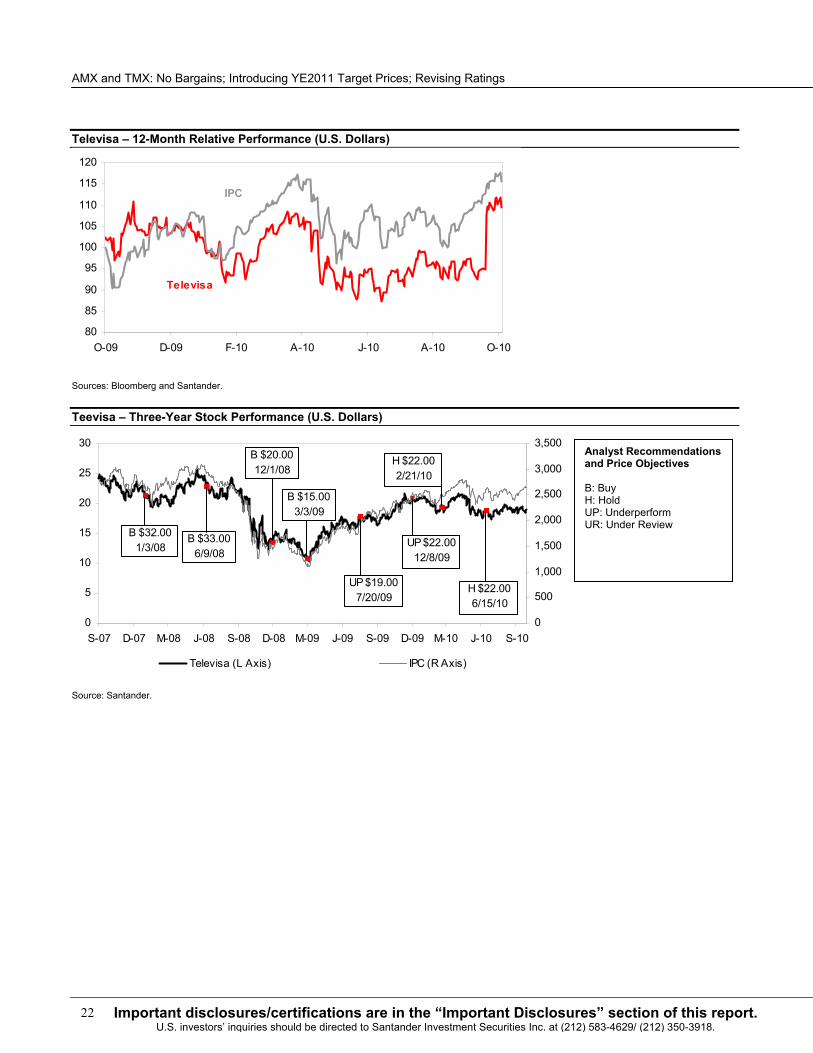
Televisa – 12-Month Relative Performance (U.S. Dollars)
Televisa
IPC
80
85
90
95
100
105
110
115
120
O-09 D-09 F-10 A-10 J-10 A-10 O-10
Sources: Bloomberg and Santander.
Teevisa – Three-Year Stock Performance (U.S. Dollars)
0
5
10
15
20
25
30
S-07 D-07 M-08 J-08 S-08 D-08 M-09 J-09 S-09 D-09 M-10 J-10 S-100
500
1,000
1,500
2,000
2,500
3,000
3,500
Televisa (L Axis) IPC (R Axis)
B $33.006/9/08
H $22.002/21/10
B $20.0012/1/08
B $32.001/3/08
B $15.003/3/09
UP $19.007/20/09
UP $22.0012/8/09
H $22.006/15/10
Source: Santander.
Analyst Recommendations and Price Objectives B: Buy H: Hold UP: Underperform UR: Under Review
23Important disclosures/certifications are in the “Important Disclosures” section of this report. U.S. investors’ inquiries should be directed to Santander Investment Securities Inc. at (212) 583-4629/ (212) 350-3918.
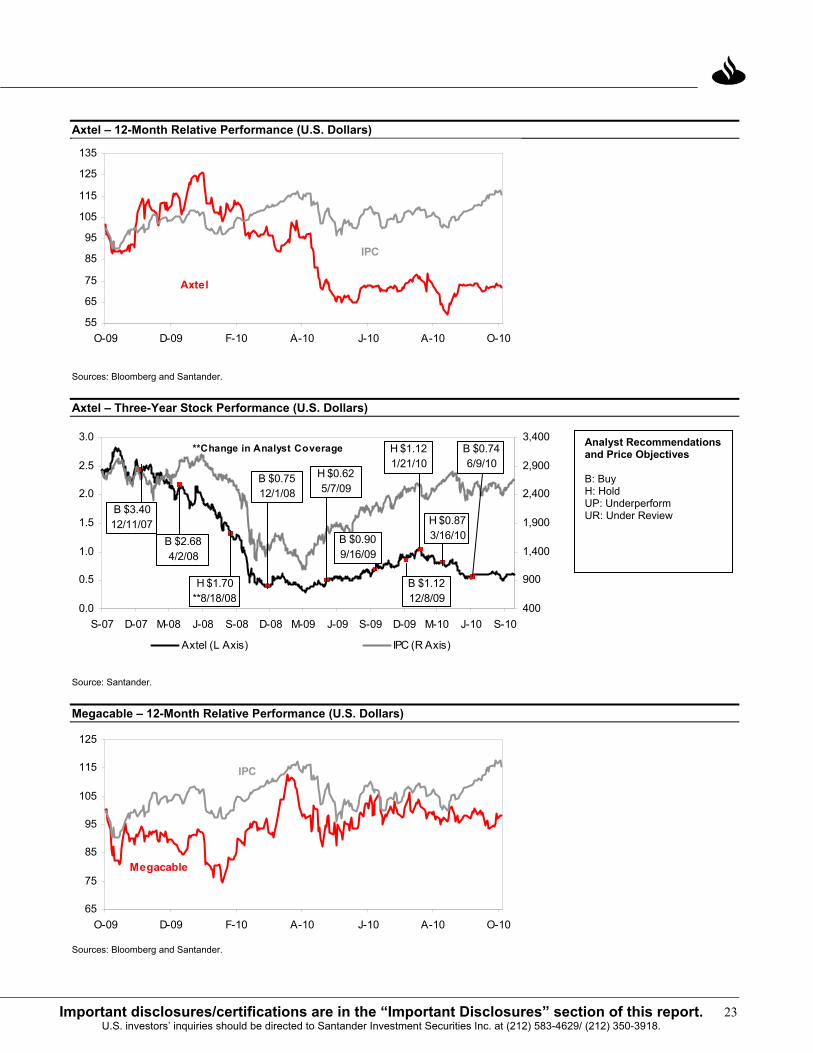
Axtel – 12-Month Relative Performance (U.S. Dollars)
Axtel
IPC
55
65
75
85
95
105
115
125
135
O-09 D-09 F-10 A-10 J-10 A-10 O-10
Sources: Bloomberg and Santander.
Axtel – Three-Year Stock Performance (U.S. Dollars)
0.0
0.5
1.0
1.5
2.0
2.5
3.0
S-07 D-07 M-08 J-08 S-08 D-08 M-09 J-09 S-09 D-09 M-10 J-10 S-10400
900
1,400
1,900
2,400
2,900
3,400
Axtel (L Axis) IPC (R Axis)
H $0.873/16/10
B $0.7512/1/08
**Change in Analyst Coverage
B $3.4012/11/07
H $1.70**8/18/08
H $0.625/7/09
B $2.684/2/08
B $0.909/16/09
B $1.1212/8/09
H $1.121/21/10
B $0.746/9/10
Source: Santander.
Megacable – 12-Month Relative Performance (U.S. Dollars)
Megacable
IPC
65
75
85
95
105
115
125
O-09 D-09 F-10 A-10 J-10 A-10 O-10
Sources: Bloomberg and Santander.
Analyst Recommendations and Price Objectives B: Buy H: Hold UP: Underperform UR: Under Review
2010
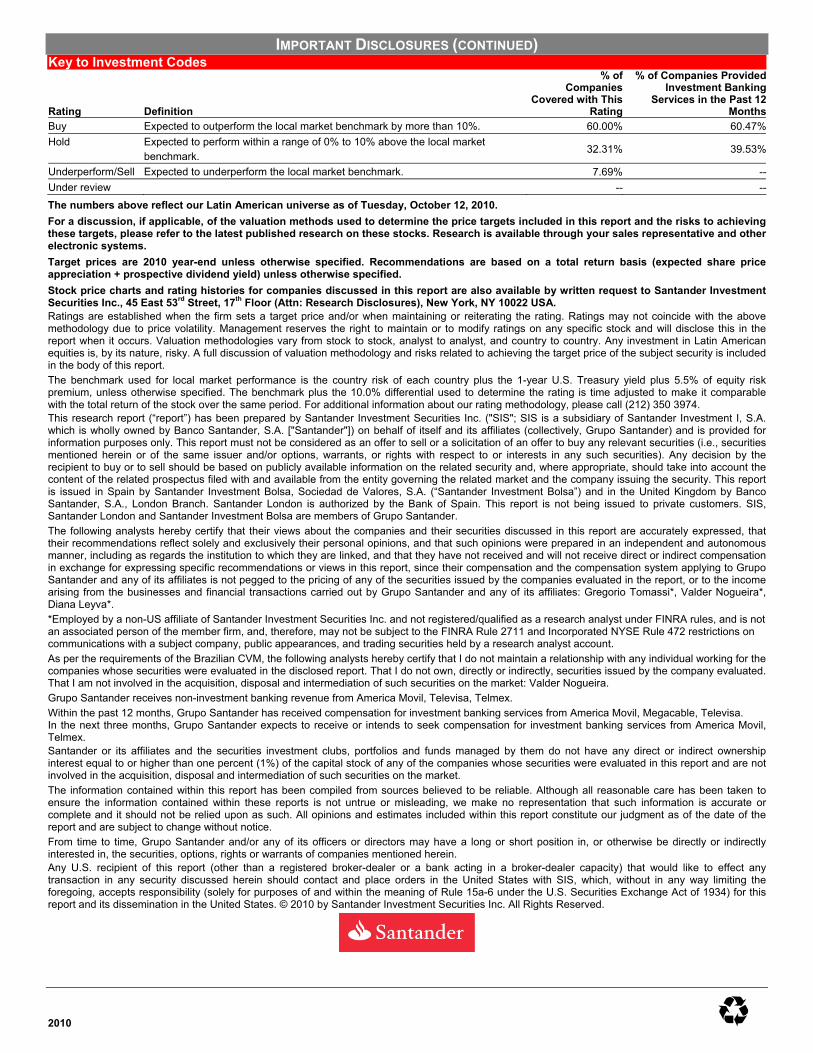
IMPORTANT DISCLOSURES (CONTINUED) Key to Investment Codes Rating
Definition
% of Companies
Covered with This Rating
% of Companies Provided Investment Banking
Services in the Past 12 Months
Buy Expected to outperform the local market benchmark by more than 10%. 60.00% 60.47%Hold Expected to perform within a range of 0% to 10% above the local market
benchmark. 32.31% 39.53%
Underperform/Sell Expected to underperform the local market benchmark. 7.69% --Under review -- --The numbers above reflect our Latin American universe as of Tuesday, October 12, 2010. For a discussion, if applicable, of the valuation methods used to determine the price targets included in this report and the risks to achieving these targets, please refer to the latest published research on these stocks. Research is available through your sales representative and other electronic systems. Target prices are 2010 year-end unless otherwise specified. Recommendations are based on a total return basis (expected share price appreciation + prospective dividend yield) unless otherwise specified. Stock price charts and rating histories for companies discussed in this report are also available by written request to Santander Investment Securities Inc., 45 East 53rd Street, 17th Floor (Attn: Research Disclosures), New York, NY 10022 USA. Ratings are established when the firm sets a target price and/or when maintaining or reiterating the rating. Ratings may not coincide with the above methodology due to price volatility. Management reserves the right to maintain or to modify ratings on any specific stock and will disclose this in the report when it occurs. Valuation methodologies vary from stock to stock, analyst to analyst, and country to country. Any investment in Latin American equities is, by its nature, risky. A full discussion of valuation methodology and risks related to achieving the target price of the subject security is included in the body of this report. The benchmark used for local market performance is the country risk of each country plus the 1-year U.S. Treasury yield plus 5.5% of equity risk premium, unless otherwise specified. The benchmark plus the 10.0% differential used to determine the rating is time adjusted to make it comparable with the total return of the stock over the same period. For additional information about our rating methodology, please call (212) 350 3974. This research report (“report”) has been prepared by Santander Investment Securities Inc. ("SIS"; SIS is a subsidiary of Santander Investment I, S.A. which is wholly owned by Banco Santander, S.A. ["Santander"]) on behalf of itself and its affiliates (collectively, Grupo Santander) and is provided for information purposes only. This report must not be considered as an offer to sell or a solicitation of an offer to buy any relevant securities (i.e., securities mentioned herein or of the same issuer and/or options, warrants, or rights with respect to or interests in any such securities). Any decision by the recipient to buy or to sell should be based on publicly available information on the related security and, where appropriate, should take into account the content of the related prospectus filed with and available from the entity governing the related market and the company issuing the security. This report is issued in Spain by Santander Investment Bolsa, Sociedad de Valores, S.A. (“Santander Investment Bolsa”) and in the United Kingdom by Banco Santander, S.A., London Branch. Santander London is authorized by the Bank of Spain. This report is not being issued to private customers. SIS, Santander London and Santander Investment Bolsa are members of Grupo Santander. The following analysts hereby certify that their views about the companies and their securities discussed in this report are accurately expressed, that their recommendations reflect solely and exclusively their personal opinions, and that such opinions were prepared in an independent and autonomous manner, including as regards the institution to which they are linked, and that they have not received and will not receive direct or indirect compensation in exchange for expressing specific recommendations or views in this report, since their compensation and the compensation system applying to Grupo Santander and any of its affiliates is not pegged to the pricing of any of the securities issued by the companies evaluated in the report, or to the income arising from the businesses and financial transactions carried out by Grupo Santander and any of its affiliates: Gregorio Tomassi*, Valder Nogueira*, Diana Leyva*. *Employed by a non-US affiliate of Santander Investment Securities Inc. and not registered/qualified as a research analyst under FINRA rules, and is not an associated person of the member firm, and, therefore, may not be subject to the FINRA Rule 2711 and Incorporated NYSE Rule 472 restrictions on communications with a subject company, public appearances, and trading securities held by a research analyst account. As per the requirements of the Brazilian CVM, the following analysts hereby certify that I do not maintain a relationship with any individual working for the companies whose securities were evaluated in the disclosed report. That I do not own, directly or indirectly, securities issued by the company evaluated. That I am not involved in the acquisition, disposal and intermediation of such securities on the market: Valder Nogueira. Grupo Santander receives non-investment banking revenue from America Movil, Televisa, Telmex. Within the past 12 months, Grupo Santander has received compensation for investment banking services from America Movil, Megacable, Televisa. In the next three months, Grupo Santander expects to receive or intends to seek compensation for investment banking services from America Movil, Telmex. Santander or its affiliates and the securities investment clubs, portfolios and funds managed by them do not have any direct or indirect ownership interest equal to or higher than one percent (1%) of the capital stock of any of the companies whose securities were evaluated in this report and are not involved in the acquisition, disposal and intermediation of such securities on the market. The information contained within this report has been compiled from sources believed to be reliable. Although all reasonable care has been taken to ensure the information contained within these reports is not untrue or misleading, we make no representation that such information is accurate or complete and it should not be relied upon as such. All opinions and estimates included within this report constitute our judgment as of the date of the report and are subject to change without notice. From time to time, Grupo Santander and/or any of its officers or directors may have a long or short position in, or otherwise be directly or indirectly interested in, the securities, options, rights or warrants of companies mentioned herein. Any U.S. recipient of this report (other than a registered broker-dealer or a bank acting in a broker-dealer capacity) that would like to effect any transaction in any security discussed herein should contact and place orders in the United States with SIS, which, without in any way limiting the foregoing, accepts responsibility (solely for purposes of and within the meaning of Rule 15a-6 under the U.S. Securities Exchange Act of 1934) for this report and its dissemination in the United States. © 2010 by Santander Investment Securities Inc. All Rights Reserved.