LATEST TRENDS IN CHILLER TECHNOLOGIES - HVACR€¦ · · 2018-01-28Latest Trends in Chiller...
33
LATEST TRENDS IN CHILLER TECHNOLOGIES By: Arif Hussain, National Product Manager
Transcript of LATEST TRENDS IN CHILLER TECHNOLOGIES - HVACR€¦ · · 2018-01-28Latest Trends in Chiller...
LATEST TRENDS IN CHILLER TECHNOLOGIES
By: Arif Hussain, National Product Manager

•Falling Film Evaporator
•Microchannel Condenser
•Current scenario
•Future Scenario
•Elimination of oil circuit
•Elimination of Gears
•Speed Control
• Improved Power factor
Power electronics operational
savings
Levitation and
magnetic bearings
Advancements in Heat exchanger Technology
Change in refrigerant
scenario
Latest Trends in Chiller Technologies
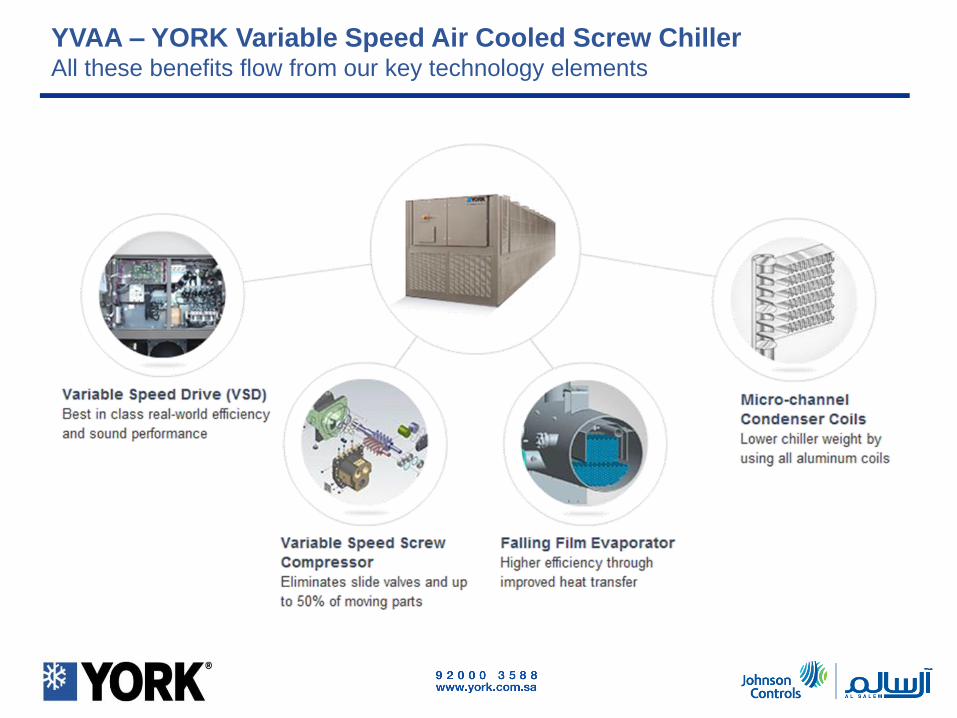
YVAA – YORK Variable Speed Air Cooled Screw ChillerAll these benefits flow from our key technology elements
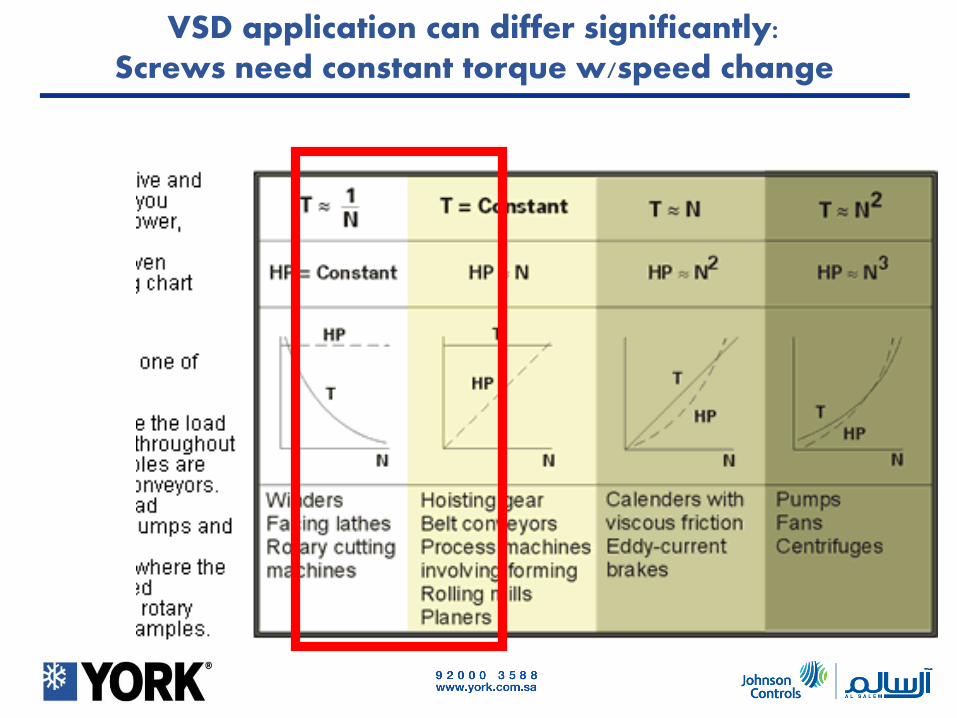
VSD application can differ significantly:Screws need constant torque w/speed change

5
There are several benefits (beyond efficiency and sound performance) that
come with using a VSD design
VSD provides Soft start with no inrush.
Starting current never exceeds full load amps.
Lowest maximum electricity
demand costs
Eliminates starting thermal
and electrical stress
No motor heating at start
allows for quicker re-start
after power failure
Stand by generator size reduced
% Full-Load
Amps
600
500
400
300
200
100
0
0 10 20 30 40 50
Time (milliseconds)
Solid State Starter
Star Delta Starter
YVAA Chiller
Electrical Benefits
Soft Starting

The VSD in chiller provides 0.95
displacement power factor as standard
Power factor is constant at all loads
Non VSD systems will have reduced
power factor at part load operation – j
or 99% of the operating hours
Many electric rate structures charge
consumer based on power factor or
offer incentives for high power factor
These are based on the average
over the billing cycle
They will be affected by part load
operation
Electrical Benefits
Power Factor
Power
Factor
1
0.9
0.8
0.7
0.6
0.5
0.4
0.3
0.2
0.1
0
20 30 40 50 60 70 80 90 100
Chiller Load (%)
YVAA
Ordinary A/C Screw Chiller

7
How can power factor affect the retrofit market?
Power factor influences the total unit current draw (amps)
Lower amps = smaller electrical wire sizes
More importantly … when replacing equipment, the ability to install
more cooling capacity without replacing electrical service
Electrical service retrofit can be a major contributor to cost
Electrical BenefitsPower Factor

8
Compressor & VSD
More than 15,000 YORK compressors operating on VSD in air-cooled chiller applications –All in YCAV & YCIV models shipped since 2004
We use a dedicated VSD platform
Eliminates slide valve and associated inefficiencies, and reduces compressor moving parts by 50% - going to a dedicated VSD design improved reliability
Competitor’s with “add on” VSD stillmust maintain unloading componentsin their compressor design
Our motor is purpose designed foroperating in a VSD system, allowing for maximum reliability and efficiency
1 Circuit per compressor, protectscompressor from oil and liquidmanagement issues
Proven Compressor & VSD

VSD application can differ significantly:Torque varies proportionately to square of speed
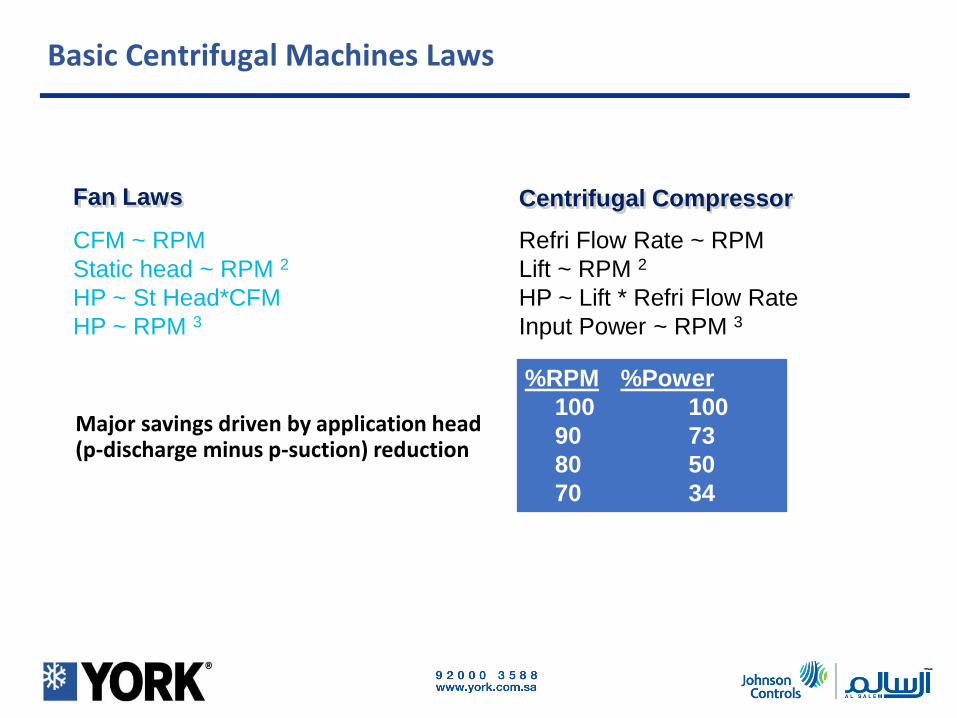
Basic Centrifugal Machines Laws
Fan Laws
CFM ~ RPM
Static head ~ RPM 2
HP ~ St Head*CFM
HP ~ RPM 3
Centrifugal Compressor
Refri Flow Rate ~ RPM
Lift ~ RPM 2
HP ~ Lift * Refri Flow Rate
Input Power ~ RPM 3
%RPM %Power
100 100
90 73
80 50
70 34
Major savings driven by application head (p-discharge minus p-suction) reduction
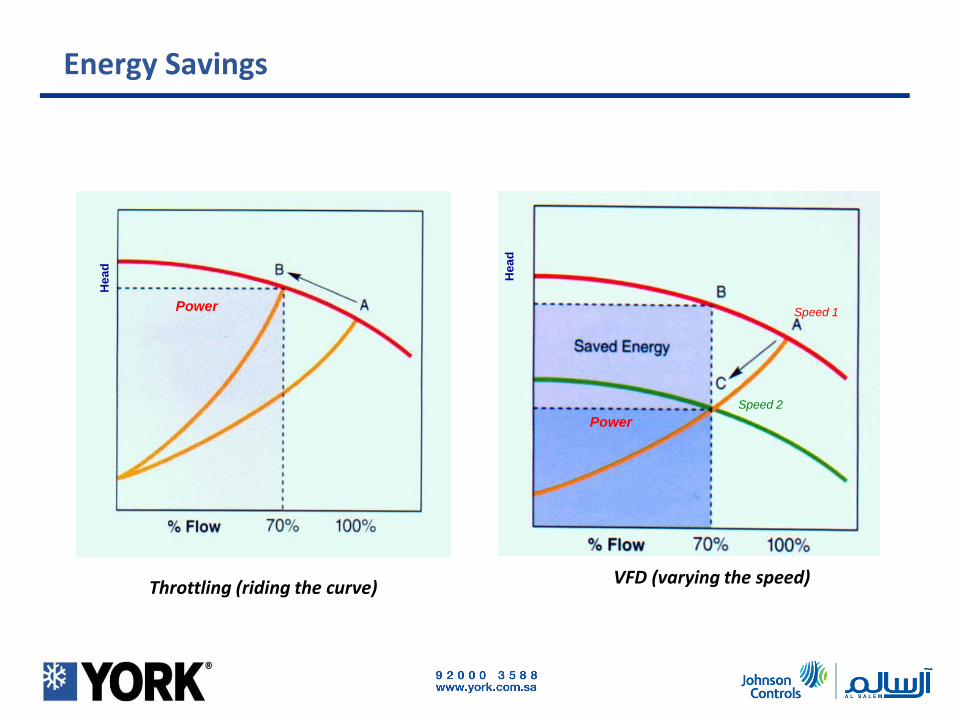
Energy SavingsH
ea
d
Power
Throttling (riding the curve)VFD (varying the speed)
Hea
d
Power
Speed 1
Speed 2

DX Evaporator:
Water outside the tubesRefrigerant inside the
tubesWater connection at sides
Flooded Evaporator:
Water inside the tubes
Refrigerant outside the
tubes
Water connection at ends
Full Load EfficiencyEvaporator

1
3
Hybrid Falling Film Evaporator:
Water is inside the tubes; Refrigerant is outside the tubes
Two bundles of water tubes
Upper bundle is covered in a film of refrigerant
Lower bundle is flooded in the refrigerant
Effi
cie
ncy HIG
H Falling Film
Flooded
LOW DX
LOW HIGHRefrigerant Qty
Full Load EfficiencyFalling Film Evaporator. Best elements of DX and Flooded.

1
4
Hybrid Falling Film Evaporator:
Water is inside the tubes; Refrigerant is outside the tubes
Two bundles of water tubes
Upper bundle is covered in a film of refrigerant
Lower bundle is flooded in the refrigerant
Full Load EfficiencyFalling Film Evaporator. Best elements of DX and Flooded.
“Patented Falling Film design provides the best combination of performance
& refrigerant charge”

Images courtesy
All Aluminum tubes, fins, and header
Higher heat transfer per volume of coil
Increased heat transfer without adding chiller length or weight
Full Load EfficiencyMicrochannel Coils. Lightweight, robust and easily cleaned.
Microchannel Coil Round Tube Plate Fin Coil Tube Cross Section
Microchannel
Round Tube

1
6
Microchannel maintains the high efficiency of your chiller over time All aluminum construction minimizes the opportunity for galvanic (dissimilar metal
corrosion)
The fins do not extend past the tubes making it easier to clean with water spray
Microchannel coils are less deep, allowing more complete dirt removal when
washing
Full Load EfficiencyMicrochannel Coils. Lightweight, robust and easily cleaned.

1
7
Full Load EfficiencyMicrochannel Coils. Lightweight, robust and easily cleaned.
Why microchannel coils?
Fins are secured and recessed
between channels
No galvanic corrosion keeps the
fins attached to the channels
Microchannel coils with R134a are
being used in automobiles for over
a decade
Photo courtesy of Danfoss
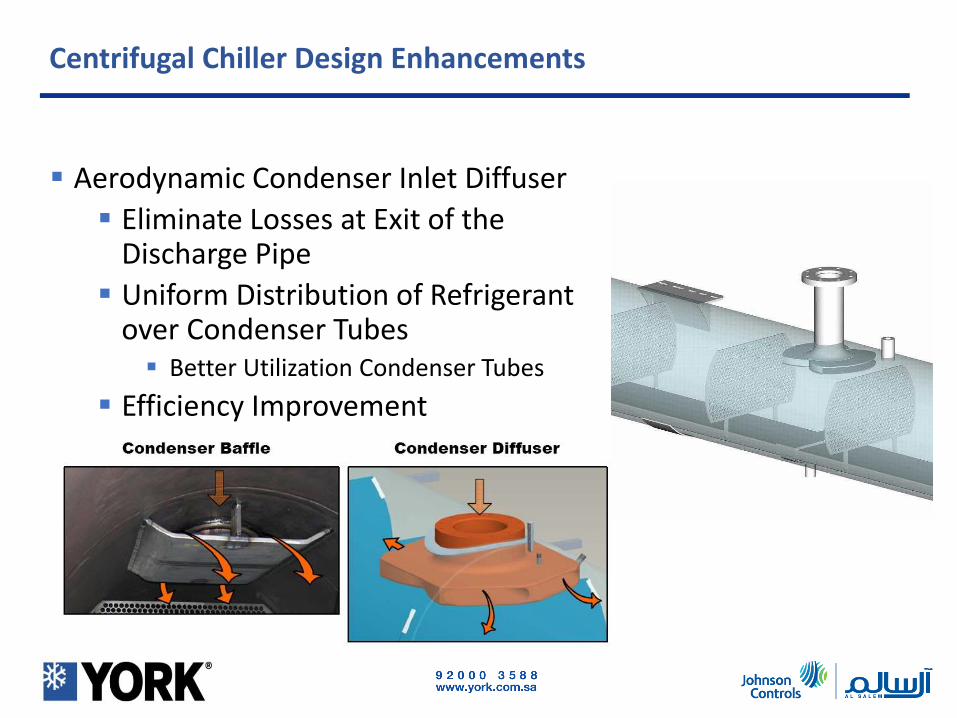
Aerodynamic Condenser Inlet Diffuser
Eliminate Losses at Exit of the Discharge Pipe
Uniform Distribution of Refrigerant over Condenser Tubes Better Utilization Condenser Tubes
Efficiency Improvement
Centrifugal Chiller Design Enhancements
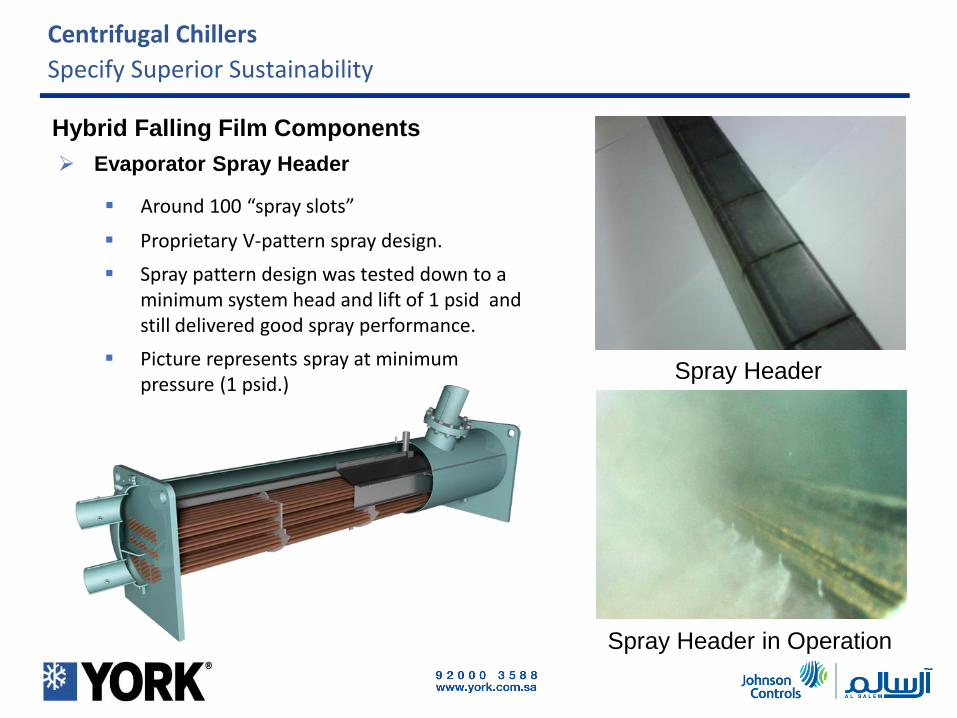
Evaporator Spray Header
Spray Header
Hybrid Falling Film Components
Around 100 “spray slots”
Spray Header in Operation
Proprietary V-pattern spray design.
Spray pattern design was tested down to a minimum system head and lift of 1 psid and still delivered good spray performance.
Picture represents spray at minimum pressure (1 psid.)
Centrifugal Chillers
Specify Superior Sustainability

90/10 Copper/ Nickel tubes for Condenser
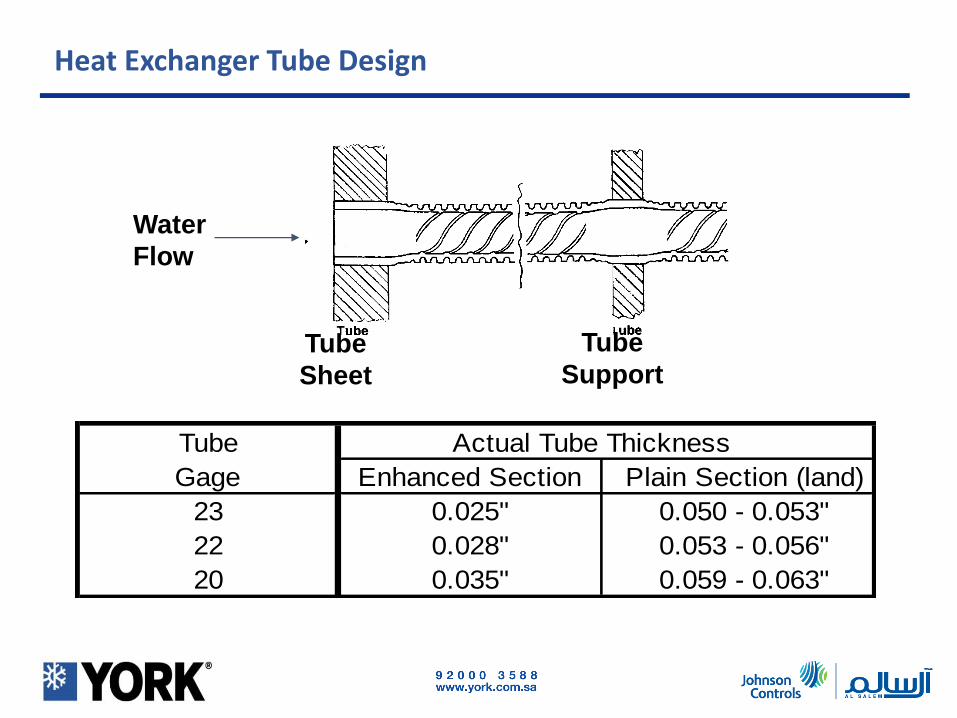
Heat Exchanger Tube Design
Tube Actual Tube Thickness
Gage Enhanced Section Plain Section (land)
23 0.025" 0.050 - 0.053"
22 0.028" 0.053 - 0.056"
20 0.035" 0.059 - 0.063"
Water
Flow
Tube
Sheet
Tube
Support

Magnetic Centrifugal Chillers
Employ Superior Efficiency
Proven aerodynamic designs from our flagship
YK product line
Permanent magnet motor with active magnetic
bearings
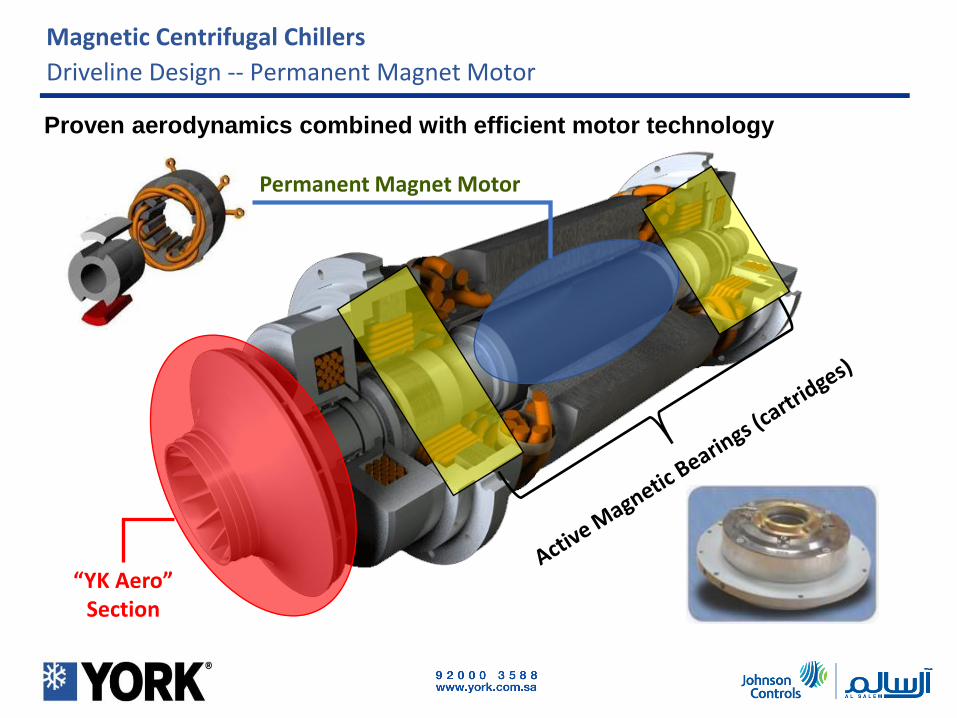
Proven aerodynamics combined with efficient motor technology
“YK Aero” Section
Permanent Magnet Motor
Magnetic Centrifugal Chillers
Driveline Design -- Permanent Magnet Motor
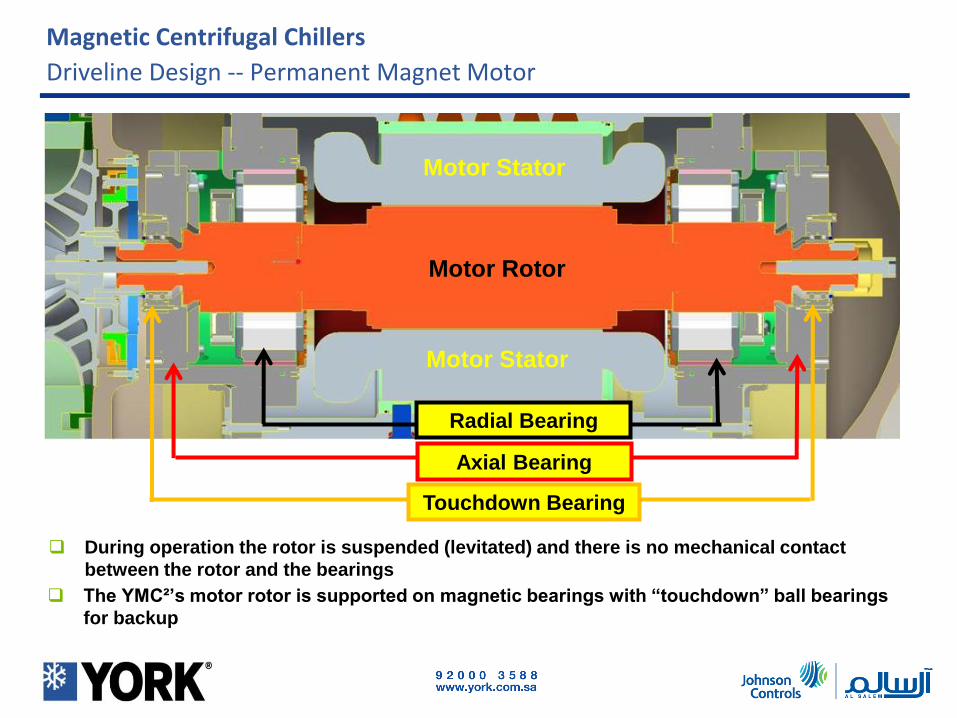
Motor Rotor
Motor Stator
Motor Stator
During operation the rotor is suspended (levitated) and there is no mechanical contact
between the rotor and the bearings
Radial Bearing
Axial Bearing
Touchdown Bearing
The YMC²’s motor rotor is supported on magnetic bearings with “touchdown” ball bearings
for backup
Magnetic Centrifugal Chillers
Driveline Design -- Permanent Magnet Motor

Magnetic Centrifugal Chillers
Acquire Superior Attenuation
73 dBA
YMC²
Telephone dial tone
80 dBA
90 dBAMost centrifugal chillers
140 dBAJet aircraft
Chainsaw
110 dBA
50 dBAAverage home
Conversational speech
60 dBA
Achieved through the use of:• Permanent magnet motor with
active magnetic bearings• OptiSound™ Control
Lowest sound levels on the market. Selections available for all tonnages at 73 dBA
or less (AHRI 575 Rating)
In Paris, parties agreed to hold global temp. rise below 2°C by the end of the century
• 195 countries agreed in Dec. 2015 to develop plans to mitigate global temperature rise – required 5 year review cycle
• Monitoring, reporting and verification of emissions
• Submitted plans include reduction of energy use in buildings and HFCs
• Verification will require energy monitoring of buildings
• $100B to be used for climate mitigation—significant portion will be towards reducing buildings energy consumption
• Potential for “carbon market” with 3rd party verified energy efficiency projects

• 196 countries agreed to phase-down targets for HFC refrigerants (all equipment, not just chillers)
• Final goal is 85% global CO2 equivalent reduction from now to 2047
• Individual countries and regions to decide on specific plans to meet targets
Oct. 2016 agreement in Rwanda to manage reduction of HFCsunder the governance of the Montreal Protocol
Not a phase-out, no impact to existing equipment, servicing or sales today

Montreal Protocol amendment agreementHFC phase down schedule
"Developing Countries - Faster Track"China, African Group, GRULAC (Latin American and
Caribbean Group*), Thailand, Malaysia, Indonesia,
Cambodia, West Asian Countries (except those in
Group 2), Turkey, Pacific Islands, Maldives, Sri
Lanka
"Developing Countries"GCC (Bahrain, Kuwait, Oman, Qatar, Saudi Arabia,
United Arab Emirates), India, Iran, Pakistan, Iraq
"Developed Countries"Andorra, Australia, Azerbaijan, Belarus, Canada,
European Union with its 28 members, Iceland, Israel,
Japan, Kazakhstan, Liechtenstein, Monaco, New
Zealand, Norway, Russian Federation, San Marino,
Switzerland, Tajikistan, Ukraine, United Kingdom of
Great Britain and Northern Ireland, United States of
America, Uzbekistan
Year Total % of Base Line Remaining
2024 100%
2029 90%
2035 70%
2040 50%
2045 20%
Year Total % of Base Line Remaining
2028 100%
2032 90%
2037 80%
2042 70%
2047 15%
Year Total % of Base Line Remaining
2019 90%
2024 60%
2029 30%
2034 20%
2036 15%

The Impact of different refrigerantsB
en
efi
cia
l
Beneficial
smaller
Components
Larger Components
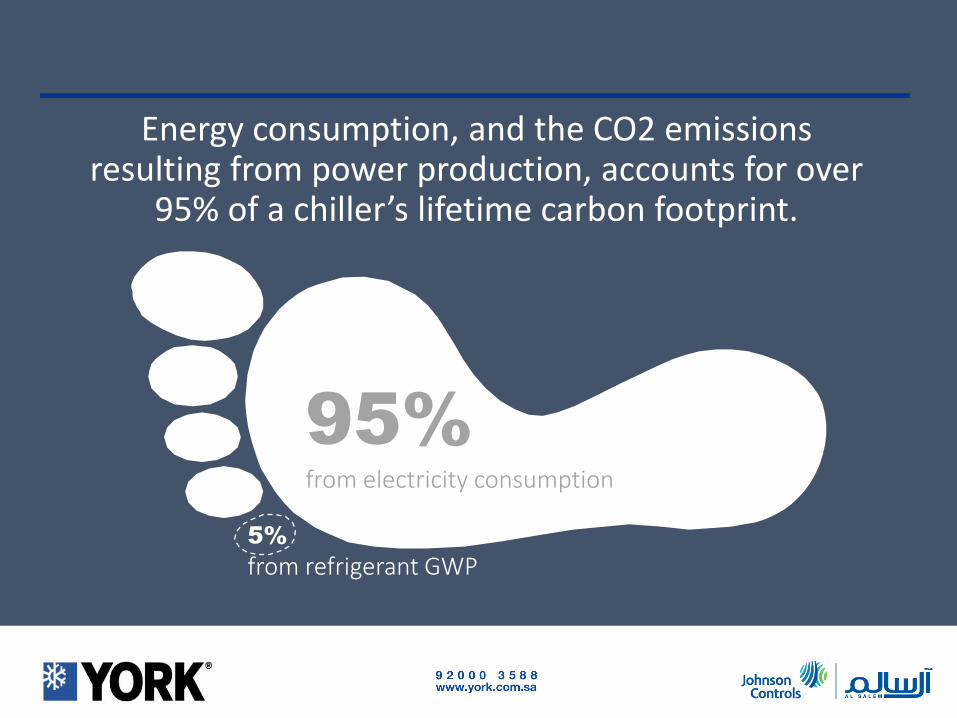
Energy consumption, and the CO2 emissions resulting from power production, accounts for over
95% of a chiller’s lifetime carbon footprint.
95%from electricity consumption
5%
from refrigerant GWP
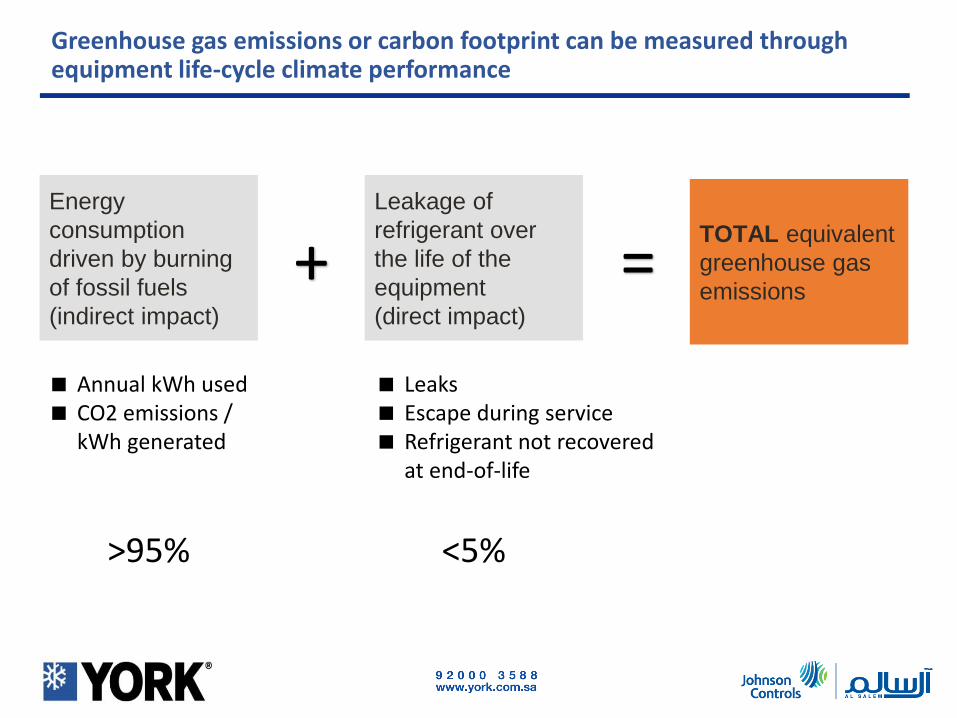
Greenhouse gas emissions or carbon footprint can be measured through equipment life-cycle climate performance
TOTAL equivalent
greenhouse gas
emissions
Leakage of
refrigerant over
the life of the
equipment
(direct impact)
Energy
consumption
driven by burning
of fossil fuels
(indirect impact)
+ =
Annual kWh used CO2 emissions /
kWh generated
Leaks Escape during service Refrigerant not recovered
at end-of-life
>95% <5%
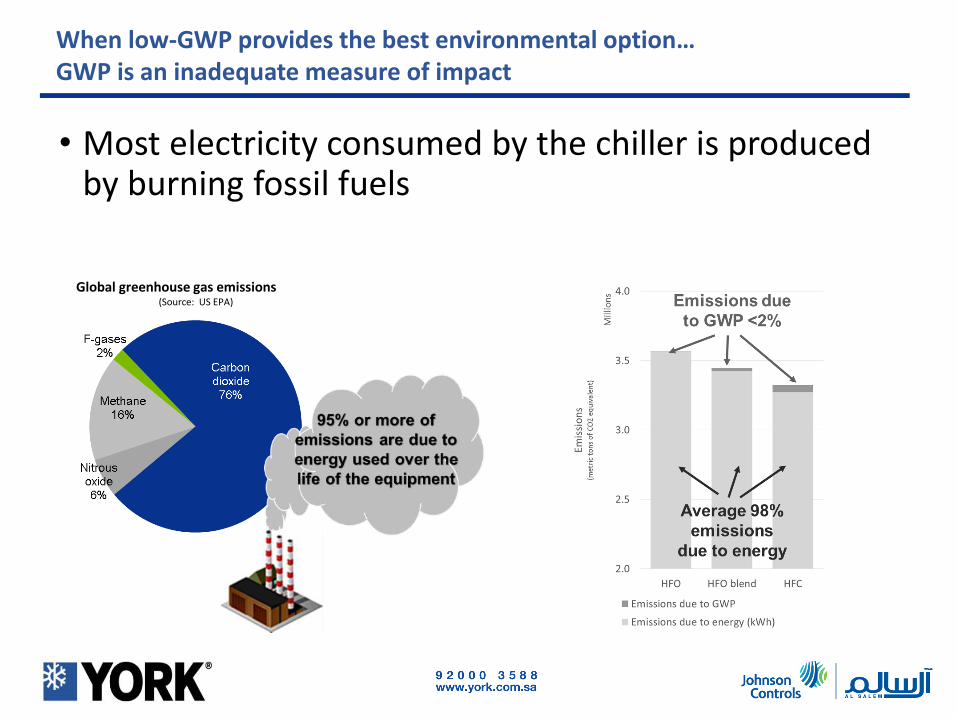
• Most electricity consumed by the chiller is produced by burning fossil fuels
Global greenhouse gas emissions(Source: US EPA)
When low-GWP provides the best environmental option…GWP is an inadequate measure of impact