Latest Investor Presentation - Southwestern Energy
32
March 2019 Investor Update NYSE: SWN Contact: Paige Penchas Vice President, Investor Relations [email protected] Phone: (832) 796-4068
Transcript of Latest Investor Presentation - Southwestern Energy
March 2019 Investor Update
NYSE: SWN
Contact: Paige Penchas
Vice President, Investor Relations
Phone: (832) 796-4068

1
Forward-Looking Statements
This presentation contains forward-looking statements. Forward-looking statements relate to future events and anticipated results of operations, business
strategies, and other aspects of our operations or operating results. In many cases you can identify forward-looking statements by terminology such as
“anticipate,” “intend,” “plan,” “project,” “estimate,” “continue,” “potential,” “should,” “could,” “may,” “will,” “objective,” “guidance,” “outlook,” “effort,” “expect,”
“believe,” “predict,” “budget,” “projection,” “goal,” “forecast,” “target” or similar words. Statements may be forward-looking even in the absence of these particular
words. Where, in any forward-looking statement, the Company expresses an expectation or belief as to future results, such expectation or belief is expressed in
good faith and believed to have a reasonable basis. However, there can be no assurance that such expectation or belief will result or be achieved. The actual
results of operations can and will be affected by a variety of risks and other matters including, but not limited to, changes in commodity prices (including
geographic basis differentials); changes in expected levels of natural gas and oil reserves or production; operating hazards; drilling risks; unsuccessful
exploratory activities; natural disasters; limited access to capital or significantly higher cost of capital related to illiquidity or uncertainty in the domestic or
international financial markets; international monetary conditions; unexpected cost increases in service or other costs related to drilling and completion activities;
potential liability for remedial actions under existing or future environmental regulations; failure to obtain necessary regulatory approvals; potential liability
resulting from pending or future litigation; and general domestic and international economic and political conditions; as wel l as changes in tax, environmental and
other laws, including court rulings, applicable to our business. Other factors that could cause actual results to differ materially from those described in the
forward-looking statements include other economic, business, competitive and/or regulatory factors affecting our business generally as set forth in our filings with
the Securities and Exchange Commission. Unless legally required, Southwestern Energy Company undertakes no obligation to update publicly any forward-
looking statements, whether as a result of new information, future events or otherwise.
Cautionary Note to U.S. Investors – The SEC permits oil and gas companies, in their filings with the SEC, to disclose only proved, probable and possible
reserves. We use the terms "resource" and “EUR” in this presentation that the SEC’s guidelines prohibit us from including in filings with the SEC. The quarterly
reserves data included in this release are estimates we prepared that have not been audited by our independent reserve engineers. All such estimates are
inherently more speculative than estimates of proved reserves and are subject to substantially greater risk of actually being realized. U.S. investors are urged to
consider closely the oil and gas disclosures and associated risk factors in our Form 10-K and other reports and filings with the SEC. Copies are available from
the SEC and from the SWN website.
This presentation contains non-GAAP financial measures, such as adjusted net income, adjusted EBITDA and net cash flow, including certain key statistics and
estimates. We report our financial results in accordance with accounting principles generally accepted in the United States of America (“GAAP”). However,
management believes certain non-GAAP performance measures may provide users of this financial information additional meaningful comparisons between
current results and the results of our peers and of prior periods. Please see the Appendix for definitions and reconciliations of the non-GAAP financial measures
that are based on reconcilable historical information.
The contents of this presentation are updated as of March 22, 2019 unless otherwise indicated.
2
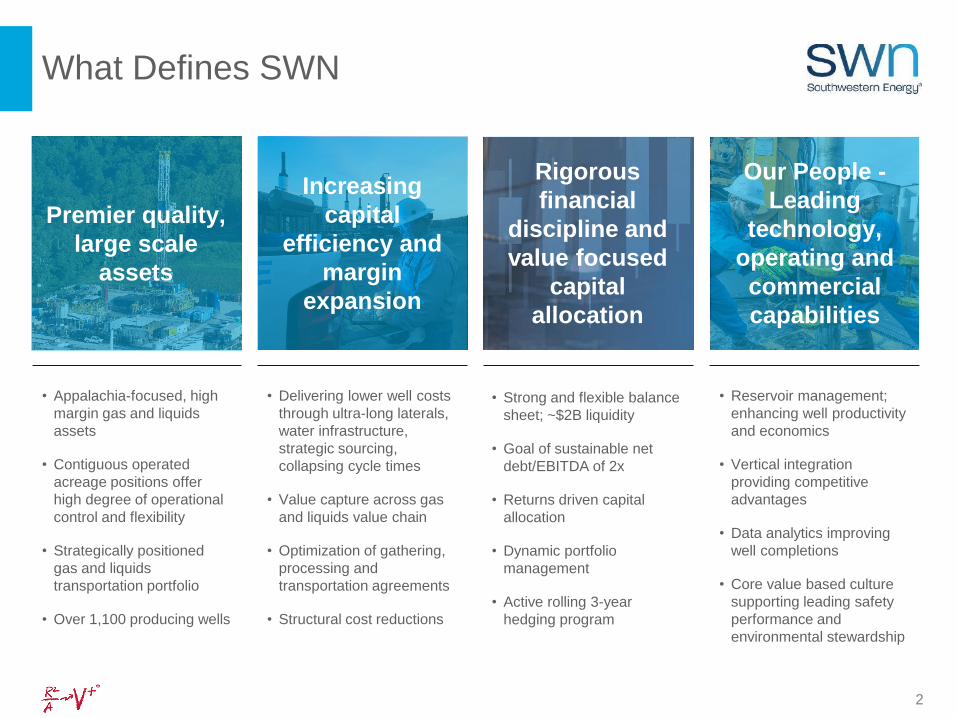
What Defines SWN
Premier quality,
large scale
assets
Rigorous
financial
discipline and
value focused
capital
allocation
Increasing
capital
efficiency and
margin
expansion
Our People -
Leading
technology,
operating and
commercial
capabilities
• Appalachia-focused, high
margin gas and liquids
assets
• Contiguous operated
acreage positions offer
high degree of operational
control and flexibility
• Strategically positioned
gas and liquids
transportation portfolio
• Over 1,100 producing wells
• Strong and flexible balance
sheet; ~$2B liquidity
• Goal of sustainable net
debt/EBITDA of 2x
• Returns driven capital
allocation
• Dynamic portfolio
management
• Active rolling 3-year
hedging program
• Delivering lower well costs
through ultra-long laterals,
water infrastructure,
strategic sourcing,
collapsing cycle times
• Value capture across gas
and liquids value chain
• Optimization of gathering,
processing and
transportation agreements
• Structural cost reductions
• Reservoir management;
enhancing well productivity
and economics
• Vertical integration
providing competitive
advantages
• Data analytics improving
well completions
• Core value based culture
supporting leading safety
performance and
environmental stewardship
3
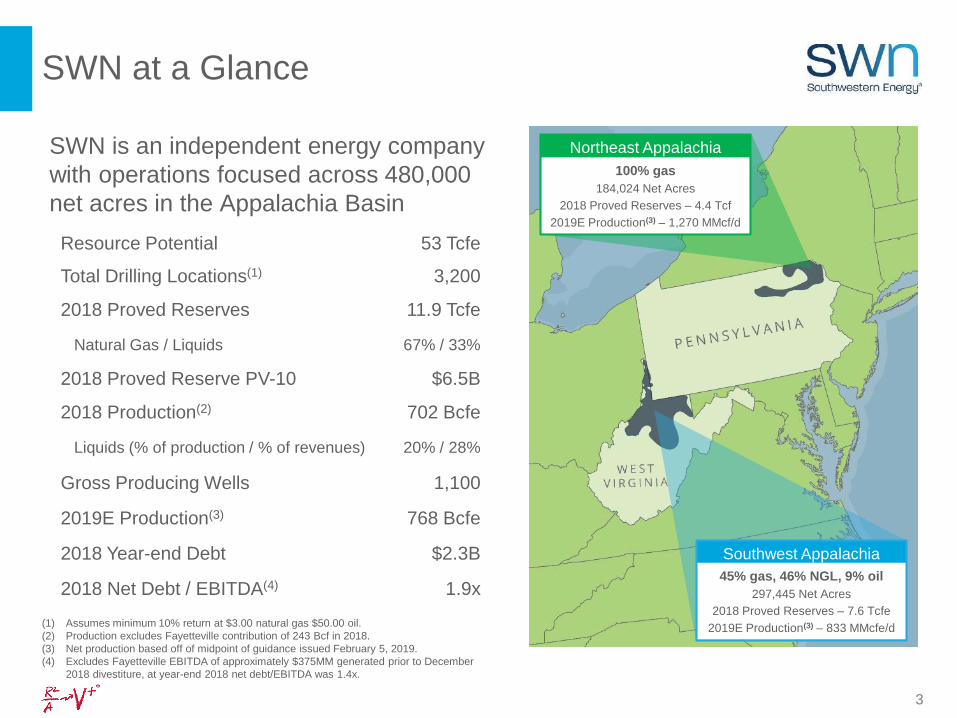
SWN at a Glance
SWN is an independent energy company
with operations focused across 480,000
net acres in the Appalachia Basin
Northeast Appalachia
100% gas
184,024 Net Acres
2018 Proved Reserves – 4.4 Tcf
2019E Production(3) – 1,270 MMcf/d
Southwest Appalachia
45% gas, 46% NGL, 9% oil
297,445 Net Acres
2018 Proved Reserves – 7.6 Tcfe
2019E Production(3) – 833 MMcfe/d
Resource Potential 53 Tcfe
Total Drilling Locations(1) 3,200
2018 Proved Reserves 11.9 Tcfe
Natural Gas / Liquids 67% / 33%
2018 Proved Reserve PV-10 $6.5B
2018 Production(2) 702 Bcfe
Liquids (% of production / % of revenues) 20% / 28%
Gross Producing Wells 1,100
2019E Production(3) 768 Bcfe
2018 Year-end Debt $2.3B
2018 Net Debt / EBITDA(4) 1.9x
(1) Assumes minimum 10% return at $3.00 natural gas $50.00 oil.
(2) Production excludes Fayetteville contribution of 243 Bcf in 2018.
(3) Net production based off of midpoint of guidance issued February 5, 2019.
(4) Excludes Fayetteville EBITDA of approximately $375MM generated prior to December
2018 divestiture, at year-end 2018 net debt/EBITDA was 1.4x.

4
Our Strategy in Action
Driving
Shareholder
Value
Organic Growth,
Liquids-rich
Enhanced Well
Performance, Diligent
Cost Management
Sustainable 2X
Leverage
Rigorous Financial
Discipline,
Returns-focused
Transition to Free Cash
Flow Neutral by
Year-end 2020
Opportunistic
Growth

5
Recent Performance Catalysts
• Closed sale of Fayetteville Shale receiving $1.65 billion after closing price
adjustments
• Reduced senior notes and bank debt by $2.1 billion
• Completed $200 million share repurchase program, reducing shares
outstanding by 8% at an average price of $4.53
• Implemented cost savings initiatives resulting in estimated annual G&A and
interest savings of $150 million beginning in 2019
• Generated over $100 million in net cash flow above capital
• Reported total Company proved reserves of 11.9 Tcfe, with a pre-tax PV-10
value of $6.5 billion
• Longer laterals driving capital efficiency, including the drilling of 3 ultra-long
laterals in excess of 15,000 ft
6
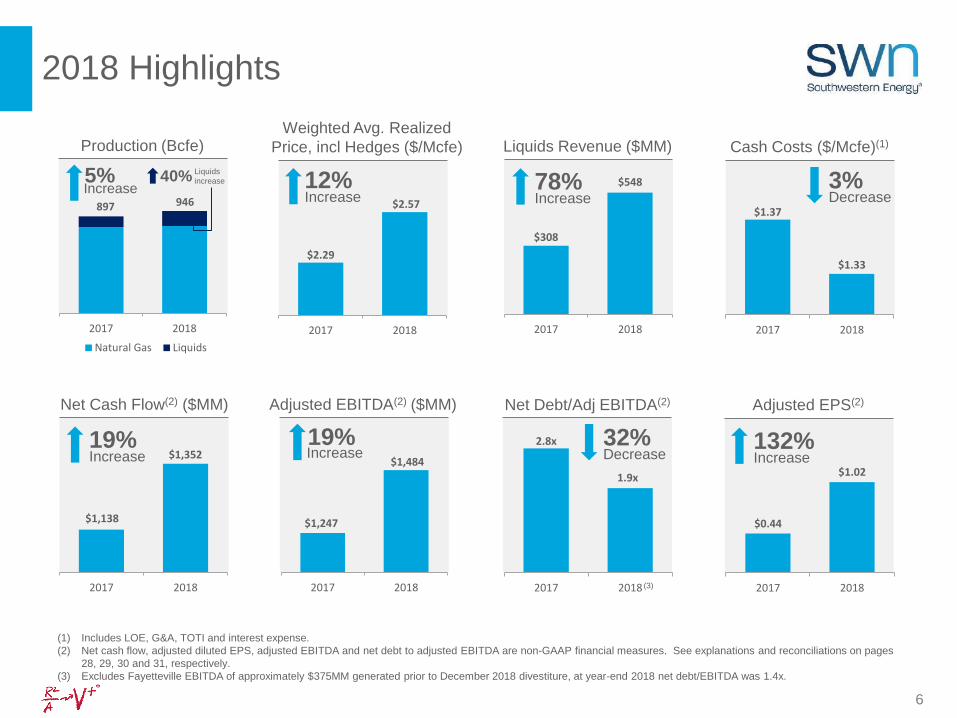
2018 Highlights
$0.44
$1.02
2017 2018
132%Increase
Adjusted EPS(2)
$1,138
$1,352
2017 2018
19%Increase
Net Cash Flow(2) ($MM)
2.8x
1.9x
2017 2018
32%Decrease
Net Debt/Adj EBITDA(2)
897 946
2017 2018
Natural Gas Liquids
5%Increase
Production (Bcfe)
$308
$548
2017 2018
78%Increase
Liquids Revenue ($MM)
$1.37
$1.33
2017 2018
3%Decrease
Cash Costs ($/Mcfe)(1)
(1) Includes LOE, G&A, TOTI and interest expense.
(2) Net cash flow, adjusted diluted EPS, adjusted EBITDA and net debt to adjusted EBITDA are non-GAAP financial measures. See explanations and reconciliations on pages
28, 29, 30 and 31, respectively.
(3) Excludes Fayetteville EBITDA of approximately $375MM generated prior to December 2018 divestiture, at year-end 2018 net debt/EBITDA was 1.4x.
$1,247
$1,484
2017 2018
19%Increase
Adjusted EBITDA(2) ($MM)
$2.29
$2.57
2017 2018
12%Increase
Weighted Avg. Realized
Price, incl Hedges ($/Mcfe)
Liquids
increase40%
(3)

7
4.5x
2.8x
1.9x 2.0x
2016 2017 Q3 2018 ProForma without
Fayetteville
Target
Strong and Flexible Balance Sheet
• Improved liquidity
– $2 billion bank revolver, 2023
maturity
– BB/Ba2 credit ratings
• No significant bond maturities until
2025
Net Debt / Adjusted EBITDA Debt Maturity Schedule ($MM)
(1) Excludes Fayetteville EBITDA of approximately $375MM generated prior to December 2018 divestiture, at year-end 2018 net debt/EBITDA was 1.4x.
(2) Based on Form 10-K filed on February 28, 2019.
0
500
1,000
1,500
2,000
2019 2020 2021 2022 2023 2024 2025 2026 2027
Bonds Revolver - Capacity
Sr Notes Wtd Avg YTM: 6.3 years(2)
Sr Notes Wtd Avg Interest: 6.7%(2)
Sr Notes Outstanding: $2.3B(2)
No significant maturities until 2025
• Continuous net debt/EBITDA
improvement
– Goal of 2X sustainable net
debt/EBITDA
– Reduced debt by $2.1 billion in 2018
– Interest expense reduced by ~$80
million annually
2018(1)

8
• Diversifying commodity mix, growing liquids portfolio
– Southwest Appalachia liquids production increasing to 75,600 barrels per
day,(1) 20% higher than record levels of 2018
– Northeast Appalachia production held flat with maintenance capital of
$280 - $310 million
• Fully funded, flexible capital program
NE Appalachia60%
SW Appalachia40%
2019 Guidance
Gas78%
NGLs 18%
Oil 4%
2019E
Production750 – 785 Bcfe
Appalachia78%
Other4%
CI&E18%
2019E
Capital$1.08B – $1.18B
2019E
Production by
Commodity
(1) The Company issued annual guidance on February 5, 2019. All figures assume midpoint of guidance.
9
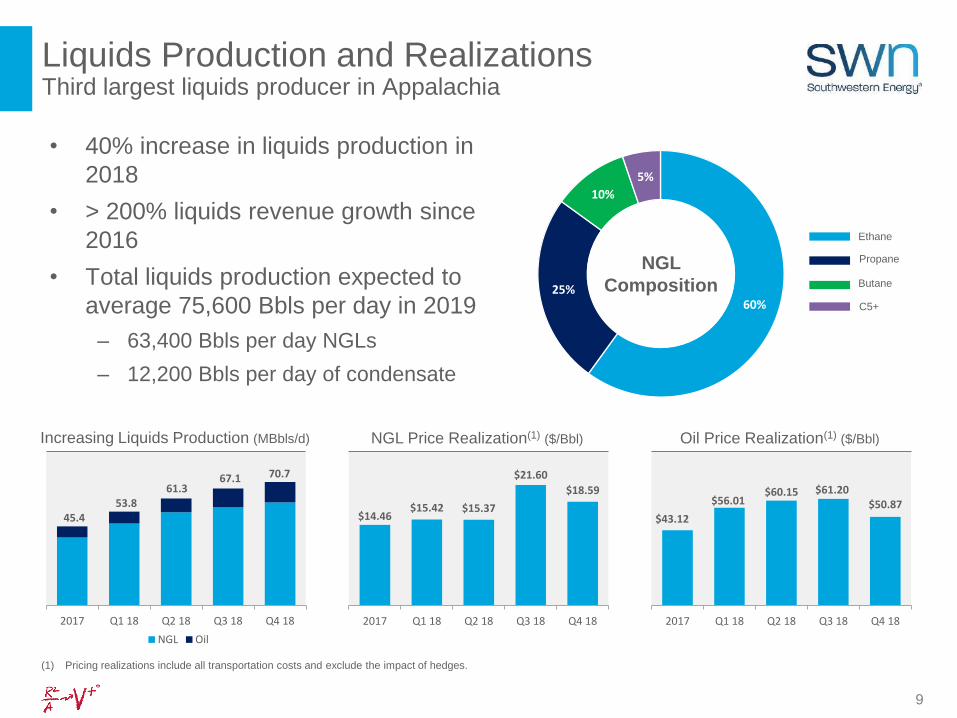
Liquids Production and RealizationsThird largest liquids producer in Appalachia
• 40% increase in liquids production in
2018
• > 200% liquids revenue growth since
2016
• Total liquids production expected to
average 75,600 Bbls per day in 2019
– 63,400 Bbls per day NGLs
– 12,200 Bbls per day of condensate
NGL
Composition
Ethane
Propane
Butane
C5+
(1) Pricing realizations include all transportation costs and exclude the impact of hedges.
45.453.8
61.367.1 70.7
2017 Q1 18 Q2 18 Q3 18 Q4 18
NGL Oil
Increasing Liquids Production (MBbls/d)
$14.46$15.42 $15.37
$21.60
$18.59
2017 Q1 18 Q2 18 Q3 18 Q4 18
NGL Price Realization(1) ($/Bbl)
$43.12
$56.01$60.15 $61.20
$50.87
2017 Q1 18 Q2 18 Q3 18 Q4 18
Oil Price Realization(1) ($/Bbl)
60%25%
10%
5%

10
Driving Well Costs Down
• Decreasing well costs by 25% to an average $875/ft
– Longer laterals, direct sand sourcing, water project and vertical integration
• Increasing average lateral lengths on wells to sales by 35% to over 10,000 ft
– Latest successfully drilled ultra-long lateral is 16,272 ft
– Continue testing ultra-long laterals to economic and technical limit
• Reducing drilling and completions capital while increasing drilled footage by 30%
2018 SWN Increased Lateral Frac Design Water and VerticalIntegration
Direct PurchasedSand
SWN Post Netback
$1,131
$875
2018(1) 2019(2)Increased
Lateral LengthCompletion
Design
Water Systems
and Vertical
Integration
Directly
Sourced Sand
Well Costs per Lateral Foot ($)
(1) 2018 includes only Marcellus wells.
(2) Improvement assumes $2.85 per Mcf gas and $50 per barrel oil.

11
4.65.2
6.3
7.7
4.0
5.56.4
8.4
2017 2018 2019E SWN Record
Southwest Appalachia Northeast Appalachia
7,451 7,267
10,600
15,559
6,185
7,584 9,400
16,272
2017 2018 2019E SWN Record
Southwest Appalachia Northeast Appalachia
65
27
19
710
6 41
2017 2018 2019E SWN Record
Southwest Appalachia Northeast Appalachia
1,1651,248 1,246
1,787
1,102 1,0451,219
1,700
2017 2018 2019E SWN Record
Southwest Appalachia Northeast Appalachia
Delivering Leading Operational Execution
37%Increase Increase
60%7%Increase Increase
11%
71%Decrease Decrease
60%42%Increase Increase
52%
Footage Drilled (ft/day) Completed Stages (stages/day)
Facilities Installation (days)Lateral Length (ft)

12
Vertical IntegrationCompetitive advantages increase capital efficiency
• Own and operate 7 super-spec
drilling rigs and 1 frac fleet
• Strategic and economic benefit
• Improves operating efficiency and
flexibility
• Mitigates service cost inflation
• Realizing full cost savings from
Southwest Appalachia water project
– $500,000 per well savings
– Improves logistics and reduces
trucking traffic and costs
13
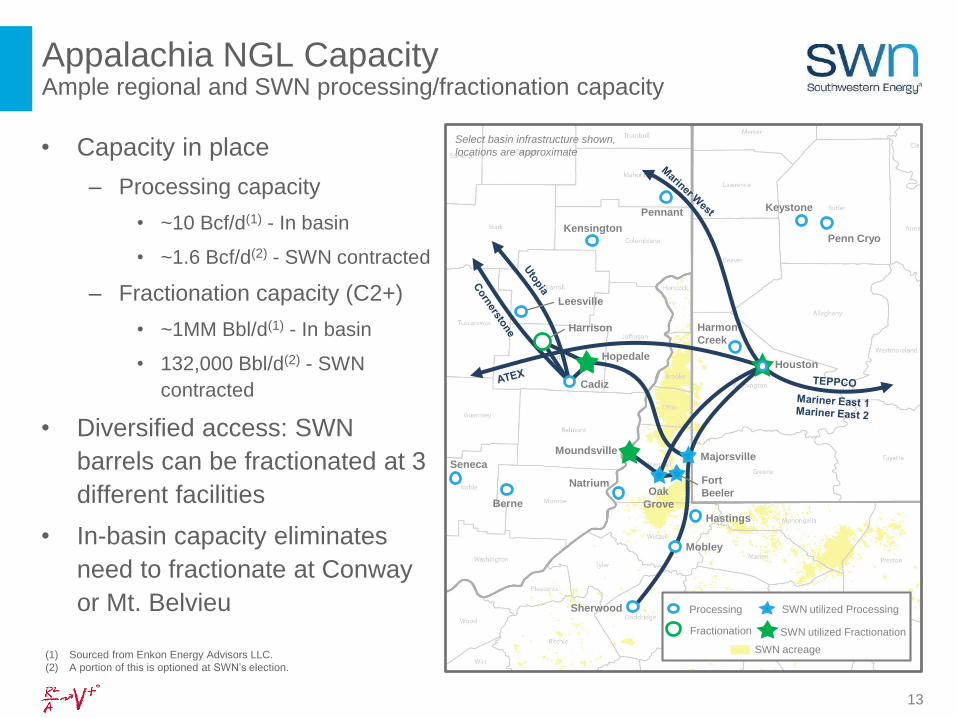
Appalachia NGL Capacity Ample regional and SWN processing/fractionation capacity
• Capacity in place
– Processing capacity
• ~10 Bcf/d(1) - In basin
• ~1.6 Bcf/d(2) - SWN contracted
– Fractionation capacity (C2+)
• ~1MM Bbl/d(1) - In basin
• 132,000 Bbl/d(2) - SWN
contracted
• Diversified access: SWN
barrels can be fractionated at 3
different facilities
• In-basin capacity eliminates
need to fractionate at Conway
or Mt. Belvieu Sherwood
Mobley
Fort
Beeler
Majorsville
Houston
Harrison
Hopedale
Cadiz
Moundsville
Oak
Grove
Hastings
Natrium
Berne
Seneca
Leesville
Kensington
Pennant Keystone
Penn Cryo
Fractionation
Processing
SWN utilized Fractionation
SWN acreage
Harmon
Creek
Select basin infrastructure shown,
locations are approximate
SWN utilized Processing
(1) Sourced from Enkon Energy Advisors LLC.
(2) A portion of this is optioned at SWN’s election.
14
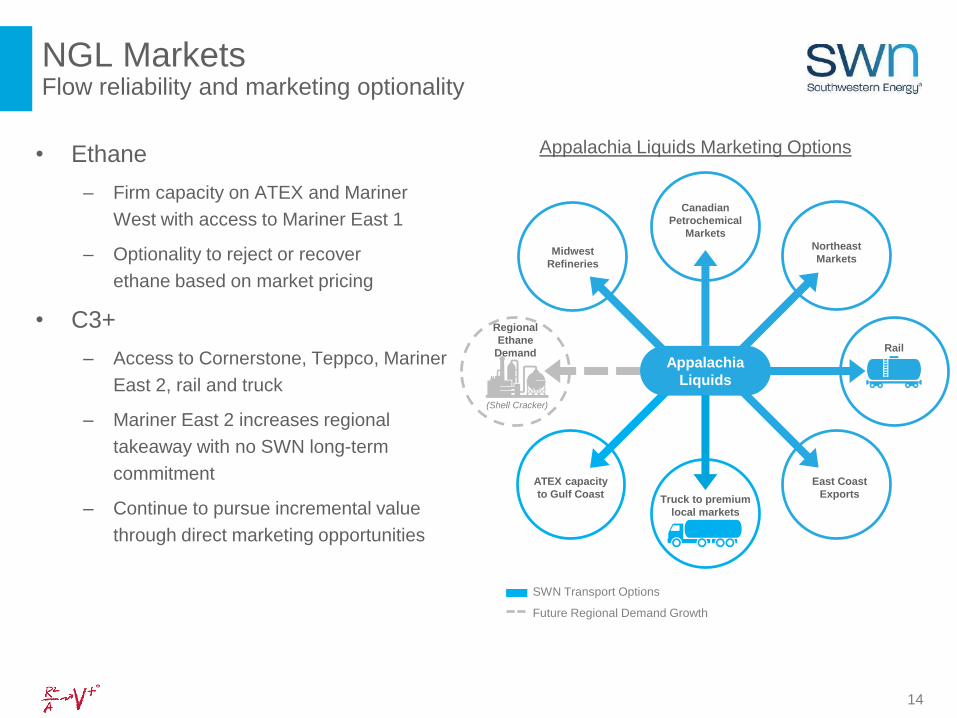
NGL MarketsFlow reliability and marketing optionality
• Ethane
– Firm capacity on ATEX and Mariner
West with access to Mariner East 1
– Optionality to reject or recover
ethane based on market pricing
• C3+
– Access to Cornerstone, Teppco, Mariner
East 2, rail and truck
– Mariner East 2 increases regional
takeaway with no SWN long-term
commitment
– Continue to pursue incremental value
through direct marketing opportunities
SWN Transport Options
Future Regional Demand Growth
Appalachia Liquids Marketing Options
Regional
Ethane
Demand
East Coast
ExportsTruck to premium
local markets
Rail
ATEX capacity
to Gulf Coast
Midwest
Refineries
Northeast
Markets
Canadian
Petrochemical
Markets
Appalachia
Liquids
(Shell Cracker)

15
($0.25)($0.29) ($0.28)
2019 2020 2021
Northeast Appalachia Gas Takeaway Access to diversified and premium markets
Year
Total Firm Takeaway
(MMBtu/d)
Annual WAVG Rate
per MMBtu
2019 1,461,000 $0.27
2020 1,379,000 $0.31
2021 1,351,000 $0.33
Transportation Cost(1,2,3)
2019: 5%
Gulf Coast
2019: 67%
Greater Appalachia
2019: 28%
City Gate
Production Areas
Sales Areas
Millennium
Tennessee Gas Pipeline
Columbia Gas
Transco Pipeline
Weighted Average Basis(4)
M3
(1) Committed volume and rate per MMBtu based on February 5, 2019 contracted takeaway. Substantially all 2019 volume commitment will be used.
(2) Ability to release capacity or buy gas to fill excess transportation capacity.
(3) Constitution in-service is assumed as of April 2020.
(4) Basis as of February 21, 2019.

16
($0.31) ($0.30) ($0.31)
2019 2020 2021
Gulf
Southwest Appalachia Gas TakeawayRight sized with access to premium markets
2019: 57%
Gulf Coast
2019: 34%
TCO - Appalachia
2019: 9%
M2 - Appalachia
Weighted Average Basis(3)
Year
Total Firm Takeaway
(MMBtu/d)
Annual WAVG Rate
per MMBtu
2019 702,000 $0.58
2020 785,000 $0.58
2021 913,000 $0.56
Transportation Cost(1,2)
Production Areas
Sales Areas
TETCO
Columbia Gas/MXP/GXP
Rover
TETCO M2
TCO
(1) Committed volume and rate per MMBtu based on February 5, 2019 contracted takeaway. Not all 2019 volume commitment will be used; however, February 5, 2019
guidance for natural gas price differentials includes all commitment costs.
(2) Ability to release capacity or buy gas to fill excess transportation capacity.
(3) Basis as of February 21, 2019.
17
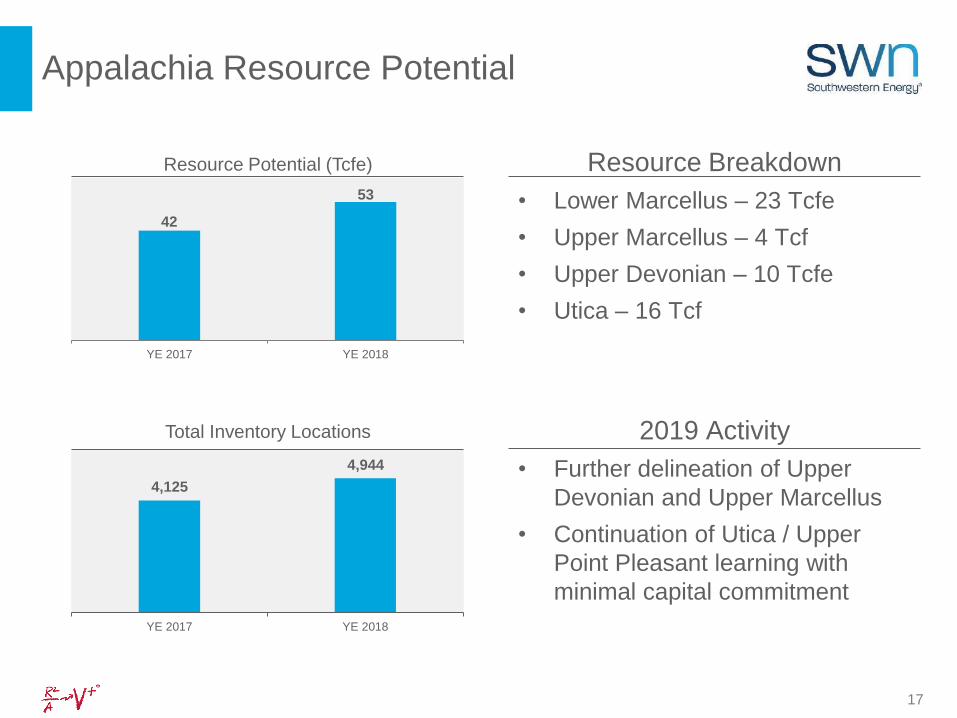
Resource Breakdown
• Lower Marcellus – 23 Tcfe
• Upper Marcellus – 4 Tcf
• Upper Devonian – 10 Tcfe
• Utica – 16 Tcf
2019 Activity
• Further delineation of Upper
Devonian and Upper Marcellus
• Continuation of Utica / Upper
Point Pleasant learning with
minimal capital commitment
YE 2017 YE 2018
YE 2017 YE 2018
Appalachia Resource Potential
Resource Potential (Tcfe)
Total Inventory Locations
4,125
4,944
42
53
18
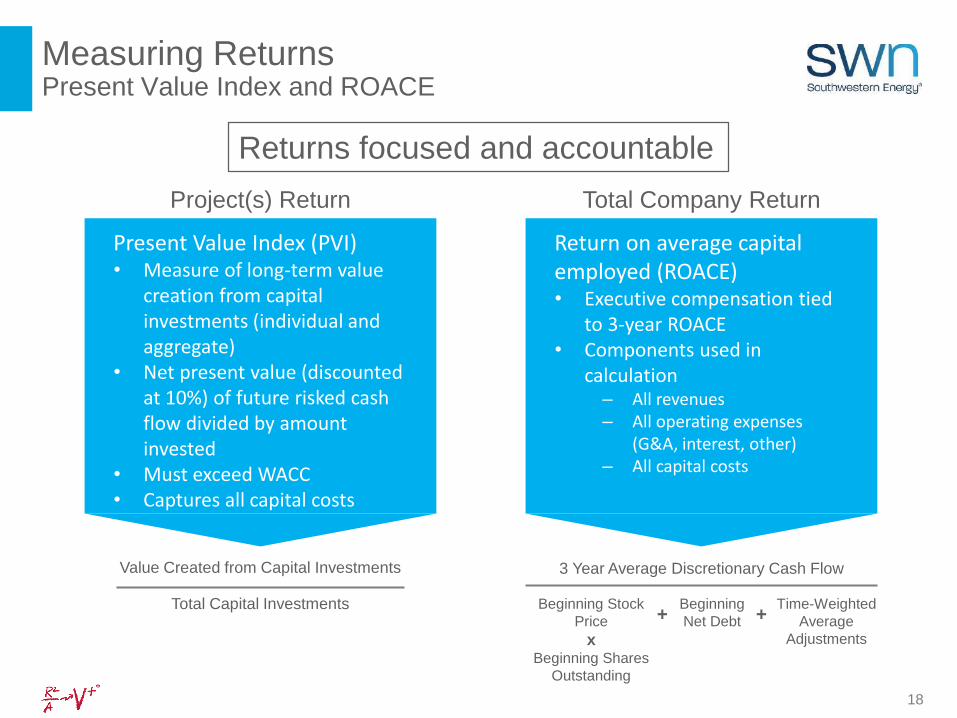
Measuring ReturnsPresent Value Index and ROACE
Project(s) Return
Value Created from Capital Investments
Total Capital Investments
Present Value Index (PVI)• Measure of long-term value
creation from capital investments (individual and aggregate)
• Net present value (discounted at 10%) of future risked cash flow divided by amount invested
• Must exceed WACC• Captures all capital costs
Total Company Return
3 Year Average Discretionary Cash Flow
Beginning
Net Debt
Beginning Stock
Price
xBeginning Shares
Outstanding
Time-Weighted
Average
Adjustments
+ +
Return on average capital employed (ROACE)• Executive compensation tied
to 3-year ROACE• Components used in
calculation‒ All revenues‒ All operating expenses
(G&A, interest, other)‒ All capital costs
Returns focused and accountable

19
Building Long-Term Shareholder Value
• Dynamic and disciplined capital
allocation
• Transition back to free cash flow
neutral by end of 2020
• Strong and flexible balance sheet
• Diversified commodity risk: gas,
NGLs, oil
• Improving capital efficiency and
operational execution
• Recognized environmental
stewardship
• Identify long-term, accretive
opportunities
2020
Appendix
21
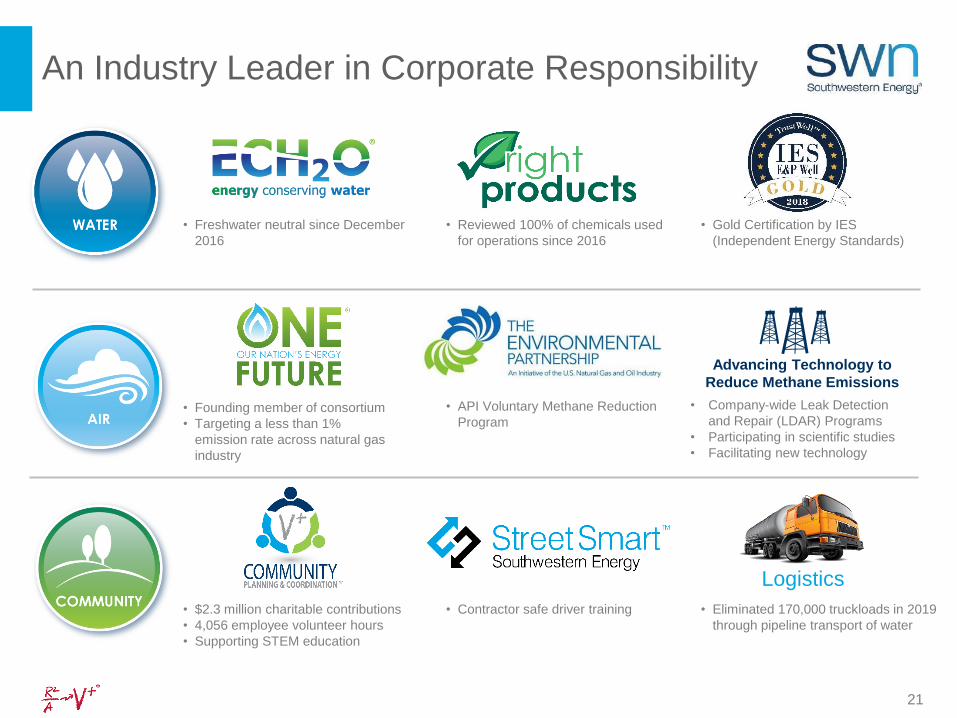
An Industry Leader in Corporate Responsibility
Logistics
Advancing Technology to
Reduce Methane Emissions
• Freshwater neutral since December
2016
• Contractor safe driver training• $2.3 million charitable contributions
• 4,056 employee volunteer hours
• Supporting STEM education
• Eliminated 170,000 truckloads in 2019
through pipeline transport of water
• Founding member of consortium
• Targeting a less than 1%
emission rate across natural gas
industry
• Reviewed 100% of chemicals used
for operations since 2016
• API Voluntary Methane Reduction
Program
• Gold Certification by IES
(Independent Energy Standards)
• Company-wide Leak Detection
and Repair (LDAR) Programs
• Participating in scientific studies
• Facilitating new technology

22
Environmental, Social and Governance
• Board independence
8 out of 9 directors are independent
Bill Way, President and CEO, is sole non-
independent director
• Board tenure
Added 4 new directors since 2017
Average board member tenure is less than 5
years
• Board diversity
44% diverse (gender, nationality, ethnicity)
• Best practices
Annual “say on pay” vote
Majority voting in director elections
Annual election of all directors
Proxy access
Ability to call special meetings
No supermajority voting standards
Regular shareholder engagement on
compensation and other key issues
• Management compensation
Independent directors approve compensation
Mix of awards weighted heavily on long-term
equity based incentives
Relative and absolute total shareholder return
Return on Average Capital Employed metric
Stock ownership requirement
Compensation committee retains independent
consultant
• Social
24-hour community hotline in all operating areas
Employee volunteerism well established within
SWN culture
• Environmental and safety
Annual bonus metrics include environmental and
safety performance
Core values of our culture
Certified “green gas” producer
Advanced leak detection technology
Active participant in coalitions focused on reducing
methane emissions
Freshwater neutral
23
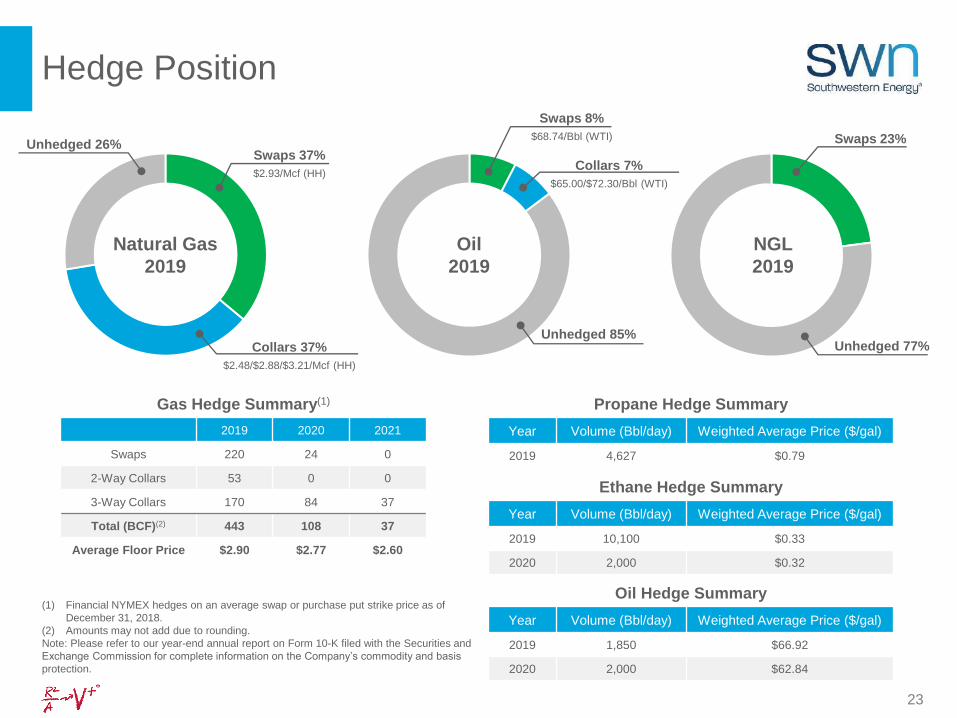
Oil
2019
Swaps 8%
$68.74/Bbl (WTI)
Hedge Position
Collars 7%
$65.00/$72.30/Bbl (WTI)
Natural Gas
2019
Swaps 37%
$2.93/Mcf (HH)
Collars 37%
$2.48/$2.88/$3.21/Mcf (HH)
NGL
2019
Swaps 23%
Ethane Hedge Summary
Year Volume (Bbl/day) Weighted Average Price ($/gal)
2019 10,100 $0.33
2020 2,000 $0.32
Propane Hedge Summary
Year Volume (Bbl/day) Weighted Average Price ($/gal)
2019 4,627 $0.79
Gas Hedge Summary(1)
2019 2020 2021
Swaps 220 24 0
2-Way Collars 53 0 0
3-Way Collars 170 84 37
Total (BCF)(2) 443 108 37
Average Floor Price $2.90 $2.77 $2.60
(1) Financial NYMEX hedges on an average swap or purchase put strike price as of
December 31, 2018.
(2) Amounts may not add due to rounding.
Note: Please refer to our year-end annual report on Form 10-K filed with the Securities and
Exchange Commission for complete information on the Company’s commodity and basis
protection.
Unhedged 85%
Unhedged 26%
Unhedged 77%
Oil Hedge Summary
Year Volume (Bbl/day) Weighted Average Price ($/gal)
2019 1,850 $66.92
2020 2,000 $62.84
24
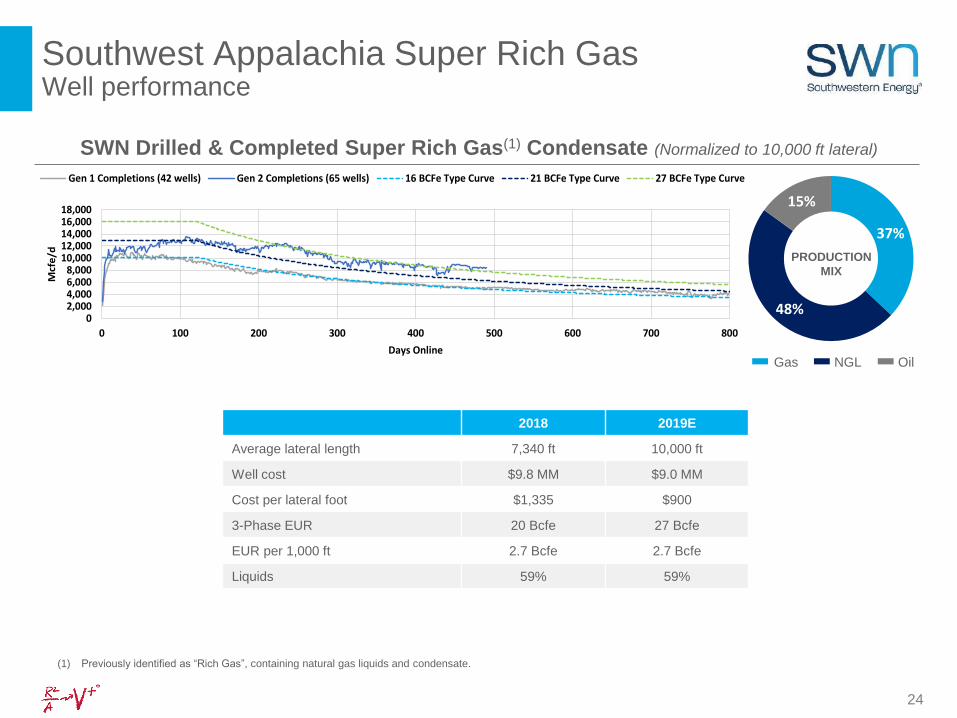
Southwest Appalachia Super Rich GasWell performance
Well Results Exceeding ExpectationsSWN Drilled & Completed Super Rich Gas(1) Condensate (Normalized to 10,000 ft lateral)
Gas NGL Oil
(1) Previously identified as “Rich Gas”, containing natural gas liquids and condensate.
37%
48%
15%
PRODUCTION
MIX
02,0004,0006,0008,000
10,00012,00014,00016,00018,000
0 100 200 300 400 500 600 700 800
Mcf
e/d
Days Online
Gen 1 Completions (42 wells) Gen 2 Completions (65 wells) 16 BCFe Type Curve 21 BCFe Type Curve 27 BCFe Type Curve
2018 2019E
Average lateral length 7,340 ft 10,000 ft
Well cost $9.8 MM $9.0 MM
Cost per lateral foot $1,335 $900
3-Phase EUR 20 Bcfe 27 Bcfe
EUR per 1,000 ft 2.7 Bcfe 2.7 Bcfe
Liquids 59% 59%

25
Southwest Appalachia Rich GasWell performance
Well Results Exceeding Expectations
Gas NGL Oil
SWN Drilled & Completed Rich Gas(1) Condensate (Normalized to 10,000 ft lateral)
(1) Previously identified as “Lean Gas”, containing natural gas liquids.
PRODUCTION
MIX 52%47%
1%
02,0004,0006,0008,000
10,00012,00014,00016,00018,00020,00022,00024,000
0 100 200 300 400 500 600 700 800
Mcf
e/d
Days Online
Gen 1 Completions (22 wells) Gen 2 Completions (15 wells) 32 BCFe Type Curve 40 BCFe Type Curve 48 BCFe Type Curve
2018 2019E
Average lateral length 6,068 ft 10,000 ft
Well cost $9.1 MM $9.6 MM
Cost per lateral foot $1,500 $960
3-Phase EUR 21 Bcfe 35 Bcfe
EUR per 1,000 ft 3.5 Bcfe 3.5 Bcfe
Liquids 42% 43%

26
Northeast AppalachiaWell performance
SWN Drilled & Completed Dry Gas (Normalized to 9,500 ft lateral)
02,0004,0006,0008,000
10,00012,00014,00016,00018,00020,00022,00024,00026,00028,00030,00032,000
0 100 200 300 400 500 600 700 800
Daily
Rate
, M
cf/
d
Days of Production
Legacy Susquehanna & Bradford (113 Wells) Tioga Area (15 Wells) 15 BCF EUR Curve 20 BCF EUR Curve 25 BCF EUR Curve
2018 Susquehanna 2019E Tioga 2019E
Average lateral length 7,584 ft 9,500 ft 9,500 ft
Well cost $7.5 MM $7.6 MM $7.9 MM
Cost per lateral foot $988 $804 $834
EUR 17 Bcf 20 Bcf 19 Bcf
EUR per 1,000 ft 2.2 Bcf 2.1 Bcf 2.0 Bcf
27
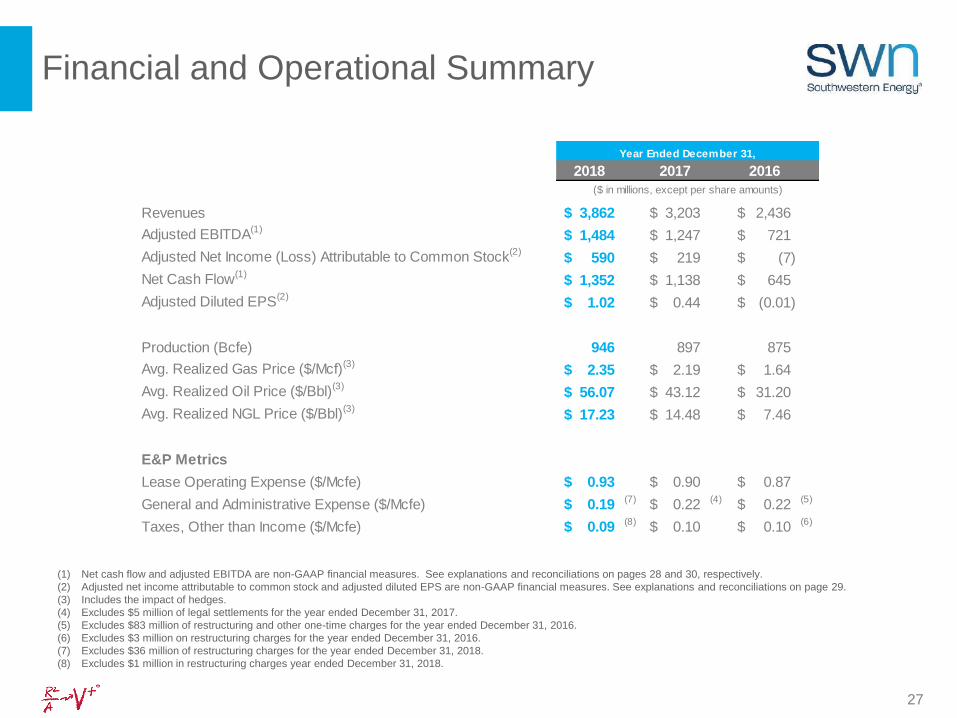
Financial and Operational Summary
(1) Net cash flow and adjusted EBITDA are non-GAAP financial measures. See explanations and reconciliations on pages 28 and 30, respectively.
(2) Adjusted net income attributable to common stock and adjusted diluted EPS are non-GAAP financial measures. See explanations and reconciliations on page 29.
(3) Includes the impact of hedges.
(4) Excludes $5 million of legal settlements for the year ended December 31, 2017.
(5) Excludes $83 million of restructuring and other one-time charges for the year ended December 31, 2016.
(6) Excludes $3 million on restructuring charges for the year ended December 31, 2016.
(7) Excludes $36 million of restructuring charges for the year ended December 31, 2018.
(8) Excludes $1 million in restructuring charges year ended December 31, 2018.
2018 2017 2016
Revenues 3,862$ 3,203$ 2,436$
Adjusted EBITDA(1)1,484$ 1,247$ 721$
Adjusted Net Income (Loss) Attributable to Common Stock(2)590$ 219$ (7)$
Net Cash Flow(1)1,352$ 1,138$ 645$
Adjusted Diluted EPS(2)1.02$ 0.44$ (0.01)$
Production (Bcfe) 946 897 875
Avg. Realized Gas Price ($/Mcf)(3)2.35$ 2.19$ 1.64$
Avg. Realized Oil Price ($/Bbl)(3)56.07$ 43.12$ 31.20$
Avg. Realized NGL Price ($/Bbl)(3)17.23$ 14.48$ 7.46$
E&P Metrics
Lease Operating Expense ($/Mcfe) 0.93$ 0.90$ 0.87$
General and Administrative Expense ($/Mcfe) 0.19$ (7) 0.22$ (4) 0.22$ (5)
Taxes, Other than Income ($/Mcfe) 0.09$ (8) 0.10$ 0.10$ (6)
Year Ended December 31,
($ in millions, except per share amounts)
28
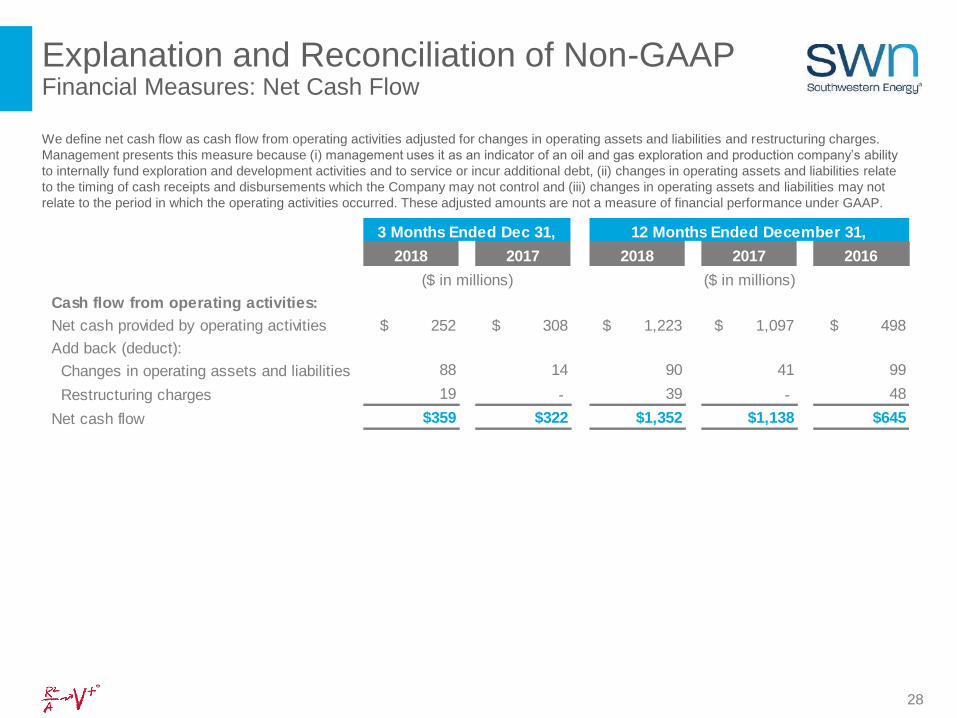
Explanation and Reconciliation of Non-GAAP Financial Measures: Net Cash Flow
We define net cash flow as cash flow from operating activities adjusted for changes in operating assets and liabilities and restructuring charges.
Management presents this measure because (i) management uses it as an indicator of an oil and gas exploration and production company’s ability
to internally fund exploration and development activities and to service or incur additional debt, (ii) changes in operating assets and liabilities relate
to the timing of cash receipts and disbursements which the Company may not control and (iii) changes in operating assets and liabilities may not
relate to the period in which the operating activities occurred. These adjusted amounts are not a measure of financial performance under GAAP.
2018 2017 2018 2017 2016
Cash flow from operating activities:
Net cash provided by operating activities $ 252 $ 308 $ 1,223 $ 1,097 $ 498
Add back (deduct):
Changes in operating assets and liabilities 88 14 90 41 99
Restructuring charges 19 - 39 - 48
Net cash flow $359 $322 $1,352 $1,138 $645
3 Months Ended Dec 31,
($ in millions)
12 Months Ended December 31,
($ in millions)

29
Explanation and Reconciliation of Non-GAAP Financial Measures: Adjusted Net Income Attributable to Common Stock
Additional non-GAAP financial measures we may present from time to time are adjusted net income attributable to common stock and adjusted
diluted earnings per share attributable to Southwestern Energy stockholders, both of which exclude certain charges or amounts shown in the
tables below. Management presents these measures because (i) they are consistent with the manner in which the Company’s performance is
measured relative to the performance of its peers, (ii) these measures are more comparable to earnings estimates provided by securities
analysts, and (iii) charges or amounts excluded cannot be reasonably estimated and guidance provided by the Company excludes information
regarding these types of items. These adjusted amounts are not a measure of financial performance under GAAP.
(1) Primarily relates to the exclusion of certain discrete tax adjustments due to an increase to the valuation allowance against the Company’s deferred tax assets
($ in millions) (per share) ($ in millions) (per share)
Net income attributable to common stock 307$ 0.54$ 267$ 0.53$
Add back (deduct):
Participating securities - mandatory convertible preferred stock - - 31 0.06
Restructuring and other one-time charges 19 0.03 - -
Gain on sale of assets, net (16) (0.03) (1) -
(Gain) loss on certain derivatives (89) (0.16) (101) (0.20)
Loss on early debt extinguishment and other 9 0.02 3 0.01
Legal settlements 1 - - -
Loss on foreign currency adjustment - - 6 0.01
Adjustments due to inventory valuation 2 0.01 (1) -
Adjustments due to discrete tax items (1) (75) (0.13) (176) (0.36)
Tax impact on adjustments 18 0.03 35 0.07
Adjusted net income attributable to common stock 176$ 0.31$ 63$ 0.12$
($ in millions) (per share) ($ in millions) (per share) ($ in millions) (per share)
Net income (loss) attributable to common stock 535$ 0.93$ 815$ 1.63$ (2,751)$ (6.32)$
Add back (deduct):
Participating securities - mandatory convertible preferred stock -$ -$ 90$ 0.18$ -$ -$
Impairments 171 0.30 - - 2,321 5.33
Restructuring and other one-time charges 39 0.06 - - 89 0.20
Gain on sale of assets, net (17) (0.03) (4) (0.01) (3) (0.00)
(Gain) Loss on certain derivatives 24 0.04 (451) (0.90) 373 0.86
Loss on early debt extinguishment and other (1) 17 0.03 73 0.15 57 0.13
Legal settlements 9 0.02 5 0.01 - -
Loss on foreign currency adjustment - - 6 0.01 - -
Adjustments due to inventory valuation 3 0.01 (2) (0.00) 3 0.01
Adjustments due to discrete tax items (1) (130) (0.23) (455) (0.91) 978 2.25
Tax impact on adjustments (61) (0.11) 142 0.28 (1,074) (2.47)
Adjusted net income (loss) 590$ 1.02$ 219$ 0.44$ (7)$ (0.01)$
2018 2017
12 Months Ended December 31,
2018 2017 2016
3 Months Ended December 31,

30
Explanation and Reconciliation of Non-GAAP Financial Measures: Adjusted EBITDA
EBITDA is defined as net income plus interest, income tax expense, depreciation, depletion and amortization. Adjusted EBITDA is defined as
EBITDA less gains (losses) on sale of assets and gains (losses) on unsettled derivatives plus write-down of inventory, non-cash stock-based
compensation, restructuring charges, loss on debt extinguishment, impairments, legal settlements and foreign currency adjustments.
Southwestern has included information concerning EBITDA and Adjusted EBITDA because they are used by certain investors as a measure of the
ability of a company to service or incur indebtedness and because it is a financial measure commonly used in the energy industry. EBITDA and
Adjusted EBITDA should not be considered in isolation or as a substitute for net income, net cash provided by operating activities or other income
or cash flow data prepared in accordance with GAAP or as a measure of the Company's profitability or liquidity. EBITDA and Adjusted EBITDA, as
defined above, may not be comparable to similarly titled measures of other companies. Net income is a financial measure calculated and
presented in accordance with generally accepted accounting principles. The table below reconciles historical net income with historical Adjusted
EBITDA.
(1) 2016 includes the impact from a full cost ceiling test impairment of our natural gas and oil properties.
(1)
2018 2017 2016
Net income (loss) 537$ 1,046$ (2,643)$
Add back (deduct):
Net interest expense 124 135 88
Provision (benefit) for income taxes 1 (93) (29)
Depreciation, depletion and amortization 560 504 436
Impairments(1) 171 - 2,321
Restructuring and other one-time charges 39 - 89
Gain on sale of assets, net (17) (4) (3)
Loss on early extinguishment of debt 17 73 51
Legal settlements 9 5 -
(Gain) loss on unsettled derivatives 24 (451) 373
Loss on foreign currency adjustment - 6 -
Adjustments due to inventory valuation and other 3 (2) 3
Stock-based compensation expense 16 28 35
Adjusted EBITDA $1,484 $1,247 $721
($ in millions)
12 Months Ended December 31,
31
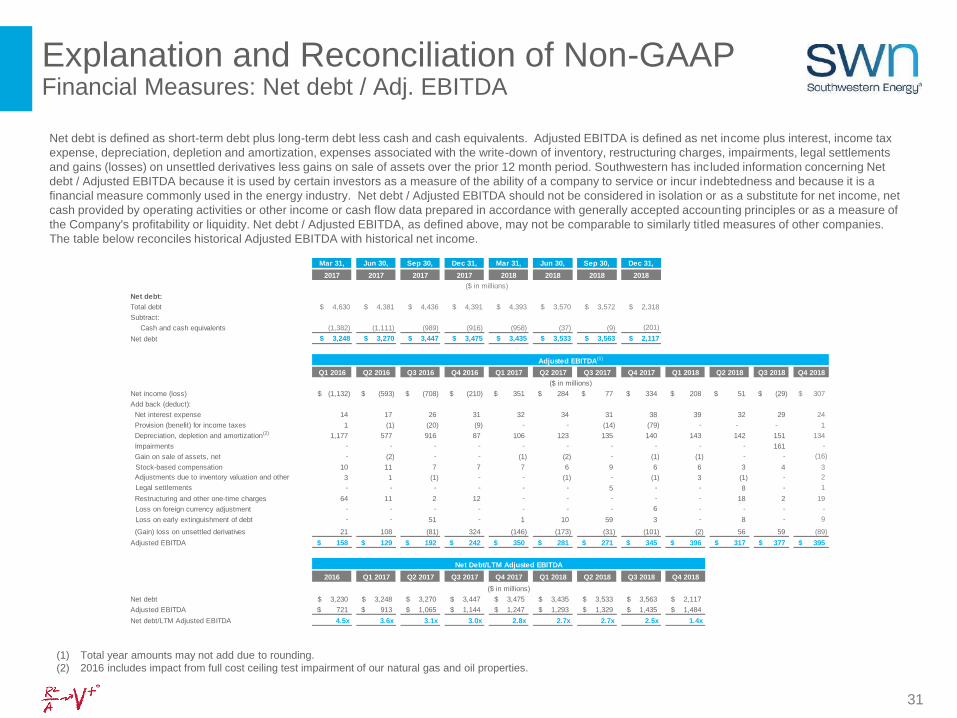
Explanation and Reconciliation of Non-GAAP Financial Measures: Net debt / Adj. EBITDA
Net debt is defined as short-term debt plus long-term debt less cash and cash equivalents. Adjusted EBITDA is defined as net income plus interest, income tax
expense, depreciation, depletion and amortization, expenses associated with the write-down of inventory, restructuring charges, impairments, legal settlements
and gains (losses) on unsettled derivatives less gains on sale of assets over the prior 12 month period. Southwestern has included information concerning Net
debt / Adjusted EBITDA because it is used by certain investors as a measure of the ability of a company to service or incur indebtedness and because it is a
financial measure commonly used in the energy industry. Net debt / Adjusted EBITDA should not be considered in isolation or as a substitute for net income, net
cash provided by operating activities or other income or cash flow data prepared in accordance with generally accepted accounting principles or as a measure of
the Company's profitability or liquidity. Net debt / Adjusted EBITDA, as defined above, may not be comparable to similarly ti tled measures of other companies.
The table below reconciles historical Adjusted EBITDA with historical net income.
(1) Total year amounts may not add due to rounding.
(2) 2016 includes impact from full cost ceiling test impairment of our natural gas and oil properties.
Mar 31, Jun 30, Sep 30, Dec 31, Mar 31, Jun 30, Sep 30, Dec 31,
2017 2017 2017 2017 2018 2018 2018 2018
Net debt:
Total debt $ 4,630 $ 4,381 $ 4,436 $ 4,391 $ 4,393 $ 3,570 $ 3,572 $ 2,318
Subtract:
Cash and cash equivalents (1,382) (1,111) (989) (916) (958) (37) (9) (201)
Net debt $ 3,248 $ 3,270 $ 3,447 $ 3,475 $ 3,435 $ 3,533 $ 3,563 $ 2,117
Q1 2016 Q2 2016 Q3 2016 Q4 2016 Q1 2017 Q2 2017 Q3 2017 Q4 2017 Q1 2018 Q2 2018 Q3 2018 Q4 2018
Net income (loss) (1,132)$ (593)$ (708)$ (210)$ 351$ 284$ 77$ 334$ 208$ 51$ (29)$ 307$
Add back (deduct):
Net interest expense 14 17 26 31 32 34 31 38 39 32 29 24
Provision (benefit) for income taxes 1 (1) (20) (9) - - (14) (79) - - - 1
Depreciation, depletion and amortization(2) 1,177 577 916 87 106 123 135 140 143 142 151 134
Impairments - - - - - - - - - - 161 -
Gain on sale of assets, net - (2) - - (1) (2) - (1) (1) - - (16)
Stock-based compensation 10 11 7 7 7 6 9 6 6 3 4 3
Adjustments due to inventory valuation and other 3 1 (1) - - (1) - (1) 3 (1) - 2
Legal settlements - - - - - - 5 - - 8 - 1
Restructuring and other one-time charges 64 11 2 12 - - - - - 18 2 19
Loss on foreign currency adjustment - - - - - - - 6 - - - -
Loss on early extinguishment of debt - - 51 - 1 10 59 3 - 8 - 9
(Gain) loss on unsettled derivatives 21 108 (81) 324 (146) (173) (31) (101) (2) 56 59 (89)
Adjusted EBITDA 158$ 129$ 192$ 242$ 350$ 281$ 271$ 345$ 396$ 317$ 377$ 395$
2016 Q1 2017 Q2 2017 Q3 2017 Q4 2017 Q1 2018 Q2 2018 Q3 2018 Q4 2018
Net debt 3,230$ 3,248$ 3,270$ 3,447$ 3,475$ 3,435$ 3,533$ 3,563$ 2,117$
Adjusted EBITDA 721$ 913$ 1,065$ 1,144$ 1,247$ 1,293$ 1,329$ 1,435$ 1,484$
Net debt/LTM Adjusted EBITDA 4.5x 3.6x 3.1x 3.0x 2.8x 2.7x 2.7x 2.5x 1.4x
($ in millions)
Adjusted EBITDA(1)
($ in millions)
Net Debt/LTM Adjusted EBITDA
($ in millions)