
Lateral inventory transshipment problem in online-to ...
27
HAL Id: emse-01184880 https://hal-emse.ccsd.cnrs.fr/emse-01184880 Submitted on 7 May 2021 HAL is a multi-disciplinary open access archive for the deposit and dissemination of sci- entific research documents, whether they are pub- lished or not. The documents may come from teaching and research institutions in France or abroad, or from public or private research centers. L’archive ouverte pluridisciplinaire HAL, est destinée au dépôt et à la diffusion de documents scientifiques de niveau recherche, publiés ou non, émanant des établissements d’enseignement et de recherche français ou étrangers, des laboratoires publics ou privés. Lateral inventory transshipment problem in online-to-offline supply chain Fuguo Zhao, Desheng Wu, Liang Liang, Alexandre Dolgui To cite this version: Fuguo Zhao, Desheng Wu, Liang Liang, Alexandre Dolgui. Lateral inventory transshipment problem in online-to-offline supply chain. International Journal of Production Research, Taylor & Francis, 2016, 54 (7), pp.1951-1963. 10.1080/00207543.2015.1070971. emse-01184880
Transcript of Lateral inventory transshipment problem in online-to ...

HAL Id: emse-01184880https://hal-emse.ccsd.cnrs.fr/emse-01184880
Submitted on 7 May 2021
HAL is a multi-disciplinary open accessarchive for the deposit and dissemination of sci-entific research documents, whether they are pub-lished or not. The documents may come fromteaching and research institutions in France orabroad, or from public or private research centers.
L’archive ouverte pluridisciplinaire HAL, estdestinée au dépôt et à la diffusion de documentsscientifiques de niveau recherche, publiés ou non,émanant des établissements d’enseignement et derecherche français ou étrangers, des laboratoirespublics ou privés.
Lateral inventory transshipment problem inonline-to-offline supply chain
Fuguo Zhao, Desheng Wu, Liang Liang, Alexandre Dolgui
To cite this version:Fuguo Zhao, Desheng Wu, Liang Liang, Alexandre Dolgui. Lateral inventory transshipment problemin online-to-offline supply chain. International Journal of Production Research, Taylor & Francis,2016, 54 (7), pp.1951-1963. �10.1080/00207543.2015.1070971�. �emse-01184880�

0
Lateral inventory transshipment problem in online-to-
offline supply chain
Fuguo Zhao, Desheng Wu, Liang Liang & Alexandre Dolgui
International Journal of Production Research
Volume 54, 2016 - Issue 7, pages 1951-1963
https://doi.org/10.1080/00207543.2015.1070971
Abstract
Online-to-Offline (OTO) is a new commercial model with enormous market potential. Online
customer orders are forwarded to the offline brick-and-mortar store to fulfill, which is a combination
of dual-channel supply chain. OTO overcomes many disadvantages of the traditional dual-channel
supply chain, but still faces uncertain market demand. To reduce the inventory risk caused by
demand uncertainty, lateral inventory transshipment is employed in this paper to pool inventory risk
in OTO supply chain. We model centralized OTO and decentralized OTO with/without
transshipment, and then analyze different scenarios. Our results demonstrate that there exists a
unique Nash equilibrium of inventory order levels in dual channels and an optimal transshipment
price to maximize the profit of the entire supply chain. Finally, we provide a numerical example of
uniform demand distribution. Our analyses offer many managerial insights and show that
transshipment always benefits the OTO supply chain.
Keywords: Inventory Transshipment, Online-to-Offline (OTO), Dual-channel Supply Chain,
Demand Uncertainty
Received 09 Dec 2014, Accepted 17 Jun 2015, Published online: 30 Jul 2015

1
1. Introduction
The rapid development of commerce on the Internet has made the link between online and physical
commerce stronger, which leads many companies to consider engaging in direct sales (Chiang et al.
2003). Dual-channel supply chain benefits customers by providing additional purchasing choices.
Consumers will balance the related advantages and disadvantages of the two channels in their
purchasing decisions. For example, buying from the retail channel offers instant gratification,
customers can experience the goods first which can reduce the possibility of sales return due to
product defect or delivery damage. However, consumers need to spend money, time and effort to
go to a brick-and-mortar store, and may face a stockout. Whereas the direct online channel provides
availability of online information about substitutable products, and sometimes lower price, but
requires delivery lead time (Chen et al. 2008, Huang et al. 2012). Dual-channel supply chain brings
a direct competitor of any existing retailers, which results in “channel conflict” (Tsay and Agrawal,
2004).
Drop shipping is employed by dual-channel supply chain as an order fulfillment strategy. In this
model, retailers do not own inventory, and simply forward customer orders to the manufacturer. The
manufacturer keeps inventory and fulfills those orders directly to the customers with a
predetermined price to be paid by the retailers. Drop-shipping has some advantages compared with
the traditional dual-channel supply chain model in which retailers hold inventory. Retailers can
reduce inventory costs, transportation costs and under-stock cost, while manufacturer can increase
sales and reduce advertising costs. Under the drop-shipping arrangement, the supply chain benefits
from inventory risk pooling because all the inventories are stocked at the manufacturer’s warehouse.
However, customers will suffer long delivery time and cannot experience the product in advance,
sometimes even face product unavailability because of the manufacturer’s stockout (Ayanso et al.
2006).
To overcome the shortcomings of traditional dual-channel supply chain and drop-shipping
model, in this paper, we study a new business model named Online-to-Offline (OTO). The
manufacturer (referred as “he” throughout this paper) owns an e-store as a direct channel to sell the
product, and forwards customer orders to the retailer (referred as “she” throughout this paper) who

2
is the nearest to the customer. The manufacturer pays a preset unit revenue share to the retailer for
fulfilling every direct channel’s customer order. In this way, the delivery lead time is shorter than
e-store delivers directly. Customers can also go to the nearest retailer to pick up the product, and
experience in advance on the spot. OTO is a good combination of retail channel and direct channel.
The similarities and differences of the three models aforementioned are listed in Table 1.
Table 1. The differences and similarities of the three supply chain models
Models Differences Similarities
Traditional dual-channel
supply chain
Customer orders in each channel are
fulfilled by themselves, separately.
All the three models consist of a
direct channel and a retail
channel, i.e. online channel and
offline channel.
Drop-shipping model
Retailers do not own inventory, and all
customer orders are fulfilled by the
manufacturer.
OTO supply chain
The manufacturer does not own
inventory, and customer orders are
fulfilled by the retailer who is the
nearest to the customer. It can reduce
the delivery cost and lead time.
In an OTO supply chain, the retailer orders based on the predicted retail channel’s demand in
advance of the selling season, then the manufacturer fulfills the retailer’s order, plus his own
inventory according to the predicted direct channel’s demand. The manufacturer bears no inventory
risk which is contrary to drop-shipping, but he needs to pay the inventory cost for his own inventory.
Inventory transshipment is a powerful mechanism to monitor movement of products among
locations at the same echelon. It matches supply and demand by transshipping excess stock of one
member to another with insufficient stock, thus reduces inventory costs and improves service level
(Belgasmi et al. 2008). The OTO supply chain employs virtual transshipments where all the
inventories are stored at the retailer’s warehouse. It bears no transshipment cost and reduces the
stockout risk of both parties.
The last decade has witnessed wide practical applications of OTO supply chain. According to
some scholars and practitioners, OTO bring about widespread availability of online information

3
about substitutable products, suppliers, and pricing for customers. Qumei Furniture is a large
furniture company in China who owns about 600 retail stores in more than 200 cities. Charging the
same price in both channels, Qumei Furniture employs OTO strategy to fulfill customer demands.
Qumei’s e-store forwards the online order to the retail store who is the nearest to the customer to
deliver. Since furniture is usually very large, OTO can reduce the delivery cost and delivery time
remarkably.
The market potential of OTO is tremendous. It is very prevalent in many industries, for
example, appliance, education, clothing, hotels and catering. OpenTable, Groupon and
Restaurant.com are three large group-buying websites who sell discounted meals online and bring
customers into brick-and-mortar restaurants to consume. Wowo Ltd. is an e-commerce company
that employs OTO model to provide life services in China. It has been successfully listed on a US
Nasdaq exchange in 2015. Wowo provides a platform that attracts customers to order and pay for
products and services online, and forwards the orders to offline brick-and-mortar store to fulfill.
OTO benefits both the manufacturer and the retailer. To the best of our knowledge, this paper
is the first one that describes and analyzes OTO supply chain model. The rest of this paper is
organized as follows. Section 2 outlines the related literature. Section 3 models and analyzes the
centralized OTO and decentralized OTO with/without inventory transshipment. Section 4 presents
a numerical example with uniform demand distribution and provides more managerial insights.
Conclusions and future research areas are summarized in Section 5.
2. Literature review
There are two streams of research closely related to our model. The first stream of literature focuses
on drop-shipping supply chain. Research on how to achieve coordination in dual-channel supply
chain has received considerable attention. Drop-shipping, where the manufacturer own inventory
and delivers the product directly to customers at retailers’ request, is usually adopted to pool
inventory risk and reduce inventory cost.
Yao et al. (2008) analyzed a drop-shipping distribution system comprising an e-retailer and a
supplier. They addressed whether and when the supplier is willing to share its private cost
4
information with the e-retailer. Rabinovich et al. (2008) investigated internet retailing in a drop-ship
context. Their results suggested that an e-retailer can obtain higher margins from online customers
when it provides more favorable physical distribution service. Gan et al. (2010) proposed a
commitment-penalty contract in a drop-shipping supply chain with asymmetric demand information,
and showed that the contract guaranteed the supplier to obtain the retailer’s demand information.
Khouja and Stylianou (2009) developed two (Q, R) inventory models that allow a retailer to use the
drop shipping option in case of a shortage during lead time. Khouja (2001) designed an optimal mix
strategy which captures the advantages of drop shipping and avoids many of its shortcomings.
Hovelaque et al. (2007) identified three inventory models, i.e., store-picking, warehouse-picking
and drop-shipping, in a dual-channel supply chain. Their analyses showed that without taking
transport costs and fixed costs into consideration, retailer profits in the store-picking or drop-
shipping models are greater than in the warehouse-picking scenario. Ayanso et al. (2006) studied a
threshold level inventory rationing policy where an e-retailer uses drop-shipping to fulfill the
stochastic demand of made-to-stock products. Randall et al. (2006) compared the effect of drop-
shipping with the traditional channel on firm’s performance, and studied the conditions when to
employ drop-shipping to fulfill orders.
There exists a rich literature on models of transshipment. Paterson et al. (2011) provided a
literature review which categorizes the research on lateral transshipment. Much of transshipment
literature focuses on two locations, see Rudi et al. (2001), Tagaras and Vlachos (2002), Zou et al.
(2010), and Hezarkhani and Kubiak (2010); multilocations, see Robinson (1990), Archibald et al.
(2009), Paterson et al. (2012), and Özdemir et al. (2013); and transshipment networks, see Lien et
al. (2011) and Yu et al. (2011). Rudi et al. (2001) studied a transshipment case of two locations being
individually owned and operated situation by two sellers, where a location has surplus stock and
another location is stocked out. They examined how transshipment affects the optimal inventory
orders at each location. Dong and Rudi (2004) discussed the effects of transshipment on
manufacturer and retailer, considering both exogenous and endogenous wholesale prices. Zhang
(2005) extended Dong and Rudi (2004) to general demand distributions, and studied the impact of
transshipment by comparing the adjusted demand with the normal distribution demand. Li and
Zhang (2012) studied a two-location inventory system with transshipment to obtain risk pooling,

5
and their results showed that the risk pooling improves the service levels at both locations. Netessine
and Rudi (2006) modeled the dual strategy as a noncooperative game among the retailers and the
wholesaler. They specified appropriate ranges of critical parameters to characterize situations in
which each of the three channels is preferable. Chen et al. (2012) explored a two-echelon supply
chain with one supplier and two retailers in two periods. They demonstrated that there exists a
unique optimal distribution policy for maximizing the overall expected profit of the supply chain,
and the transshipment benefits both supplier’s and retailers’ optimal expected profit. Belgasmi et al.
(2008) proposed a multiobjective model of multi-location transshipment problem, considering a
multi-location inventory system where inventory choices at each location are centrally coordinated.
The transshipment studies aforementioned are conducted in the noncapacitated context. Hu
et al. (2007) considered a two-location production/inventory model where each location makes
production decisions and is subject to uncertain capacity. They explored the conditions when
coordinating prices exist and the effects of demand and capacity variability on transshipment prices.
Yang and Qin (2007) studied the virtual lateral transshipment optimal control of a two-location
capacitated manufacturing plants model. They found that each plant should employ a modified base-
stock strategy to observe its own capacity, and the base level decreases in the other plant’s starting
inventory level. Hu et al. (2008) explored the effects of capacity uncertainty on the optimal joint
control of inventory and transshipment for a firm that produces in two locations. They characterized
the optimal production and transshipment policies and studied how the uncertain capacity leads to
counterintuitive behavior and inventory rationing policy. Özdemir et al. (2013) incorporated
replenishment capacity into the traditional lateral transshipment model. They analyzed the impact
of failing to fulfill all the replenishment orders on stocking locations’ performance. Their results
showed that the service level depends on capacity flexibility and transshipment flexibility. Our study
investigates the OTO supply chain model, which incorporates lateral transshipment and enriches
transshipment literature.
3. Model
Consider a dual-channel supply chain consisting of one manufacturer (m) and one retailer (r). The
manufacturer manages an e-store (e) to sell a product through direct channel and employs OTO

6
strategy to fulfill customer orders. The manufacturer produces the product at unit manufacturing
cost c and sells to the retailers at unit wholesale price w . The product is sold in both channels
at price p , every unsold unit has salvage value s , and every unit of unmet demand incurs penalty
cost l . The manufacturer gives the retailer a revenue share r for fulfilling every unit direct
channel’s order. We denote ( , )iD i r e , as the demand of store i for the product, with probability
distribution function (PDF) of ( )if , cumulative distribution function (CDF) of ( )iF which are
continuous and differentiable, on its support, respectively, and1( )iF as the inverse function. Since
all the customers receive the product from the retailer with the same selling price, it is reasonable
to assume there is no customer switching between the two channels, and rD and
eD are
independent (Dodd, 2001; Seifert et al., 2006; He et al., 2014). Table 2 lists the notations for key
parameters and variables in the model. We ignore the inventory holding cost and delivery cost,
which just bring extra parameters, but without introducing any additional insights. Figure 1
illustrates the typical OTO supply chain structures.
Manufacturer
Retailer
E-store Direct
Customers
Retail
Customers
Logistic flow Information flow
Figure 1. Online-to-Offline supply chain structures.
Table 2. Notations of key parameters and variables in the model.
Notation Definition
c unit manufacturing cost

7
w unit wholesale price
p unit selling price
r share (percent) of the revenue for OTO
s salvage value for unit of unsold stock
l penalty cost for unit unmet demand
unit transshipment price
ijT the transshipment quantities from store i’ inventory to store j’ , , , ,i j r e i j
iU the unsold stock quantity of store i
iV the unmet demand of store i
iD predicted market demand in store i
iQ inventory order level for store i , a decision variable
i
N expected profit of store i without transshipment in decentralized OTO supply chain
i
T expected profit of store i with transshipment in decentralized OTO supply chain
k expected profit of the whole OTO supply chain, , ,k N T C
To avoid trivialities, we present the following assumptions:
(a) 0 r p w . 0 r ensures the retailer participate in OTO and r p w ensures the
retailer still order from the manufacturer, i.e., retail profit is more than the revenue share in OTO
consignment.
(b) s c w p . s c rules out the manufacturer producing infinite amount, and s w
rules out the possibility of the retailer ordering infinite amount; c w for the manufacturer to be
beneficial and w p for the retailer to be beneficial.

8
(c) s p l r . The two terms ensure transshipment to be beneficial to both the retailer and
the manufacturer when they face inventory overage or underage, respectively.
3.1 Centralized OTO Supply Chain
In the centralized supply chain, the manufacturer owns both the brick-and-mortar retailer and e-
retailer which can be considered as a strategic alliance (e.g., Qumei, restaurant.com) or the retailer
owns a traditional retail channel and an e-retail channel (e.g., Gome, Suning). The decision maker
decides the optimal order quantity on the basis of total market demand to maximize the entire supply
chain profit. Define ( ) ,0x max x , the expected profit of the entire supply chain C is
( , ) ( ) ( )C pEmin D Q sE Q D lE D Q cQ (1)
wheree rD D D and
e rQ Q Q . Taking the first derivative of (1) with respect to Q , the
following expression holds.
( ) ( ) ( )C
pP D Q sP D Q lP D Q cQ
(2)
Letting (2) equal to zero and rearranging results, the optimal order quantity satisfies
* 1( )C
D
p l cQ F
p l s
(3)
where 1( )DF is the averse distribution function of total market demand D . The superscript “∗”
is used throughout the paper to indicate optimal parameter values.
3.2 Decentralized OTO Supply Chain without Transshipment
In this section, we assume there is no inventory transshipment between the two members in the
decentralized OTO supply chain. Their inventories are stored at the retailer’s, separately. Under no
transshipment, the retailer's and the manufacturer's expected profits are given by
[( )min( , ) ( ) ( ) ] ( )N N N N N N N
m e e e e e e r r eE p r D Q s Q D l D Q wQ c Q Q (4)

9
[ min( , ) min( , ) ( ) ( ) ]N N N N N N
r r r e e r r r r rE p D Q r D Q s Q D l D Q wQ (5)
From the results of newsvendor model, the optimal order quantities for the two channels can be
written as
*( )N
e e
p r l cF Q
p r l s
(6)
*( )N
r r
p l wF Q
p l s
(7)
Proposition 1. In a decentralized OTO supply chain without transshipment, the e-store's optimal
order quantity *N
eQ is decreasing in revenue share r , but irrelevant to the wholesale price w ; the
retailer’s optimal order quantity *N
rQ is decreasing in w , but has nothing to do with r .
All the proofs are given in the appendix.
Proposition 2. The total order quantity in decentralized OTO supply chain without transshipment
is less than that in centralized OTO supply chain. i.e, * * *N N C
e rQ Q Q .
Since * * *N N C
e rQ Q Q , there exists double marginalization in the decentralized OTO
supply chain without transshipment which results in that the total profits of the two parties do not
reach the full profit potential of a fully coordinated supply chain (Koulamas , 2006).
3.3 Decentralized OTO Supply Chain with Transshipment
In this section, we consider the scenario in which inventories can be transshipped between the two
members of supply chain. When one party is stockout, he/she can use the inventories of another
party if another party has surplus inventories. The transshipment quantity from store i’ inventory
to store j’ is (( ) , ( ) )ij i i j jT min Q D D Q , where ( , ) {( , ), ( , )}i j e r r e . The unsold stock
is (( ) ( ) )i i i j jU Q D D Q and the unmet demand is (( ) ( ) )i i i j jV D Q Q D . The
six scenarios of two channels’ demands are depicted in Figure 2.

10
rD
eD
r eQ Q
rQ
eQ
r eQ Q
13 2
4
5 6
0
Figure 2. Six possible scenarios of the demand space ,r eD D .
The expected profit functions of the manufacturer and the retailer in an OTO supply chain
with transshipment can be expressed as
( , ) [( )min( , ) ( ) ] ( )T T T T T T T
m e r e e er re e e r r eQ Q E p r D Q T p r T sU lV wQ c Q Q (8)
( , ) [ min( , ) min( , ) ( ) ( ) ]T T T T T T
r r e r r e e re er r r rQ Q E p D Q r D Q r T p T sU lV wQ (9)
The two members make inventory decisions to maximum their own profit, so we first take the
derivative of the expected profits in (8) with respect to T
eQ , and obtain
1 4 2 3 5 6( ) ( ) ( ) ( )T
m
T
e
P sP p r l P cQ
(10)
The above equation provides the expected marginal profitability of increasing the inventory
ordering level for store e . The first term represents that, in Scenario 1 , the marginal revenue of
increasing the inventory level is when store e ’s inventory overage is all used to fill store r ’s
inventory underage without leftover; while in Scenario 4 , marginal unit of store e ’s inventory
can reduce opportunity cost of transshipment from store r . The second term denotes store e ’s
inventory overage is used to satisfy store r ’s inventory underage but still has leftover. Marginal
unit of inventory incurs salvage value s . The third term means that the marginal unit of store e ’s

11
inventory yields p r revenue and reduces l opportunity loss when either 5 or
6
happens. At last, the marginal cost of increasing inventory stock is the cost of the product c .
Taking the derivative of the expected profits in (9) with respect to T
rQ , yields the expected
marginal profit of an additional unit inventory at store r
r1 6 2 5 3 4( ) ( ) ( ) ( ) ( ) ( )
T
T
r
p l P P r P sP wQ
(11)
The meaning of Equation (11) closely follows (10). We denote ( ) ( )i i i iQ P D Q ,
( , ) ( )i i j i j j i iQ Q P Q Q D D Q and ( , ) ( )i i j i i i j jQ Q P Q D Q Q D , and present
the descriptions and probabilities of the six demand areas in Table 3.
Table 3. Descriptions of six scenarios and corresponding probabilities.
Scenario Demand area description Probability
1 r e r e eQ Q D D Q ( , )e e rQ Q
2 r r r e eQ D Q Q D ( , )r r eQ Q
3 D ,r r e eQ D Q ( ) ( , ) ( , )e e e e r r r eQ Q Q Q Q
4 e e r e rQ D Q Q D ( , )e e rQ Q
5 r e e r rQ Q D D Q ( , )r r eQ Q
6 D ,r r e eQ D Q 1 ( ) ( , ) ( , )r r e e r r r eQ Q Q Q Q
From the definition in Table 2, we know
2 3 4( ) ( , ) ( , ) ( ) ( , ) ( , ) ( )r r r r e r r e e e e e r e e rQ Q Q Q Q Q Q Q Q Q P .
After substituting the equations in Table 2 into the first-order conditions of Equations (10)
and (11), and rearranging, we obtain
( ) ( , ) ( , )T T T T T
e e e e r e e r
p l r c s p l rF Q Q Q Q Q
p l r s p l r s p l r s
(12)
12
( ) ( , ) ( , )T T T T T
r r r r e r r e
p l w r s p lF Q Q Q Q Q
p l s p l s p l s
(13)
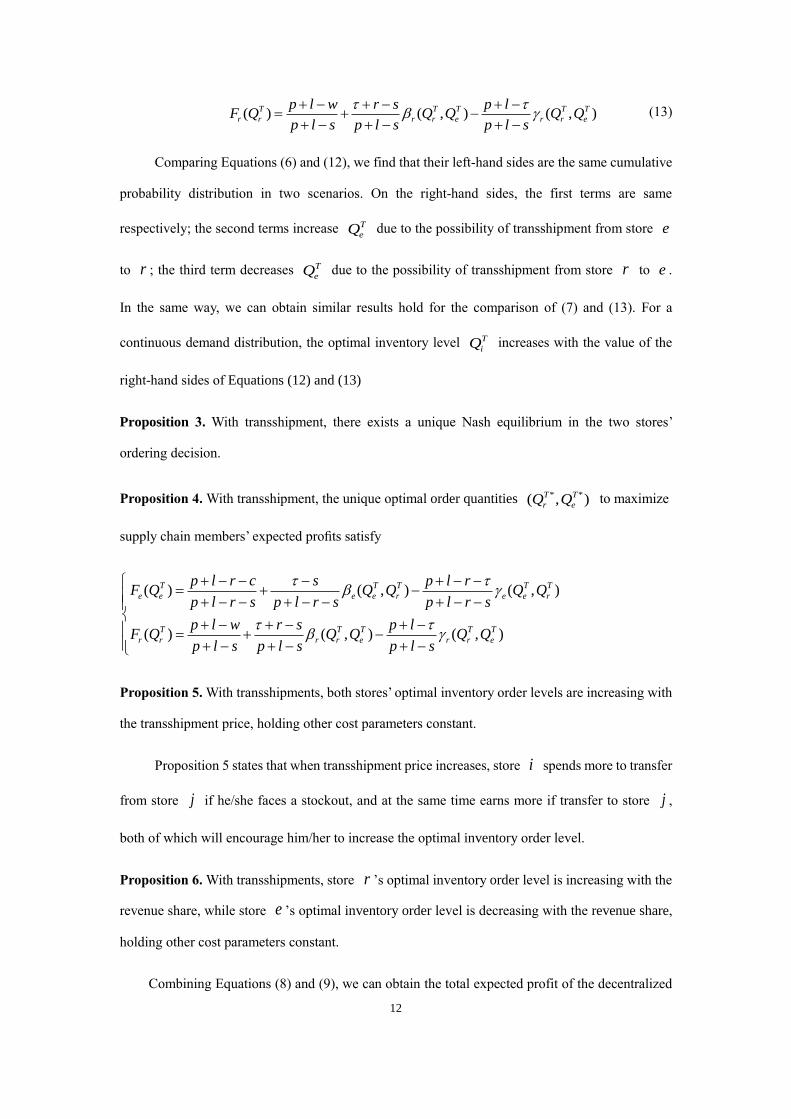
Comparing Equations (6) and (12), we find that their left-hand sides are the same cumulative
probability distribution in two scenarios. On the right-hand sides, the first terms are same
respectively; the second terms increase T
eQ due to the possibility of transshipment from store e
to r ; the third term decreases T
eQ due to the possibility of transshipment from store r to e .
In the same way, we can obtain similar results hold for the comparison of (7) and (13). For a
continuous demand distribution, the optimal inventory level T
iQ increases with the value of the
right-hand sides of Equations (12) and (13)
Proposition 3. With transshipment, there exists a unique Nash equilibrium in the two stores’
ordering decision.
Proposition 4. With transshipment, the unique optimal order quantities * *( , )T T
r eQ Q to maximize
supply chain members’ expected profits satisfy
( ) ( , ) ( , )
( ) ( , ) ( , )
T T T T T
e e e e r e e r
T T T T T
r r r r e r r e
p l r c s p l rF Q Q Q Q Q
p l r s p l r s p l r s
p l w r s p lF Q Q Q Q Q
p l s p l s p l s
Proposition 5. With transshipments, both stores’ optimal inventory order levels are increasing with
the transshipment price, holding other cost parameters constant.
Proposition 5 states that when transshipment price increases, store i spends more to transfer
from store j if he/she faces a stockout, and at the same time earns more if transfer to store j ,
both of which will encourage him/her to increase the optimal inventory order level.
Proposition 6. With transshipments, store r ’s optimal inventory order level is increasing with the
revenue share, while store e ’s optimal inventory order level is decreasing with the revenue share,
holding other cost parameters constant.
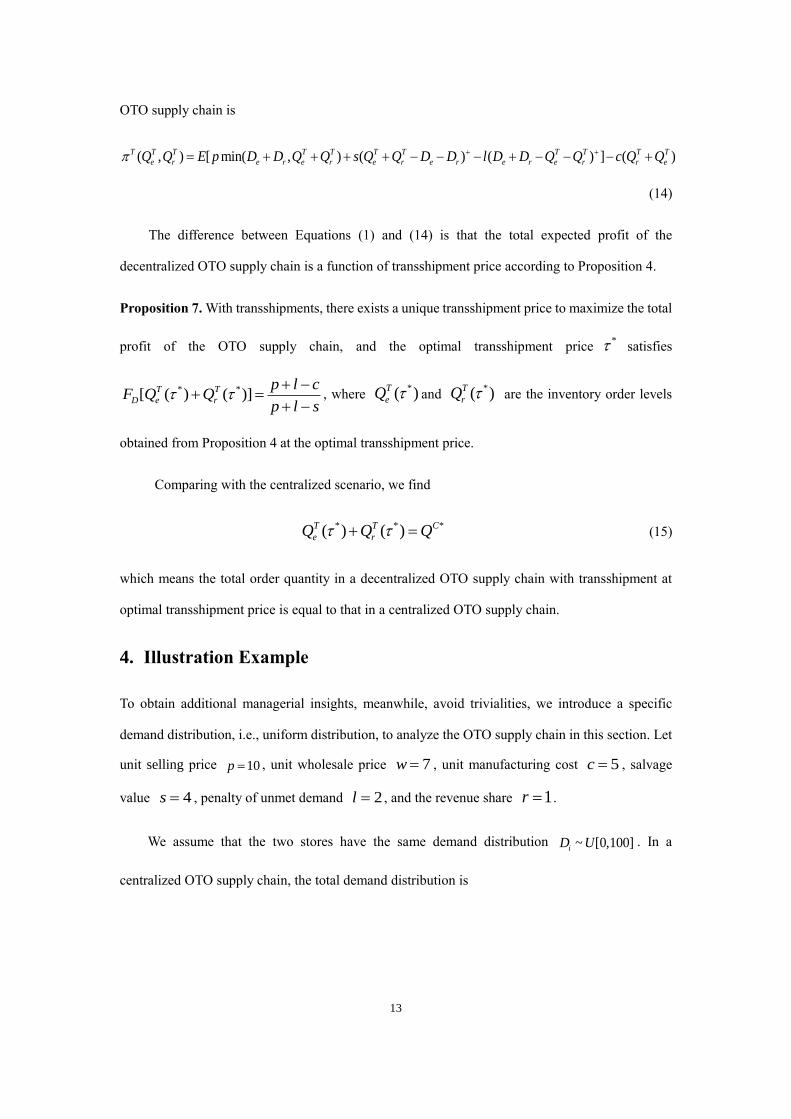
Combining Equations (8) and (9), we can obtain the total expected profit of the decentralized
13
OTO supply chain is
( , ) [ min( , ) ( ) ( ) ] ( )T T T T T T T T T T T
e r e r e r e r e r e r e r r eQ Q E p D D Q Q s Q Q D D l D D Q Q c Q Q
(14)
The difference between Equations (1) and (14) is that the total expected profit of the
decentralized OTO supply chain is a function of transshipment price according to Proposition 4.
Proposition 7. With transshipments, there exists a unique transshipment price to maximize the total
profit of the OTO supply chain, and the optimal transshipment price* satisfies
* *[ ( ) ( )]T T
D e r
p l cF Q Q
p l s
, where
*( )T
eQ and *( )T
rQ are the inventory order levels
obtained from Proposition 4 at the optimal transshipment price.
Comparing with the centralized scenario, we find
* * *( ) ( )T T C
e rQ Q Q (15)
which means the total order quantity in a decentralized OTO supply chain with transshipment at
optimal transshipment price is equal to that in a centralized OTO supply chain.
4. Illustration Example
To obtain additional managerial insights, meanwhile, avoid trivialities, we introduce a specific
demand distribution, i.e., uniform distribution, to analyze the OTO supply chain in this section. Let
unit selling price 10p , unit wholesale price 7w , unit manufacturing cost 5c , salvage
value 4s , penalty of unmet demand 2l , and the revenue share 1r .
We assume that the two stores have the same demand distribution ~ [0,100]iD U . In a
centralized OTO supply chain, the total demand distribution is

14
2
2
1 0 100
20000
( ) 1 1( 200 10000) 100 200
10000 2
1
D
d if d
F dd d if d
otherwise
The probabilities defined in decentralized OTO supply chain are presented as follows
1 0 100
( ) ( ) 100
1
i i
i i i i
Q if QF Q Q
otherwise
2
2
1 1(100 ) 0< 100
10000 2
( , ) 1(100 ) 100 100
20000
0
i i j i j i
i i jj i j
Q QQ Q if Q Q
Q QQ if Q Q
otherwise
2
2
1 0< 100
20000
1(100 )(2 100) 100 100
20000( , )
1[(100 )(2 100)
20000
( 100) ] 100 200
j j i
i j i i j
i i j
i j i
j j i
Q if Q Q
Q Q Q if Q Q
Q QQ Q Q
Q if Q Q
0 otherwise
From the previous section, it is easy to know the transshipment price has an influence on
the inventory order levels of each store. We vary transshipment price from 4 to 12. Note that
according to the assumptions and set of parameters, we know 4 11 , thus 4 , 11 ,
12 are only employed for the sake of comparison. Figures 3(a) -3(f) present the inventory
order level response functions for the two stores, respectively.
0 20 40 60 80 100
0
20
40
60
80
100
Qr
Qe
Qr(Q
e)
Qe(Q
r)
0 20 40 60 80 1000
20
40
60
80
100
Qr
Qe
Qe(Q
r)
Qr(Q
e)

15
Fig. 3(a) Order level response functions with 4 Fig. 3(b) Order level response functions with 6
Fig. 3(c) Order level response functions with 8 Fig. 3(d) Order level response functions with 10
Fig. 3(e) Order level response functions with 11 Fig. 3(f) Order level response functions with 12
Observation 1. The inventory order level response function ( )i jQ Q is a decreasing function.
When transshipment price is low, ( )i jQ Q is concave; when jQ is large, ( )i jQ Q is convex.
The reasons for Observation 1 are as follows. When store j increases inventory order level,
it reduces the possibility of transshipment from store i , and store i can transfer from store j in
case of stockout, thus there is no necessary for store i to increase inventory order level. Especially
when the transshipment price is low, store i will decrease more order quantity and vice versa.
Observation 2. There exists a unique intersection of ( )i jQ Q and ( )j iQ Q .
0 20 40 60 80 1000
20
40
60
80
100
Qr
Qe
Qe(Q
r)
Qr(Q
e)
0 20 40 60 80 1000
20
40
60
80
100
Qr
Qe
Qe(Q
r)
Qr(Q
e)
0 20 40 60 80 1000
20
40
60
80
100
Qr
Qe
Qe(Q
r)
Qr(Q
e)
0 20 40 60 80 1000
20
40
60
80
100
Qr
Qe
Qr(Q
e)
Qe(Q
r)
16
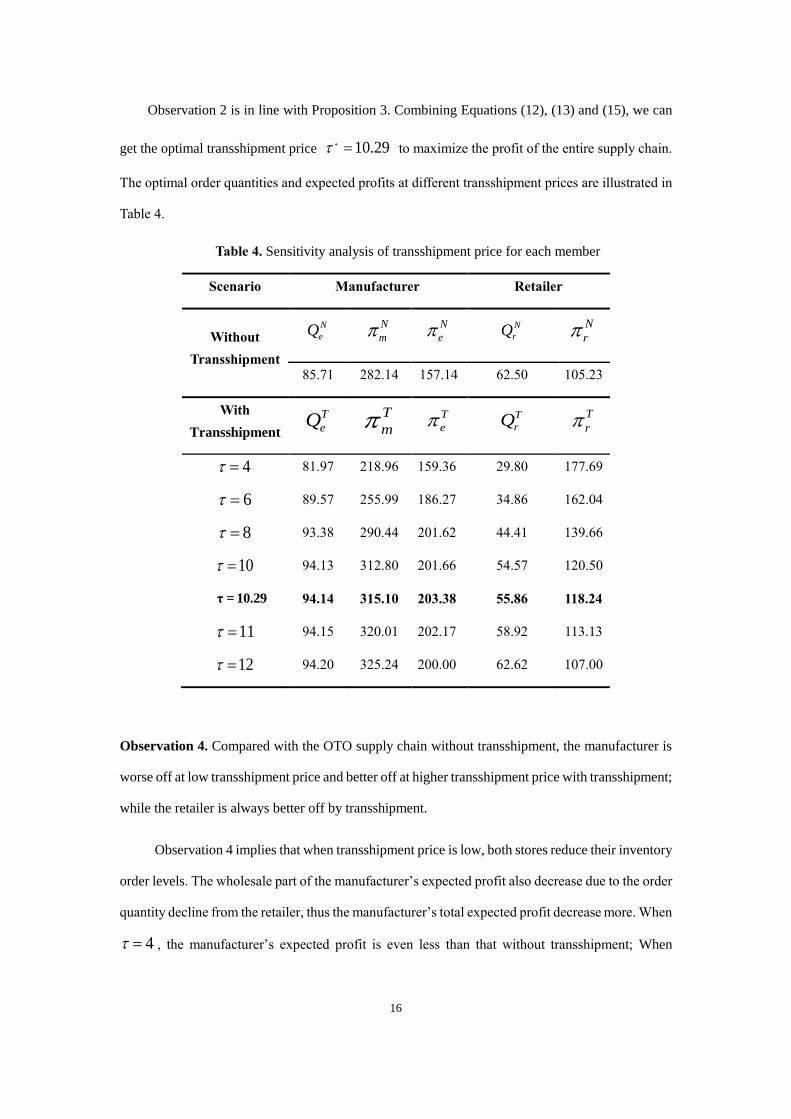
Observation 2 is in line with Proposition 3. Combining Equations (12), (13) and (15), we can
get the optimal transshipment price * 10.29 to maximize the profit of the entire supply chain.
The optimal order quantities and expected profits at different transshipment prices are illustrated in
Table 4.
Table 4. Sensitivity analysis of transshipment price for each member
Scenario Manufacturer Retailer
Without
Transshipment
N
eQ N
m N
e N
rQ N
r
85.71 282.14 157.14 62.50 105.23
With
Transshipment
T
eQ T
m T
e T
rQ T
r
4 81.97 218.96 159.36 29.80 177.69
6 89.57 255.99 186.27 34.86 162.04
8 93.38 290.44 201.62 44.41 139.66
10 94.13 312.80 201.66 54.57 120.50
τ = 10.29 94.14 315.10 203.38 55.86 118.24
11 94.15 320.01 202.17 58.92 113.13
12 94.20 325.24 200.00 62.62 107.00
Observation 4. Compared with the OTO supply chain without transshipment, the manufacturer is
worse off at low transshipment price and better off at higher transshipment price with transshipment;
while the retailer is always better off by transshipment.
Observation 4 implies that when transshipment price is low, both stores reduce their inventory
order levels. The wholesale part of the manufacturer’s expected profit also decrease due to the order
quantity decline from the retailer, thus the manufacturer’s total expected profit decrease more. When
4 , the manufacturer’s expected profit is even less than that without transshipment; When
17
11 and 12 , both parties’ expected profits begin to decrease, even though their inventory
order levels increase, which is in accordance with our assumption, i.e., s p l s .
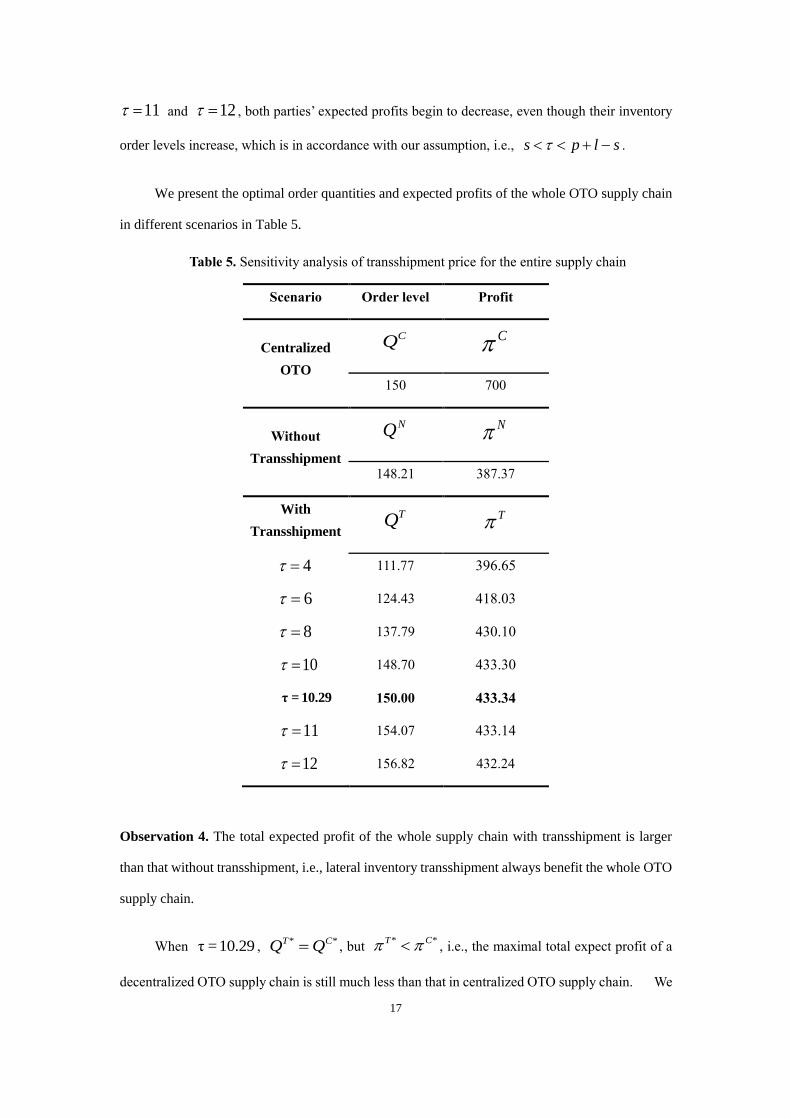
We present the optimal order quantities and expected profits of the whole OTO supply chain
in different scenarios in Table 5.
Table 5. Sensitivity analysis of transshipment price for the entire supply chain
Scenario Order level Profit
Centralized
OTO
CQ C
150 700
Without
Transshipment
NQ N
148.21 387.37
With
Transshipment
TQ T
4 111.77 396.65
6 124.43 418.03
8 137.79 430.10
10 148.70 433.30
τ = 10.29 150.00 433.34
11 154.07 433.14
12 156.82 432.24
Observation 4. The total expected profit of the whole supply chain with transshipment is larger
than that without transshipment, i.e., lateral inventory transshipment always benefit the whole OTO
supply chain.
When τ =10.29 , * *T CQ Q , but
* * T C, i.e., the maximal total expect profit of a
decentralized OTO supply chain is still much less than that in centralized OTO supply chain. We

18
then vary the revenue share r , holding the transshipment price 8 and other parameters
constant. Tables 6 and 7 present the optimal inventory order levels and expected profits.
Table 6. Sensitivity analysis of revenue share for each member
Scenario Manufacturer Retailer
Without
Transshipment
N
eQ N
m N
e N
rQ N
r
85.71 282.14 157.14 62.50 105.23
With
Transshipment
T
eQ T
m T
e T
rQ T
r
0.5r 93.76 315.16 226.66 44.25 118.43
1r 93.38 290.44 201.62 44.41 139.66
1.5r 92.94 266.16 176.96 44.60 164.35
2r 92.45 240.82 151.18 44.82 189.00
2.5r 91.87 216.52 126.34 45.09 213.57
Table 7. Sensitivity analysis of revenue share for the entire supply chain
Scenario Order level Profit
Centralized
OTO
CQ C
150 700
Without
Transshipment
NQ N
148.21 387.37
With
Transshipment
TQ T
0.5r 138.01 433.59
1r 137.79 430.10
1.5r 137.54 430.51
2r 137.27 429.82

19
2.5r 136.96 430.09
Observation 5. The retailer’s expected profit with transshipment increases with the revenue share
and the manufacturer’s expected profit with transshipment decreases with the revenue share.
However, they are both better off than that without transshipment.
Our results show that revenue share can coordinate the OTO supply chain and reallocate the
total profit. The optimal revenue share depends on the dominant bargaining power of both parties.
Since retail is the main source of both stores’ expected profits, revenue share has only a small effect
on the optimal inventory order levels, irrespective of other parameters.
Observation 6. Compared with centralized OTO supply chain, the total expected profit is always
less in a decentralized OTO supply chain with/without transshipment.
This phenomenon can be attributed to the double marginalization, which demonstrates
Proposition 2. In reality, it costs a lot to manage a brick-and-mortar store, e.g., administrative cost,
rental cost and human resource cost. Consider these costs as C , the manufacturer needs to weigh
C C and T
m , and decides whether to employ centralized or decentralized OTO supply chain.
5. Conclusions
This paper studies a new e-commercial model, i.e., Online-to-Offline, in dual-channel supply
chain. To reduce the inventory risk caused by demand uncertainty of each channel, we employ lateral
inventory transshipment between the e-store and brick-and-mortar store. Since all the inventories
are deposited in the brick-and-mortar store’s warehouse, there exists no transshipment cost and it is
much more convenient to carry out the transshipment. We model the centralized OTO and
decentralized OTO with/without inventory transshipment.
We then adopt uniform demand distribution to obtain more managerial insights. We find that
transshipment can always benefit the supply chain, and revenue share r reallocates the total
expected profit, but has a small effect on the inventory order levels of both channels. There exists a
unique transshipment price to maximize the profit of the entire supply chain. Our conclusions can

20
also be applied to general demand distribution and the cases with correlative demands, which just
brings trivialities and there is no more insights.
There are some interesting and important issues can be studied for future research. For example,
we can consider multiple retailers, in which the manufacturer can choose other retailers to deliver
when he faces a stockout in the nearest retailer, instead of transshipment, if the transshipment price
is high. Another future research area might also explore the difference lateral transshipment prices
between the two channels in OTO supply chain. Finally, it would be interesting to study the different
channel prices with customer switching in OTO supply chain.
Appendix
Proof of Proposition 1.
Since ( )iF is an increasing function on its support, the two conclusions of Proposition 1 can be
easily obtained from Equations (6) and (7).
Proof of Proposition 2.
From the property of inverse function , we obtain 1 1( ) ( )e e
p r l c p l cF F
p r l s p l s
and
1 1( ) ( )r r
p l w p l cF F
p l s p l s
, thus
11 1 1 1( ) ( ) ( ) ( ) ( )e r e r D
p r l c p l w p l c p l c p l cF F F F F
p r l s p l s p l s p l s p l s
, i.e.,
* * *N N C
e rQ Q Q .
Proof of Proposition 3.
Substituting the definitions in Table 2 into Equations (10) and (11), we can obtain
( ) ( ) ( ) ( , ) ( ) ( , )T
me e e e r e e rT
e
p l s r Q s Q Q p l r Q Q p l c rQ
( ) ( ) ( ) ( , ) ( ) ( , )T
rr r r r e r r eT
r
p l s Q r s Q Q p l Q Q p l wQ

21
As we define, the functions ( )i iQ , ( , )i i jQ Q and ( , )i i jQ Q are continuous and
differentiable in iQ and
jQ . We denote the marginal probabilities as the first column in Table 8,
thus the results in the second column hold (Rudi et al. 2001).
Table 8. The definitions of the marginal probabilities and the corresponding results
Definitions Results
( )ii D ig f Q i
i
i
gQ
1 ( ) ( )i j i i
ij i i i jD D D Qm P D Q f Q Q
1 2i
ij ij
i
m mQ
2 ( ) ( )i i j i j
ij i j i j iD D D Q Qm P D D Q Q f Q
1i
ij
j
mQ
1 ( ) ( )i j i j
ij i i i jD D D Qn P D Q f Q Q
1 2i
ij ij
i
n nQ
2 ( ) ( )i i j i j
ij i j i j iD D D Q Qn P D D Q Q f Q
1i
ij
j
nQ
Taking the second orders of the expected profits functions with respect to T
eQ and T
rQ ,
respectively, and substituting the definitions in Table 3 into the results, yields
21 2 1 2
2( ) ( )( ) ( )( )
( )
T
me er er er erT
e
p l s r g s m m p l r n nQ
21 2 1 2
2( ) ( )( ) ( )( )
( )
T
rr re re re reT
r
p l s g r s m m p l n nQ
Given the parameter assumptions and definitions, it is easy to check that
2
20
( )
T
m
T
eQ
and
2
20
( )
T
r
T
rQ
. Given store i ’s inventory level
T
iQ , T
j is concave in T
jQ ( , , ; )i j r e i j .
Thus there exists a unique Nash equilibrium solution.
Proof of Proposition 4.
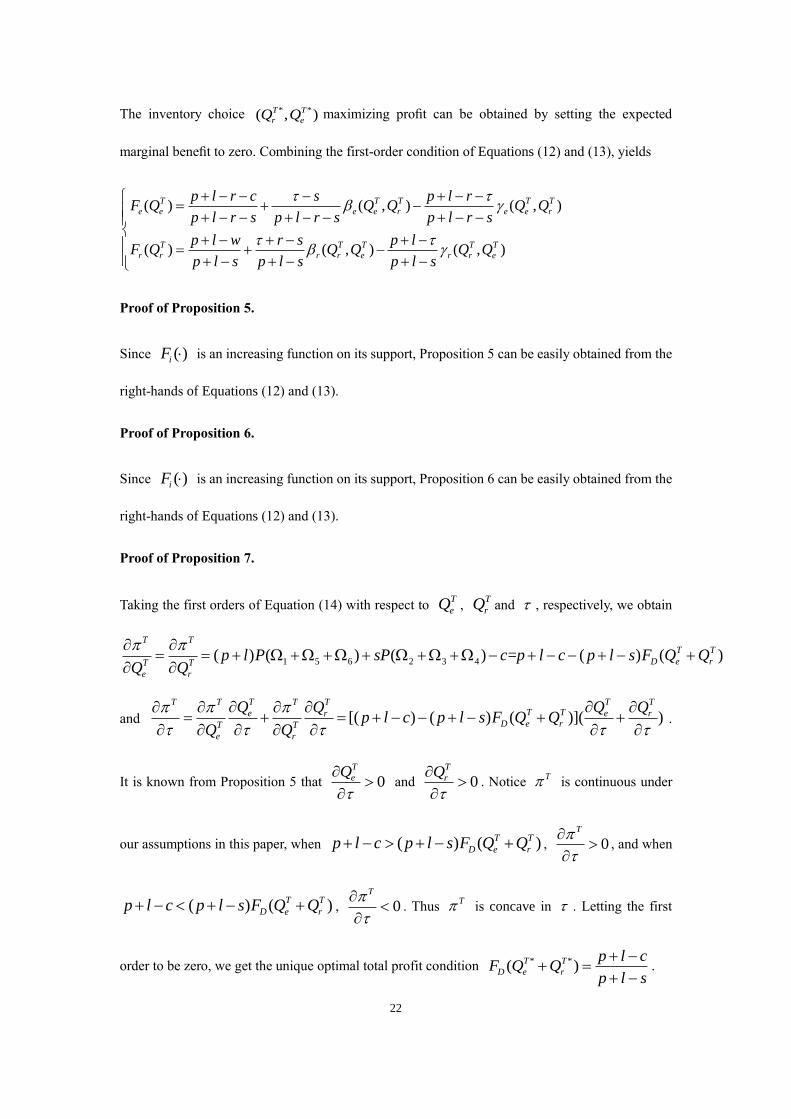
22
The inventory choice * *( , )T T
r eQ Q maximizing profit can be obtained by setting the expected
marginal benefit to zero. Combining the first-order condition of Equations (12) and (13), yields
( ) ( , ) ( , )
( ) ( , ) ( , )
T T T T T
e e e e r e e r
T T T T T
r r r r e r r e
p l r c s p l rF Q Q Q Q Q
p l r s p l r s p l r s
p l w r s p lF Q Q Q Q Q
p l s p l s p l s
Proof of Proposition 5.
Since ( )iF is an increasing function on its support, Proposition 5 can be easily obtained from the
right-hands of Equations (12) and (13).
Proof of Proposition 6.
Since ( )iF is an increasing function on its support, Proposition 6 can be easily obtained from the
right-hands of Equations (12) and (13).
Proof of Proposition 7.
Taking the first orders of Equation (14) with respect to T
eQ , T
rQ and , respectively, we obtain
1 5 6 2 3 4( ) ( ) ( ) = ( ) ( )T T
T T
D e rT T
e r
p l P sP c p l c p l s F Q QQ Q
and [( ) ( ) ( )]( )T TT TT T T
T Te er rD e rT T
e r
Q QQ Qp l c p l s F Q Q
Q Q
.
It is known from Proposition 5 that 0T
eQ
and 0
T
rQ
. Notice
T is continuous under
our assumptions in this paper, when ( ) ( )T T
D e rp l c p l s F Q Q , 0T
, and when
( ) ( )T T
D e rp l c p l s F Q Q , 0T
. Thus
T is concave in . Letting the first
order to be zero, we get the unique optimal total profit condition * *( )T T
D e r
p l cF Q Q
p l s
.
23
Reference
Archibald T W, Black D, Glazebrook K D. 2009. An index heuristic for transshipment decisions in
multi-location inventory systems based on a pairwise decomposition[J]. European Journal of
Operational Research, 192(1): 69-78.
Ayanso A, Diaby M, Nair S K. 2006. Inventory rationing via drop-shipping in Internet retailing: A
sensitivity analysis[J]. European Journal of Operational Research, 171(1): 135-152.
Belgasmi N, Said L B, Ghédira K. 2008. Evolutionary multiobjective optimization of the multi-
location transshipment problem[J]. Operational Research, 8(2): 167-183.
Chen K Y, Kaya M, Özer Ö. 2008. Dual sales channel management with service competition[J].
Manufacturing & Service Operations Management, 10(4): 654-675.
Chen, X., Hao, G., Li, X., Yiu, K. F. C. 2012. The impact of demand variability and transshipment
on vendor's distribution policies under vendor managed inventory strategy. International Journal
of Production Economics, 139(1), 42-48.
Chiang W K, Chhajed D, Hess J D. 2003. Direct marketing, indirect profits: A strategic analysis of
dual-channel supply-chain design[J]. Management science, 49(1): 1-20.
Dodd, D., 2001. Tesco corners the online grocery market. Financial Times, San Francisco, Feb 1.
Dong L, Rudi N. 2004. Who benefits from transshipment? Exogenous vs. endogenous wholesale
prices[J]. Management Science, 50(5): 645-657.
Gan X, Sethi S P, Zhou J. 2010. Commitment-penalty contracts in drop-shipping supply chains with
asymmetric demand information[J]. European Journal of Operational Research, 204(3): 449-
462.
He Y, Zhang P, Yao Y. 2014. Unidirectional transshipment policies in a dual-channel supply chain[J].
Economic Modelling, 40: 259-268.
Hezarkhani B, Kubiak W. 2010. A coordinating contract for transshipment in a two-company supply
chain[J]. European Journal of Operational Research, 207(1): 232-237.
Hovelaque V, Soler L G, Hafsa S. 2007. Supply chain organization and e-commerce: a model to
analyze store-picking, warehouse-picking and drop-shipping[J]. 4OR, 5(2): 143-155.
Hu X, Duenyas I, Kapuscinski R. 2007. Existence of coordinating transshipment prices in a two-
location inventory model[J]. Management Science, 53(8): 1289-1302.
Hu X, Duenyas I, Kapuscinski R. 2008. Optimal joint inventory and transshipment control under
uncertain capacity[J]. Operations Research, 56(4): 881-897.

24
Huang S, Yang C, Zhang X. 2012. Pricing and production decisions in dual-channel supply chains
with demand disruptions[J]. Computers & Industrial Engineering, 62(1): 70-83.
Khouja M. 2001. The evaluation of drop shipping option for e-commerce retailers[J]. Computers &
industrial engineering, 41(2): 109-126.
Khouja M, Stylianou A C. 2009. A (Q, R) inventory model with a drop-shipping option for e-
business[J]. Omega, 37(4): 896-908.
Koulamas C. 2006. A Newsvendor Problem with Revenue Sharing and Channel Coordination[J].
Decision Sciences, 37(1): 91-100.
Li M, Zhang J. 2012. Does inventory pooling improve customer service levels? [J]. Operations
Research Letters, 40(2): 96-98.
Lien, R. W., Iravani, S. M., Smilowitz, K., Tzur, M. 2011. An efficient and robust design for
transshipment networks. Production and Operations Management, 20(5), 699-713.
Netessine S, Rudi N. 2006. Supply chain choice on the internet[J]. Management Science, 52(6):
844-864.
Özdemir D, Yücesan E, Herer Y T. 2013. Multi-location transshipment problem with capacitated
production[J]. European Journal of Operational Research, 226(3): 425-435.
Paterson C, Kiesmüller G, Teunter R, Glazebrook, K. 2011. Inventory models with lateral
transshipments: A review[J]. European Journal of Operational Research, 210(2): 125-136.
Paterson C, Teunter R, Glazebrook K. 2012. Enhanced lateral transshipments in a multi-location
inventory system[J]. European Journal of Operational Research, 221(2): 317-327.
Rabinovich E, Rungtusanatham M, Laseter T M. 2008. Physical distribution service performance
and internet retailer margins: The drop-shipping context[J]. Journal of Operations Management,
26(6): 767-780.
Randall T, Netessine S, Rudi N. 2006. An empirical examination of the decision to invest in
fulfillment capabilities: A study of Internet retailers[J]. Management Science, 52(4): 567-580.
Robinson L W. 1990. Optimal and approximate policies in multiperiod, multilocation inventory
models with transshipments[J]. Operations Research, 38(2): 278-295.
Rudi N, Kapur S, Pyke D F. 2001. A two-location inventory model with transshipment and local
decision making[J]. Management science, 47(12): 1668-1680.
Seifert R W, Thonemann U W, Sieke M A. 2006. Relaxing channel separation: Integrating a virtual
store into the supply chain via transshipments[J]. Iie Transactions, 38(11): 917-931.

25
Tagaras G, Vlachos D. 2002. Effectiveness of stock transshipment under various demand
distributions and nonegligible transshipment times [J]. Production and Operations Management,
11(2): 183-198.
Tsay A A, Agrawal N. 2004. Channel Conflict and Coordination in the E-Commerce Age[J].
Production and Operations Management, 13(1): 93-110.
Yao D Q, Kurata H, Mukhopadhyay S K. 2008. Incentives to reliable order fulfillment for an Internet
drop-shipping supply chain[J]. International Journal of Production Economics, 113(1): 324-334.
Yang J, Qin Z. 2007. Capacitated production control with virtual lateral transshipments[J].
Operations research, 55(6): 1104-1119.
Yu D Z, Tang S Y, Niederhoff J. 2011. On the benefits of operational flexibility in a distribution
network with transshipment[J]. Omega, 39(3): 350-361.
Zhang J. 2005. Transshipment and its impact on supply chain members’ performance[J].
Management Science, 51(10): 1534-1539.
Zou L, Dresner M, Windle R. 2010. A two-location inventory model with transshipments in a
competitive environment[J]. International Journal of Production Economics, 125(2): 235-250.