LAST HIRED, FIRST FIRED? BLACK-WHITE - UCSC …rfairlie/papers/published/demography 2010... · LAST...
22
-
Upload
nguyenlien -
Category
Documents
-
view
213 -
download
0
Transcript of LAST HIRED, FIRST FIRED? BLACK-WHITE - UCSC …rfairlie/papers/published/demography 2010... · LAST...


LAST HIRED, FIRST FIRED? BLACK-WHITE UNEMPLOYMENT AND THE BUSINESS CYCLE*
KENNETH A. COUCH AND ROBERT FAIRLIE
Studies have tested the claim that blacks are the last hired during periods of economic growth and the fi rst fi red in recessions by examining the movement of relative unemployment rates over the business cycle. Any conclusion drawn from this type of analysis must be viewed as tentative because cyclical movements in the underlying transitions into and out of unemployment are not examined. Using Current Population Survey data matched across adjacent months from 1989–2004, this article provides the fi rst detailed examination of labor market transitions for prime-age black and white men to test the last hired, fi rst fi red hypothesis. Considerable evidence is presented that blacks are the fi rst fi red as the business cycle weakens. However, no evidence is found that blacks are the last hired. Instead, blacks appear to be initially hired from the ranks of the unemployed early in the business cycle and later are drawn from nonparticipation. The narrowing of the racial unemployment gap near the peak of the business cycle is driven by a reduction in the rate of job loss for blacks rather than increases in hiring.
he unemployment rate among blacks in the United States has been roughly double that of whites for several decades. In the period from 1972 to 2004, the average rate of unem-ployment was 12.4% for black males versus 5.4% for whites. The ratio of these two rates, 2.3, is consistent with the observation that unemployment among blacks typically doubles that of whites.1 The stability of this unemployment ratio has been noted (Smith, Vanski, and Holt 1974; Welch 1990) as an anomaly that stands in contrast to measured increases in relative black wages observed in the past three decades (Couch and Daly 2002, 2005; Welch 2003).2 Many have conjectured that the relative constancy of the difference in black and white unemployment is due to minorities being the last hired and fi rst fi red over the business cycle (Barrett and Morgenstern 1974; Bradbury 2000; Browne 1997; Freeman 1973; Harrington 1962).
In Richard Freeman’s (1973) classic study of racial patterns of labor market status from 1947 to 1972, he found that the level of employment for blacks was more volatile than for whites with respect to business cycle conditions. He also found that rates of unemployment for blacks and whites had similar proportionate responses to changes in the business cycle. Thus, when the economy weakens, the unemployment rate for blacks rises more than that for whites in percentage points. Freeman (1973:77) concluded that these fi ndings support “the widely asserted last in, fi rst out pattern of black employment over the cycle.”3
*Kenneth A. Couch, University of Connecticut, Department of Economics, Storrs, CT 06269; e-mail: [email protected]. Robert Fairlie, University of California, Department of Economics, Santa Cruz, CA 95604; e-mail: [email protected]. We thank David Card and seminar participants at the University of Connecticut, Cornell University, the Federal Reserve Bank of San Francisco, the 2005 Society of Labor Economists Meetings, and Wesleyan University for helpful comments. Daniel Beltran and Oded Gurantz provided excellent research assistance.
1. The 2-to-1 ratio of black-to-white unemployment rates began in the 1950s and was small or nonexistent from 1880 to 1940 (Fairlie and Sundstrom 1997, 1999).
2. In 2004, median weekly earnings of black workers had risen to 80% of those of whites (U.S. Bureau of Labor Statistics 2004).
3. Freeman (1973) also noted that focusing on the relationship between the black-white ratio in unemploy-ment rates and the business cycle can be misleading. For example, a constant black-white unemployment rate ratio moving from an economic expansion to a recession when both unemployment rates are rising implies that a much higher percentage of blacks than whites lose their jobs. In contrast, a constant black-white difference in unemployment rates implies that the same percentage of blacks and whites lose their jobs. (For more discussion, see Bradbury 2000; and Freeman 1973.) Thus, we focus here on differences in unemployment rates instead of the ratio.
Demography, Volume 47-Number 1, February 2010: 227–247 227
T

228 Demography, Volume 47-Number 1, February 2010
The last hired, fi rst fi red hypothesis relates fundamentally to the idea that transitions of blacks into employment should be procyclical: as the economy grows, the rate of tran-sition into employment for blacks should rise relative to that for whites, becoming most pronounced at the end of the expansion. Similarly, the rate at which blacks become un-employed should be countercyclical: as the economy worsens, their rate of transition into unemployment should rise relative to that for whites and be most pronounced during the worst conditions.
The racial differences in rates of transition across different labor market states exam-ined in this article are fundamentally related to the well-being of individuals. If the average member of a minority group always faces a larger chance of being laid off and those odds increase whenever the economy slows, then undeniably, his or her situation has worsened. Concerns about the potential impact of discrimination on individuals as well as its role in reducing economic effi ciency each provide motivations for this study.
Importantly, studies of the business cycle and the relative employment status of blacks, including Freeman’s, have primarily examined the movement of static measures relative to demand (Borjas 2006; Bound and Freeman 1991; Bradbury 2000; Clark and Summers 1981; Freeman 1991; Freeman and Rodgers 1999; Hines, Hoynes, and Krueger 2001; Hol-zer and Offner 2001; Hoynes 1999). However, changes over time in the level of a static measure of labor force status, such as the unemployment rate, do not reveal underlying sources of fl uctuations, which are fundamentally caused by changes in transition rates into and out of the state.
In this article, we examine detailed labor market transitions for black and white men over the business cycle using matched monthly observations for individuals from Current Population Survey (CPS) data from 1989 to 2004. Badgett (1994) fi rst studied this issue in her examination of the transitions of black and white men and women between employment and unemployment using published monthly data. As the CPS observations are matched, the relationship between detailed information on individual characteristics and transitions can be estimated. To our knowledge, the only previous research that has explored differ-ences in employment transitions and has related these to movements of steady-state stocks of labor force aggregates over time, other than Badgett’s (1994), focused on gender and age (Abraham and Shimer 2001; Blanchard and Diamond 1990).
This analysis of monthly transitions across labor force states allows for a direct test of whether blacks are the last hired when business conditions are good but are the fi rst fi red in a downturn.4 Estimates from the matched CPS data are consistent with the idea that blacks are the fi rst fi red, but not with the common assertion that they are the last hired. During growth periods, businesses appear to look fi rst among unemployed blacks for workers and subsequently hire from among nonparticipants.5 Thus, the widespread interpretation of the widening of racial differences in unemployment rates during recessions and the narrowing of differences during growth periods as being due to blacks being last hired and fi rst fi red is only partially supported.
PREVIOUS RESEARCHIn the past three decades, many studies have examined the movement of labor force a ggregates in response to business cycle conditions (Borjas 2006; Bound and Freeman 1991; Bradbury 2000; Clark and Summers 1981; Freeman 1973, 1991; Freeman and Rodgers 1999; Hines et al. 2001; Holzer and Offner 2001; Hoynes 1999). They agree that
4. The term “fi rst fi red” is used loosely here to refer to all types of job loss. For key results in the article, we provide alternative estimates that screen on the reason for unemployment in an attempt to eliminate voluntary job leavers.
5. Blanchard and Diamond (1990) found a similar pattern for other disadvantaged groups.

Black-White Unemployment and the Business Cycle 229
employment and unemployment of blacks is more sensitive to business cycle conditions than that of whites, particularly among youths.
Rather than focusing on group rates, several studies have examined the relative im-portance of the duration of unemployment as opposed to incidence in explaining its level. Barrett and Morgenstern (1974) found that high rates of job turnover are primarily respon-sible for the relatively high unemployment among blacks and young workers; however, both Clark and Summers (1979) and Baker (1992) concluded that at least half the cyclical sensitivity of unemployment rates is due to changes in duration of spells.
In addition to these studies on the relative role of duration, others have investigated determinants of spell length. Lynch (1989) estimated duration models for the hazard of reentering employment from unemployment and found that labor market conditions and human capital are strongly associated with those transitions. Holzer (1986) examined dura-tions for black and white youths and found that more than 40% of the racial gap may be attributed to differences in reservation wages.
General approaches to estimating fl ows of workers across labor force states and their relation to aggregate stocks have also been developed (Abraham and Shimer 2001; Blanchard and Diamond 1990; Smith et al. 1974). Smith et al. (1974) constructed a fore-casting model based on disaggregated transition probabilities that demonstrated that blacks, women, and youths are more likely than prime-age white males to react to poor labor mar-kets by dropping out of the labor force.
Blanchard and Diamond (1990) considered disaggregated transitions across labor force states for various age and sex groups, although they did not consider blacks. Based on the patterns observed, they argued that as businesses rehire, they fi rst look at those who are unemployed (primary workers) who have a stronger attachment to working, and later those from the ranks of nonparticipants (secondary workers). Again, this emphasizes the impor-tance of considering nonparticipation. Abraham and Shimer (2001) provided an analysis that was similar to that of Blanchard and Diamond and converted the underlying transition rates across labor force states into stocks of the variables. Badgett (1994) also looked at transition rates across labor force states and related them to aggregate stocks for black and white men and women from 1970 to 1990, reporting that fi ring appears much more variable over time than adjustments in hiring rates. We make use of a similar approach to these stud-ies in relating observed transition rates in our sample to relative levels of unemployment over the business cycle.
The studies of Badgett (1994), Blanchard and Diamond (1990), and Abraham and Shimer (2001) are important in explaining the cycling of individuals among jobs over the business cycle. A related literature has examined how much of the cycling is due to the elimination of existing jobs or creation of new ones (Davis and Haltiwanger 1992, 1999). The work of Davis and Haltiwanger is based on employer data that enabled them to gauge changes in positions added and eliminated over time. In both of these literatures, increases in unemployment during recessions are primarily attributable to increases in fi rings rather than large cyclical changes in rates of hiring.
Research has primarily focused on examinations of the relative movement of unemploy-ment and the role of duration in determining aggregate rates. More general developments in modeling the relationship of underlying transitions to aggregate rates of unemployment have also provided fundamental insights into the operation of the labor market. In this article, the movement of blacks relative to whites between employment, unemployment, and nonparticipation over the business cycle is examined. This dynamic approach is used to explore whether blacks indeed are the last hired and fi rst fi red over the business cycle.
THE LAST HIRED, FIRST FIRED HYPOTHESISBefore examining the data, it is important to consider some of the factors that relate racial differences in unemployment and employment to the business cycle. Conceptually, when

230 Demography, Volume 47-Number 1, February 2010
one examines a cross-group difference that occurs in a labor market, the phenomenon is usually divided into components related to productivity versus those that arise from un-observable sources, such as discrimination. Consider these forces in turn and their likely impact over the business cycle.
First, although differences in observed characteristics have narrowed in the past several decades, white attainment in important dimensions (such as education) continues to exceed that of blacks. This suggests that whites would be positioned more highly in hiring queues as growth begins in a business cycle and would thus enjoy greater protection from layoffs because of their seniority when downturns begin. This would lead to late transitions into employment for minorities during periods of growth but more rapid job loss during reces-sions. As economic growth begins, one would expect employment growth among minorities to lag that of whites. Thus, considerations of marginal worker productivity could generate the pattern of blacks being the last hired and fi rst fi red.
An additional consideration is how discrimination in labor markets is likely to interact with productivity-related factors. In situations of widespread unemployment, it has been plausibly argued that there is less pressure on employers who have a taste for discrimination to hire minority workers because there is a greater availability of whites who are likely to have desired skills.6 Similarly, beyond layoffs based on observable characteristics, at the margin, a discriminating employer can lay off equally qualifi ed blacks and not face eco-nomic costs for doing so during slack business conditions. During periods of tight labor markets, a discriminating employer would face economic costs associated with a refusal to hire qualifi ed blacks. Thus, tastes for discrimination can be more readily exercised without an employer bearing costs in a slack market than a tight one.7
These considerations suggest that one would expect to observe greater measured dis-crimination during downturns and less discrimination near the peak of a business cycle. Because discrimination is seldom directly observed in labor market data, larger residual errors in predicting cross-group differentials during troughs of a business cycle would be consistent with cyclical discrimination. Larger residuals, however, would also be consis-tent with other unobserved factors—such as tenure and educational quality—being more important determinants of employment during recessions.8
TRENDS AND CYCLICALITY OF BLACK-WHITE LABOR MARKET STATUSBefore turning to a detailed examination of micro-level data, we examine the macro-economic relationship between black and white unemployment and business cycle condi-tions. Beyond establishing context for this article, it is helpful to discuss and update the estimates provided in Freeman (1973), which are often cited as evidence that blacks are the last hired and the fi rst fi red over the business cycle. Similar estimates can be found in Freeman and Rodgers (1999), Hoynes (1999), Bradbury (2000), Hines et al. (2001), and Holzer and Offner (2001).
Using annual data from 1947 to 1972, Freeman (1973) explored the last in, fi rst out hy-pothesis by estimating separate regressions for labor market outcomes that include a trend variable and deviation of real gross national product (DGNP) from its trend by race. For log unemployment rates, he found similar coeffi cient estimates on log real GNP deviations
6. The fundamental idea that discrimination is associated with a willingness to bear a cost for this taste is attributable to Becker (1957). See also Schulman (1986) for an adaptation of these concepts to a business cycle context.
7. Black (1995) considered the impact of employer discrimination in hiring on the black-white wage distri-bution and employment in a game theoretic model. In a model that did not account for business cycle factors, he showed that employer discrimination can result in economic costs to minority workers.
8. A defi cit of this analysis is that a direct measure of tenure is not available in the monthly CPS data. Rather than using a variable for potential experience constructed as age less education minus 5, we include age, age squared, and education as separate regressors in the analysis.

Black-White Unemployment and the Business Cycle 231
for black and white men, implying that the two groups experience the same proportionate response to the cycle. Freeman then noted that “when the economy weakens, the unemploy-ment rate of blacks—always higher than that of whites—rises by a larger number of per-centage points and results in a larger relative decline in employment” ( Freeman 1973:77). He concluded that these estimates support the last hired, fi rst fi red pattern of black employ-ment over the cycle.9
Following Freeman, the estimates are updated using annual observations of un-employment rates and real GNP from the Economic Report of the President (2005) for the period 1972–2004. The results and Freeman’s original parameter estimates are reported in Table 1. Separate estimates are reported for black and white men, and the proportionate responsiveness of the two groups to business cycle conditions is not statistically distin-guishable. Following Freeman’s argument, the substantially higher unemployment rates among blacks than whites (roughly double) and the equal proportionate response across the business cycle continues to be associated with faster increases in black unemployment rates and larger relative declines in employment when economic conditions worsen.10
Although these fi ndings are consistent with the last in, fi rst out hypothesis, they are also consistent with other possible explanations. For example, increasing black relative to white unemployment rates while economic conditions worsen is consistent with a reduced rate of hiring of blacks rather than an increased rate of being laid off or fi red. Alternatively, as the economy expands and the racial unemployment gap falls, all workers may experience the same likelihood of fi nding jobs, but blacks may experience a declining probability of job loss. Both of these hypothetical patterns would contradict the last in, fi rst out hypoth-esis. Clearly, an aggregate analysis of the relationship between black and white unemploy-ment rates and business cycle conditions allows for only a tentative conclusion regarding underlying determinants. Estimates of racial differences in labor market transitions are needed to fully test the hypothesis.
DATATo examine underlying transition rates, we use individual-level data from matched monthly CPS from 1989 to 2004. The CPS, conducted by the U.S. Census Bureau and the Bureau of Labor Statistics, includes interviews of approximately 50,000 households and more than
9. As noted above, Freeman (1973) argued that the focus should be on how the black-white gap measured in percentage points responds to economic conditions instead of how the black-white ratio in unemployment rates responds.
10. Assume that black unemployment is 10% and that white unemployment is 5%. A 1% decline in gross national product (DGNP) results in a rise in the black unemployment rate of 0.79 percentage points, compared with a rise of 0.46 percentage points in the white unemployment rate.
Table 1. Regression Coeffi cients for Trend and Cyclic Changes in the Labor Market by
Race: 1947–2004
Unemployment Rate, Unemployment Rate,
1947–1972 1973–2004 _______________________________ _______________________________
Race Time DGNP R 2 Time DGNP R 2
Black –0.000 –7.86 .71 –0.008 –7.90 .59 (0.005) (1.08) (0.003) (1.34)
White –0.003 –7.70 .81 –0.007 –9.24 .76 (0.004) (0.79) (0.002) (1.01)
Sources: Estimates for 1947–1972 are from Freeman (1973:74, Table 1). Data for 1973–2004 estimates are from the Economic Report of the President (2005: Tables B-2 and B-43). DGNP is the deviation of real gross national product from its trend.

232 Demography, Volume 47-Number 1, February 2010
130,000 people each month. Although the CPS is primarily used as a cross-sectional data set, it is possible to follow individuals for four consecutive months by linking surveys. Households in the CPS are interviewed over four consecutive months when they enter the sample. Then they exit the survey for eight months. Afterward, they reenter the sample and are interviewed for another consecutive four months. This rotation pattern of the CPS makes it possible to match information on individuals across three consecutive pairs of months. Match rates range from 92% to 96% for white men and 87% to 93% for black men. (See Couch and Fairlie [2008] for more details on the matching procedure and results.)
The linking of data across months makes it possible to create indicators for labor market transitions from one period to the next. Labor force status in each period is divided into the categories of employed, unemployed, and nonparticipation. We make use of the standard Bureau of Labor Statistics classifi cations of labor force status in the analysis taken from the monthly labor force recode variable. Correspondingly, transitions across each of these states from one month to the next are examined. Black and white, non-Latino men aged 25–55 are included in the analytical sample, which avoids modeling issues that would otherwise arise because of transitions associated with school enroll-ment, retirement, and childbearing.11
Business Cycle MeasureThe monthly frequency of the CPS data allows for fairly precise measurement of the state of expansion and contraction of the economy. One problem with monthly data is that many macroeconomic indicators of economic activity (such as GNP) are not available at that fre-quency.12 To measure demand in the analysis, we construct a state-level variable of the devia-tion of aggregate unemployment from the national natural rate of unemployment (NRU).13
Calculation of the NRU requires the estimation of an expectations-augmented Phillips curve. For those estimations, monthly data from 1979 through 2004 are used. The NRU is estimated to be 5.28.14 Using this value, we calculate the business cycle control variable as the deviation of the state unemployment rate for all workers from the NRU. This variable captures state demand relative to a national measure of full employment.
One possible complaint regarding the use of a constant NRU is that over time, it is estimated imprecisely. A more recent literature has developed procedures for estimating time-varying NRUs. To test the robustness of key results in our article, we provide alterna-tive estimations, employing a demand control calculated as the state unemployment rate minus the time-varying NRU, which readjusts on a quarterly basis (Gordon 2008). We fi nd that our results are virtually identical using either measure.
UNEMPLOYMENT TRANSITIONSThe analysis of whether blacks are last hired and fi rst fi red now turns to racial patterns in la-bor force transitions. First, we examine differences in transitions between employment and unemployment before including transitions into and out of the labor force in the analysis.
11. The use of an older sample also reduces the importance of misreported labor force states within the CPS itself. Prior researchers have shown that most response errors occur among younger workers. Thus, the focus on older workers reduces misreporting as a source of concern. A discussion of measurement issues related to labor force status in the CPS can be found in Summers (1981).
12. Similarly, County Business Pattern data are available only annually.13. In similar work that considers the aggregate fl ow of workers, Blanchard and Diamond (1990) controlled
for demand in the framework of a Beveridge curve. Many others have simply used the unemployment rate. The choice between using the unemployment rate versus the NRU is inconsequential. In constructing the demand con-trol, the NRU is subtracted from the state rate. Because the state-level observations are all adjusted by the same constant, this simply shifts the constant term in the regression estimates.
14. The estimation procedure and results used in the calculation of the NRU are described in detail in Couch and Fairlie (2008).
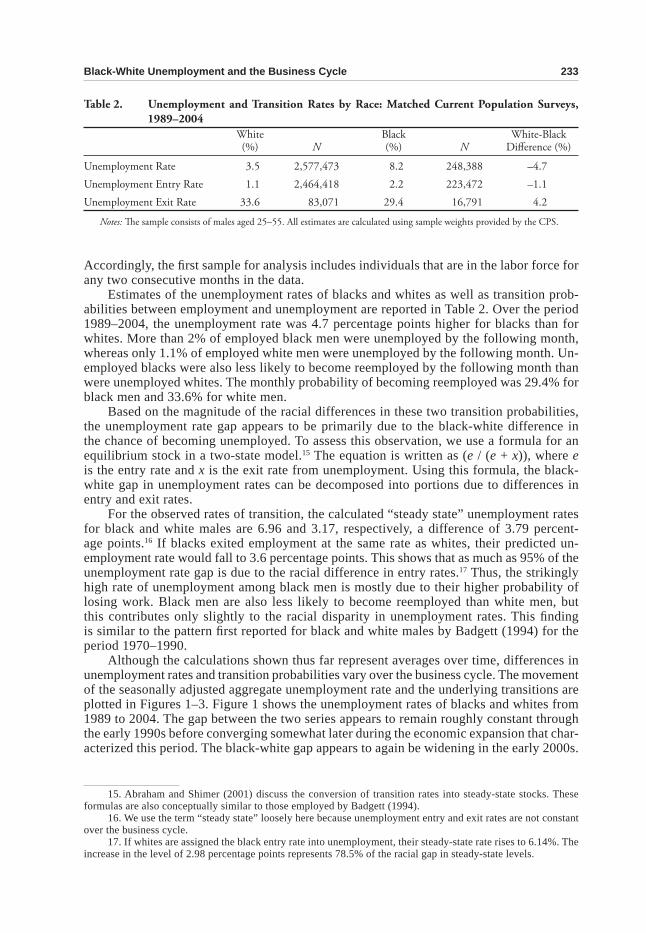
Black-White Unemployment and the Business Cycle 233
Accordingly, the fi rst sample for analysis includes individuals that are in the labor force for any two consecutive months in the data.
Estimates of the unemployment rates of blacks and whites as well as transition prob-abilities between employment and unemployment are reported in Table 2. Over the period 1989–2004, the unemployment rate was 4.7 percentage points higher for blacks than for whites. More than 2% of employed black men were unemployed by the following month, whereas only 1.1% of employed white men were unemployed by the following month. Un-employed blacks were also less likely to become reemployed by the following month than were unemployed whites. The monthly probability of becoming reemployed was 29.4% for black men and 33.6% for white men.
Based on the magnitude of the racial differences in these two transition probabilities, the unemployment rate gap appears to be primarily due to the black-white difference in the chance of becoming unemployed. To assess this observation, we use a formula for an equilibrium stock in a two-state model.15 The equation is written as (e / (e + x)), where e is the entry rate and x is the exit rate from unemployment. Using this formula, the black-white gap in unemployment rates can be decomposed into portions due to differences in entry and exit rates.
For the observed rates of transition, the calculated “steady state” unemployment rates for black and white males are 6.96 and 3.17, respectively, a difference of 3.79 percent-age points.16 If blacks exited employment at the same rate as whites, their predicted un-employment rate would fall to 3.6 percentage points. This shows that as much as 95% of the unemployment rate gap is due to the racial difference in entry rates.17 Thus, the strikingly high rate of unemployment among black men is mostly due to their higher probability of losing work. Black men are also less likely to become reemployed than white men, but this contributes only slightly to the racial disparity in unemployment rates. This fi nding is similar to the pattern fi rst reported for black and white males by Badgett (1994) for the period 1970–1990.
Although the calculations shown thus far represent averages over time, differences in unemployment rates and transition probabilities vary over the business cycle. The movement of the seasonally adjusted aggregate unemployment rate and the underlying transitions are plotted in Figures 1–3. Figure 1 shows the unemployment rates of blacks and whites from 1989 to 2004. The gap between the two series appears to remain roughly constant through the early 1990s before converging somewhat later during the economic expansion that char-acterized this period. The black-white gap appears to again be widening in the early 2000s.
15. Abraham and Shimer (2001) discuss the conversion of transition rates into steady-state stocks. These formulas are also conceptually similar to those employed by Badgett (1994).
16. We use the term “steady state” loosely here because unemployment entry and exit rates are not constant over the business cycle.
17. If whites are assigned the black entry rate into unemployment, their steady-state rate rises to 6.14%. The increase in the level of 2.98 percentage points represents 78.5% of the racial gap in steady-state levels.
Table 2. Unemployment and Transition Rates by Race: Matched Current Population Surveys,
1989–2004
White Black White-Black (%) N (%) N Diff erence (%)
Unemployment Rate 3.5 2,577,473 8.2 248,388 –4.7
Unemployment Entry Rate 1.1 2,464,418 2.2 223,472 –1.1
Unemployment Exit Rate 33.6 83,071 29.4 16,791 4.2
Notes: Th e sample consists of males aged 25–55. All estimates are calculated using sample weights provided by the CPS.

234 Demography, Volume 47-Number 1, February 2010
Figure 1. Monthly Unemployment Rates by Race for Men Aged 25–55: Current Population Surveys,
1989–2004
Figures 2 and 3 contain entry and exit rates, respectively, for unemployment by race. In Figure 2, it can be seen that around the time of the 1990–1991 recession, the gap in entry rates was the greatest in the sample period. During the later growth period, the difference in the entry rates narrowed. It appears to have hit a low as the business cycle neared its peak in the years 1999 and 2000. The peak itself occurred in 2001. Afterward, the differential appears to have grown.
Figure 3 shows the movement of exit rates during the sample period. There is not a large gap in the black and white series. Indeed, at some points in time, the black exit rate from unemployment appears to exceed that of whites. However, both series appear to be strongly associated with the business cycle.
Transitions From Employment to UnemploymentTo investigate these patterns, we use a regression framework that controls for racial dif-ferences in individual and job characteristics. Panel A of Table 3 reports ordinary least squares (OLS) estimates of linear probability models for employment to unemployment transitions.18 The standard errors reported in the table are adjusted to account for the con-tribution of multiple observations from individuals to the data set.
Specifi cation 1 reports estimates for the dummy variable for black and the business cycle control from a model that also includes measures of age and its square, marital sta-tus, education, occupation, industry, and state and month fi xed effects. The black-white differential in transition rates is 0.92 percentage points. The parameter for the business cycle control indicates that the probability of moving from employment to unemployment increases as demand weakens. Estimates without controls result in a slightly larger coef-fi cient on the dummy variable for black, which is consistent with those reported in previous
18. Estimates of marginal effects from logit models provide similar estimates to the OLS results presented here.
0
2
4
6
8
10
12
14
1989 1991 1993 1995 1997 1999 2001 2003
White
Black
Un
emp
loym
ent
Rat
e (%
)

Black-White Unemployment and the Business Cycle 235
Figure 3. Monthly Unemployment Exit Rates by Race for Men Aged 25–55: Current Population
Surveys, 1989–2004
Figure 2. Monthly Unemployment Entry Rates by Race for Men Aged 25–55: Current Population
Surveys, 1989–2004
0
1
2
3
4
5
White
Black
1989 1991 1993 1995 1997 1999 2001 2003
Un
emp
loym
ent
Rat
e (%
)
0
10
20
30
40
50
60
Black
White
1989 1991 1993 1995 1997 1999 2001 2003
Un
emp
loym
ent
Rat
e (%
)
studies indicating that only a small part of the black-white gap in unemployment rates is explained by education, occupation, and other controls.
Specifi cation 2 includes the interaction between the dummy variable for black and the business cycle variables along with the other regressors. The results show that black men

236 Demography, Volume 47-Number 1, February 2010
Table 3. Labor Force Transitions Using Matched Current Population Surveys: 1989–2004
Specifi cation ____________________________________________________________________
Regressor (1) (2) (3) (4) (5) (6)
Panel A. Linear Regressions for Probability of Employment-to-Unemployment Transition
Black 0.00917 0.00890 0.00992 0.00888 0.00692 0.00921 (0.00022) (0.00022) (0.00022) (0.00023) (0.00020) (0.00038)
Undiff a 0.00176 0.00164 0.00166 0.00159 0.00146 0.00159 (0.00006) (0.00006) (0.00006) (0.00007) (0.00005) (0.00007)
Undiff a × Black 0.00109 0.00118 0.00092 0.00086 0.00094 (0.00015) (0.00015) (0.00020) (0.00013) (0.00027)
Undiff a × Period of 0.00012rising unemployment (0.00010)
Undiff a × Period of rising 0.00040unemployment × Black (0.00030)
Mean of dependent variable 0.01208 0.01208 0.01208 0.01208 0.00964 0.01208
Sample size 2,687,890 2,687,890 2,687,890 2,687,890 2,681,427 2,687,890
Panel B. Linear Regressions for Probability of Unemployment-to-Employment Transition
Black –0.04818 –0.05062 –0.04822 –0.05026 –0.04376 –0.04873 (0.00382) (0.00420) (0.00415) (0.00420) (0.00497) (0.00529)
Undiff a –0.03512 –0.03581 –0.03461 –0.03613 –0.03506 –0.03794 (0.00118) (0.00127) (0.00125) (0.00165) (0.00146) (0.00161)
Undiff a × Black 0.00341 0.00186 0.00007 0.00371 0.00327 (0.00241) (0.00243) (0.00339) (0.00281) (0.00323)
Undiff a × Period of 0.00062falling unemployment (0.00194)
Undiff a × Period of falling 0.00602unemployment × Black (0.00430)
Mean of dependentvariable 0.32719 0.32719 0.32719 0.32719 0.32227 0.32719
Sample size 99,862 99,862 99,862 99,862 75,113 99,862
Notes: Th e sample consists of males aged 25–55. All estimates are calculated using sample weights provided by the CPS. Standard errors are adjusted for multiple observations per individual. All specifi cations also include a constant, age, age squared, marital status, education, occupation and industry, and state and month fi xed eff ects except Specifi cation 3, which excludes age, education, occupation and industry. Specifi cation 5 omits from the estimations those who were job leavers or reentrants. Specifi cation 6 calculates the Undiff variable using a time-varying natural rate described in the text.
aUndiff = the unemployment rate minus the natural rate of unemployment.
have a 0.009 higher base probability of entering unemployment than white men. As the un-employment rate increases by 1 percentage point, all men are 0.16 percentage points more likely to enter unemployment. Black men appear to have a stronger cyclical response. The interaction term indicates that for each percentage-point increase in unemployment, the transition rate for blacks rises by 0.109 more than for whites. Thus, their summed increase in the transition rate into unemployment for an increase of 1 percentage point above the NRU is 0.27.

Black-White Unemployment and the Business Cycle 237
Using these estimates, at the height of a recession in which unemployment rates are 3 percentage points above the NRU (or 8.28%), black men are 1.2 percentage points more likely to lose their job than are whites. In a strong growth period in which unemployment rates reach 1 percentage point below the NRU (4.28%), blacks have a higher probability of moving from employment to unemployment than whites, although the overall transition probability is substantially lower at 0.078 percentage points.
Specifi cation 3 provides an examination of the infl uence of the control variables con-tained in Model 2 on the parameter estimates. Comparing those two columns, one can see that the inclusion or exclusion of the control variables has little infl uence on the parameter estimates related to the role of race and the business cycle on the employment to unemploy-ment transitions.
Another test of the fi rst fi red hypothesis is to examine whether the employment to unemployment transition probability among black men responds even stronger when the labor market is becoming more slack (i.e., rising unemployment). Specifi cation 4 in Table 3 includes an interaction between the unemployment rate, a dummy variable for whether it is a period of rising aggregate unemployment, and the dummy variable for black.19 The relevant parameters are statistically insignifi cant and do not provide any evidence that the racial difference in responsiveness to business cycle conditions is different in periods of rising unemployment.
Specifi cation 5 omits voluntary job leavers and those who are reentrants to the labor market from the estimations.20 Job leavers have a different motivation for making labor market transitions, and the fi rst fi red hypothesis has generally been interpreted as includ-ing involuntary leavers. Reentrants could also have been voluntary leavers. The exclusion of voluntary job leavers and reentrants reduces the total sample size by less than 1% of the sample because those who are continuously employed are also included in the sample. The results for Specifi cation 5 are similar to comparable estimates for the full sample ( Specifi cation 2).
Finally, Specifi cation 6 in Table 3 relies on calculating the difference in the local un employment rate and the natural rate with the time-varying version from the work of Gordon (2008). Both the magnitudes of the parameters as well as the patterns of signifi -cance are similar across these two specifi cations, confi rming the basic robustness of the results presented in the table.
Overall, these estimates provide evidence that is consistent with the first fired hypothesis. Black men clearly respond more to changes in economic conditions in the economy than whites in terms of their probabilities of becoming unemployed. Worsened demand conditions in the economy result in a much larger increase in the movement into unemployment for black men than for white men.21 The estimates that include a dummy variable interaction for worsening business cycle conditions rules out the possibility of a much stronger response in periods of rising unemployment for blacks. Such a pattern would be inconsistent with employers laying off black men fi rst in the face of worsening eco-nomic contractions. Consistent with those estimates, holding hiring constant, black-white differences in unemployment will decrease when the economy is strong because blacks are relatively less likely to lose their jobs.
19. Falling unemployment rates occur during the periods 1/89–3/89, 7/92–4/00, and 7/03–12/03; and rising unemployment rates occur during the periods 4/89–6/92 and 5/00–6/03.
20. The CPS includes questions on the reason for unemployment. Voluntary job leavers are defi ned as those individuals who quit their jobs.
21. See Couch and Fairlie (2008) for a simulation of the transition rates from employment to unemployment over a hypothetical business cycle.
238 Demography, Volume 47-Number 1, February 2010
Transitions From Unemployment to Employment
Panel B of Table 3 reports linear regression estimates for the probability of exiting from unemployment.22 Specifi cation 1 reports estimates for the base equation, which includes a dummy variable for black along with the business cycle control. Specifi cation 2 includes an interaction between the dummy variable for black and the business cycle control. Results from these two models indicate that black men are less likely than whites to move from unemployment to employment even after we control for education, occupation, industry, and other individual characteristics.
The parameter estimates associated with the business cycle variable indicate that the workers in the sample have less chance of moving from unemployment to employment when demand conditions are weak. However, the parameter associated with the interaction between the business cycle control variable and the dummy variable for black is small, positive, and statistically insignifi cant. The sign of the estimate would suggest that black men might have relatively higher transition rates from unemployment into employment when demand conditions are relatively weak. However, the statistical insignifi cance of the parameter in this set of estimates indicates that black men do not differ from white men in their responsiveness to changes in the tightness of labor markets. This fi nding is impor-tant because it indicates, at a minimum, that blacks are not necessarily last hired. Instead, throughout the business cycle, black men are less likely to be reemployed than whites. The racial difference in reemployment probabilities is similar at both peaks and troughs of the business cycle.23
Specifi cation 3 again excludes the controls for age, education, industry, and occupa-tion. By contrasting these results with those for Specifi cation 2, the infl uence of the covari-ates on the estimated transition probabilities can readily been seen. Again, the exclusion of age, education, industry, and occupation from the equations has little impact on the reported parameter estimates.
Specifi cation 4 includes interactions with periods of falling unemployment. Because the parameters associated with those interactions are statistically insignifi cant, there is no evidence that black men have a different degree of responsiveness than white men to periods of falling unemployment. In these estimates, black men have a lower probability of moving from unemployment to employment, which does not appear to be related to the business cycle.
Specifi cation 5 considers the impact on the estimates of omitting voluntary job leav-ers and labor market reentrants from the sample. Comparable results for the full sample (Specifi cation 2) are quantitatively and qualitatively similar.
Finally, Specifi cation 6 provides a set of estimates similar to those found in Specifi ca-tion 2 except that the business cycle control is calculated using the time-varying NRU taken from the work of Gordon (2008). A comparison of those two sets of results shows that both the magnitude and the patterns of signifi cance are similar, providing evidence of robustness in the pattern of reported results.
TRANSITIONS INTO AND OUT OF THE LABOR FORCEA major concern is that focusing narrowly on employment to unemployment transitions does not capture the complete effects of worsening or improving labor markets. As the economy worsens, one might expect a higher probability of movement from employment and unemployment to nonparticipation, and black and white men may differ in their likeli-hood of these responses to the business cycle. It might also be expected that during periods
22. Estimates of marginal effects from logit estimations are similar to the OLS results presented here.23. See Couch and Fairlie (2008) for a simulation of the transition rates from unemployment to employment
over a hypothetical business cycle.

Black-White Unemployment and the Business Cycle 239
of tightening labor markets, more movements directly from nonparticipation to employ-ment would be observed and that those transitions also might differ by race.
As the scope of the analysis is shifted to movement into and out of the labor force, the sample is expanded to include all black and white men ages 25–55.24 Table 4 contains transition probabilities between employment, unemployment, and nonparticipation over the entire sample period 1989–2004 separately for whites and blacks as well as for the com-bined sample. Several interesting patterns emerge. First, a larger percentage of blacks move from employment to nonparticipation than whites. The average probability of moving from employment to not in the labor force for blacks is .016, which is only slightly lower than the average probability of moving from employment to unemployment. Thus, excluding this transition from an analysis of black-white differences in labor force behavior over the business cycle is potentially an important omission.
For whites, from one month to the next, 1.1% of the sample moves from being em-ployed to unemployed, and a further 0.7% moves directly to nonparticipation. Because whites move from employment to nonparticipation at a much lower rate than blacks, focus-ing solely on employment to unemployment transitions understates the racial difference in entry into non-employment.
Black men are also substantially more likely than whites to move from unemployment to nonparticipation the following month. In a typical month, nearly 16% of unemployed black men move from unemployment to nonparticipation. In contrast, 11% of white men move from unemployment to nonparticipation monthly. This racial differential is important because it indicates that the white-black gap in non-employment to employment transitions will be overstated if those who exit the labor force are excluded from the analysis.
Blacks are also more likely to move from nonparticipation to unemployment. The difference in the probability for blacks and whites to make this transition each month is
24. The analysis thus far excludes transitions either into or out of the labor force.
Table 4. Monthly Transition Probabilities: Matched Current Population
Surveys, 1989–2004
Status Next Month _________________________________________
Sample and Status Not in theTh is Month Employed Unemployed Labor Force
Males Aged 25–55
Employed .982 .012 .007
Unemployed .287 .597 .112
Not in the labor force .104 .059 .837
Black Males Aged 25–55
Employed .963 .021 .016
Unemployed .242 .599 .160
Not in the labor force .093 .082 .825
White Males Aged 25–55
Employed .986 .011 .007
Unemployed .297 .597 .106
Not in the labor force .106 .054 .840
Note: Calculated by authors using matched monthly Current Population Survey Basic fi les from 1989:1 through 2003:12.

240 Demography, Volume 47-Number 1, February 2010
2.8 percentage points each month. Overall, more churning between nonparticipation and unemployment occurs for black than white men.
The large percentage of black and white men moving from employment directly into nonparticipation could alter or reinforce the evidence presented thus far regarding the fi rst fi red hypothesis. Further, the earlier examination in this article of transitions into employ-ment, which omitted those entering from nonparticipation, may be altered by expanding the analysis. To determine whether black and white men respond differently to the business cycle in these transitions, we estimate regressions for the probability of making a transition between all three labor force states. Table 5 reports estimates for specifi cations that include the dummy variable for black, the controls, the unemployment rate, and a black unemploy-ment rate interaction.25 This model is the same as Specifi cation 2 in Table 3.
Transitions From EmploymentThis section contains a discussion of estimates for transitions out of employment contained in panel A of Table 5. These transitions are related to the proposition that blacks are the fi rst fi red as business cycle conditions worsen. The estimates are obtained from linear prob-ability models of the transitions from employment to unemployment and employment to nonparticipation.26
The regression coeffi cients for the transition from employment to unemployment are similar to those reported in panel A of Table 3, where nonparticipation was not considered as a possibility, and indicate that the transition rate for blacks is more sensitive to the busi-ness cycle than that for whites.27 In contrast, there is no evidence of a differential response in employment to nonparticipation transitions between blacks and whites to changes in business cycle conditions. The main similarity between the two transition regressions is that the black coeffi cient is large, positive, and statistically signifi cant. Blacks have an elevated probability relative to whites of moving out of employment, and the probability of moving into unemployment has a strong cyclical component.
These results essentially confi rm the previous fi nding that the movement from employ-ment to unemployment for black men is more responsive to the business cycle than that for white men. An examination of movement from employment to nonparticipation reveals no apparent relationship with the business cycle. Transitions to nonparticipation may be driven by factors independent of business cycle conditions, such as retirement, disability, and child care. Most importantly, the lack of a differential response for employment to non-participation transitions does not overturn the fi nding that blacks are at an increasing risk of losing their job when the labor market is weakening. Overall, the evidence is consistent with blacks being fi rst fi red.
Again, a specifi cation is estimated that includes a variable for whether the unemploy-ment rate is rising that is interacted with the dummy variable for black and the business cycle control (reported in the fi rst column in panel B of Table 5). The purpose is to see whether movements in the transition rates are symmetrical. There is no evidence of a dif-ferential response in periods of rising unemployment.
25. A parallel set of estimates screening out voluntary leavers and labor market reentrants are available upon request. They are not included in the text because they differed little from those presented in Table 5. Similarly, a set of estimates that employ the time-varying natural rate in the construction of the business cycle measure are also available upon request. The magnitude and patterns of signifi cance of parameters are similar to those reported in the specifi cation discussed in the text.
26. We estimated multinomial logit models (MNL) for these transitions and the transitions from unemploy-ment and from nonparticipation and found similar results. Although independence from irrelevant alternatives (IIA) tests for all transitions generally do not reject, we investigated estimating nested logit models (NLM) that would relax this assumption. Unfortunately, we could not fi nd choice-based attributes or instruments that would allow us to identify NLMs.
27. The sample size and estimates are slightly different because in this specifi cation, the possibility of transitioning from employment to not in the labor force is coded as a zero.

Black-White Unemployment and the Business Cycle 241
Transitions to Employment and Additional Transitions
Turning to the unemployment-to-employment transition estimates, which are reported in column 3 of panels A and B of Table 5, the signs of the parameters and the pattern of statis-tical signifi cance are similar to when only two labor force states were considered. The one important exception is that the coeffi cient on the black unemployment rate interaction is now larger and statistically signifi cant (at the 10% and 5% levels in Tables 6 and 7, respectively). Importantly, the coeffi cient estimate remains positive, indicating that the black-white gap in reemployment decreases in the face of rising unemployment. This means that blacks have a higher rate of transition from unemployment into employment when business cycle condi-tions are poor. This fi nding is consistent with blacks being the fi rst hired from the ranks of the unemployed as the economy moves through a trough and begins to grow while business cycle conditions are poor.
In contrast to these results, the transition rate from nonparticipation to employment for blacks decreases relative to that for whites when unemployment rates are rising. This
Table 5. Estimated Transitions Across Labor Force Status: Matched CPS Data, 1989–2004
Transition _____________________________________________________________________
Employed Unemployed Not in Not in Employed to Not Unemployed to Not Labor Labor to in Labor to in Labor Force to Force toRegressor Unemployed Force Employed Force Employed Unemployed
Panel A. Linear Regressions Assuming Symmetric Responses Over the Business Cycle Transition
Black = 1 0.009* 0.009* –0.061* 0.055* 0.0004 0.018*
Undiff a 0.002* –0.0002* –0.028* –0.012* –0.003* 0.007*
Undiff a × Black 0.001* –0.0001 0.005† –0.001 –0.003* 0.003*
N 2,711,846 2,711,846 113,602 113,602 226,462 226,462
R 2 .0088 .0057 .0300 .0253 .0235 .0178
Panel B: Linear Regressions TestingSymmetric Response Over theBusiness Cycle
Black = 1 0.009* 0.009* –0.061* 0.055* 0.0003 0.018*
Undiff a 0.002* –0.0001* –0.028* –0.011* –0.002* 0.007*
Undiff a × Black 0.001* 0.00003 0.007* –0.001 –0.004* 0.002
Undiff a × Rising unemployment 0.0001 –0.0002* 0.0002 –0.004* –0.001 –0.001
Undiff a × Rising unemployment × Black 0.0004 –0.0004 –0.005 0.002 0.002 0.001
N 2,711,846 2,711,846 113,602 113,602 226,462 226,462
R 2 .0088 .0057 .0300 .0254 .0235 .0178
Notes: Th e sample consists of males aged 25–55. All estimates are calculated using sample weights provided by the CPS. Standard errors are adjusted for multiple observations per individual. All equations also include a constant, age, age squared, marital status, education, occupation and industry, and state and month fi xed eff ects. Th e column headings indicate the labor market transition being considered from the current month to the next.
aUndiff = the unemployment rate minus the natural rate of unemployment.†p < .10; *p < .05

242 Demography, Volume 47-Number 1, February 2010
fi nding is consistent with blacks being hired from the ranks of those out of the labor force during strong economic periods. For example, if the unemployment rate increases by 1 percentage point, the black transition rate from nonparticipation to employment increases by 0.3 percentage points relative to that of whites. Estimates from panel B of Table 5, however, do not provide evidence of any additional differential response during periods of rising aggregate unemployment.
Black men appear to have a differential response to the business cycle in transitions from nonparticipation to employment relative to white men. As labor markets become slack, blacks relative to whites are less likely to move from nonparticipation to employ-ment. If one considers all movement into employment, this result appears to offset the posi-tive relationship between the black-white gap in unemployment to employment transition rates and aggregate demand. Combining these two results leads to the following conclu-sions. Blacks are more likely to be hired from the ranks of the unemployed early in the business cycle. Later in the business cycle, blacks are more likely to be hired from being out of the labor force.
In their work on the gross fl ows of U.S. workers over the business cycle, Blanchard and Diamond (1990) found evidence consistent with the idea that fi rms initially hire early in growth periods from the ranks of the unemployed. They referred to those who were among the unemployed as primary workers. After the primary workers have been hired, fi rms look to those who are nonparticipants. These are termed “secondary workers.” Our results for prime-age black males are consistent with their view of nonparticipants and the dynamics of the hiring process over the business cycle.
For the remaining transitions, there is evidence of a stronger positive relationship between nonparticipation to unemployment transitions and the business cycle variable for blacks than for whites. There is no evidence, however, of a differential response over the business cycle for transitions from unemployment to nonparticipation.
EXPLAINING RACIAL DIFFERENCES IN CYCLICAL RESPONSESThus far, the discussion has focused on racial differences in labor market transitions through the business cycle. A natural topic of interest is whether differences across races in the skills they bring to the labor market or their types of employment help explain these patterns. In the CPS data, information is available regarding the characteristics of the in-dividuals in the sample as well as their occupations and the industries in which they are employed. In this section, we again restrict the analytical sample to those who are in the labor force in each month in order to examine the infl uence of individual and employment characteristics on these racially differential patterns in labor market transitions.
The approach taken here is to interact the business cycle variable with the education, industry, and occupation controls. As they are included in the estimations, their infl uence on the racial business cycle response can be observed. If the magnitude falls (or rises), this would indicate that the factor increases (or reduces) the racial differential in business cycle responsiveness.
Panel A of Table 6 reports the estimates for the transitions from employment to un-employment. The coeffi cient estimate on the black × business cycle interaction falls after we include the education or occupation interactions. This indicates that education and occupation contribute to the stronger cyclical responsiveness of blacks. The inclusion of industry interactions with the unemployment rate, however, increases the cyclical respon-siveness of blacks. Thus, blacks are concentrated in industries that have relatively low rates of job loss as the economy contracts. Overall, the inclusion of education, occupation, and industry interactions decreases the black coeffi cient estimate for response to the business cycle from 0.00109 to 0.00099. Thus, the “fi rst fi red” story for blacks is only partially about blacks being concentrated in occupations that are cyclically sensitive and having education levels that leave them more vulnerable to the business cycle.

Black-White Unemployment and the Business Cycle 243
Table 6. Additional Linear Regressions for Infl uence of Education, Occupation, and Industry on
Labor Force Transitions Using Matched Current Population Surveys: 1998–2004
Specifi cation __________________________________________________
Regressor (1) (2) (3) (4)
Panel A. Transition From Employment to Unemployment
Black 0.00895 0.00896 0.00884 0.00890 (0.00037) (0.00037) (0.00036) (0.00037)
Undiff a 0.00348 0.00092 0.00122 0.00202 (0.00029) (0.00010) (0.00011) (0.00031)
Undiff a × Black 0.00079 0.00074 0.00133 0.00099 (0.00025) (0.00025) (0.00025) (0.00025)
Undiff a × Education dummy variables Yes No No Yes
Undiff a × Occupation dummy variables No Yes No Yes
Undiff a × Industry dummy variables No No Yes Yes
Mean of dependent variable 0.01208 0.01208 0.01208 0.01208
Sample size 2,687,890 2,687,890 2,687,890 2,687,890
Panel B. Transition From Unemployment to Employment
Black –0.05116 –0.05126 –0.05050 –0.05136 (0.00579) (0.00580) (0.00579) (0.00582)
Undiff a –0.03729 –0.03124 –0.03352 –0.03063 (0.00276) (0.00293) (0.00258) (0.00425)
Undiff a × Black 0.00404 0.00433 0.00307 0.00435 (0.00306) (0.00305) (0.00305) (0.00310)
Undiff a × Education indicators Yes No No Yes
Undiff a × Occupation indicators No Yes No Yes
Undiff a × Industry indicators No No Yes Yes
Mean of dependent variable 0.32719 0.32719 0.32719 0.32719
Sample size 99,862 99,862 99,862 99,862
Notes: Th e sample consists of males aged 25–55. All estimates are calculated using sample weights provided by the CPS. Standard errors, shown in parentheses, are adjusted for multiple observations per individual. All equations also include a constant, age, age squared, marital status, education, occupation and industry, and state and month fi xed eff ects.
aUndiff = the unemployment rate minus the natural rate of unemployment.
Panel B of Table 6 reports estimates for a linear probability model of the transition from unemployment to employment that includes the new interaction terms. The inclusion of the education and occupation interactions results in a slightly larger coeffi cient estimate for the black response to business cycle conditions. The inclusion of the industry interaction results in a slightly smaller response of blacks to the business cycle. In all cases, however, the coeffi cient measuring the black response to the business cycle beyond that for all work-ers remains small, positive, and statistically insignifi cant. This indicates that black men do not differ from white men in their responsiveness to changes in the tightness of labor markets. Thus, after controlling for the differential responsiveness of education levels, oc-cupations, and industries to the business cycle, there is no evidence that blacks are the last hired. They appear to have a lower relative probability than whites of being reemployed, which does not vary with the state of the economy.

244 Demography, Volume 47-Number 1, February 2010
RESIDUAL DECOMPOSITIONS
In motivating the analysis, we argued that systematic racial differences in the distribution of characteristics related to market productivity could result in blacks being the last hired and the fi rst fi red over the business cycle. We also noted that discrimination would be expected to result in a systematic pattern of residual differences in the unemployment gap across blacks and whites over the business cycle. In this section, we calculate a residual decomposition of the black-white unemployment gap.
The aggregate steady-state unemployment rate for a group equals the entry rate into unemployment, divided by the sum of the entry and exit rates; accordingly, it can be shown that the average black and white difference in the unemployment rate can be decomposed using the following formula:
U Ue x
ee x
ee x
ee x
eB B
B
WB
WB
WB
WB
WB
WB
W W
W
− =+
−+
++
−+
,B W
t t
t
t t
t> >H H
where e B and eW, respectively, represent the entry rate of blacks and whites into un employment; xB and xW, respectively, are the exit rates from unemployment for black and white males; eB
Wt is the predicted rate of entry into unemployment for blacks using
white parameters; and xWBt is the predicted exit rate from unemployment for blacks using
white parameters.Here, the calculations are made using the two-state model in which transitions between
employment and unemployment are examined. The term in the fi rst pair of brackets is the estimated residual difference in unemployment. The term in the second set of brackets is the difference due to observables. Where parameter values are required in these calculations, they are taken from Specifi cation 2 in Table 3.
Table 7 contains the results of the decomposition. The fi rst column contains the aver-age difference in unemployment rates. Using the steady-state formula, this is calculated to be .040. The second column of the table shows the average predicted difference (.004) in black and white unemployment. The results indicate that if blacks had the same formulas for predicting labor force transitions as whites, using their group characteristics, there would be virtually no difference in unemployment across the groups. The third column shows the average residual (.036).
Because a systematic pattern of residuals would be consistent with the possibil-ity that tastes for discrimination are exercised differently when labor demand is strong versus weak, the next two columns show the average residuals in years prior to business cycle peaks versus in the year of a trough and the following year. By this calculation, the residuals are larger in the troughs. The potential impact of discrimination on this difference can be seen by comparing the peak and trough fi gures. This difference is 1.1 percentage points. Using the standard errors associated with the average residual over the peak and trough years, a t statistic for the 1.1-percentage-point difference in the levels
Table 7. Residual Gaps at Peaks and Troughs of the Business Cycle: 1989–2004
Black-White Unemployment Gap ___________________________________________________________
All Years, All Years, All Years, Peak Years, Trough Years, Average Predicted Residual Residual Residual
Steady-State Model .040 .004 .036 .033 .044
SE 5.9E–18 .00092
Notes: Th e entries are averages over individual years. Peak years refer to the last complete year prior to a business cycle peak and in the sample includes 1989 and 2000. Th e average over trough years included the trough itself and the following year. Th e years included in that average are 1991, 1992, 2001, and 2002.

Black-White Unemployment and the Business Cycle 245
takes the value of 11.95. Thus, the differential pattern is statistically signifi cant at any conventional level.
CONCLUSIONThis article considers the assertion that black men are last hired during periods of strong economic growth and the fi rst fi red during downturns using monthly panel data from matched Current Population Surveys from 1989 to 2004. The analysis systematically ex-amines underlying transitions into and out of unemployment for blacks relative to whites rather than inferring relationships from movements in relative unemployment rates. In a sample of prime-age labor force participants, the black-white gap in transition rates into unemployment widens considerably as economic conditions worsen. Although blacks also face a lower rate of becoming reemployed than whites, the relative difference does not change over the business cycle. Thus, the majority of the relative widening and narrowing of the black-white unemployment gap over the business cycle is due to changes in fi ring behavior. The observed patterns are consistent with the hypothesis that blacks are the fi rst fi red when the economy weakens but are not supportive of the argument that blacks are the last hired during periods of growth.
The results presented in the article that point to cyclical changes in the rate of move-ment from employment to unemployment as the dominant factor in explaining aggregate labor-force patterns are also consistent with existing research that does not address black-white differences. Both the literature regarding gross fl ows of workers across labor force states (Abraham and Shimer 2001; Blanchard and Diamond 1990) and examinations of job creation and destruction (Davis and Haltiwanger 1992, 1999) have reached the same conclusion for overall patterns. Badgett (1994) found similar patterns for black and white males in earlier research examining the period 1970–1990.
When the analysis is expanded to include nonparticipation, these basic patterns remain intact, and additional insights into how blacks move through jobs over the business cycle emerge. The estimates presented in this article indicate that when the economy is weak and begins to grow, blacks are disproportionately hired from the ranks of the unemployed. If this result were found only in a sample of those who were labor force participants, it would support the conclusion that blacks are fi rst hired. However, as the growth continues, the rate at which blacks move from unemployment to employment declines, and this is offset by an increase in movements from nonparticipation to employment as the business cycle becomes stronger. The insight gained from these estimates is that early in the business cycle, those blacks with a stronger attachment to the labor force (i.e., the unemployed) are the fi rst hired. Blacks who are nonparticipants tend to be hired late in the business cycle when labor demand is particularly strong. Blanchard and Diamond (1990) documented a similar pattern among other groups.
We also investigate the infl uence of personal characteristics and those of the occupa-tion and industry of employment on the black and white transition rates. Differences in the educational attainment and occupations of blacks and whites tend to make the gaps larger than they would be if these factors were equal across races. The industrial pattern of em-ployment appears to buffer blacks against the infl uence of the business cycle on transitions between employment and unemployment.
We develop a residual decomposition technique based on equations for equilibrium in a two-state model. Predicted and residual differences in the average black and white unemployment rates are calculated and examined at different points of the business cycle. Based on this method, the residual gap is larger in troughs than at peaks. This is consistent with the idea that tastes for discrimination can be exercised more freely during slack peri-ods for the labor market because doing so will be less costly. It is notable that throughout the study, observed characteristics—such as age, education, occupation, and industry of employment—explain little of observed labor market transitions.

246 Demography, Volume 47-Number 1, February 2010
Considerable evidence is presented in this article that blacks are the fi rst fi red as the business cycle weakens. However, there is no evidence that blacks are the last hired. Instead, blacks are initially hired from the ranks of the unemployed early in the business cycle and later are drawn in from nonparticipation. These two impacts do not erase the dif-ference in the rate of entry into employment that is observed between blacks and whites. Moreover, the difference in the rate of entry into employment between blacks and whites does not fl uctuate over the business cycle. As the business cycle becomes stronger, the ra-cial difference in unemployment declines primarily because the rate at which blacks move into unemployment declines.
From a policy perspective, the prominent role of employment termination in deter-mining the racial gap in unemployment rates should focus attention on measures that would improve minority employment retention particularly during downturns. Strength-ening enforcement of existing employment-discrimination statutes is one approach that may prove effective; however, policies aimed more generally at stabilizing employment over the business cycle might prove disproportionately effective in aiding the retention of minority workers.
REFERENCESAbraham, K.G. and R. Shimer. 2001. “Changes in Unemployment Duration and Labor Force Attach-
ment.” Pp. 367–420 in The Roaring Nineties: Can Full Employment be Sustained?, edited by A.B. Krueger and R. Solow. New York: Russell Sage Foundation.
Badgett, M.V.L. 1994. “Rising Black Unemployment: Changes in Job Stability or Employability?” Journal of Black Political Economy 22(3):55–75.
Baker, M. 1992. “Unemployment Duration: Compositional Effects and Cyclical Variability.” Ameri-can Economic Review 82:313–21.
Barrett, N.S. and R.D. Morgenstern. 1974. “Why Do Blacks and Women Have High Unemployment Rates?” Journal of Human Resources 9:452–64.
Becker, G.S. 1957. Discrimination. Chicago: University of Chicago Press.Black, D.A. 1995. “Discrimination in an Equilibrium Search Model.” Journal of Labor Economics
13:309–34.Blanchard, O.J. and P. Diamond. 1990. “The Cyclical Behavior of the Gross Flows of U.S. Workers.”
Brookings Papers on Economic Activity 2:85–143, 154–55.Borjas, G. 2006. “Wage Trends Among Disadvantaged Minorities.” Pp. 59–86 in Economic Chal-
lenges, Policy Changes, and Poverty, edited by R.M. Blank, S.H. Danzinger, and R.F. Schoeni. New York: Russell Sage Foundation.
Bound, J. and R.B. Freeman. 1991. “What Went Wrong? The Erosion of Relative Earnings and Employment Among Young Black Men in the 1980s.” NBER Working Paper No. 3778. National Bureau of Economic Research, Cambridge, MA.
Bradbury, K. 2000. “Riding Tides in the Labor Market: To What Degree Do Expansions Benefi t the Disadvantaged?” New England Economic Review May/June:3–33.
Browne, I. 1997. “Explaining the Black-White Gap in Labor Force Participation Among Women Heading Households.” American Sociological Review 62:236–52.
Clark, K.B. and L.H. Summers. 1979. “Labor Market Dynamics and Unemployment: A Reconsidera-tion.” Brookings Papers on Economic Activity 1:13–72.
———. 1981. “Demographic Differences in Cyclical Employment Variation.” Journal of Human Resources 16:61–79.
Couch, K.A. and M.C. Daly. 2002. “Black-White Wage Inequality in the 1990s: A Decade of Prog-ress.” Economic Inquiry 40:31–41.
———. 2005. “The Improving Relative Status of Black Men.” Journal of Income Distribution 12:56–78.
Couch, K.A. and R.W. Fairlie. 2008. “Last Hired, First Fired? Black-White Unemployment and the Business Cycle.” University of Michigan, National Poverty Center Working Paper No. 2008-14.

Black-White Unemployment and the Business Cycle 247
Davis, S.J. and J. Haltiwanger. 1992. “Gross Job Creation, Gross Job Destruction, and Employment Reallocation.” Quarterly Journal of Economics 107:819–63.
———. 1999. “On the Driving Forces Behind Cyclical Movements in Employment and Job Real-location.” American Economic Review 89:1234–58.
Fairlie, R.W. and W.A. Sundstrom. 1997. “The Racial Unemployment Gap in Long-Run Perspective.” American Economic Review 87:306–10.
———. 1999. “The Emergence, Persistence, and Recent Widening of the Racial Unemployment Gap.” Industrial and Labor Relations Review 52:252–70.
Freeman, R.B. 1973. “Changes in the Labor Market for Black Americans, 1948–1972.” Brookings Papers on Economic Activity 1:67–131.
———. 1991. “Employment and Earnings of Disadvantaged Young Men in a Labor Shortage Econ-omy.” Pp. 103–21 in The Urban Underclass, edited by C. Jencks and P.E. Peterson. Washington, DC: Brookings Institution.
Freeman, R.B. and W.M. Rodgers III. 1999. “Area Economic Conditions and the Labor Market Out-comes of Young Men in the 1990s Expansion.” NBER Working Paper No. 7073. National Bureau of Economic Research, Cambridge, MA.
Gordon, R.J. 2008. “The History of the Phillips Curve: An American Perspective.” Keynote Ad-dress, Australasian Meetings of the Econometric Society. Mimeograph, Northwestern University, Evanston, IL.
Harrington, M. 1962. The Other America. New York: Touchstone.Hines, J.R., Jr., H.W. Hoynes, and A.B. Krueger. 2001. Pp. 493–537 in The Roaring Nineties: Can
Full Employment be Sustained?, edited by A.B. Krueger and R. Solow. New York: Russell Sage Foundation.
Holzer, H.J. 1986. “Reservation Wages and Their Labor Market Effects for Black and White Male Youth.” Journal of Human Resources 21:157–77.
Holzer, H.J. and P. Offner. 2001. “Trends in Employment Outcomes Among Young Black Men 1979–2000.” Unpublished manuscript. Department of Economics, Georgetown University, Wash-ington, DC.
Hoynes, H. 1999. “The Employment, Earnings, and Income of Less-Skilled Workers Over the Busi-ness Cycle.” Institute for Research on Poverty Discussion Paper No. 1199-99. University of Wisconsin–Madison.
Lynch, L.M. 1989. “The Youth Labor Market in the Eighties: Determinants of Re-employment Prob-abilities for Young Men and Women.” Review of Economics and Statistics 71:37–45.
Schulman, S. 1986. “Discrimination, Human Capital, and Black-White Unemployment: Evidence From Cities.” Journal of Human Resources 22:361–76.
Smith, R.E., J.E. Vanski, and C.C. Holt. 1974. “Recession and the Employment of Demographic Groups.” Brookings Papers on Economic Activity 3:737–60.
Summers, L.H. 1981. “Measuring Unemployment.” Brookings Papers on Economic Activity 2:609–20.
U.S. Bureau of Labor Statistics. 2004. “Median Weekly Earnings of Full-Time Wage and Salary Workers by Selected Characteristics.” Labor Force Statistics from the Current Population Survey. Available online at http://www.bls.gov/cps/cpsaat37.pdf.
Welch, F. 1990. “The Employment of Black Men.” Journal of Labor Economics 8(1, part 2):S26–S74.———. 2003. “Catching Up: Wages of Black Men.” American Economic Review 93:320–25.