Laser shock-induced spalling and fragmentation in...
25
Laser shock-induced spalling and fragmentation in vanadium H. Jarmakani a , B. Maddox b , C.T. Wei a , D. Kalantar b , M.A. Meyers a, * a University of California, San Diego, La Jolla, CA 92093 0418, USA b Lawrence Livermore National Laboratory, Livermore, CA 94550, USA Received 1 January 2010; received in revised form 14 April 2010; accepted 16 April 2010 Abstract Polycrystalline and monocrystalline (h100i and h110i) vanadium was subjected to shock compression followed by tensile wave release to study spall and fragmentation behavior. The shock pulse was generated by a direct laser drive at energy levels ranging from 11 to 440 J mm –2 (laser beam irradiated area 1.12 mm 2 ) and initial pulse durations of 3 and 8 ns (approximate initial pressures between 10 and 250 GPa). Glass and polycarbonate shields placed at a specific distance behind the vanadium targets were used to collect and analyze the ejected fragments in order to evaluate and quantify the extent of damage. The effects of target thickness, laser energy, poly- crystallinity and pulse duration were studied. Calculations show melting at a pressure threshold of 150 GPa, which corresponds to a laser energy level of 180 J mm –2 . Consistent with the analytical predictions, the recovered specimens and fragments show evidence of melting at the higher energy levels. Spalling in the polycrystals occurred by a ductile tearing mechanism that favored grain boundaries. In the monocrystals it occurred by a mixture of cleavage fracture along the {0 1 0} planes and ductile dimple fracture. This lower spall strength in polycrystals contradicts predictions from the Hall–Petch equation. Experimentally obtained fragment sizes were compared with predictions from the Grady–Kipp model. The spall strength of vanadium under laser loading conditions was calculated from both VISAR pull-back signals and using the spall thickness. It was found to be considerably higher than predictions from gas gun experi- ments, the monocrystals showing a higher value than polycrystals. This higher spall strength is suggestive of a strong time dependence of the phenomenon, consistent with the nucleation and growth kinetics of voids and the strain rate sensitivity embedded in the Grady theory. Ó 2010 Acta Materialia Inc. Published by Elsevier Ltd. All rights reserved. Keywords: Impact behavior; Fracture; Laser treatment; Vanadium; Schock 1. Introduction The dynamic spalling and fragmentation of metals induced by laser irradiation is a concern of great signifi- cance to the successful operation of the National Ignition Facility (NIF). Protection from spalling and fragmentation is necessary to preserve the functionality of the laser optics systems and diagnostic tools of the main target chamber. In particular, vanadium is a candidate material for first wall and blanket components of fusion power systems because of its low irradiation-induced activity, high stability and good compatibility with lithium [1–3]. Studies on the extent of damage to metal targets and their surroundings caused by laser impingement on the sur- face are scarce. Spall is the dynamic fracture that takes place inside a solid body as a result of tensile stresses that develop due to the interaction of propagating waves. Com- pressive waves traveling from the energy deposition surface of a body intersect those reflecting from the rear surface, causing internal ruptures, or spallation, if the tensile stres- ses are sufficiently high. Damage accumulation takes place in four stages: (a) nucleation of voids or cracks at existing damage sites; (b) growth of individual voids or cracks; (c) coalescence of voids or cracks; (d) fragmentation [4–6]. Much of the research on dynamic fracture has been carried out under planar flyer plate impact [7–11] and high explosive detonation [12–16]. These typical methods of 1359-6454/$36.00 Ó 2010 Acta Materialia Inc. Published by Elsevier Ltd. All rights reserved. doi:10.1016/j.actamat.2010.04.027 * Corresponding author. Tel.: +1 858 534 4719; fax: +1 858 534 5698. E-mail address: [email protected] (M.A. Meyers). www.elsevier.com/locate/actamat Available online at www.sciencedirect.com Acta Materialia xxx (2010) xxx–xxx ARTICLE IN PRESS Please cite this article in press as: Jarmakani H et al. Laser shock-induced spalling and fragmentation in vanadium. Acta Mater (2010), doi:10.1016/j.actamat.2010.04.027
Transcript of Laser shock-induced spalling and fragmentation in...

Available online at www.sciencedirect.com
ARTICLE IN PRESS
www.elsevier.com/locate/actamat
Acta Materialia xxx (2010) xxx–xxx
Laser shock-induced spalling and fragmentation in vanadium
H. Jarmakani a, B. Maddox b, C.T. Wei a, D. Kalantar b, M.A. Meyers a,*
a University of California, San Diego, La Jolla, CA 92093 0418, USAb Lawrence Livermore National Laboratory, Livermore, CA 94550, USA
Received 1 January 2010; received in revised form 14 April 2010; accepted 16 April 2010
Abstract
Polycrystalline and monocrystalline (h1 0 0i and h1 1 0i) vanadium was subjected to shock compression followed by tensile waverelease to study spall and fragmentation behavior. The shock pulse was generated by a direct laser drive at energy levels ranging from11 to 440 J mm–2 (laser beam irradiated area 1.12 mm2) and initial pulse durations of 3 and 8 ns (approximate initial pressures between10 and 250 GPa). Glass and polycarbonate shields placed at a specific distance behind the vanadium targets were used to collect andanalyze the ejected fragments in order to evaluate and quantify the extent of damage. The effects of target thickness, laser energy, poly-crystallinity and pulse duration were studied. Calculations show melting at a pressure threshold of �150 GPa, which corresponds to alaser energy level of �180 J mm–2. Consistent with the analytical predictions, the recovered specimens and fragments show evidence ofmelting at the higher energy levels. Spalling in the polycrystals occurred by a ductile tearing mechanism that favored grain boundaries. Inthe monocrystals it occurred by a mixture of cleavage fracture along the {0 1 0} planes and ductile dimple fracture. This lower spallstrength in polycrystals contradicts predictions from the Hall–Petch equation. Experimentally obtained fragment sizes were comparedwith predictions from the Grady–Kipp model. The spall strength of vanadium under laser loading conditions was calculated from bothVISAR pull-back signals and using the spall thickness. It was found to be considerably higher than predictions from gas gun experi-ments, the monocrystals showing a higher value than polycrystals. This higher spall strength is suggestive of a strong time dependenceof the phenomenon, consistent with the nucleation and growth kinetics of voids and the strain rate sensitivity embedded in the Gradytheory.� 2010 Acta Materialia Inc. Published by Elsevier Ltd. All rights reserved.
Keywords: Impact behavior; Fracture; Laser treatment; Vanadium; Schock
1. Introduction
The dynamic spalling and fragmentation of metalsinduced by laser irradiation is a concern of great signifi-cance to the successful operation of the National IgnitionFacility (NIF). Protection from spalling and fragmentationis necessary to preserve the functionality of the laser opticssystems and diagnostic tools of the main target chamber. Inparticular, vanadium is a candidate material for first walland blanket components of fusion power systems becauseof its low irradiation-induced activity, high stability andgood compatibility with lithium [1–3].
1359-6454/$36.00 � 2010 Acta Materialia Inc. Published by Elsevier Ltd. All
doi:10.1016/j.actamat.2010.04.027
* Corresponding author. Tel.: +1 858 534 4719; fax: +1 858 534 5698.E-mail address: [email protected] (M.A. Meyers).
Please cite this article in press as: Jarmakani H et al. Laser shock-indudoi:10.1016/j.actamat.2010.04.027
Studies on the extent of damage to metal targets andtheir surroundings caused by laser impingement on the sur-face are scarce. Spall is the dynamic fracture that takesplace inside a solid body as a result of tensile stresses thatdevelop due to the interaction of propagating waves. Com-pressive waves traveling from the energy deposition surfaceof a body intersect those reflecting from the rear surface,causing internal ruptures, or spallation, if the tensile stres-ses are sufficiently high. Damage accumulation takes placein four stages: (a) nucleation of voids or cracks at existingdamage sites; (b) growth of individual voids or cracks; (c)coalescence of voids or cracks; (d) fragmentation [4–6].Much of the research on dynamic fracture has been carriedout under planar flyer plate impact [7–11] and highexplosive detonation [12–16]. These typical methods of
rights reserved.
ced spalling and fragmentation in vanadium. Acta Mater (2010),

2 H. Jarmakani et al. / Acta Materialia xxx (2010) xxx–xxx
ARTICLE IN PRESS
generating shock waves produce pressures less than100 GPa and pulse durations of a minimum of 50 ns.
Only recently have laser-driven shock experimentsbegun to gain momentum [16–28]. The advantages of usinghigh intensity lasers to produce shocks in metals lie in thefact that extremely high pressures (in the TPa range) andstrain rates (�109 s–1) can be achieved with pulse durationsof only a few nanoseconds. More accurate microstructuralcharacterization is also possible due to the self-quenchingmechanism associated with laser shock (discussed in detailby Meyers et al. [29] and Cao et al. [30]). Interestingly,almost no research has been carried out on the dynamicbehavior of materials shocked above their melting pres-sures. A notable exception is a study by Resseguier et al.[31] on liquid spall in laser-shocked tin. Lubarda et al.[32] looked at void growth in copper induced by a laser.Little is known about the process of material ejection fromthe spalled surface of laser-shocked samples and the frag-mentation, spreading of debris and extent of damage tosurrounding objects.
Earlier findings of considerable interest were the lowerspall strength exhibited by polycrystalline than monocrys-talline copper. This contradicts the Hall–Petch equationand has been attributed to the existence of nucleation sitesat grain boundaries in the polycrystals by Christy et al. [33]and Kanel et al. [34]. Meyers [35] also discussed this andprovided an interpretation based on the greater availabilityof nucleation sites in the polycrystals. Another issue ofimportance is the pulse length dependence of spall strength.In support of spalling as a nucleation, growth and coales-cence process, Gray and co-workers [36,37] demonstratedthat for stainless steel and copper it is time-dependent,being higher for the triangular pulse than for a square pulsegenerated by flyer plate impact. Gilath [38] reported a twoto threefold increase in the spall strength of aluminum inlaser experiments in comparison with gas gun spallingreported by Grady [39].
This previous research was the motivation for the inves-tigation whose results are reported herein: the spalling andfragmentation of vanadium induced by laser irradiation.
2. Experimental procedure
The polycrystalline vanadium foils used in this workwere obtained from Alpha Aesar and had a purity of�99.8%. Three different foil thicknesses were used: 75,127 and 250 lm. Polycrystalline specimens from each ofthe three as received foils were cut, polished and etchedto measure the grain size. Monocrystalline specimens withthe orientations h1 1 0i and h1 0 0i and thickness 250 lmwere used. They were obtained from Accumet Materialsand had a reported purity of P99.999%.
The specimens were polished using 1200, 2400 and 4000grit paper, followed by 0.3 and 0.05 lm alumina com-pound. The etchant used was a mixture of 1 ml HF,30 ml HNO3 and 30 ml lactic acid. Micrographs of thegrains revealed after etching are shown in Fig. 1, and a
Please cite this article in press as: Jarmakani H et al. Laser shock-indudoi:10.1016/j.actamat.2010.04.027
summary of the grain sizes and aspect ratios are given inTable 1. All specimens exhibited grain elongation due torolling.
The laser experiments were conducted at the JupiterLaser Facility, Lawrence Livermore National Laboratory.Fig. 2 is an illustration of the cross-sectional view of theexperimental set-up. Fig. 2a shows the general set-up ofthe experiment and Fig. 2b and c are depictions qualita-tively showing the damage that occurred to the vanadiumtargets as the thickness changes. Fig. 2b shows completeblow-off of the thinnest vanadium samples; Fig. 2c showsblow-off surrounded by a spall surface in the intermediatethickness samples; Fig. 2d shows only spall that occurs inthe thickest samples.
A Nd glass laser with a 532 nm pulse width was used togenerate high pressure laser-driven shocks in the vanadiumsamples. Both 3 and 8 ns square pulse lengths were used tostudy the effect of pulse duration on material behavior. A1 mm kineform phase plate (KPP) was used to generate aflat intensity profile that was �1 mm square in size. Thevanadium samples were cut into small 3.5 � 5 mm rectan-gles and glued between two steel washers having a 10 mmouter diameter and 2.5 mm inner diameter. Glass slideswere placed parallel to the targets, approximately 12 cmbehind, to collect vanadium fragments and to analyze theresultant damage. The associated laser energies and pulsedurations of the polycrystalline samples investigated aretabulated in Table 2. The pressure at the rear surface ofthe vanadium targets was determined by measuring the freesurface velocity using the VISAR technique [40]. The veloc-ity interferometer was configured in the Mach–Zendergeometry and coupled to a Hamamatsu streak camera setto a 50 ns sweep to provide a time-dependent pressure his-tory [41]. The spatial scale of the line in VISAR was around800 lm at the target plane. The central �100 lm of thatregion was used.
The Doppler shift of light reflected off the back surfaceof the targets was observed as a phase shift in the fringepattern recorded by the streak camera. The fringe phaseu is related to the velocity of the reflecting surface u by:
ku4psð1þ dÞ ¼ u ð1Þ
where k is the wavelength of the VISAR probe laser and sis the optical delay produced by a glass etalon in the inter-ferometer. This optical delay can be calculated for a givenetalon of thickness d and index of refraction n by:
s ¼ 2dðn� 1=nÞc
ð2Þ
where c is the velocity of sound. Dispersion in the etalonintroduces a wavelength-dependent correction d [42]. Forthe 532 nm wavelength probe laser used in this studyd = 0.0318.
When a shock wave reaches the VISAR probe surfacethe resulting fringe phase jump is discontinuous and thenumber of 2p phase jumps cannot be uniquely determined
ced spalling and fragmentation in vanadium. Acta Mater (2010),

Fig. 1. Grains revealed after etching of top/bottom surface (left) and cross-section (right) of samples: (a) 75 lm thickness; (b) 127 lm thickness; (c) 250 lmthickness.
Table 1Grain sizes of as received vanadium foils.
Thickness(lm)
Top/bottom surface Cross-section surface
Grain size(lm)
Aspectratio
Grain size(lm)
Aspectratio
75 100 3.5:1 16 6:1127 64 2.4:1 20 3:1250 126 4:1 13 8:1
H. Jarmakani et al. / Acta Materialia xxx (2010) xxx–xxx 3
ARTICLE IN PRESS
using a single VISAR interferometer alone. Thus, two inde-pendent interferometers using two different etalon thick-nesses, d1 = 50.074 and d2 = 28.77221 mm, wereemployed to resolve this fringe jump ambiguity. By settingu = 2p in Eq. (1), one can calculate the velocity sensitivityin km s–1 fringe–1 for a given optical delay or etalon thick-ness. For the etalons used in this study, the velocity sensi-tivities were calculated to be 0.995041093 and1.731729599 km s–1 fringe–1 for d1 and d2, respectively.
Please cite this article in press as: Jarmakani H et al. Laser shock-indudoi:10.1016/j.actamat.2010.04.027
3. Results and discussion
Section 3.1 presents the calculated pulse decay usingboth a simplified and the HYADES methods. Section 3.2presents a thermodynamic analysis determining the meltingtemperature as a function of pressure, which enables calcu-lation of the critical pressure for melting. Section 3.3 pro-vides a detailed characterization of the recoveredspecimens in order of increasing thickness. Section 3.4 pre-sents results of monocrystalline experiments. Section 3.5shows the shadowgraphs of the in-flight fragments. Sec-tion 3.6 involves fragment size modeling of vanadium dueto spalling. Section 3.7 discusses spall strength calculationsof vanadium based on the laser shock experiments.
3.1. Calculated pulses using HYADES and tantalum results
The calculated pressures and decay profiles using theone-dimensional HYADES code are shown in Fig. 3a. The
ced spalling and fragmentation in vanadium. Acta Mater (2010),

Fig. 2. (a) Schematic of the cross-sectional view of the experimental set-up; (b) laser shock of thinnest target; (c) laser shock of intermediatethickness target; (d) laser shock of thickest target.
Table 2Laser energy and pulse duration of experiments.
Experiment Foilthickness (lm)
Energy(J)
Diagnostic Pulse length(ns)
3 75 290 Glass shield 34 75 167 Glass shield 35 127 228 Glass shield 38 250 438 Glass shield 39 127 430 Glass shield 3
11 250 251 Glass shield 312 250 442 Aerogel 313 127 381 Aerogel 314 127 209 Aerogel 315 75 199 Aerogel 318 127 218 Glass shield 822 127 218 Glass shield 8
Fig. 3. (a) HYADES code simulation of laser pulse propagation invanadium with 61% reflectivity [�] from simulation by. s represents 400 Jlaser propagated in V: initial pressure 234GPa; free surface pressure60.1 GPa; duration of propagation �32 ns. h represents 200 J laserpropagated in V: initial pressure 161 GPa; free surface pressure 37.5 GPa;duration of propagation 36 ns. D represents 100 J laser propagated in V:initial pressure 107 GPa, free surface pressure 16.4 GPa; duration ofpropagation 41.1 ns. (b) Calculated decay of pulse propagation for initialenergy of 100 J.
4 H. Jarmakani et al. / Acta Materialia xxx (2010) xxx–xxx
ARTICLE IN PRESS
pressure pulse decay profiles were calculated at the three dif-ferent energy levels around which the experiments were con-ducted: 100, 200 and 400 J. The results were calibrated forthe reflectivity of vanadium, taken as 61% [43]. The pressuresdecayed rather rapidly as the pulse duration increased. Thetriangular nature of the pulse shape was retained throughoutpropagation in the 250 lm thick specimens. The initial pres-sures, which were equal to 107, 161 and 234 GPa for the threeenergy levels (100, 200 and 400 J), were reduced to approxi-mately one-quarter of their original values at the free surface.
The pressure profiles were also computed based on cal-ibrated laser shock experiments on tantalum carried out at200 J (D. Eder, unpublished work). The conversion ofparameters from tantalum to vanadium was carried outusing the conservation of energy equation:
DE ¼ 1
2U 2
p ð3Þ
where DE is the change in energy and Up is the particle veloc-ity. The internal energy inside the shock-compressed mate-
Please cite this article in press as: Jarmakani H et al. Laser shock-indudoi:10.1016/j.actamat.2010.04.027
rial is a function of the laser energy and, to a firstapproximation, we assumed that this function is materialindependent. Differences in reflectivity between vanadium(61%) and tantalum (78%) were neglected. The experimentalpressure values as a function of distance into the material ob-tained from the tantalum experiments (D. Eder, unpublishedwork) are listed in Table 3. The predicted pressure pulse de-cay profiles in vanadium for an input energy of 100 J is pre-sented in Fig. 3b. It can be seen that the results in Fig. 3a andb are fairly consistent. Experimental predictions using thetantalum results match the HYADES calculations fairly
ced spalling and fragmentation in vanadium. Acta Mater (2010),

Fig. 4. Spall strength estimation from spall plane: (a) predicted pulse decay from calculation at 200 J; (b) from calculation at 400 J; (c) HYADEScomputation at 200 J; (d) HYADES computation at 400 J.
H. Jarmakani et al. / Acta Materialia xxx (2010) xxx–xxx 5
ARTICLE IN PRESS
well. Fig. 4a and b show the pressure decay for energies of200 and 400 J calculated from Eq. (3). The rate of decay ofthe pulse was a little lower for HYADES, leading to higherpressures at the spall side of the specimens.
The spall strength was calculated by two methods: usingthe thickness of the spall regions and by VISAR velocimetry,through the pull-back signal technique. The thickness of thespall layer can be used to obtain a simple estimate of the spallstrength through the schematic representation of Fig. 5. Thespall strength rT is shown in the reflected portion of the wave.The distance D represents the distance that the reflected wavehad traveled until it reached the level at which the materialspalled. The relationship between P, the maximum stress atthe back surface, D and rT is, for a perfectly triangular pulsehaving a length L [38]:
rT ¼2DL
P ð4Þ
Eq. (4) was used to obtain the spall strengths of speci-mens in which D could be established in a clear and incon-trovertible manner. The results are discussed in Section 3.7
Please cite this article in press as: Jarmakani H et al. Laser shock-indudoi:10.1016/j.actamat.2010.04.027
3.2. Modeling of melting of vanadium under shock
compression
The temperature rise due to shock and the melting tem-perature as a function of pressure were computed in orderto determine the theoretical pressure at which vanadiumwill melt when subjected to a shock. The Clausius–Clapey-ron relation describes the effect of pressure on the temper-ature at which a phase transition occurs between two statesof matter (see, for example, [44]). For melting, this relationis given by:
dPdT¼ DH m
TDV m
ð5Þ
where Hm is the enthalpy of fusion at the melting point(422 J g–1) and Vm is the volume change associated withmelting, assumed to be independent of pressure. Vm forvanadium is expressed as:
DV m ¼1
qT m
� 1
qT o
1þ DVV o
� �ð6Þ
ced spalling and fragmentation in vanadium. Acta Mater (2010),

Table 3Pressure and Up values as a function of distance obtained from laser shockexperiments on tantalum from D. Eder (unpublished report).
Distance (lm) Pressure (GPa) Up (km s–1)
100 150 1.664200 60 0.819250 40 0.584
6 H. Jarmakani et al. / Acta Materialia xxx (2010) xxx–xxx
ARTICLE IN PRESS
where V/Vo is the change in volume from To to Tm, qT mis
the density of solid vanadium at the melting temperature(5.76 g cm–3, determined from Sorkin et al. [45], which indi-cated that [V(Tm)]/[V(To)] = 1.06), qT o
is the density atambient temperature and pressure (6.11 g cm–3) and V/Vo
is given by:
DV =V o ¼ 3cT m ð7Þwhere c is the thermal expansion coefficient, 8.4 � 10�6 K–1,and Tm is the melting temperature of vanadium, 2183 K.Rearranging Eq. (5), integrating and solving for melting tem-perature as a function of pressure yields the following expres-sion that relates the melting temperature to pressure:Z ðT mÞP
ðT mÞo
dTT¼ DV
DH
Z P
P¼0
dP
! lnðT mÞp ¼DVDH
P þ lnðT mÞo ð8Þ
The temperature rise induced by shock compression hasbeen extensively analyzed and modeled in the literature(see, for example, [44]). The shock temperature rise canbe calculated using the following equation:
T s ¼ T o expco
V o
ðV o� V 1Þ� �
þ P ðV o� V 1Þ2Cv
þexp �co
V oV 1
h i2Cv
Z V 1
V o
P expco
V o
V� �
2� co
V o
ðV o� V Þ� �
dV
ð9Þ
Fig. 5. Calculation of spall strength from reflected pulse at free surface.
Please cite this article in press as: Jarmakani H et al. Laser shock-indudoi:10.1016/j.actamat.2010.04.027
where co is the Gruneisen parameter (two for vanadium[45]), Cv is the specific heat capacity (489 J kg K–1) andVo and V1 are the initial and current specific volumes ofthe material, respectively. The pressure dependence on vol-ume or the Hugoniot is given as:
P ¼ CoðV o � V Þ½V o � SðV o � V Þ�2
ð10Þ
V1 can be calculated from the relationship [44]:
V 1 ¼C2
o
2PS2
ffiffiffiffiffiffiffiffiffiffiffiffiffiffiffiffiffiffiffiffiffi1þ 4PSV o
C2o
sþ 2SðS � 1ÞV oP
C2o
� 1
" #ð11Þ
The melting temperature (determined from the Clau-sius–Clapeyron relation) and the shock temperature riseas a function of pressure are given in Fig. 6. The melt curvedetermined by the Clausius–Clapeyron relation (red solidline) is in agreement with experimental work carried outby Jephcoat et al. [46]. Their work was, however, confinedto pressures up to 100 GPa. Interestingly, our modelingcaptured the surprisingly small melting slopes seen in bccmetals, which were clearly documented in extensive workby Errandonea et al. [47]. The predicted shock temperatureprofile (solid black line) is in agreement with data reportedby McQueen et al. [48] up to a pressure of �160 GPa,where it begins to deviate. The plot shows that vanadiumremained solid up to a pressure of �150 GPa, after whichit melted. Our predicted melting pressure of 150 GPa islower than results obtained experimentally by Dai et al.[49], who determined a melting pressure of �250 GPa.We also plotted the release curve for vanadium fromMcQueen et al. [48]. The release curve lies below the meltcurve, suggesting that any material that melts under shockwill be quenched back to the solid state upon release.
Fig. 6. Shock temperature rise and melting temperature as a function ofpressure.
ced spalling and fragmentation in vanadium. Acta Mater (2010),

H. Jarmakani et al. / Acta Materialia xxx (2010) xxx–xxx 7
ARTICLE IN PRESS
3.3. Characterization of samples
Analysis and characterization of the samples were car-ried out by optical and scanning electron microscopy(SEM), and the findings are presented in four sections inthe order of increasing thickness of the samples: poly-crystals 75 (Section 3.3.1), 127 (Section 3.3.2) and 250 lm(Section 3.3.3) thick and 250 lm thick monocrystals(Section 3.4).
3.3.1. Experiments on 75 lm thick targets
Three 75 lm thick samples were laser-shocked at energylevels of 167, 199 and 290 J and at an initial pulse durationof 3 ns. Almost complete blow-off occurred in all the sam-ples, as shown in Fig. 7a, except for small portions aroundthe hole in the washer that remained. Fig. 7b shows anSEM image of the surface of the “lip” that remained after
Fig. 7. (a) 75 lm thick polycrystalline specimen after laser shock, 167 J; (b) surthick samples showing flaking due separation along grains, 199 J.
Please cite this article in press as: Jarmakani H et al. Laser shock-indudoi:10.1016/j.actamat.2010.04.027
irradiation in the 167 J experiment. The exposed grainsfrom the spall region show the characteristic elongatedconfiguration. The blow-off surfaces of the samples wherevanadium was ejected revealed a flaking phenomenonmostly attributed to grain boundary separation. Separationalong grain boundaries can also be clearly seen in Fig. 7c,for 199 J, which also captures grain elongation along therolling direction.
The samples shocked at 167 and 290 J had glass shieldsplaced behind them, whereas the sample shocked at 199 Jhad an aerogel set-up (aerogel experiments are not dis-cussed in this study). Because of their thinness, a significantamount of vanadium was ejected onto the glass shields ascompared with samples having a greater thickness. Mostof the damage and rubble was collected at the center ofthe glass shields. Fig. 8 shows micrographs of the damageon the surface of the glass shields induced by vanadium
face of “lip” showing elongated grains, 167 J; (c) blow-off surface of 75 lm
ced spalling and fragmentation in vanadium. Acta Mater (2010),

(a)
(c)
(b)
(d)
Fig. 8. Glass shields damaged by polycrystalline vanadium, 75 lm; (a) 167 J; (b) 290 J; (c) circular grid placed on glass shield for fragment quantification;(d) fragments per area as a function of distance from central damage.
1 For interpretation of color in Figs. 1–4, 6–13, 16–20 and 23–28, thereader is referred to the web version of this article.
8 H. Jarmakani et al. / Acta Materialia xxx (2010) xxx–xxx
ARTICLE IN PRESS
fragments for both the 167 and 290 J experiments (Fig. 8aand b). Clearly, the extent of damage from the ejected frag-ments was greater in the 290 J experiment. In order toquantify the damage to the glass shields induced by thevanadium fragments, a circular grid was superimposed onthe glass shield images, as shown in Fig. 8c, and the imag-ing software ImageJ was used to help determine the num-ber of fragments per unit area as a function of distanceaway from the central damage zone. Clearly, the plot inFig. 8d shows that the extent of damage (fragments perunit area) to the 290 J glass shield was more significantcompared with the 167 J glass shield. The experimentaldata are well matched by a power function. Note the reduc-tion in damage away from the central crater.
SEM images of the glass shields revealed that vanadiumdebris collected in two forms: solid fragments and molten/resolidified fragments. In the case of the 167 J experimentsolid vanadium fragments and “splashes” were evidentaround the edges of the central crater (Fig. 9). Fig. 9a showsthe main central crater and the damage induced by the vana-dium. Fig. 9b is a close-up view of an area around the cratershowing mostly vanadium flakes and occasional “splashes”
(circled). It should be noted that the occurrence of resolidi-fied vanadium around the crater was less frequent than inthe 290 J experiment. Fig. 9c shows a high density of vana-dium debris around the central crater. This image is aclose-up of the area within the box highlighted in Fig. 9a.
Please cite this article in press as: Jarmakani H et al. Laser shock-indudoi:10.1016/j.actamat.2010.04.027
SEM analysis of the glass shield from the 290 J experi-ment showed more significant damage and greater meltingof vanadium around the edges of the central crater(Fig. 10a). Note the radial and circumferential cracks onthe glass surface due to the vanadium fragments.Fig. 10b shows larger vanadium fragments surrounded byvanadium “splashes”. Fig. 10c is a higher magnificationSEM image of the resolidified vanadium. The image tothe right suggests that the vanadium particle was ejectedin liquid form from the target and formed a solid outershell enclosing an inner liquid core as it traveled towardsthe glass shield. Upon impact the outer shell was squashedreleasing the inner liquid core around it.
It should be noted here that the melting and shock tem-perature rise modeling (Fig. 6) suggests that any vanadiumthat melts under shock compression should resolidify uponrelease, since the release curve (blue line)1 lies beneath themelt curve (red line). As observed from the SEM results,melting of vanadium did indeed occur in the experiments.This implies that melting must have occurred under shockand not release (known as high pressure melting). A surveyof the literature suggests that this phenomenon is uncom-mon. Furthermore, the very short pulse durations (3 ns)in the experiments provided very little time for the material
ced spalling and fragmentation in vanadium. Acta Mater (2010),

(a)
(b)
(c)
Fig. 9. Glass shield of 75 lm polycrystalline specimen shocked at 167 J, 3 ns; (a) central crater; (b) vanadium particles near center crater; (c) vanadiumdebris near central crater.
H. Jarmakani et al. / Acta Materialia xxx (2010) xxx–xxx 9
ARTICLE IN PRESS
to solidify upon release, which is probably why weobserved melting on the glass shield. Melting upon impactwith the glass shield is also a likely scenario.
Energy dispersive X-ray spectroscopy (EDS) was con-ducted on the glass shields and the energy spectrum wasanalyzed to confirm the elements present. Elemental analy-sis of the large fragment corresponding to the dottedsquare and the background/glass shield within the area ofthe small solid square was conducted and confirmed thatit was indeed vanadium.
3.3.2. Experiments on 127 lm thick targets
The 127 lm vanadium targets that were analyzed in thisstudy were subjected to the following laser energies: 209,
Please cite this article in press as: Jarmakani H et al. Laser shock-indudoi:10.1016/j.actamat.2010.04.027
218, 228, 381 and 430 J. The 209 and 381 J experimentshad aerogels placed behind the targets instead of glassshields (only the targets are studied in these cases) andtwo 218 J experiments were carried out with both glassshield and aerogel set-ups. The pulse duration in all caseswas 3 ns, except for the 218 J experiment, where it was8 ns. The 218 and 228 J experiments provided a means tocompare the effect of the change in pulse duration at com-parable laser energies. In all cases, the target showed tear-ing away around the square laser spot and a spall surfaceformed around the hole or area blown off, as shown inFig. 11 for one of the 218 J experiments. The vanadiumsample pertaining to the 218 J, 8 ns experiments had aslightly larger blow-off diameter compared with the 209 J,
ced spalling and fragmentation in vanadium. Acta Mater (2010),

(a)
(b)
(c)
Fig. 10. (a) Glass shield of 75 lm specimen shocked at 290 J, 3 ns: (a) central crater with radial and circumferential cracks; (b) Solid particles andfragments; (c) particles that were molten upon impact, 290 J.
10 H. Jarmakani et al. / Acta Materialia xxx (2010) xxx–xxx
ARTICLE IN PRESS
3 ns experiment, probably due to both the increased pulseduration and slightly higher energy level.
More material around the laser spot survived comparedwith the 75 lm thick targets (Fig. 11a). Direct interactionof the laser beam with the vanadium surface also causedmelting. Flaking and peeling away along the grain bound-aries can clearly be seen in Fig. 11b and dimpling and voidformation on the blown-off surface was also evident(Fig. 11c), which are characteristics of ductile behavior.These features typically form as a result of void nucleation,growth and coalescence. The blow-off diameter increasedwith pulse duration. Fig. 12 shows the increase in blow-off diameter as the laser energy was increased.
Please cite this article in press as: Jarmakani H et al. Laser shock-indudoi:10.1016/j.actamat.2010.04.027
The glass shields analyzed showed a clear effect of theincrease in laser energy and pulse duration. Much moredamage and debris accumulated on the glass shields atthe higher energy levels. Fig. 13 shows images of the cra-tered surfaces of the glass shields placed behind the127 lm thick targets. The glass shield in Fig. 13a wasplaced behind the target subjected to a 218 J pulse havinga duration of 8 ns, whereas the glass shield in Fig. 13brepresents the 3 ns pulse at 228 J. The higher pulse dura-tion does not seem to have increased the amount of dam-age to the glass shield. However, it resulted in largerfragments being ejected from the vanadium targets, aswould be expected. In fact, the damage on the glass
ced spalling and fragmentation in vanadium. Acta Mater (2010),

Fig. 11. 127 lm thick specimen after laser shock, 218 J, 8 ns; (a) overall view showing blow-off and spalled region; (b) flaking due to grain boundaryseparation; (c) dimples and voids.
Fig. 12. Blow-off diameter of 127 lm thick specimens.
H. Jarmakani et al. / Acta Materialia xxx (2010) xxx–xxx 11
ARTICLE IN PRESS
shield subjected to the 3 ns pulse was significantly greater.Fig. 13c shows the surface of the glass shield behind thetarget subjected to 430 J. Clearly, a greater amount ofvanadium was ejected onto the glass shield, causing moredamage. One can see the geometrically square nature ofthe central damaged zone in Fig. 13c, which is due tothe square geometry of the laser focal spot incident onthe target. Fig. 13d is a plot showing quantification ofthe fragments on the glass shields. Clearly, the fragmentsper unit area increased as the laser energy increased. Theexperimental results were fitted to power functions thatdescribe well the rapid rise in fragment density close tothe center of the target.
SEM images of the glass shields revealed that a moresignificant amount of vanadium melted and splashed ontothe surface in the case of the 8 ns laser pulse at the lowerenergy level. Fig. 14 shows the greater degree of meltingthat occurred in the 218 J, 8 ns experiment as comparedwith the 228 J, 3 ns experiment. The glass shield placedbehind the target subjected to a 3 ns pulse at 430 J revealedthe greatest amount of melting (Fig. 15). At this highestenergy level tiny vanadium fragments in the form of whis-kers (�3 lm in length) were evident and spread around themain cratered region.
Please cite this article in press as: Jarmakani H et al. Laser shock-indudoi:10.1016/j.actamat.2010.04.027
3.3.3. Experiments on 250 lm thick targets
The 250 lm thick vanadium targets were subjected to alaser beam at the following energies: 251, 438 and 442 J.
ced spalling and fragmentation in vanadium. Acta Mater (2010),

Fig. 13. Glass shields placed behind 127 lm thick targets; (a) 218 J, 8 ns; (b) 228 J, 3 ns; (c) 430 J, 3 ns; (d) fragments per area vs. distance from centralcrater.
Fig. 14. (a) SEM images of glass shield behind 127 lm thick target, 218 J, 8 ns; (a) damage around edges of crater; (b) splashes around central crater; (c)molten and solid vanadium particles; (d) vanadium clumps.
12 H. Jarmakani et al. / Acta Materialia xxx (2010) xxx–xxx
ARTICLE IN PRESS
Please cite this article in press as: Jarmakani H et al. Laser shock-induced spalling and fragmentation in vanadium. Acta Mater (2010),doi:10.1016/j.actamat.2010.04.027

Fig. 15. SEM images of glass shield behind 127 lm thick target, 430 J, 3 ns: (a) vanadium splashing around edges of central crater (b and c) vanadiumdebris, both solid and splashes; (d) vanadium whiskers.
H. Jarmakani et al. / Acta Materialia xxx (2010) xxx–xxx 13
ARTICLE IN PRESS
The pulse duration in all cases was 3 ns (the 442 J experi-ment had an aerogel diagnostic). Because of the increasedthickness, the targets were not punctured through. Instead,a spall plane formed on the back surface of all the 250 lmtargets where vanadium was ejected from the surface(Fig. 16). Even the sample subjected to 50 J energy showedcomplete separation. The fibrous appearance of the frac-ture is consistent with separation along grain boundaries,which is discussed below. Fig. 17 is a plot of the spall diam-eter as a function of laser energy for both the 250 lm and127 lm targets (the spalled area around the tear-off regionis considered in the case of the 127 lm targets). The plotshows an increase in spall diameter (and, hence, spall sur-face area) as the energy increased. The spall diameter inthe 127 lm targets was, however, larger than that in the250 lm targets. The 251 J sample was sectioned andmounted in order to better analyze the spall surface.Fig. 18 shows cross-sections of the specimen. Flaking, sep-aration along the grains, cracking and the formation ofvoids close to the surface are evident.
Again, the glass shield placed behind the highest energyexperiment at 438 J exhibited a greater amount of damageas compared with the 251 J experiment, as shown in
Please cite this article in press as: Jarmakani H et al. Laser shock-indudoi:10.1016/j.actamat.2010.04.027
Fig. 19a and b. The plot in Fig. 19c clearly shows a greaternumber of fragments in the 438 J experiment. It should benoted that at comparable energy levels the damage accu-mulation on the glass shields decreased as the target thick-ness increased. For instance, the damage on the glass shieldplaced behind the 75 lm thick sample subjected to 167 Jhad much more damage than that placed behind the250 lm sample subjected to 251 J. SEM analysis of theglass shields placed behind the 250 lm thick samplesrevealed much more melting/solidification of vanadium atthe higher energy level of 438 J (Fig. 20).
3.4. Monocrystalline targets
The fracture morphology in the monocrystalline sam-ples was quite different from the polycrystalline ones. Threemarked differences were observed.
a. Fracture was characterized by both brittle and ductilemorphologies. Fig. 21b shows evidence of cleavageon the back surface of the h1 0 0i vanadium subjectedto 36 J. This brittle fracture along [0 1 0] and [0 0 1] isin contrast to ductile fracture in the spall, seen in
ced spalling and fragmentation in vanadium. Acta Mater (2010),

Fig. 16. Spalling of 250 lm samples; (a) 50 J, 3 ns; (b) 251 J, 3 ns; (c) 438 J, 3 ns; (d) 442 J, 3 ns.
Fig. 17. Spall diameter vs. laser energy.
14 H. Jarmakani et al. / Acta Materialia xxx (2010) xxx–xxx
ARTICLE IN PRESS
Fig. 21c and d. Thus, the two modes occurred simul-taneously. The h1 1 0i crystal also exhibited a mixtureof ductile and brittle fracture, although the latter wasmore prevalent. The arrows in Fig. 22 mark the cleav-age cracks. The ductile portion of fracture differsfrom that in the polycrystalline samples. This canbe seen by comparing Fig. 11b with Figs. 21c and22b. The dimples in the monocrystal were shallower,of lesser extent and less pronounced. An interestingphenomenon was also observed at high energies.The fracture surface in Fig. 22d shows a pattern thatis unique and could be due to a molten or semi-mol-ten state of the specimen.
b. The laser amplitude required to produce spalling(spall strength) was higher in the monocrystallinethan in the polycrystalline samples. Whereas 50 J pro-duced complete spallation in the polycrystalline sam-ple (Fig. 16a), 86 J produced only partial separation(incipient spallation) in the monocrystal. This canbe seen in Fig. 21a.
c. The number of fragments impacting on the glassplate was considerably lower for monocrystals thanpolycrystals. This is evident from Fig. 23 and is con-sistent for both orientations. If one compares thesecurves, at �400 J energy, with the equivalent one in
Please cite this article in press as: Jarmakani H et al. Laser shock-indudoi:10.1016/j.actamat.2010.04.027
Fig. 19 for a polycrystal having the same 250 lmthickness one can see that the number of fragmentswas considerably lower. Correspondingly, the centralimpact area was much larger for the monocrystal and
ced spalling and fragmentation in vanadium. Acta Mater (2010),

Fig. 18. Cross-section of 250 lm, 251 J, 3 ns showing the formation of incipient spall plane due to direct laser irradiation, flaking and ductile failure onspall plane, void formation and failure along grain boundaries.
Fig. 19. Damage induced by 250 lm thick vanadium targets: (a) 251 J, 3 ns; (b) 438 J, 3 ns.
H. Jarmakani et al. / Acta Materialia xxx (2010) xxx–xxx 15
ARTICLE IN PRESS
Please cite this article in press as: Jarmakani H et al. Laser shock-induced spalling and fragmentation in vanadium. Acta Mater (2010),doi:10.1016/j.actamat.2010.04.027

Fig. 20. Glass shield placed behind 250 lm thick target, 438 J, 3 ns: (a) debris and melting of vanadium around central crater; (b) melting on the surface ofa vanadium fragment forming a subcrater away from the central crater.
16 H. Jarmakani et al. / Acta Materialia xxx (2010) xxx–xxx
ARTICLE IN PRESS
this is evidence that the spall did not fragment aseffectively in the latter. Figs. 19b and 23b show thesame striking difference.
As discussed in the introduction, these differences aredue to the fact that the polycrystal specimens fragmentalong grain boundaries, which are absent from monocrys-tals. This is also the reason why the monocrystal had ahigher spall strength. Thus, microstructural aspects play arole in fragmentation.
3.5. Shadowgraph results
Gated shadowgraphy of the in-flight fragments was car-ried out for some monocrystals. We do not claim to havecaptured all the fragments but in the high energy shotsthe shadowgraphs show a well-formed plume. Fig. 24
Please cite this article in press as: Jarmakani H et al. Laser shock-indudoi:10.1016/j.actamat.2010.04.027
shows images, while Fig. 25 shows the correspondingvelocity distributions. A comparison of Fig. 24a and b sug-gests larger fragments for the h1 0 0i crystal, in agreementwith a greater propensity for cleavage for this orientation.This indicates that cleavage leads to larger fragments, assuggested by the break-up of the sample in Fig. 21b. Theseresults are also consistent with the markings on the glasstarget shown in Fig. 23b and c, indicating that the h1 0 0icrystal produced fewer fragments. One conclusion thatcan be reached from a comparison of the shadowgraphresults with fragment impacts on the glass shields is thata sizable fraction of the fragments failed to produce visiblecraters on the glass surfaces. Approximately 200 fragmentswere counted for the h1 1 0i crystal, whereas the numberseen in Fig. 23c is considerably lower. At the lower ener-gies, as expected, the number of fragments and their veloc-ities were lower (Fig. 25a and b).
ced spalling and fragmentation in vanadium. Acta Mater (2010),

Fig. 21. Spalling of h1 0 0i monocrystals; (a) 86 J energy; (b) close-up of back surface of specimen subjected to 36 J energy showing cracks; (c) ductilefracture in sample subjected to 198 J; (d) spall surface of sample subjected to 198 J.
H. Jarmakani et al. / Acta Materialia xxx (2010) xxx–xxx 17
ARTICLE IN PRESS
3.6. Fragment size modeling
The fragmentation of materials under high rate expan-sion has been treated extensively by Grady and co-workers[50–54]. The theoretical prediction of fragment size S whensolid spall is dominated by flow stress is given by the Gra-dy–Kipp (G–K) theory for ductile materials. This theory isbased on energetic considerations, where the kinetic energyof an expanding body T and the elastic energy U are equa-ted with the ductile fracture energy W = Yec:
T þ U P W ð12ÞThis leads to:
S ¼ 8Y ec
q_e2
� �1=2
ð13Þ
where Y is the dynamic yield stress, q is the density, ec isthe critical strain to failure and _e is the imposed strainrate. The strain rate in the current experiments can beestimated from the expansion of the spalled region asshown in the schematic of Fig. 26a. We assumed that
Please cite this article in press as: Jarmakani H et al. Laser shock-indudoi:10.1016/j.actamat.2010.04.027
the spalled portion of the target was ejected in the formof an ellipse, with major axis a, equal to 1.25 mm (theinner radius of the washer sandwiching the target) andminor axis b, whose critical length before failure is tobe calculated. Based on tensile experiments carried outon vanadium by Yoshinaga et al. [55], it was determinedthat vanadium fractures at a critical strain of �20%.Thus, the total circumference length of the ejected mate-rial at fracture must be �3 mm. From the equation of
the perimeter of an ellipse, P � pffiffiffiffiffiffiffiffiffiffiffiffiffiffiffiffiffiffiffiffiffiffiffi½2ða2 þ b2Þ�
q, one can
determine the length b of the minor axis (i.e. the distancetraveled by the vanadium surface before failure). Theexpansion velocity can be approximated as the free sur-face velocity Ufs, which is equal to twice the particlevelocity at the back surface (Ufs � 2Up). Knowing thepressure at a given distance from the front surface fromFigs. 3 and 4, Up can be obtained from the Rankine–Hugoniot (R–H) equations. Thus, strain rates can be ob-tained from 2Ufs/P.
Several investigators have studied the dynamic proper-ties of vanadium under explosive loading [56], gas gun
ced spalling and fragmentation in vanadium. Acta Mater (2010),

Fig. 22. Spalling of 250 um thick h1 1 0i monocrystal samples; (a) spall surface 392 J; (b) ductile separation; (spall surface 398 J); (d) fracture surface withdeep dimples possibly due to partial melting.
18 H. Jarmakani et al. / Acta Materialia xxx (2010) xxx–xxx
ARTICLE IN PRESS
loading [57] and the split Hopkinson pressure bar tech-nique [58]. The dynamic yield stress was established to be�480 MPa by Chabildas et al. [57], in very good agreementwith work by Bat’kov et al. [56]. The yield strength of vana-dium does not seem to be very sensitive to strain rate.Hence, we took the dynamic yield strength Y of vanadiumto be 480 MPa in our analyses. With all parameters deter-mined, the fragment size SG–K is plotted as a function ofstrain rate in Fig. 26b.
We also directly determined the vanadium fragmentsizes based on the number of fragments collected on theglass shields. Table 4 shows the different experiments car-ried out and the total number of fragments counted onthe glass shields. The total number was estimated withthe aid of the imaging software ImageJ. For simplicity,the assumption was made in all cases that the total spallarea was pd2/4, where d = 2.5 mm (the inner diameter ofthe washer), and the thickness of the fragments was equalto the spall thickness. Dividing the spalled area by the totalnumber of fragments on the glass shield for all experimen-
Please cite this article in press as: Jarmakani H et al. Laser shock-indudoi:10.1016/j.actamat.2010.04.027
tal cases, we were able to obtain the area of each individualfragment. Assuming the fragments were geometricallysquare and taking the square root of this area, we obtainedthe fragment size Sexp. The experimentally determined frag-ment sizes are also plotted as a function of strain rate inFig. 26b.
It is clearly evident that the experimentally determinedfragment sizes were smaller than those obtained using theG–K model by a factor of 2–3. One can get a better fitby increasing Y, but this is an uncertainty. More recent the-ories by Glenn and Chudnovsky [59] and Molinari and co-workers [60,61] predict values that were a factor of sixlower than the original G–K model and, therefore, it canbe said that the current experimental results are in betweenthese. Considering the uncertainties in experimental mea-surements and simplifying the assumptions in the G–Kmodel, the agreement is considered satisfactory. Theorypredicted and the experiments showed a decrease in frag-ment size with strain rate. The Sexp values were actuallyin better agreement with some fragment sizes measured
ced spalling and fragmentation in vanadium. Acta Mater (2010),

Fig. 23. Damage in monocrystalline 250 lm vanadium targets: (a–c) glass shields damaged by monocrystalline vanadium fragments: energies of 198 J(h1 0 0i), 424 J(h1 0 0i), 392 J (h1 1 0i), respectively; (d) fragments per area as a function of distance from central damage.
H. Jarmakani et al. / Acta Materialia xxx (2010) xxx–xxx 19
ARTICLE IN PRESS
from SEM micrographs of the glass shield surfaces. Thesizes obtained from the G-K theory provided an overesti-mate. In particular, preliminary experiments (Maddox,unpublished results) indicate that the free surface velocitywas one-quarter of that calculated herein. The fragmentsdecelerated from the initial expansion velocity of the spallbecause deformation and fragmentation consume energy.This lower free surface velocity would shift the G–K curveto the left and bring the predicted results closer to theexperimental ones.
3.7. Spall strength determination
Values for the spall strength (rspall) of vanadium areabsent in the literature, and an attempt to measure thisvalue was made here. Two methods of estimating the spallstrength of the specimens were used.
3.7.1. Thickness of the spall layer
This method was explained by Gilath [38] and is shownin Fig. 5 and explained in Section 3.1. It is possible to deter-mine rspall based on the experiments carried out on the250 lm targets, since a spall surface clearly developed inthose experiments. We use the spall thickness measuredfrom the optical micrographs (as in Figs. 11 and 16) toaid in our calculations. From the micrographs we esti-mated a spall thickness of �30 lm for the 251 J experiment
Please cite this article in press as: Jarmakani H et al. Laser shock-indudoi:10.1016/j.actamat.2010.04.027
(and �50 lm for the 438 J experiment, figure not shown).The basic physics of waves was used to determine the ten-sile stress that developed at the spall plane. This isexplained in Section 3.1 (Eq. (4)). Using the HYADEScomputations we could determine the magnitude of thetensile stresses at these depths. The estimated spallstrengths using the pulse decay calculations were 9 GPafor the 250 J experiment and 18 GPa for the 438 J experi-ment (Fig. 4a and 4b). Using the HYADES computations(Fig. 4c and 4d), the tensile stress was approximately10 GPa. Clearly, a strain rate effect on the spall strengthexisted, as previously observed by others (e.g. works byGilath [38] and Wang et al. [62] on laser-shockedaluminum).
3.7.2. VISAR pull-back signalThis technique is known to provide reliable estimates of
the spall strength. It was calculated from pull-back signalsin the experiments carried out on the monocrystals of250 lm thickness. The procedure was delineated by Gradyand Kipp [63]. The following expression was used for thespall strength (Eq. (8.7) from Grady and Kipp [63]):
rT ¼1
2ðZs � ZwÞumax �
1
2ðZs þ ZwÞumin ð14Þ
where umax and umin are the velocities marked A and B inFig. 27 and the impedances of the window and specimen
ced spalling and fragmentation in vanadium. Acta Mater (2010),
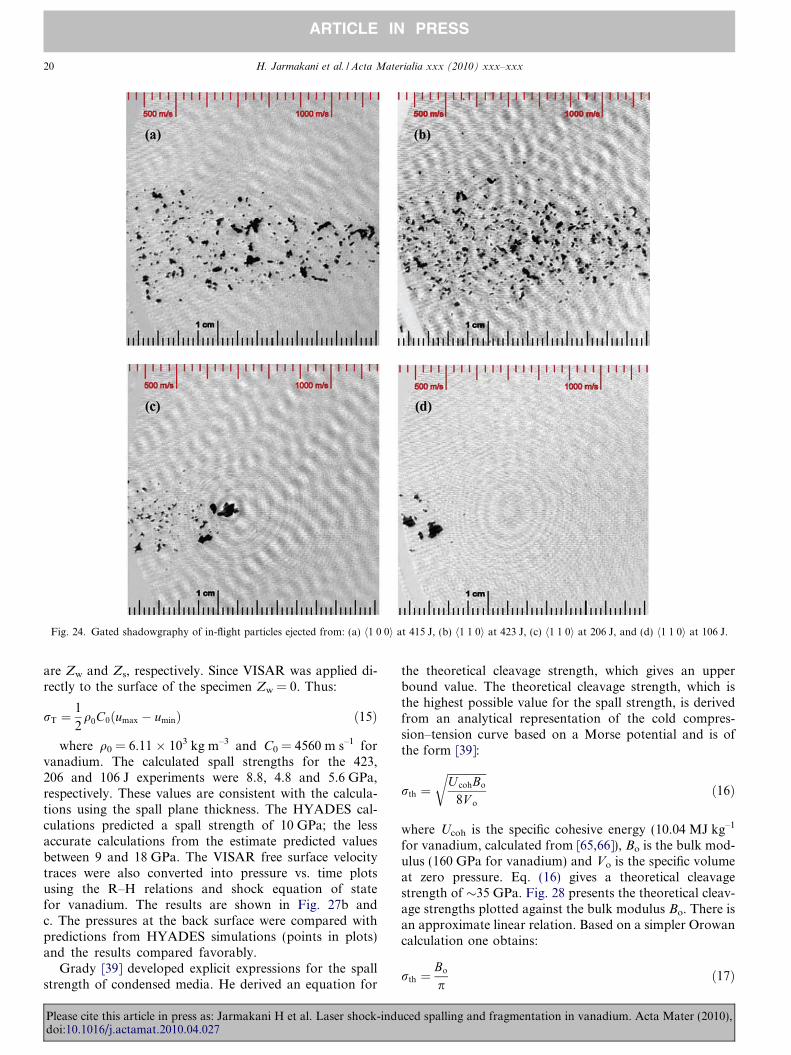
Fig. 24. Gated shadowgraphy of in-flight particles ejected from: (a) h1 0 0i at 415 J, (b) h1 1 0i at 423 J, (c) h1 1 0i at 206 J, and (d) h1 1 0i at 106 J.
20 H. Jarmakani et al. / Acta Materialia xxx (2010) xxx–xxx
ARTICLE IN PRESS
are Zw and Zs, respectively. Since VISAR was applied di-rectly to the surface of the specimen Zw = 0. Thus:
rT ¼1
2q0C0ðumax � uminÞ ð15Þ
where q0 = 6.11 � 103 kg m–3 and C0 = 4560 m s–1 forvanadium. The calculated spall strengths for the 423,206 and 106 J experiments were 8.8, 4.8 and 5.6 GPa,respectively. These values are consistent with the calcula-tions using the spall plane thickness. The HYADES cal-culations predicted a spall strength of 10 GPa; the lessaccurate calculations from the estimate predicted valuesbetween 9 and 18 GPa. The VISAR free surface velocitytraces were also converted into pressure vs. time plotsusing the R–H relations and shock equation of statefor vanadium. The results are shown in Fig. 27b andc. The pressures at the back surface were compared withpredictions from HYADES simulations (points in plots)and the results compared favorably.
Grady [39] developed explicit expressions for the spallstrength of condensed media. He derived an equation for
Please cite this article in press as: Jarmakani H et al. Laser shock-indudoi:10.1016/j.actamat.2010.04.027
the theoretical cleavage strength, which gives an upperbound value. The theoretical cleavage strength, which isthe highest possible value for the spall strength, is derivedfrom an analytical representation of the cold compres-sion–tension curve based on a Morse potential and is ofthe form [39]:
rth ¼ffiffiffiffiffiffiffiffiffiffiffiffiffiffiU cohBo
8V o
rð16Þ
where Ucoh is the specific cohesive energy (10.04 MJ kg–1
for vanadium, calculated from [65,66]), Bo is the bulk mod-ulus (160 GPa for vanadium) and Vo is the specific volumeat zero pressure. Eq. (16) gives a theoretical cleavagestrength of �35 GPa. Fig. 28 presents the theoretical cleav-age strengths plotted against the bulk modulus Bo. There isan approximate linear relation. Based on a simpler Orowancalculation one obtains:
rth ¼Bo
pð17Þ
ced spalling and fragmentation in vanadium. Acta Mater (2010),

Fig. 25. Fragment velocity distribution from gated shadowgraphs in Fig. 24: (a) h1 0 0i at 415 J, (b) h1 1 0i at 423 J, (c) h1 1 0i at 206 J, and (d) h1 1 0i at106 J.
H. Jarmakani et al. / Acta Materialia xxx (2010) xxx–xxx 21
ARTICLE IN PRESS
This provides a value of �50 GPa for V. So, both equa-tions provide theoretical maximum spall strengths that areapproximately proportional to the bulk modulus.
In line with this, spall results (primarily obtained ingas gun experiments) are presented in Fig. 28 for a num-ber of metals and compared with the G–K formulation,originally proposed by Grady [39]. Using an energy bal-ance analysis, Grady [39] also provided expressions forboth the ductile and brittle spall strengths of condensedmedia, which provided values that were more consistentwith the experimental results using gas guns. Table 5 pre-sents the theoretical spall strengths of various commonfcc and bcc metals. From the SEM analysis it is safeto conclude that vanadium spalls by ductile behavior(see Fig. 11c). In other words, the spall process involvesthe nucleation, growth and coalescence of voids) andoccurs strictly through plastic flow. Hence, we adoptthe Grady expression for ductile spall [39]:
rT ¼ ð2qc2oY ecÞ1=2 ð18Þ
where q is the density, co is the velocity of sound at zeropressure, Y is the dynamic yield strength (480 MPa) andec is the critical strain (0.2). This expression gives a spall
Please cite this article in press as: Jarmakani H et al. Laser shock-indudoi:10.1016/j.actamat.2010.04.027
strength of 5.5 GPa for vanadium. Fig. 28 shows the theo-retical ductile spall strength of vanadium and various otherfcc and bcc metals and how they compare with the experi-mental results tabulated by Meyers et al. [44] from differentsources, also given in Table 5.
Most of the theoretical ductile spall strengths of the var-ious materials reported by Grady [39] seem to be in thesame range as the experimental values (Table 3 in Grady[39]). It should be mentioned that these experiments wereconducted using gas guns. The experimental valuesobtained herein for vanadium using lasers were higher thanthe calculated Grady [39] ductile spall strengths (Eq. (18)),by a factor of up to 2. Our results are consistent with thoseof Gilath [38], who measured the spall strength of alumi-num and 6061-T6 aluminum (2.5–5 GPa) at a strain rateof 1–4 � 107 s–1 produced by laser shock under conditionssimilar to those in the present investigation. In contrast,gas gun measurements reported by Grady [39] at strainrates of 104–106 s–1 showed a spall strength of 1–2 GPa(Fig. 9 in Grady [39]).
For copper there are laser results by Moshe et al. [67]reporting a spall strength of 9.5 GPa and results bySchneider [68] reporting a value of 5 GPa. Both values
ced spalling and fragmentation in vanadium. Acta Mater (2010),

Fig. 26. Illustration of the expansion of the spalled surface used in theGrady–Kipp model; (b) fragment size vs. strain rate.
Table 4Total number of fragments counted on glass shields for variousexperiments.
Sample thickness(lm)
Laser energylevel (J)
Total no. offragments
75 167 103175 290 2603
127 218 (8 ns) 270127 228 1150127 430 1914250 251 371250 438 956
22 H. Jarmakani et al. / Acta Materialia xxx (2010) xxx–xxx
ARTICLE IN PRESS
are considerably higher than those reported for gas gunexperiments and using the G–K equation. In Fig. 28two lines are drawn, corresponding to gas gun and laserexperiments.
So, there is a clear time dependence of spall strength onstrain rate (or time), which could have two possible reasons.
a. Eq. (18) has a term Y, the yield stress, which exhibitsa strain rate dependence that can be expressed, to afirst approximation, by the power function:
_e� �m
Y ¼ Y 0_e0
ð19Þ
Pleasedoi:10
where _e is the strain rate and m is the strain rate sen-sitivity. Thus, the spall strength would have a strainrate dependence of m/2, if the other two parametersin Eq. (19) are normalizing factors. If one considersthat the strain rates imparted by a gas gun and lasercompression are of the order of 104–106 s–1 and by la-ser compression of the order of 107 s–1 one would ar-rive at a reasonable agreement.
cite this article in press as: Jarmakani H et al. Laser shock-indu.1016/j.actamat.2010.04.027
b. Spalling is a nucleation–growth–coalescence process.The treatments developed by Curran et al. [69,70]and applied by Deckel et al. [71] deal with this by incor-porating a time and stress dependence of the concen-tration of nucleation sites and void growth velocity.
4. Conclusions
The following are the principal conclusions.
1. Evidence of molten and resolidified fragments wasobserved, in agreement with a solid–liquid transitioninduced by shock compression, which was calculatedto be 150 GPa.
2. The damage and fragment distribution were significantlyaffected by laser energy. The highest intensity experimentsresulted in a high density of very small droplets distrib-uted on the glass plate, while the lowest intensity experi-ments resulted in a few damaged spots on the glass plates.
3. Thicker foils (250 lm) showed incipient spall planes andbulk deformation by shock loading, samples of intermedi-ate thickness (127 lm) showed tearing away around thelaser spot, while the thinnest foils (75 lm) showed almostcomplete blow-off due to the laser beam interaction. Atthe same energy level damage accumulation on the glassshields decreased as the target thickness increased.
4. In the monocrystalline samples there were clear differ-ences: a higher spall strength and the appearance ofcleavage cracks associated with brittle fracture. This isin accordance with enhancement of the ductile–brittletransition increasing the grain size.
5. Spalling and fragmentation were found to proceed byductile void nucleation, growth and coalescence. Thegrain boundaries were favored paths for decohesion.
6. The fragmentation was quantitatively estimated as afunction of laser pulse energy and duration and com-pared with the G–K analysis. The measured spallstrengths were higher, by a factor of 2–3, than theexpected results and calculations using G–K analysis.The discrepancy can be attributed to the strain rate sen-sitivity of the yield stress, which is considered satisfac-tory in view of the experimental uncertainties andtheoretical assumptions. Other factors, such as the spallthickness, could also play a role.
ced spalling and fragmentation in vanadium. Acta Mater (2010),

Fig. 27. (a) Free surface velocity and (b) pressure as a function of time for Va h1 1 0i single-crystal samples at 423 J, 206 J, and 106 J. The values at A, B,and C correspond to the peak velocity, pull-back velocity, and spall peaks. (c) Pressure as a function of distance for h1 1 0i and h1 0 0i single-crystalsamples at laser energies 426 J and 415 J, respectively, calculated using the free surface velocity measured from VISAR and V RH shock data. Single pointsare peak pressure values calculated using the HYADES code.
Table 5Theoretical and experimental spall strengths of various metals.
Element Bulkmodulus(GPa)
Theoreticalcleavage stress(GPa)
Ductile spall strength(GPa)
Theoretical Experimental
Al 72 17.1 0.57–0.81 0.5–1.1Cu 137 28.5 1 1–2.5V 160 35 5.5 9–18Fe 168 35 – 1.6–4.5Ta 200 42.4 6.5 4.4–6.8
H. Jarmakani et al. / Acta Materialia xxx (2010) xxx–xxx 23
ARTICLE IN PRESS
7. Shadowgraph pictures reveal the fragment distributionfor the monocrystalline experiments, which can be suc-cessfully correlated with the fragments measured onthe glass and polycarbonate targets and allow determi-nation of the velocity distributions.
8. VISAR velocimetry measurements were carried out onthe monocrystalline specimens. The pressures at theback surface were compared with HYADES predictionsand good agreement was obtained.
Please cite this article in press as: Jarmakani H et al. Laser shock-indudoi:10.1016/j.actamat.2010.04.027
9. Both the spall thickness and pull-back signals fromVISAR velocimetry were used to estimate the spallstrength. The spall thickness was used in combinationwith the calculated decay of the shock pulse. It wasfound to be in the range of 9–18 GPa. The spallstrengths obtained from VISAR pull-back signals werelower, in the range 5–9 GPa. These results are higherthan the experimental results obtained using gas gunsand consistent with laser compression results. The differ-ences can be attributed to two causes.a. The strain rate sensitivity of the flow stress, incorpo-
rated in the Grady [39] prediction.b. Spalling being the result of the nucleation, growth
and coalescence of voids/cracks, which are time-dependent phenomena. (A complete analytical pre-diction has to involve this phenomenology, first pro-posed by Curran et al. [69,70] and further developedby Deckel et al. [71], and also discussed by Grady[64].)
ced spalling and fragmentation in vanadium. Acta Mater (2010),

Fig. 28. Spall strength vs. bulk modulus for various fcc and bcc metals;comparison of theoretical cleavage strength (Grady [39], upper curve) andexperiments. Note separate curves for gas gun and laser experimentssuggesting a strong strain-rate or time dependence.
24 H. Jarmakani et al. / Acta Materialia xxx (2010) xxx–xxx
ARTICLE IN PRESS
Acknowledgements
This work was performed under the auspices of UCOPby the University of California, Lawrence Livermore Na-tional Laboratory, through the Institute for Laser Scienceand Applications, under ILSA Contract No. W-7405-Eng-48. The help provided by Dr. D. Correll is gratefullyacknowledged. The authors thank Dr. Mark Tilak for hisgenerosity in sharing with us the HYADES code and Eve-lyn York at the Scripps Institute of Oceanography for herhelp with SEM imaging. The hospitality of Drs. W. Proudand S. Walley, Cavendish Laboratory, Cambridge duringthe last stages of manuscript preparation is gratefullyacknowledged.
References
[1] Kurtz RJ, Hamilton ML, Li H. J Nucl Mater 1998;258–263:1375.[2] Zinkle SJ, Matsui H, Smith DL, Rawcliffe AF, ven Osch E, Abe K,
et al. J Nucl Mater 1998;258–263:205.[3] Kurtz RJ, Abe K, Chernov VM, Kazatov VA, Lucas GE, Matsui H,
et al. J Nucl Mater 2000;283–287:70.[4] Meyers MA, Aimone CT. Prog Mater Sci 1983;28:1.[5] Davidson L, Graham RA. Phys Rep 1979;55:255.[6] Curran DR, Seaman L. Phys Rep 1987;147:253.[7] McQueen RG, Marsh SP. J Appl Phys 1962;33:654.[8] Vidal F, Johnston TW, Laville S, Barthelemy O, Chaker M, Le
Drogoff B, et al. Phys Rev Lett 2001;86:2573.[9] Kanel GI, Fortov VE. Adv Mech 1987;10:3.
[10] Rosenberg L, Luttwak G, Yeshurun Y, Partom Y. J Appl Phys1983;54:2147.
[11] Chen D, He H, Jing F. J Appl Phys 2007;102:1.[12] Andriot P, Chapron P, Lambert V, Olive F. Shock waves in
condensed matter. Amsterdam: Elsevier; 1983. p. 277.
Please cite this article in press as: Jarmakani H et al. Laser shock-indudoi:10.1016/j.actamat.2010.04.027
[13] Rybakov AP, Rybakov IA. Eur J Mech B Fluids 1995;14:197.[14] Zhiembetov AK, Mikhaylov AL, Smirnov GS. AIP Conf Proc
2002;620:547.[15] Holtkamp DB, Clark DA, Garcia IA. AIP Conf Proc 2004;705:
473.[16] Holtkamp DB, Clark DA, Garcia A. AIP Conf Proc 2004;705:477.[17] Fox JA, Barr DN. Appl Phys Lett 1973;22:594.[18] Cottet F, Boustie M. J Appl Phys 1989;66:4067.[19] Eliezer S, Gilath I, Bar-Noy T. J Appl Phys 1990;67:715.[20] Eliezer S, Gazit Y, Gilath I. J Appl Phys 1990;68:56.[21] Boustie M, Cottet F. J Appl Phys 1991;69:7533.[22] (a) Lacomme M, Cazalis B, David J, Nierat G, Saleres A, Sibille G. J
Phys (France) IV Colloq 1994;8(Supp):77;(b) Lacomme M, Cazalis B, David J, Nierat G, Saleres A, Sibille G. JPhys (France) III 1994;4:77.
[23] de Resseguier T, Cottet F. J Appl Phys 1995;77:3756.[24] Remington BA, Bazan G, Belak J, Bringa E, Caturla M, Colvin JD,
et al. Met Mater Trans 2004;35A:2587.[25] Meyers MA, Gregori F, Kad BK, Schneider MS, Kalantar DH,
Remington BA, et al. Acta Mater 2003;51:1211.[26] Schneider MS, Kad B, Kalantar DH, Remington BA, Kenik E,
Lubarda V, et al. Int J Impact Eng 2005;32:473.[27] Hawreliak J, Colvin JD, Eggert JH, Kalantar DH, Lorenzana HE,
Stolken JS, et al. Phys Rev B 2006;74:184107.[28] Wang Y, He H, Boustie M, Sekine T. J Appl Phys 2007;101:103528.[29] Meyers MA, Schneider MS, Jarmakani H, Kad B, Remington BA,
Kalantar DH, et al. Met Trans 2007;39A:304.[30] Cao BY, Meyers MA, Lassila DH, Schneider MS, Kad BK, Huang
CX, et al. MSE A 2005;409:270.[31] de Resseguier T, Signor L, Dragon A, Boustie M, Roy G, Llorca F. J
Appl Phys 2007;101:013506.[32] Lubarda VA, Meyers MA, Schneider M, Remington B, Kalantar D.
Acta Mater 2004;52:1397.[33] Christy S, Pak HR, Meyers MA. In: Murr LE, Staudhammer KP,
Meyers MA, editors. Metallurgical applications of shock-wave andhigh-strain rate phenomena. New York: Marcel Dekker; 1991. p. 775.
[34] Kanel GI, Rasorenov SV, Fortov VE. In: Shock-wave and high-strainrate phenomena in materials. New York: Marcel Dekker; 1991. p.775.
[35] Meyers MA. In: Meyers MA, Armstrong RW, Kirchner HOK,editors. Mechanics and materials: fundamentals and linkages. NewYork: Wiley; 1999. p. 489–594.
[36] Koller DD, Hixson RS, Gray GT, Rigg PA, Addesio LB, Cerreta EK,et al. J Appl Phys 2005;98:103518.
[37] Gray GT, Bourne NK, Henrie BL. J Appl Phys 2007;101:093507.[38] Gilath I. In: Davison L, Grady DE, Shahinpoor M, editors. High-
pressure shock compression of solids. New York: Springer; 1996. p.90–120.
[39] Grady DE. J Mech Phys Solid 1988;36:353.[40] Barker LM, Hollenbach RE. J Appl Phys 1972;43:4669.[41] Celliers PM, Collins GW, Da Silva LB, Gold DM, Cauble R. Appl
Phys Lett 1998;73:1320.[42] Barker LM, Schuler KW. J Appl Phys 1974;45:3692.[43] Samsonov GV, editor. Handbook of the physicochemical properties
of the elements. New York: IFI Plenum; 1968. p. 383.[44] Meyers MA. Dynamic behavior of materials. New York: John Wiley;
1994.[45] Sorkin V, Polturak E, Adler J. Phys Rev B 2003;68:174102.[46] Jephcoat AP, Besedin S. In: Manghnani M, Yagi T, editors. US–
Japan conference on mineral physics. Washington (DC): AGU; 1997.[47] Errandonea D, Schwager B, Ditz R, Gessmann C, Boehler R, Ross
M. Phys Rev B 2001;63:132104.[48] McQueen RG, Marsh SP, Taylor JW, Fritz JN, Carter WJ. In:
Kinslow R, editor. High velocity impact phenomena. New York: Aca-demic Press; 1970.
[49] Dai C, Jin X, Zhou X, Liu J, Hu J. J Phys D Appl Phys 2001;34:3064.[50] Grady DE, Kipp ME. Int J Rock Mech Min Sci Geomech
1979;17:147.
ced spalling and fragmentation in vanadium. Acta Mater (2010),

H. Jarmakani et al. / Acta Materialia xxx (2010) xxx–xxx 25
ARTICLE IN PRESS
[51] Grady DE, Kipp ME. Int J Rock Mech Min Sci Geomech1979;16:293.
[52] Grady DE, Kipp ME. Mech Mater 1985;4:311.[53] Kipp ME, Grady DE, Swegle JW. Int J Impact Eng 1993;14:427.[54] Grady DE, Kipp ME. Int J Impact Eng 1997;20:293.[55] Yoshinaga H, Toma K, Abe K, Morozumi S. Philos Mag
1971;23:1387.[56] Bat’kov YV, Glushak AB, Glushak BL, Novikov SA, Fishman ND.
Combust Explos Shock Waves 1995;31:605.[57] Chabildas LC, Hill CR. In: Murr LE, Staudhammer KP, Meyers
MA, editors. Metallurgical applications of shock wave and highstrain-rate phenomena. New York: Marcel Dekker; 1986. p. 429–48.
[58] Lennon AM, Ramesh KT. Int J Plast 1998;14:1279.[59] Glenn LA, Chudnovsky A. J Appl Phys 1986;59:1379–80.[60] Mariot C, Michaut V, Molinari JF. In DYMAT 2009, proceedings of
the 9th international conference on the mechanical and physicalbehavior of materials under dynamic loading, 2009. p. 1523.
[61] Zhou F, Molinari JF, Ramesh KT. Comput Mater Sci 2006;37:74–85.
Please cite this article in press as: Jarmakani H et al. Laser shock-indudoi:10.1016/j.actamat.2010.04.027
[62] Wang Y, He H, Wang L, Jing BoustieFM, Sekine T. J Appl Phys2006;100:033511.
[63] Grady DE, Kipp ML. In: Asay JR, Shahinpoor M, editors. High-pressure shock compression of solids. New York: Springer; 1993. p.265–322.
[64] Grady DE. In: Gronig H, Horie Y, Takayama K, editors. Shock wavescience and technology reference library, vol. 3. New York: Springer;2009. p. 169–276.
[65] Kittel C. Introduction to solid-state physics. 5th ed. NewYork: Wiley; 1983.
[66] Rose JH, Smith JR, Guinea F, Ferrante J. Phys Rev B 1984;29:2963.[67] Moshe E, Eliezer S, Deckel E, Ludminsky A, Henis Z, Goldberg IB,
et al. J Appl Phys 1998;83:4004.[68] Schneider MS. Doctoral dissertation, University of California San
Diego.[69] Curran DR, Seaman L, Shockey DA. Phys Today 1977;30:46.[70] Curran DR, Seaman L, Shockey DA. Phys Lett 1987;147:253.[71] Dekel E, Eliezer S, Henis Z, Moshe E, Ludminsky A, Goldberg IB. J
Appl Phys 1998;84:4851.
ced spalling and fragmentation in vanadium. Acta Mater (2010),