
LASER LINE SCAN SYSTEM FOR UXO CHARACTERIZATION · final report: laser line scan system for uxo...
134
FINAL REPORT: LASER LINE SCAN SYSTEM FOR UXO CHARACTERIZATION ESTCP PROJECT NO. MM-0911 JANUARY 2012 SUBMITTED BY: MIKE PUTNAM – LEAD INVESTIGATOR SPAWAR SYSTEMS CENTER PACIFIC; CODE 71750 53475 STROTHE ROAD SAN DIEGO, CA 92152 WITH: SCIENCE APPLICATIONS INTERNATIONAL CORPORATION 221 THIRD STREET NEWPORT, RI 02840
Transcript of LASER LINE SCAN SYSTEM FOR UXO CHARACTERIZATION · final report: laser line scan system for uxo...

FINAL REPORT: LASER LINE SCAN SYSTEM FOR UXO
CHARACTERIZATION
ESTCP PROJECT NO. MM-0911
JANUARY 2012
SUBMITTED BY:
MIKE PUTNAM – LEAD INVESTIGATOR
SPAWAR SYSTEMS CENTER PACIFIC; CODE 71750 53475 STROTHE ROAD SAN DIEGO, CA 92152
WITH:
SCIENCE APPLICATIONS INTERNATIONAL CORPORATION
221 THIRD STREET NEWPORT, RI 02840


Final Report LLSS for UXO Characterization
i
TABLE OF CONTENTS Page
LIST OF FIGURES ....................................................................................................................... iv LIST OF TABLES ........................................................................................................................ vii LIST OF APPENDICES .............................................................................................................. viii LIST OF ACRONYMS AND ABBREVIATIONS ...................................................................... ix ACKNOWLEDGEMENTS ........................................................................................................... xi EXECUTIVE SUMMARY .......................................................................................................... xii 1.0. INTRODUCTION ..................................................................................................................1
1.1. BACKGROUND .................................................................................................................1 1.2. OBJECTIVE OF THE DEMONSTRATION ..............................................................................2 1.3. REGULATORY DRIVERS ...................................................................................................2
2.0. TECHNOLOGY .....................................................................................................................4 2.1. TECHNOLOGY DESCRIPTION ...........................................................................................4 2.2. TECHNOLOGY DEVELOPMENT .......................................................................................10 2.3. ADVANTAGES AND LIMITATIONS OF THE TECHNOLOGY ...............................................11
3.0. PERFORMANCE OBJECTIVES ........................................................................................13 3.1. OBJECTIVE: DEPTH STATION KEEPING .........................................................................14 3.2. OBJECTIVE: LINE STATION KEEPING ............................................................................14 3.3. OBJECTIVE: DATA PREPROCESSING..............................................................................14 3.4. OBJECTIVE: TARGET ANALYSIS ...................................................................................15 3.5. OBJECTIVE: SURVEY PRODUCTION RATES ...................................................................15 3.6. OBJECTIVE: PROBABILITY OF SURROGATE TARGET DETECTION ..................................16 3.7. OBJECTIVE: PROBABILITY OF FALSE ALARM ...............................................................16 3.8. OBJECTIVE: TARGET LOCATION ACCURACIES .............................................................17 3.9. OBJECTIVE: UXO PARAMETER ESTIMATES..................................................................17 3.10. OBJECTIVE: SURVEY COVERAGE ..................................................................................18 3.11. OBJECTIVE: EASE OF USE .............................................................................................18 3.12. OBJECTIVE: SYSTEM RELIABILITY ...............................................................................18 3.13. OBJECTIVE: MAINTENANCE .........................................................................................19
4.0. SITE DESCRIPTION ...........................................................................................................20 4.1. SITE SELECTION ............................................................................................................20 4.2. SITE DESCRIPTION AND HISTORY ..................................................................................23 4.3. SITE GEOLOGY ..............................................................................................................23 4.4. MUNITIONS CONTAMINATION .......................................................................................24
5.0. TEST DESIGN .....................................................................................................................25 5.1. CONCEPTUAL EXPERIMENTAL DESIGN .........................................................................25

Final Report LLSS for UXO Characterization
ii
TABLE OF CONTENTS (Continued)
Page 5.2. SITE PREPARATION .......................................................................................................26 5.3. SYSTEM SPECIFICATIONS ..............................................................................................28 5.4. CALIBRATION ACTIVITIES .............................................................................................28 5.5. DATA COLLECTION .......................................................................................................31 5.6. VALIDATION .................................................................................................................33
6.0. DATA ANALYSIS AND PRODUCTS ...............................................................................37 6.1. PREPROCESSING ............................................................................................................37 6.2. TARGET SELECTION FOR DETECTION ............................................................................38 6.3. PARAMETER ESTIMATES ...............................................................................................55
6.3.1. Target Morphometry ........................................................................................56 6.3.2. Target Positioning ............................................................................................60 6.3.3. Water Clarity Requirements ............................................................................68
6.4. TARGET CLASSIFICATION AND TRAINING .....................................................................74 6.5. DATA PRODUCTS ..........................................................................................................80
7.0. PERFORMANCE ASSESSMENT ......................................................................................82 7.1. OBJECTIVE: DEPTH STATION KEEPING .........................................................................82 7.2. OBJECTIVE: LINE STATION KEEPING ............................................................................83 7.3. OBJECTIVE: DATA PREPROCESSING..............................................................................83 7.4. OBJECTIVE: TARGET ANALYSIS ...................................................................................83 7.5. OBJECTIVE: SURVEY PRODUCTION RATES ...................................................................84 7.6. OBJECTIVE: PROBABILITY OF SURROGATE TARGET DETECTION ..................................86 7.7. OBJECTIVE: PROBABILITY OF FALSE ALARM ...............................................................86 7.8. OBJECTIVE: TARGET LOCATION ACCURACIES .............................................................87 7.9. OBJECTIVE: UXO PARAMETER ESTIMATES..................................................................87 7.10. OBJECTIVE: SURVEY COVERAGE ..................................................................................88 7.11. OBJECTIVE: EASE OF USE .............................................................................................89 7.12. OBJECTIVE: SYSTEM RELIABILITY ...............................................................................89 7.13. OBJECTIVE: MAINTENANCE .........................................................................................90
8.0. COST ASSESSMENT ..........................................................................................................91 8.1. COST MODEL ................................................................................................................91 8.2. COST DRIVERS ..............................................................................................................98 8.3. COST BENEFIT...............................................................................................................98
9.0. IMPLEMENTATION ISSUES ..........................................................................................101 9.1. ENVIRONMENTAL CHECKLIST .....................................................................................101

Final Report LLSS for UXO Characterization
iii
TABLE OF CONTENTS (Continued)
Page 9.2. OTHER REGULATORY ISSUES ......................................................................................101 9.3. END USER ISSUES .......................................................................................................102
10.0. REFERENCES ...................................................................................................................104 APPENDICES .............................................................................................................................105

Final Report LLSS for UXO Characterization
iv
LIST OF FIGURES Figure 2.1-1. Schematic diagram of the light path of the 532 nm (blue-green) laser during the
operation of the SAIC SM-2000 LLSS. Figure 2.1-2. Schematic diagram displaying how the pixel size of the digital seafloor is a
function of sampling rate, tow speed, and altitude. Figure 2.1-3. Photo of the FOCUS 1500 system prior to deployment for an offshore survey with
major components identified, as well as dimensions and depth rating for the tow body.
Figure 2.2-1. Unprocessed LLSS images of a simulated 60 mm mortar (left), a simulated
142 mm projectile (middle) and kelp frond (right) collected during the Year 1 demonstration off the coast of San Diego in water depths of approximately 70 ft and at an altitude of approximately 9 ft (3 m) above the seafloor.
Figure 4.1-1. Map showing the location of seven potential survey areas relative to Naval Air
Station North Island and the specific LLSS operation areas for the Year 1 and Year 2 surveys.
Figure 4.3-1. NAVOCEANO doctrinal bottom type classifications for the LLSS demonstration
site. Figure 5.2-1. Inert UXO simulators of a 155 mm projectile (left), 70 mm rocket (middle) and
60 mm mortar (right) used as targets to mimic real munitions items for LLSS calibration and validation elements.
Figure 5.2-2. Photograph of the ISO 12233 electronic image optical resolution chart mounted to
an aluminum board to be used as part of the calibration survey element. Figure 5.2-3. Target string recovery process used during the LLSS demonstration surveys. Figure 5.5-1. A screen shot from the GeoDAS SM-2000 interface showing the metadata inputs
used to integrate data from various sensors into the GeoDAS software. Figure 5.5-2. A screen shot from the GeoDAS SM-2000 interface showing vessel configuration
and GPS antenna offsets for the April 2010 survey. Figure 6.2-1. A screen shot from the GeoDAS SM-2000 interface showing the characterization
of target 14 from Pass 1 in the Target View dialog. Figure 6.2-2. Screen shots from the GeoDAS waterfall for targets along the calibration string
imaged during Pass 1 of the Year 1 survey.

Final Report LLSS for UXO Characterization
v
LIST OF FIGURES
Continued Figure 6.2-3. Screen shots from the GeoDAS waterfall for targets along the calibration string
imaged during Pass 2 of the Year 1 survey. Figure 6.2-4. Screen shots from CleanSweep2 for targets along Calibration Line 1 imaged
during Pass BL01D of the Year 2 survey. Figure 6.2-5. Screen shots from CleanSweep2 for targets along Calibration Line 2 imaged
during Pass BL02B of the Year 2 survey. Figure 6.2-6. Screen shots from CleanSweep2 for targets along Validation Line 1 imaged
during Pass BL03B of the Year 2 survey. Figure 6.2-7. Screen shots from CleanSweep2 for targets along Validation Line 2 imaged
during Pass BL05C of the Year 2 survey. Figure 6.2-8. Comparison of the raw GeoDAS images (left) and the post-processed
CleanSweep2 images (right) for UXO simulator S02 and the optical resolution chart from the Year 1 data.
Figure 6.2-9. Comparison of the raw GeoDAS images and the post-processed CleanSweep2 and
SAIC software images for all targets identified in Pass BL05C from Year 2. Figure 6.2-10. Comparison of LLSS target image and seafloor mosaic results for two passes over
Validation Line 3 conducted at different sensor altitudes. Figure 6.3-1. Influence of target orientation on GeoDAS target measurements for (a) Pass 1 and
(b) Pass 2 over the Year 1 calibration string. Figure 6.3-2. Relationship between altitude measurements from the FOCUS altimeter and the
side-scan sonar during the Year 1 survey. Figure 6.3-3. GeoDAS measurements of known targets calculated for Pass BL05C during the
Year 2 validation effort. Figure 6.3-4. Uncorrected target positions from two passes over the Year 1 calibration line as
determined from the GeoDAS software. Figure 6.3-5. Corrected target positions from two passes over the Year 1 calibration line with
observed offset removed; also provided are the “true” diver-determined positions for three targets obtained with a mobile transponder beacon.

Final Report LLSS for UXO Characterization
vi
LIST OF FIGURES Continued
Figure 6.3-6. Uncorrected target positions from four passes over Year 2 Validation Line 3 as
determined from the CleanSweep2 software. Figure 6.3-7. Corrected target positions from four passes over Year 2 Validation Line 3 as
determined from the CleanSweep2 software with proper GPS antenna offsets applied.
Figure 6.3-8. Circular error probability plot showing corrected LLSS target positions from three
passes over Year 2 Validation Line 3 relative to corrected LLSS target positions from Pass BL05A; circular error statistics are also shown.
Figure 6.3-9. Corrected LLSS positions for one target on Year 2 Validation Line 3 as
determined over multiple passes with both CleanSweep2 and GeoDAS software relative to the true position as determine with an IXSEA beacon.
Figure 6.3-10. Locations of transmissometer stations during the Year 2 survey relative to
placement of target strings for LLSS operations; shown with beam coefficient for the horizon one meter above the seafloor and corresponding bottom type.
Figure 6.3-11. Example of transmissometer data collected during the Year 2 survey from Day 1,
Station 2. Figure 6.3-12. Examples of LLSS images collected in bottom water with beam attenuation
coefficients of 1.115 m-1 (high quality, left) and 1.170 m-1 (medium quality, right).
Figure 6.4-1. Target classification results for Year 2 Validation Line 3 showing both Tier I and
Tier II success. Figure 6.4-2. Locations at which targets were observed during multiple LLSS passes over
Year 2 Validation Line 3 showing a distinct breakpoint between successful and non-successful data acquisition and the corresponding bottom type.

Final Report LLSS for UXO Characterization
vii
LIST OF TABLES Table 2.1-1. Documented water clarity and image resolution relationships for the LLSS prior
to this demonstration.. Table 2.1-2. LLSS developmental history. Table 4.1-1. Summary of performance objectives for the LLSS demonstration. Table 6.2-1. Summary of LLSS images acquired during the Year 1 survey. Table 6.2-2. Summary of LLSS images acquired during the Year 2 survey. Table 6.3-1. Actual and calculated dimensions for targets during the Year 1 survey. Table 6.3-2. Actual and calculated dimensions for targets during the Year 2 survey. Table 6.3-3. Transmissometer data collected during the Year 2 survey for locations at which
target strings were deployed and LLSS operations were attempted; only values for surface, seafloor and one meter above seafloor shown.
Table 7.5-1. Average altitude, swath width and resulting production rate for each LLSS pass
conducted during the Year 2 demonstration as determined for times at which targets were observed.
Table 8.1-1. Cost breakdown structure for the Year 2 LLSS demonstration conducted off the
coast of San Diego. Table 8.1-2. Survey time and area covered for each LLSS pass conducted during the Year 2
demonstration. Table 8.1-3. Cost benefit analysis for the LLSS compared to alternative marine UXO survey
approaches.

Final Report LLSS for UXO Characterization
viii
LIST OF APPENDICES Appendix A. Points of Contact. Appendix B. Field Plan: Simulated UXO and “Dummy” Object Identification Manual. Laser
Line Scan System for UXO Characterization. Presentation. 23 September 2010. Appendix C. Sample Field Logs Developed for LLSS Survey Operations. Appendix D. Completed Field Logs for LLSS Survey Operations. Appendix E. Year 1 Cruise Report: Laser Line Scan System for UXO Characterization.
ESTCP Project No. MM-0911. Draft Version 1.0. May 2010. Appendix F. Year 2 Cruise Report: Laser Line Scan System for UXO Characterization.
ESTCP Project No. MM-0911. Draft Version 1.0. October 2010. Appendix G. Complete Set of LLSS Images Produced During the Year 1 and Year 2 Surveys
(Final Data Product). Appendix H. Complete Transmissometer Dataset Collected During the Year 2 Survey.

Final Report LLSS for UXO Characterization
ix
LIST OF ACRONYMS AND ABBREVIATIONS AFOTEC Air Force Operational Test and Evaluation Center BRAC Base Realignment and Closure CEP Circular Error Probability CERCLA Comprehensive Environmental Response, Compensation, and Liability Act COTS Commercial off the Shelf CSC Corrected Signal Counts DAC Data Acquisition Center DGPS Differential Global Positioning System DoD Department of Defense DQO Data Quality Objectives DRMS Distance Root Mean Squared DVL Doppler Velocity Log EOD Explosive Ordnance Disposal ESS Explosives Safety Submission ESTCP Environmental Security Technology Certification Program FNR False Negative Rate FPR False Positive Rate FUDS Formerly Used Defense Site GAPS Global Acoustic Positioning System GIS Geographic Information System GPS Global Positioning System GSV Geophysical Systems Verification HASP Health and Safety Plan HDTV High-Definition Television INS Inertial Navigation System LLSS Laser Line Scan System MEC Munitions and Explosives of Concern Ms/s Millions of Samples Per Second MTA Marine Towed Array MUDS Mobile Underwater Debris Survey NASCO National Steel and Shipyard Company NAVFAC Naval Facilities Engineering Command NAVOCEANO Naval Oceanographic Office Nd:YAG Neodymium-doped Yttrium Aluminum Garnet NPV Negative Predictive Value OIC Ocean Imaging Consultants PHINS PHotonic Inertial Navigation System PM Project Manager PMT Photo-Multiplier Tube PPV Positive Predictive Value ROTV Remotely Operated Towed Vehicle RPM Revolutions per Minute RTK Real-Time Kinematic

Final Report LLSS for UXO Characterization
x
LIST OF ACRONYMS AND ABBREVIATIONS (Continued)
SAIC Science Applications International Corporation SCIRC San Clemente Island Range Complex SERDP Strategic Environmental Research and Development Program SHOBA Shore Bombardment Area SPAWAR Space and Naval Warfare Systems Command TAT Turn Around Time Tr Transmittance Ratio USACE United States Army Corps of Engineers USBL Ultra-Short Baseline USCG United States Coast Guard UUV Unmanned Underwater Vehicle UXO Unexploded Ordnance VDC Volts Direct Current VRS Virtual Reference Station WAA Wide Area Assessment WAAS Wide Area Augmentation System

Final Report LLSS for UXO Characterization
xi
ACKNOWLEDGEMENTS This demonstration (ESTCP Project No. MM-0911) was conducted by the SPAWAR Systems Center, Pacific with funding provided by ESTCP. The SPAWAR Project Manager was Mr. Mike Putnam. All field work and reporting for this project was conducted by the SAIC Engineering, Environment and Restoration Division under Contract Number N66001-07-D-0091-0007. The SAIC Project Manager was Dr. Gregory Tracey. Dr. Tracey and his staff were supported by SAIC Vice President Mr. George Seeley and the SAIC Marine Operations Division. The LLSS, FOCUS ROTV and all ancillary survey equipment were provided by SAIC. Both surveys for this demonstration were conducted aboard the Navy's R/V Acoustic Explorer operated by Rosser Marine & Charter Co., Inc. under the supervision of Captain Bob Rosser. Subsea navigation equipment was provided by IXSEA, Inc. and LLSS software was provided by OIC, Inc. The Demonstration Plan for this project was developed in coordination with and approved by both the ESTCP's Munitions Management Program Office (Dr. Herb Nelson) and the Navy's Fleet Area Control and Surveillance Facility, San Diego (Mr. John Downey). All of the operations described in this Final Report were implemented in cooperation with both of these entities.

Final Report LLSS for UXO Characterization
xii
EXECUTIVE SUMMARY Introduction. Assessments conducted at many former and active Department of Defense (DoD) ranges and installations have discovered Unexploded Ordnance (UXO) in the underwater environment, posing a potential current or future hazard. Relatively little is known about these underwater sites, which cover a broad spectrum of environments including shallow near-coastal and deep offshore marine sites, as well as estuaries and freshwater sites. This project demonstrates that a remote sensor survey utilizing laser imaging technology can provide an effective means of locating potential UXO in an underwater setting where these items lie exposed on the seafloor. The laser imagery also allows for the determination of size and condition (intact or clutter), which would greatly facilitate the ground-truthing effort or any potential intervention (removal or in-place detonation). Technical Objective. The objective of this project was to demonstrate the utility of the SM-2000 Laser Line Scan System (LLSS) for improved wide-area detection, identification and assessment of UXO and ordnance related materials in the marine environment. Under ideal conditions (calm, clear waters; flat topography), the optical images produced by LLSS can georeference and resolve centimeter-sized objects at two to five times the range of conventional video and photographic systems and therefore offer enhanced potential for positive identification and discrimination of UXO items. As a result, the performance of the LLSS was evaluated within a matrix of mission requirements and environmental conditions typical of a range of UXO disposal sites. Three main parameters were selected on which to base the performance evaluation: (1) image quality, (2) target morphometry, and (3) target positioning. Image quality refers to the relative success of the LLSS and various software applications to produce images that allow for the shape, condition and specific identity of various targets to be clearly identified. Target morphometry refers to the ability of the LLSS to accurately determine the dimensions (i.e., length, width) of targets identified in the digital images compared to the known dimensions of these same targets. Finally, target positioning refers to the ability of the LLSS to accurately determine the specific horizontal position (i.e., latitude, longitude and/or northing, easting) of targets identified in the digital images compared to the known positions as determined from GPS beacons (accuracy), as well as to show good repeatability in these positions during target reacquisition over multiple passes (precision). Water clarity requirements, in terms of beam attenuation coefficient, for optimal system performance were also evaluated during the demonstration. Technology Description. The LLSS is composed of an underwater optical sensor consisting of a solid-state, 200 mW, neodymium-doped yttrium aluminum garnet (Nd:YAG), 532 nm (blue-green) laser with synchronized rotating mirrors and an optical receiver. The sensor is contained within a single, relatively compact pressure housing that can be transported to a worksite and rapidly mobilized on a remotely operated towed vehicle (ROTV) for surveying in water depths ranging from 3 to 1500 m. The light energy reflected by bottom features is projected on a photo-multiplier tube (PMT) and converted into an analog signal. Each individual scan line is passed to the topside electronics where it is digitized and written to file on a sample by sample basis. Each seafloor scan line covers a swath 1.4 times the altitude (height above bottom or target) of the LLSS.

Final Report LLSS for UXO Characterization
xiii
The LLSS has been engineered to operate independently or within a suite of remote sensors to characterize the seafloor. Currently the LLSS is part of an integrated seafloor mapping system residing on SAIC’s FOCUS 1500 ROTV. The FOCUS ROTV provides a stable platform that can be maneuvered along discrete survey track lines, and provides a coordinated uplink of sensor and instrumentation data over a fiber optic tow cable manipulated by a LEBUS hydraulic drum winch. The FOCUS is towed behind a vessel of opportunity to provide the vehicle’s forward movement at speeds up to 5 knots. It uses four movable control surfaces, two vertical and two horizontal, allowing the operator to control the vehicle position and altitude to within a meter of the desired track. Besides the LLSS, the FOCUS also supports concurrent use of an EdgeTech side scan sonar, sub bottom profilers, magnetometers, RESON multibeam bathymetric transducers and other sensors. High resolution, precision positioning of each seafloor LLSS scan and resulting images is based on data provided by the combined use of the IXSEA Global Acoustic Positioning System (GAPS) and the IXSEA PHotonic Inertial Navigation System (PHINS) 6000. The GAPS combines ultra-short baseline (USBL), inertial navigation system (INS) and global positioning system (GPS) technologies in one integrated package designed to determine real-time geodetic positioning of an aquatic sensor (i.e., the FOCUS ROTV) as it moves through the water. As an added component to GAPS, the PHINS unit is mounted directly to the FOCUS vehicle to allow for the three-dimensional motion and independent positioning of the sensor package through the use of an acoustic Doppler Velocity Log (DVL) combined with a second internal gyroscope. The gyroscope provides precise heading, attitude and heave measurements, while the DVL tracks the motion of the ROTV relative to the seafloor at an update rate of 20 Hz. Geodetic positions for the ROTV are calculated in the PHINS software module based on the acoustic positioning data provided by the GAPS system, as well as the motion and bottom tracking data obtained by the PHINS unit mounted on the ROTV. Each digitized scan line of LLSS data is recorded to an electronic file on a line-by-line basis and tagged with navigation data, ROTV orientation data and all LLSS control and status messages. Ocean Imaging Corporation (OIC) GeoDAS seafloor imaging/data management software is the primary platform used to support acquisition, real-time processing and geocoding of digital LLSS data and to simultaneously interface navigation, attitude, altitude and environmental sensors providing real-time feedback regarding system operation. GeoDAS also allows control of LLSS scan rate, range, aperture and image balance settings; collects simultaneous navigation streams from GAPS, vessel GPS and beacons; corrects image display for FOCUS pitch, roll and yaw; provides a real time target mark and measure tool; and constructs an image library of flagged targets. Following data acquisition and initial processing with GeoDAS, OIC CleanSweep2 software is also used to provide complete post-survey data processing and QC to facilitate the enhancement of LLSS imagery. This package allows for the smoothing, de-spiking and manual editing of select survey metadata to eliminate spurious features and provides powerful LLSS processing capabilities that include along- and across-track gain equalization. SAIC has also developed an LLSS software processing tool that allows for extraction, manipulation and visualization of raw LLSS data and metadata. The SAIC tool provides additional functionality that is not available within the current versions of GeoDAS and CleanSweep2.

Final Report LLSS for UXO Characterization
xiv
Demonstration Surveys. Two demonstration surveys (Year 1 – July 2010 and Year 2 – September 2010) were conducted in the Pacific Ocean off San Diego, CA to objectively document both the advantages and limitations of the LLSS in a series of controlled field experiments under varying environmental conditions. A testing regimen involving the deployment and recovery of inert UXO simulators, similar “dummy” objects, and an ISO 12233 optical image resolution chart in both calibration and validation configurations was utilized to gather sufficient data regarding system capabilities. The calibration element involved multiple LLSS passes over a 1500-ft string of targets (9 inert UXO, 11 dummy, 1 optical resolution chart) attached in a known order at ~75 ft spacing to determine optimum system specifications for recognizing these objects in various water clarity and bottom type conditions. In contrast, the validation (blind) testing element involved multiple LLSS passes over a similar string of targets configured in a random order(s) (unknown to the data acquisition team) to evaluate system capabilities for target acquisition and differentiating UXO from inert objects of similar size and shape. The UXO simulators were purchased from a known military supplier. The “dummy” objects were constructed by SAIC from lengths of aluminum, steel and PVC pipe and designed to mimic the UXO simulators in terms of size, shape and color. In addition to the 1500-ft mainline, each target string also featured two anchors and 100-ft standoff lines with surface floats. Target strings were deployed by hand from the stern of the survey vessel and recovered with capstan and pulley. A transmissometer was also used during the second demonstration survey to locate specific sites within the survey area showing increased water clarity immediately above the seafloor, as high turbidity was shown to be a significant impediment to LLSS performance during the first survey. Using the data obtained during the demonstration surveys, LLSS performance was evaluated through several pre-determined quantitative and qualitative performance metrics including the following: Quantitative Metrics
• Depth station keeping (+/- depth, % survey length)
• Line station keeping (+/- cross track position, % survey length)
• Data pre-processing and data file mapping (timer per survey line)
• Target analysis (time per survey line)
• Survey production rates (hectares per hour)
• Probability of surrogate target detection (frequency)
• Probability of false alarm (frequency)
• Probability of false negative (frequency)
• Target location accuracies (x,y position differential)

Final Report LLSS for UXO Characterization
xv
• UXO parameter estimates (length and width measurements)
• Survey coverage (% area requiring re-mapping)
Qualitative Metrics
• Ease of use (effort required to mobilize and operate)
• System reliability (time lost due to equipment failure)
• Maintenance (time spend on equipment maintenance) Technical Results. The Year 1 survey was used to complete the calibration element. LLSS data collected during this effort ultimately led to image processing, measuring, and positioning enhancements. The Year 2 survey was used to evaluate these enhancements related to LLSS data acquisition and image display as well as to complete the validation element. Regarding image quality, LLSS images were found to be substantially improved during Year 2 in terms of clarity, contrast, aspect ratio, and visible details. The three LLSS image software platforms (GeoDAS, CleanSweep2, SAIC) showed various differences in final image quality. The images produced by the SAIC software were considered the best overall representation of the targets to be used for final identification. In terms of target morphometry, Year 1 length and width LLSS measurement data showed good agreement with actual target size (~7% smaller than actual) for along-track measurements (parallel to LLSS travel), but large error (~2x larger than actual target size) for across-track measurements (perpendicular the LLSS travel); this error was linked to altimeter range setting and corrected for the Year 2 survey. When grouped together regardless of orientation relative to the survey track, the overall Year 2 length and width LLSS measurements showed good correlation to actual measurements (slope = 1.05; r2 = 0.97, with image measurements being on average 5% larger than actual. With regards to target positioning, Year 1 data indicated poor precision for the LLSS, with an approximately 80 m offset between the LLSS determined horizontal positions of the same targets on separate survey passes. Considering the repeatability (i.e., minimal variance) associated with this offset (coefficient of variation = 3.3%), the cause of the shift was assumed to be related to a consistent software parameter issue within the GAPS setup. Once this setup error was identified and corrected in the LLSS dataset, the Year 1 precision (i.e., linear offset between survey passes) was reduced to approximately 4 m. The Year 1 data also indicated poor accuracy, with an approximately 40 m offset between the LLSS determined horizontal positions for select targets and the “true” positions for the same targets as determined by a co-located mobile transponder beacon placed by divers. However, the diver determined positions were concluded to be influenced by the same factors described above and thus were considered unreliable. Following identification and elimination of the software setup error, Year 2 data indicated that 50% of repeated LLSS-detected target positions would be expected to fall within 1.65 m of the originally measured position and the minimum level of precision for the LLSS was no greater than 4 m at a 95% confidence level. Year 2 data also indicated accuracy of 2-3 m (depending on which software application was used for measurement) between LLSS determined positions for select

Final Report LLSS for UXO Characterization
xvi
targets and “true” positions for the same targets as determined by a co-located mobile transponder beacons attached to the targets. Transmissometer data collected during the Year 2 survey indicated that the LLSS will produce high quality images in bottom water with a beam attenuation coefficient <1.115 m-1 and will not produce successful images in bottom water with a beam attenuation coefficient >2.453 m-1. Waters with beam attenuation coefficients between these values will produce LLSS images of variable quality, with values <1.179 m-1 having a greater potential for success. The lowest observed beam attenuation coefficients were correlated to bottom types consisting primarily of rock or sand while the highest observed beam attenuation coefficients were correlated to sandy silt, thus indicating that hard bottom is conducive to the collection of high quality LLSS data while softer bottom is more likely to produce turbid water that would limit LLSS success. For the blind testing element, Tier I classification success (target correctly identified as UXO simulator or dummy object) was 89% for targets surveyed. Tier II classification success (specific target ID correctly identified) was 78%. The probability of false alarm (Type I error; dummy objects falsely identified as UXO simulators) and the probability of False Negative (Type II error; UXO simulators falsely identified as dummy objects) were both 0%. Overall, quantitative results from the demonstration surveys complied with the established success criteria for the depth station keeping, line station keeping, data pre-processing, target analysis, probability of false alarm, probability of false negative, UXO parameter estimate and survey coverage objectives. The success criteria for the survey production rate, probability of surrogate target detection and target location accuracy quantitative objectives were technically not met during the demonstration, but the results were qualified as necessary within the scope of the limited available data. The ease of use, system reliability and maintenance qualitative objectives were also evaluated within the scope of the available data. Cost Assessment. The cost model for the LLSS was based upon expenses for capital equipment, site preparation, mobilization, survey operation, demobilization and survey products. The primary cost drivers for the LLSS demonstration were the daily labor costs for the specialized and relatively large staff needed to operate the equipment and the daily charter rate for the survey vessel. In addition to these drivers, increased costs for mobilization and demobilization and recovery costs for maintenance and/or replacement of the capital equipment may impact future surveys. A cost benefit analysis was conducted for the LLSS compared to three alternative technologies for similar underwater mapping and/or imaging of potential UXO items (magnetometer survey using a marine-towed array [MTA], intrusive investigation and underwater video using divers, intrusive investigation and underwater video using a remotely operated vehicle [ROV]). This analysis revealed that the LLSS is more expensive than the MTA both per hectare and per hour, but the MTA does not generate real-time visual images of the targets; it only identifies the locations of magnetic anomalies as spikes in the magnetic return. The LLSS is less expensive and more efficient than a full intrusive and/or underwater video investigation using divers or an ROV in terms of coverage, but more expensive than these techniques in terms of time. The latter can be explained by the fact that the LLSS has relatively large equipment and personnel

Final Report LLSS for UXO Characterization
xvii
requirements, but actual data acquisition (i.e. active survey time) occurs very quickly once the sensor is in the water. Since the LLSS can both locate targets and provide visual images of them for identification, this technology can be seen as combining the best aspects of the other approaches into one integrated package. To that end, the per unit area costs associated with the LLSS are less than the costs of the other approaches combined, thus making the LLSS a relatively cost effective and versatile method for underwater UXO characterization. Conclusions. The LLSS provides a highly maneuverable and cost effective seafloor mapping tool capable of producing real-time high resolution visual images of potential UXO targets exposed on the seafloor. The LLSS software is capable of measuring these targets from the images to within 5% of the actual dimensions, which can greatly assist in the identification and discrimination of UXO items from similar looking clutter. The positioning ability of the LLSS is both precise and accurate to less than 2-3 m, which can support the successful and efficient reacquisition of targets for potential recovery. Validation testing has indicated that the probability of false identification of targets observed with the LLSS is essentially negligible when using the highest quality LLSS images obtained under optimal environmental conditions. Optimal LLSS performance was observed over hard substrate during conditions of low water column turbidity and low ambient light, at which point the quality of the LLSS images approaches digital photography and/or underwater video.


Final Report LLSS for UXO Characterization
1
1.0. INTRODUCTION This section provides a general overview of the project. 1.1. BACKGROUND Assessments conducted at many former and active Department of Defense (DoD) ranges and installations have discovered Unexploded Ordnance (UXO) in the underwater environment, posing a potential current or future hazard. The United States Army Corps of Engineers (USACE) has evaluated Formerly Used Defense Sites (FUDS) and found that there are more than 10 million acres potentially containing munitions/UXO in underwater environments at approximately 400 sites. Additionally, the United States Navy and Marine Corps have identified 20 offshore range sites containing munitions. Relatively little is known about these underwater sites, which cover a broad spectrum of environments including shallow near-coastal and deep offshore marine sites, as well as estuaries and freshwater sites. Examples of virtually any type of munitions that have been part of the historical inventory of a military installation may be found on or in the sediments present at these individual sites. This project demonstrates that a remote sensor survey utilizing laser imaging technology can provide an effective means of locating potential UXO in an underwater setting where these items lie exposed on the seafloor. The laser imagery also allows for the determination of size and condition (intact or clutter), which would greatly facilitate the ground-truthing effort or any potential intervention (removal or in-place detonation). Due to the obvious obstacles imposed by underwater environments, the development of technologies to address detection and identification of submerged UXO lags behind that of similar technologies used at terrestrial sites. There have been a number of technologies developed and tested for underwater UXO wide-area detection, including many projects under the SERDP and ESTCP programs. However, the wide-area assessment of underwater UXO continues to be hampered by the lack of technology that can provide the necessary information to trained EOD personnel to readily discriminate intact UXO from UXO clutter or non-UXO items. While side-scan sonar and marine magnetometry can provide wide area coverage, these technologies do not provide sufficient diagnostic information for UXO identification. Underwater video and photography can provide high quality imagery for positive “heads-up” identification by trained EOD personnel, potentially reducing the number of diver validation attempts, but coverage rates of these optical devices are generally low (as a tradeoff for image resolution) and accuracy of the geolocation of any detected UXO is generally reduced. Therefore, the need exists to fill this technology gap by providing an optical seafloor imaging system with wide area coverage rates, sufficient image resolution to support UXO identification, and sufficient accuracy in the georeferencing to allow for reacquisition of targets of interest. For this demonstration, SAIC utilized a suite of underwater remote sensors, including the SM-2000 Laser Line Scan System (LLSS). The LLSS is composed of an underwater optical sensor consisting of a solid-state Nd-YAG (blue-green) laser with synchronized rotating mirrors and an optical receiver. As this study will demonstrate, the SAIC LLSS is unique in that it can rapidly collect accurately georegistered, high-resolution images of the seabed and exposed objects

Final Report LLSS for UXO Characterization
2
resting at the sediment-water interface, thus resulting in considerably enhanced spatial coverage over time. The benefit associated with use of the LLSS as part of UXO surveys is that this system combines the efficiency and spatial coverage of a remote survey system with an image resolution approaching that of visual observations. Thus the system offers immediate, positive detection of exposed UXO (as opposed to clutter or non-UXO items), thus greatly reducing the total number of validation events that would otherwise be required for UXO surveys based solely on wide area geophysical systems. However, the LLSS will not detect buried objects and image quality is degraded in turbid waters. Therefore its use in stand-alone application may be limited. 1.2. OBJECTIVE OF THE DEMONSTRATION Areas of underwater UXO that are deemed inaccessible to standard UXO search technologies are reported to exceed 10-million acres. The objective of this project was to demonstrate the utility of the SM-2000 Laser Line Scan System (LLSS) for improved wide-area detection, identification and assessment of UXO and ordnance related materials in the marine environment. Two surveys (heretofore referred to as Year 1 and Year 2, corresponding to fiscal years) were conducted utilizing the LLSS to examine the ability of high-resolution digital imagery of the seafloor to locate and discriminate potential UXO on the seafloor. The results of these surveys are intended to focus, prioritize, and potentially eliminate the need for follow-on surveys involving more intensive “cued” systems (e.g., electromagnetic) or other ground-truthing efforts (e.g., diver confirmation). Under ideal conditions (calm, clear waters; flat topography), the optical images produced by LLSS can georeference and resolve centimeter-sized objects at two to five times the range of conventional video and photographic systems and therefore offer enhanced potential for positive identification and discrimination of UXO items. However, various environmental parameters (turbidity, sea state, benthic biology and seafloor roughness) are known to affect image quality and ultimate resolution of the imagery used for UXO detection/identification; hence it is necessary to understand the effects of these parameters on image quality in order to quantify the operational performance envelope for this survey tool. As a result, the performance of the LLSS was evaluated within a matrix of mission requirements and environmental conditions typical of a range of UXO disposal sites. A series of performance metrics were used for determining the level of success achieved during each phase of the demonstration in terms of image clarity/resolution as well as minimum and maximum coverage swath widths. Results were obtained for the relatively turbid water conditions associated with shallow coastal environments (San Diego Bay). Unplanned military restrictions preventing access to an offshore Navy firing range (San Clemente Island) prevented a demonstration under more optimal deep/clear water conditions. 1.3. REGULATORY DRIVERS The regulatory issues affecting the UXO problem are most frequently associated with the Base Realignment and Closure (BRAC) and FUDS processes involving the transfer of DoD property to other government agencies or to the civilian sector. When the transfer of responsibility to other government agencies or to the civilian sector takes place, the DoD lands fall under the compliance requirements of the Superfund statutes. Section 2908 of the 1993 Public Law 103-

Final Report LLSS for UXO Characterization
3
160 requires adherence to Comprehensive Environmental Response, Compensation, and Liability Act (CERCLA) provisions. The basic issues center upon the assumption of liability for ordnance contamination on the previously DoD-controlled sites. The environmental issues associated with this demonstration were described in the Site Inspection Report. The operations associated with the LLSS demonstration survey were non-intrusive and did not require permits or an Explosives Safety Submission (ESS) and are not subject to environmental regulation. There were no known regulatory issues with this demonstration. The majority of work was conducted within boundaries of Navy training ranges.

Final Report LLSS for UXO Characterization
4
2.0. TECHNOLOGY This section provides an overview of the technology that was demonstrated. 2.1. TECHNOLOGY DESCRIPTION Laser Line Scan. The SM-2000 LLSS is an optically-based swath imaging tool contained within a single, relatively compact pressure housing that can be transported to a worksite and rapidly mobilized on a remotely operated towed vehicle (ROTV) for surveying in water depths ranging from 3 to 1500 m. The LLSS is composed of an underwater optical sensor consisting of a solid-state, 200 mW, neodymium-doped yttrium aluminum garnet (Nd:YAG), 532 nm (blue-green) laser with synchronized rotating mirrors and an optical receiver. The rotation results in the sweep of the laser beam through a 70-degree sector of the ocean floor. The light energy reflected by bottom features is then projected on a photo-multiplier tube (PMT) and converted into an analog signal. Each individual scan line is passed to the topside electronics where it is digitized and written to file on a sample by sample basis (Figure 2.1-1). Each seafloor scan line covers a swath 1.4 times the altitude (height above bottom or target) of the LLSS. As the sensor moves forward, new portions of the seabed are scanned creating a continuous image that is similar in nature to a video image. Due to the limitations of the optical path, a minimum focal length of 2.5 m is required to provide the correct geometry between the excitation beam and the PMT receiver.
Figure 2.1-1. Schematic diagram of the light path of the 532 nm (blue-green) laser during the
operation of the SAIC SM-2000 LLSS. The density of the optical data used to develop a digital LLSS image is determined by sample rate (cross-track) and system scan rate (along-track) relative to tow vessel speed (Figure 2.1-2). The maximum lateral scan angle is 70°, which in turn controls the swath width. Each scan is digitized at a rate of 1.25 millions of samples per second (Ms/s). Therefore, the actual pixel size produced by the laser depends upon sensor altitude, tow speed, scan rate, and the number of samples captured per scan line as follows:

Final Report LLSS for UXO Characterization
5
• Along-track pixel size in centimeters (cm) = 771 X Tow Speed (knots) / RPM (# of revolutions of the scanner drive shaft).
• Cross-track resolution in centimeters (cm) = 140 X Sensor Altitude (m) / N (# of samples captured per a single scan).
Figure 2.1-2. Schematic diagram displaying how the pixel size of the digital seafloor is a
function of sampling rate, tow speed, and altitude. The scan speed for the LLSS is user controllable with an upper limit of 3660 RPM. As an example, 1.05 cm along track and 0.53 cm cross track pixel sizes are achieved at an altitude of 15 m and a tow speed of 5 knots when the scanner is operated at 3660 RPM at the standard sample rate of 1.25 Ms/s. In the original SM-2000 configuration, pixel sizes would fluctuate based on operational conditions (e.g., altitude) and image post-processing would be required to correct the resulting distortions. The SAIC SM-2000, however, is configured in such a manner that sampling is conducted at a fixed rate regardess of conditions; the number of across-track samples is directly determined by the fixed Data Acquisition Center (DAC) sample rate and mirror RPM. As a result, pixel ratios no longer affect image quality. This correction is due to new software which adjusts image projection in real-time, allowing the area to be effectively over-sampled in all but the most extreme tow rates or lowest altitudes. The system is operated at the most rapid scan speed and sampling rate (3660 RPM, 1.25 Ms/s) producing 3985 pixels per scan. However, the final resolution and clarity of the digital imagery is also subject to water clarity conditions, which directly impacts the range of the laser, altitude at which it is flown and the width of each scan. As Table 2.1-1 indicates, the resolution within the imagery increases as altitude and swath width decrease, but the sampling resolution and coverage rates for various water clarity conditions appear to be compatible with wide area assessment (WAA) requirements.

Final Report LLSS for UXO Characterization
6
Table 2.1-1. Documented water clarity and image resolution relationships for the LLSS prior to this demonstration.
Water Clarity
Imaging Range
(m)
Swath Width
(m)
Sampling Resolution
@ 3985 pixels/line
(cm)
Areal Coverage
Rate (km2/hr)
Areal Coverage
Rate (acres/day)
Very Clear (Hawaii) 45 63.0 3 0.34 672Clear (San Diego) 22 30.8 1.5 0.17 329Moderate (Ostrich Bay) 9 12.6 0.6 0.07 134Poor (Lake Erie) 3 4.2 0.2 0.02 45
Remotely Operated Towed Vehicle. The LLSS has been engineered to operate independently or within a suite of remote sensors to characterize the seafloor. Currently the LLSS is part of an integrated seafloor mapping system residing on SAIC’s FOCUS 1500 ROTV (Figure 2.1-3). The FOCUS ROTV provides a stable platform that can be maneuvered along discrete survey track lines, and provides a coordinated uplink of sensor and instrumentation data over a fiber optic tow cable manipulated by a LEBUS hydraulic drum winch. The FOCUS is towed behind a vessel of opportunity to provide the vehicle’s forward movement at speeds up to 5 knots. It uses four movable control surfaces, two vertical and two horizontal, allowing the operator to control the vehicle position and altitude to within a meter of the desired track. Besides the LLSS, the FOCUS also supports concurrent use of an EdgeTech side-scan sonar, sub-bottom profilers, magnetometers, RESON multibeam bathymetric transducers and other sensors. This vehicle system is extensively used around the world for seafloor classification, search and recovery efforts, and offshore oil and gas applications that require the ability to obtain a variety of data types during a single occupation of a survey line. The ROTV control/display console enables the operator to continuously monitor ROTV depth, altitude, attitude, heading and temperature. It also permits automatic or manual control of the vehicle altitude up to ± 40 m in the vertical plane and ± 40 m on either side of the center track, without having to adjust the tow cable length. When configured for LLSS data collection, the SM-2000 laser is attached to the underside of the FOCUS, which is typically towed at a speed of 3 knots and at an altitude ranging from 4 m to 15 m above the seafloor, depending on the terrain and required resolution (Figure 2.1-3). Positioning is accomplished using a combination of Differential Global Positioning System (DGPS) and acoustic tracking methods to accurately determine the precise horizontal location of the ROTV (within 0.2% of the slant range) at any given time. For the present investigation, the FOCUS was configured to carry a Seatex MRU-6 motion sensor providing precise heading and vehicle attitude, as well as a Mesotech 1007 altimeter to determine vertical position and an IXSEA GAPS acoustic transponder/responder beacon to obtain horizontal positioning (discussed in the following subsection). A KVH fluxgate compass and a two-axis Lucas Accustar pitch and roll sensor were also included as backup heading and attitude sensors.

Final Report LLSS for UXO Characterization
7
Figure 2.1-3. Photo of the FOCUS 1500 system prior to deployment for an offshore survey with
major components identified, as well as dimensions and depth rating for the tow body.
Navigation System. High resolution, precision positioning of each seafloor LLSS scan and resulting images is based on data provided by the combined use of the IXSEA Global Acoustic Positioning System (GAPS) and the IXSEA PHotonic Inertial Navigation System (PHINS) 6000. The GAPS combines ultra-short baseline (USBL), inertial navigation system (INS) and global positioning system (GPS) technologies in one integrated package designed to determine real-time geodetic positioning of an aquatic sensor (i.e., the FOCUS ROTV) as it moves through the water. The GAPS pressure vessel (i.e., head) features an integrated acoustic array (i.e., hydrophone) and internal gyroscope that is pole-mounted to the survey vessel and lowered into the water at the start of operations. This head is interfaced with a Trimble R8 differential GPS (DGPS) receiver mounted on the deck that obtains the primary position of the survey vessel from which the relative position of the ROTV is calculated by GAPS. For additional accuracy (down to centimeter level), the DGPS receiver may also be integrated with a cellular phone based virtual reference station (VRS) network to provide real-time kinematic (RTK) satellite corrections. As part of the GAPS system, a mobile MT832E-R transponder/responder beacon is attached to the ROTV. This device transmits its position relative to the acoustic array using a series of acoustic pings. Upon receiving these pings, the GAPS gyroscope determines vessel heading, attitude and heave to make range and bearing adjustments to both the surface and subsurface position of the FOCUS vehicle. The positioning data are subsequently transmitted to the topside acquisition console through a wired connection for display and logging. As an added component to GAPS, the PHINS unit is mounted directly to the FOCUS vehicle to allow for the three-dimensional motion and independent positioning of the sensor package through the use of an acoustic Doppler Velocity Log (DVL) combined with a second internal
FOCUS Length 8 feet FOCUS Width 4 feet FOCUS Height 6 feet Weight (Air) 1400 lbs Depth Rating 5000 feet 1500 meters

Final Report LLSS for UXO Characterization
8
gyroscope. The gyroscope provides precise heading, attitude and heave measurements, while the DVL tracks the motion of the ROTV relative to the seafloor at an update rate of 20 Hz. Geodetic positions for the ROTV are calculated in the PHINS software module based on the acoustic positioning data provided by the GAPS system, as well as the motion and bottom tracking data obtained by the PHINS unit mounted on the ROTV. The geodetic accuracy of the navigation string output by the PHINS software is directly dependent upon the acoustic position provided by GAPS until a solid bottom lock is attained by the DVL, after which bottom tracking serves as the principal means of positioning. Once the DVL has a achieved a lock on the seafloor, PHINS uses the last USBL position received from GAPS as a reference point on which to base its calculation of ROTV position. As a result, the geodetic accuracy of the PHINS positioning data is a function of the accuracy of the final position derived from GAPS (including variables such as sound velocity corrections, GPS accuracy/precision, biases, antenna offsets, etc.) prior to the bottom lock being achieved. Given the dependence on external sources of navigation data for the initial position fix, the geodetic accuracy for surface positioning with the GAPS/PHINS system ranges from 0.5 m (RTK GPS) to 3 m (DGPS), then 0.2% of the slant range for the subsea, acoustic positioning component. Although acoustic tracking of an underwater vehicle via USBL alone remains a reliable means of accurately positioning mobile devices relative to a surface vessel, the incorporation of an inertial navigation system based on bottom tracking represents a marked improvement in consistency and field data quality. Once bottom lock is achieved, the PHINS eliminates the dependence on two-way acoustic communications through the water column, instead supporting direct electronic communications through the sensor tow cable. This in turn allows for a ten-fold increase in the position update rate form PHINS versus GAPS alone, yielding much higher resolution in the positioning data. In addition, the direct electronic connection to the support vessel eliminates the potential for errors in the acoustic communications associated with changes in water column sound velocity, cavitation in the water column, as well as simple random errors in range or bearing measurements that decrease the consistency in calculated positioning of the towbody and increase the need for data filtering and corrections during post-processing. Data Acquisition and Processing Software. Since its original development in 1988 for the U.S. Navy and subsequent de-classification to the private sector, the LLSS has evolved to take advantage of improved optics and changes in technology that effect how it is deployed and how the data are telemetered to the topside controllers (Table 2.1-2). Over the past few years, SAIC has also re-engineered the way the LLSS optical data are stored and displayed. Unlike the original hardware configuration, each digitized scan line of LLSS data is now recorded to an electronic file on a line-by-line basis and tagged with navigation data, ROTV orientation data and all LLSS control and status messages. In addition to the image data, navigation and laser control information is also logged electronically to provide the information necessary for both real-time and post-processing. Any other external sensor data (e.g., side-scan sonar and sub-bottom) are similarly co-registered with the LLSS data. This data fusion greatly enhances image quality and geo-referencing of targets detected in these data types by eliminating time- and/or location-specific variances among the data streams.

Final Report LLSS for UXO Characterization
9
Ocean Imaging Corporation (OIC) GeoDAS seafloor imaging/data management software is the primary platform used to support acquisition, real-time processing and geocoding of digital LLSS data and to simultaneously interface navigation, attitude, altitude and environmental sensors providing real-time feedback regarding system operation. GeoDAS also allows control of LLSS scan rate, range, aperture and image balance settings; collects simultaneous navigation streams from GAPS, vessel GPS and beacons; corrects image display for FOCUS pitch, roll and yaw; provides a real-time target mark and measure tool; and constructs an image library of flagged targets. Besides being stored in raw format, a copy of the digital LLSS data is processed in real-time by the GeoDAS software where radiometric and geometric corrections are applied and the data are reviewed on a monitor. The GeoDAS waterfall display provides the operator with instant feedback about LLSS image quality and survey coverage that is necessary for effective operation of the system. This real-time display also allows rapid detection and tagging of seafloor features, thus allowing many targets to be immediately identified and questionable ones to be marked accordingly for further investigation. A Target Display screen within the GeoDAS package provides a means for the isolation, measurement, annotation and automatic databasing of individually flagged targets. Following data acquisition and initial processing with GeoDAS, OIC CleanSweep2 software is also used to provide complete post-survey data processing and QC to facilitate the enhancement of LLSS imagery. This package allows for the smoothing, de-spiking and manual editing of select survey metadata to eliminate spurious features and provides powerful LLSS processing capabilities that include along- and across-track gain equalization. As with GeoDAS, CleanSweep2 has targeting tools that support image capture, measurement, classification and organization for objects of interest. Advanced functionality available with the CleanSweep2 targeting tool also allows for the georectification and export of high resolution target images. Final data processing with CleanSweep2 provides extensions for porting image data to ESRI ArcGIS 9.3 (with Spatial Analyst and 3-D Analyst extensions), which allows LLSS data to be overlaid with other spatial data sets supporting target detection. Independent from OIC, SAIC has also developed an LLSS software processing tool that allows for extraction, manipulation and visualization of raw LLSS data and metadata. The SAIC tool provides additional functionality that is not available within the current versions of GeoDAS and CleanSweep2. This added functionality includes provisions to:
• Extract and tabulate metadata information from OIC data files;
• Edit metadata information directly and generate a new OIC data file that incorporates the changes made;
• Average pertinent metadata over a specified time period and export the result in spreadsheet format;
• Extract a specified segment of an OIC file, scale the LLSS data by altitude and tow speed, and produce an image of the extracted data at the highest resolution possible; and

Final Report LLSS for UXO Characterization
10
• Automatically trim an OIC file to a target range of individual line scans while maintaining the integrity of the file format.
2.2. TECHNOLOGY DEVELOPMENT Although the LLSS has been rigorously field-tested and has been fully operational for a number of years, a robust analysis of this technology specifically for underwater UXO detection had not been previously attempted. The original Mobile Underwater Debris Survey (MUDS) project (SERDP UX-52) evaluated laser line scan technology but only in very turbid environments. Previous studies of optical imaging systems such as the “2004 Very Shallow Water Mine Countermeasure Reacquisition – Identification UUV Requirements Working Group” evaluated nine different electro-optical video camera systems but not laser technology. These projects are the only other known prior evaluations of the LLSS technology. The SAIC SM-2000 laser that was used in the demonstration surveys incorporates many advances over the historic systems which, in theory, should have improved upon its performance for the WAA of areas regarding the presence and density of UXO, as well as detection, identification, localization and discriminaton of UXO versus clutter (Figure 2.2-1). Furthermore, integrating the LLSS with the FOCUS ROTV allowed the laser to be operated simultaneously with other remote sensors that have previously been used for UXO detection (e.g., side-scan sonar); the resulting opportunity to simultaneously gather corroborative data for determining specific locations and identification of UXO targets in an area proved useful for anticipating bottom conditions that would affect LLSS functionality (e.g., turbidity). Although the overall approach was slightly modified from the Year 1 to Year 2 surveys for this demonstration, no significant alterations were made to the technology over that time.
Table 2.1-2. LLSS developmental history. 1988 - Laser Line Scan System technology originally developed under classified US Navy program.
Sensor originally designed to be mounted on submarines to yield high resolution optical images of the seafloor.
1991 - SAIC teams with system developer to integrate Laser into SAIC-designed tow platform. 1991 - LLSS first used commercially by SAIC Point Loma Outfall Extension Project. 1992 - Westinghouse Inc. acquired rights to the system, and replaced argon laser with Solid State
Nd:YAG unit. 1992 - SAIC purchased the LLSS for commercial survey applications. 2002 - SAIC expanded laser capabilities by purchasing additional laser equipment from Northrop-
Grumman. 2003 - SAIC teams with OIC to upgrade topside control consoles and digital mosaicing and storage
system with GeoDAS software. 2010 - OIC develops CleanSweep2 post-processing software for improved image resolution and sizing;
SAIC develops LLSS software tool for increased data manipulation capabilities.

Final Report LLSS for UXO Characterization
11
Figure 2.2-1. Unprocessed LLSS images of a simulated 60 mm mortar (left), a simulated
142 mm projectile (middle) and kelp frond (right) collected during the Year 1 demonstration off the coast of San Diego in water depths of approximately 70 ft and at an altitude of approximately 9 ft (3 m) above the seafloor.
2.3. ADVANTAGES AND LIMITATIONS OF THE TECHNOLOGY As described above, the LLSS was designed to achieve underwater video image quality at coverage rates approaching acoustic remote sensing techniques. The primary advantage of the LLSS over other geophysical instruments is the moderate to high resolution capability, particularly in clear water, that allows for the immediate positive identification of UXO in a WAA. The primary disadvantage is the inability to image targets in turbid water. Although superior to underwater video in terms of coverage rate, the LLSS is still an optical system with both the source and response light being subject to attenuation during its two-way travel through the water column. The 532 nm light emitted by the laser is substantially more resistant to attenuation than other wavelengths of light in the water column, but its transmission range and energy levels remain a function of water clarity. Particulate matter in the water column scatters both the light emitted from the LLSS, as well as the return signal reaching the PMT. As a result, high concentrations of suspended solids affect the performance of the system. Results of the demonstration surveys confirmed that water clarity can have a significant impact on the success of LLSS operations. When a severe storm event passed through San Diego in the middle of the Year 1 survey operations, the resulting turbidity caused by stormwater runoff and sediment resuspension effectively prohibited LLSS work for all of the remaining three available days of ship time. Diver determined visibility following the storm was documented at < 1 ft. Under these conditions, the LLSS could not produce any imagery of the bottom even at 3 m range. The LLSS is also sensitive to ambient light conditions in the water column. Despite aggressive light filtering techniques, high levels of ambient light can impact the quality of LLSS imagery, particularly over a shallow water site (< 50 ft depth). Ambient light at or near a wavelength of 532 nm is often present in the upper water column during the daylight hours and can produce optical noise that degrades the return signal from the seafloor to the PMT. The degree of signal degradation associated with ambient light is variable based on atmospheric conditions, water color, water clarity and the depth at which the LLSS is operating. The sharpest imagery is typically obtained when the LLSS is operating at a deep water site or when performing shallow water surveys at night in order to minimize the influence of spurious light in the data.

Final Report LLSS for UXO Characterization
12
Finally, the LLSS is limited in its ability to detect subsurface targets that are buried and surface targets that are significantly fouled; for the latter case the detection might be impaired (though no worse than other optical systems). Although not tested in this demonstration, the addition of a traditional marine magnetometer to the FOCUS is possible to address these burial and fouling limitations. In summary, the presumed advantages of the LLSS include:
1) High rate of seafloor coverage;
2) Visualization of UXO-related features (e.g., projectile shape and size);
3) Increased support for prioritization of follow-on effort (e.g., reduced “dig sheet” for confirmed UXO); and
4) East of data reduction and dissemination (e.g., GIS targets mapped onto mosaic images of the seafloor).
The primary limitations of the LLSS are expected to include:
1) Image resolution highly dependent on water clarity (i.e., high turbidity can degrade image quality);
2) Lack of UXO detection (size, mass) for heavily fouled or buried targets without accompanying magnetic sensor confirmation;
3) Lack of elevation data (imagery is two-dimensional) resulting in a difficulty in extracting height and shape for vertical targets; and
4) Sensitivity to ambient light (i.e., shallow water surveys are limited to night-time operations).

Final Report LLSS for UXO Characterization
13
3.0. PERFORMANCE OBJECTIVES The basis for evaluating the performance and costs of the LLSS technology for application to underwater UXO detection is the comparison of final system metrics to pre-determined performance objectives. Both quantitative and qualitative performance objectives were established for the LLSS as summarized in Table 4.1-1. These objectives were originally presented in the Year 1 and Year 2 Demonstration Plans for this project and approved by ESTCP. All performance objectives for the LLSS are discussed in detail in the following sub-sections.
Table 4.1-1. Summary of performance objectives for the LLSS demonstration. Performance
Objective Metric Data Required Success Criteria
Quantitative Performance Objectives Depth station keeping
+/- depth, % of survey length • DGPS and acoustic tracking data +/- 1 m over 50%
survey length Line Station keeping +/- cross-track position • DGPS and acoustic tracking data +/- 3 m across track Data preprocessing and creation of mapped data files
Time • Measured time for processing
< 1 hour
Target analysis and dig list time
Time • Measured time from completion of the collection of raw target data
< 3 hours
Survey production rates
Acres/day • Measured survey area covered >42,000 m2/hour
Probability of surrogate target detection
Target detect frequency (%)
• Number of true targets found >90%
Probability of false alarm
False alarm frequency (%)
• Number of dummy objects incorrectly identified as UXO simulators
< 10%
Probability of false negative
False negative frequency (%)
• Number of UXO simulators falsely identified as dummy objects
< 10%
Target location accuracies
x, y position differential (+/- cm)
• True position and calculated position of targets
+/-50 cm
UXO parameter estimates
Length, width (cm) • Calculated dimensions and actual dimensions
+/-5 cm
Survey coverage/missed areas
% total area requiring re-mapping
• Area mapped and area missed < 5%
Qualitative Performance Objectives Ease of use Level of effort • Feedback from technician on
usability of technology and time required
Relative ease
System reliability Percent down time during surveys
• Historical data from previous non UXO surveys
< 1%
Maintenance Maintenance per hour of operation
• Historical maintenance records < 10 min

Final Report LLSS for UXO Characterization
14
3.1. OBJECTIVE: DEPTH STATION KEEPING The effectiveness of the LLSS technology for WAA of UXO is a function of the degree to which the FOCUS system operator can maintain the LLSS at a constant altitude above the seafloor along the length of the survey line while acquiring data. Metric. Track the depth and altitude of the FOCUS ROTV in real-time while acquiring data and calculate the percent of survey length that the LLSS remained at a constant height above the seafloor. Data Required. Data stream provided by the Mesotech 1007 altimeter is required to determine the vertical positions of the LLSS and FOCUS relative to the sediment-water interface and air-water interface at any particular point on a survey line. Success Criteria. This objective will be considered met if the LLSS altitude remains within +/- 1 m of desired height above bottom for over 50% of the length of the survey line. 3.2. OBJECTIVE: LINE STATION KEEPING The effectiveness of the LLSS technology for WAA of UXO is a function of the degree to which the tow vessel and FOCUS operator can maintain the LLSS horizontal position relative to a pre-determined survey line while acquiring data. Metric. Record the cross-track position of the LLSS transducer in real-time while acquiring data and compare it to the precise horizontal position of the pre-determined survey line along which the targets have been placed. Data Required. The acoustic positioning data derived by DGPS and the IXSEA USBL system for the FOCUS tow body is required to determine the acoustic-based horizontal positions of the FOCUS and LLSS at any particular point on a survey line. Success Criteria. This objective will be considered met if the horizontal track line of the LLSS remains within 3 m of the predetermined survey line for the entire length of the pass. 3.3. OBJECTIVE: DATA PRE-PROCESSING The effectiveness of the LLSS technology for WAA of UXO is a function of the time required to pre-process electronic data once it has been collected by the LLSS, then used to develop geo-referenced imagery data files, either on board the survey vessel or shortly after the conclusion of the survey. Metric. Determine the time required to pre-process a single 500 m (1640 ft) long segment of LLSS data (imagery) and create the subsequent map of the seafloor and/or target field. Compare the required time to the length of each survey day and the overall project duration.

Final Report LLSS for UXO Characterization
15
Data Required. Record the start time, end time and level of effort required on pre-processing and mapping each data string. Success Criteria. This objective will be considered satisfied if a particular data string can be pre-processed and used to create mapped data files in less than one hour either on the vessel or on shore. 3.4. OBJECTIVE: TARGET ANALYSIS The effectiveness of the LLSS technology for WAA of UXO is a function of the time required to identify targets in the mapped data files and compare the resulting images to the “dig list” of known targets placed along each survey lane, either onboard the survey vessel or shortly after the conclusion of the survey. Metric. Determine the time required from the end of raw target data collection to view the mapped data files, identify and mark acquired targets, and compare the target images to the pre-established “dig list” for each data string. Compare this time to the length of each survey day and the overall project duration. Data Required. Record the start time, end time and level of effort required to derive the mapped data files, identifying and marking acquired targets, and comparing the images to the pre-established “dig list” for each data string. Success Criteria. This objective will be considered met if the time from when raw target data acquisition is completed to when images can be identified and the “dig list” can be evaluated is less than three hours. 3.5. OBJECTIVE: SURVEY PRODUCTION RATES The effectiveness of the LLSS technology for WAA of UXO is also a function of the area of seafloor that can be surveyed within a given time period at a constant altitude and tow speed in variable weather conditions, sea state and time of day (daylight). Metric. Determine the area of seafloor (m2) that can be surveyed in one hour for a particular set of conditions and compare this area to the known capabilities of the LLSS system at the same altitude, tow speed and swath width. Data Required. Calculate the area covered in a given time period from the resulting data files. Success Criteria. This objective will be considered met if the survey production rate is greater than 42,000 m2/hour; based on a 5 m altitude (7 m swath width) and 1.5 m/s (3 kt) tow speed, discounting seafloor outside the desired survey area covered during turns.

Final Report LLSS for UXO Characterization
16
3.6. OBJECTIVE: PROBABILITY OF SURROGATE TARGET DETECTION The effectiveness of the LLSS technology for WAA of UXO is a function of the degree to which blind targets placed in the survey area are located and correctly identified as either a UXO item (simulator) or an inert object (dummy). Metric. Compare the number and type of objects identified as targets on the seafloor within the LLSS data to the inventory of blind targets surveyed along each validation line. Data Required. Determine the number of targets correctly identified as either UXO simulators (ordnance) or dummy objects (non-ordnance) in proportion to the number of total targets surveyed as part of the validation (blind) element. Success Criteria. This objective will be considered met if the number of objects correctly identified as either UXO simulators or inert targets (absolute performance) is greater than 90% of the total number of targets surveyed. 3.7. OBJECTIVE: PROBABILITY OF FALSE ALARM The effectiveness of the LLSS technology for WAA of UXO is a function of the degree to which responses that correspond to inert targets (non-ordnance) are falsely identified as UXO simulators (ordnance). Metric. Compare the number of dummy objects falsely identified as UXO simulators (false positives) to the total number of dummy objects surveyed on the validation strings. Data Required. Quantify the number of dummy objects incorrectly identified as UXO simulators on the blind testing logs and the total number of dummy objects surveyed by the LLSS system. Success Criteria. This objective will be considered met if the number of dummy objects falsely identified as UXO simulators (false positive quantity) is less than 10% of the total number of dummy objects surveyed on the validation strings. 3.8. OBJECTIVE: PROBABILITY OF FALSE NEGATIVE The effectiveness of the LLSS technology for WAA of UXO is a function of the degree to which responses that correspond to UXO simulators (ordnance) are falsely identified as inert targets (non-ordnance). Metric. Compare the number of UXO simulators falsely identified as dummy objects (false negatives) to the total number of UXO simulators surveyed on the validation strings. Data Required. Quantify the number of UXO simulators incorrectly identified as dummy objects on the blind testing logs and the total number of UXO simulators surveyed by the LLSS system.

Final Report LLSS for UXO Characterization
17
Success Criteria. This objective will be considered met if the number of UXO simulators falsely identified as dummy objects (false negative quantity) is less than 10% of the total number of UXO simulators surveyed on the validation strings. 3.9. OBJECTIVE: TARGET LOCATION ACCURACIES The effectiveness of the LLSS technology for WAA of UXO is a function of the degree to which the geodetic positions of correctly identified targets in the resulting mapped data files can be accurately determined for subsequent use. Metric. Determine the horizontal (x, y) position differential between identified targets as they appear in the LLSS data compared to the known positions that were recorded by the navigation system. Data Required. Utilize the USBL to derive positions of an acoustic pinger held over each target by divers (static) at the time of deployment and compare to the positions derived by the LLSS and USBL during survey operations. Process acquired LLSS data with GIS software to calculate the position of each target as it appears in the mapped data file. Success Criteria. This objective will be considered met if the calculated horizontal (x, y) position for a particular target is within +/-50 cm from the initial position derived by the static, diver-held pinger. 3.10. OBJECTIVE: UXO PARAMETER ESTIMATES The effectiveness of the LLSS technology for WAA of UXO is a function of the degree to which the resulting mapped images can be used to estimate the dimensions (length, width) of identified targets for comparison to known values. Metric. Determine the length and width (cm) of each correctly identified target from the LLSS data and compare these values with the known sizes of each target as measured prior to deployment. Data Required. Measure each target prior to deployment using traditional hand tools (tape measure) and do not divulge this information to the LLSS data analysts. Process acquired LLSS data with optical imaging software to calculate the dimensions of each target as it appears in the mapped data file. Success Criteria. This objective will be considered met if the calculated dimensions (length, width) for a particular target are within +/-5 cm of the actual dimensions.

Final Report LLSS for UXO Characterization
18
3.11. OBJECTIVE: SURVEY COVERAGE The effectiveness of the LLSS technology for WAA of UXO is a function of the success of the survey in achieving complete (>100%) coverage of the target area within the given timeframe for a particular project. Metric. Determine the target area that was not covered during survey operations relative to the total desired survey area to calculate the percent of the total area that would require re-mapping to achieve full coverage. Data Required. Process the geo-referenced LLSS data with GIS software to calculate the total area mapped and the total area missed along each pre-determined survey lane. Success Criteria. This objective will be considered met if the amount of target area missed along each survey lane is less than 5% of the total target area. 3.12. OBJECTIVE: EASE OF USE The effectiveness of the LLSS technology for WAA of UXO is a function of the relative ease of use of the system compared to other techniques for UXO identification. Metric. Determine the level of effort needed to mobilize and operate the LLSS, particularly in variable weather and water conditions, and evaluate whether the technology is cost effective in terms of vessel time and manpower. Data Required. Feedback from technicians on the usability of the LLSS compared to other survey technology with which they have worked. Success Criteria. This objective will be considered met if the technicians operating the system are successful in achieving project goals and report that the LLSS technology is relatively easy compared to the quality of data that is produced. 3.13. OBJECTIVE: SYSTEM RELIABILITY The effectiveness of the LLSS technology for WAA of UXO is a function of the degree to which the system remains reliable in producing quality data while minimizing down time caused by unanticipated equipment failure and repairs. Metric. Determine the time lost during the survey effort due to equipment breakdowns or other unforeseen technological problems as a percent of the overall survey time. Data Required. Record the amount of time lost each survey day for equipment related reasons. Obtain similar data from other non-UXO related LLSS surveys. Success Criteria. This objective will be considered met if the time lost caused by LLSS failure is less than 1% of the entire survey time.

Final Report LLSS for UXO Characterization
19
3.14. OBJECTIVE: MAINTENANCE The effectiveness of the LLSS technology for WAA of UXO is a function of the level of maintenance required to keep the instrument working at full capacity during the hours of operation. Metric. Determine the amount of time (minutes) per hour of operations spent on equipment maintenance or repairs compared to time spent processing data or performing other project related tasks. Data Required. Record the amount of time spent each survey day on equipment maintenance. Obtain similar data from historical maintenance records. Success Criteria. This objective will be considered met if the time used for equipment maintenance is less than 10 min per hour of operation. In addition to the performance objectives described above, other qualitative parameters include:
• Factors affecting system performance – weather, survey vessel breakdowns/difficulties
• Versatility – mobilization, vessel requirements
• Scale-up/Scale-down constraints - trade-offs in system architecture suitable for commercialization
All specific performance objectives presented in the previous subsections are addressed in Section 7. The additional qualitative parameters are addressed throughout Section 5, Section 6 and Section 8.

Final Report LLSS for UXO Characterization
20
4.0. SITE DESCRIPTION This section provides a summary of the survey site(s) and includes all site information relevant to the technology demonstration. 4.1. SITE SELECTION The site selection criteria established for the LLSS demonstration included the following:
• The water depths on the site should be consistent with the design parameters of the project and the demonstration equipment;
• The bottom conditions at the site should not pose an extreme danger to the equipment or preclude opportunity to complete survey operations that would allow a fair evaluation of the system performance;
• The expected water clarity should be compatible with the operating capabilities of the demonstration equipment;
• There should be reasonable access to necessary support infrastructure (if needed); and
• There should be local and organizational buy-in to the proposed work. Year 1 Survey. SPAWAR, in conjunction with SAIC, selected several potential sites in proximity to Naval Air Station North Island and Naval Amphibious Base Coronado in San Diego, California for the first LLSS demonstration. The actual survey sites were determined just prior to each survey day, taking area availability, local weather and sea conditions into consideration. The intended purpose of collecting data at multiple locations was to evaluate data quality under a variety of environmental parameters (e.g., water depth, water clarity, seafloor composition, clutter, etc.). The R/V Acoustic Explorer, the U.S. Navy owned survey vessel based at SPAWAR, was used as the primary vessel to support the LLSS demonstration. The R/V Acoustic Explorer is a steel hull, twin screw, house forward, oceanographic research vessel built in 1981 and refitted by the Navy in 1988. The length overall is 130 feet, the beam is 30 feet, the main deck is 58 feet by 24 feet, the vessel tonnage is 197 tons and berthing is available for 16 persons including crew and scientists. A vessel of this size was required to physically support the large winch and generator needed to operate the LLSS and provide space for the demonstration team. The R/V Acoustic Explorer also features a shipboard crane, large A-frame and inflatable tender vessel, all of which were integral to the LLSS demonstration for launch and recovery of both the FOCUS and the target strings. Transit from the SPAWAR dock to the specific survey sites required approximately 30 minutes in each direction. Due to a combination of weather and logistical factors, the majority of work during the Year 1 demonstration survey occurred just outside survey area Charlie located south of North Island (Figure 4.1-1). Water depths in this area were approximately 70 ft and underwater visibility was reported by divers to be clear during good weather. However, on the evening of the first day of active survey operations (20 April 2010), a significant storm passed through San Diego which

Final Report LLSS for UXO Characterization
21
produced heavy rains, high winds and substantial offshore waves. This event degraded water clarity in the region to a level that was below the minimum acceptable levels of the LLSS for at least three days. Diver determined visibility following the storm was documented at < 1 ft; under these conditions the LLSS could not produce a clear image of the bottom at 3 m range. As a result, further LLSS work in or around survey area Charlie was effectively prohibited for the remainder of the survey. All successful LLSS data from Year 1 were collected in this area on the first day prior to the storm. While foul weather and an elevated sea state prevented work offshore from North Island during the second active survey day immediately following the storm, test data was instead collected in San Diego Bay from the SPAWAR dock to the NASCO shipyard. This path included both the navigation channel and a trip through the restricted area adjacent to the North Island ammunition pier. Results indicated that water clarity was similarly degraded in these areas. Year 2 Survey. Upon revisiting the site selection criteria in conjunction with the results of the Year 1 survey, the San Clemente Island Range Complex (SCIRC) was chosen as the demonstration area for the Year 2 LLSS survey. The area off San Clemente Island was expected to show more favorable water clarity conditions than San Diego Bay or North Island and would be less impacted by potential passing storms. This area also offered a wider variety of bottom types (e.g., sand, hard bottom, etc.) over which to evaluate system performance. In addition, the San Clemente site represented a heavily used training range with known areas of expended and/or discarded ordnance present, particularly in the Pyramid Cove and China Point portions of the Shore Bombardment Area (SHOBA) range located on the south shore of the island. These already seeded items could potentially serve as pre-existing “natural” targets for the LLSS demonstration. After mobilization for the Year 2 cruise, however, the project management team received notice that access to the San Clemente Island SHOBA range had been suspended by the Navy Laser Safety Officer and that additional review time would be needed before full access could be granted; the subsequent review could not be completed during the time allotted for the Year 2 demonstration and access to the SHOBA range was ultimately denied. As a result, survey operations were moved to offshore Boat Lanes 7-10 outside Naval Air Station North Island. This area is oriented perpendicular to the shoreline and located northeast of survey area Charlie (Figure 4.1-1). The Boat Lanes featured variable seafloor conditions ranging from soft sediment to hard bottom depending on the exact area and transmissometer data confirmed that water clarity differed substantially for specific areas within the overall site (see Section 5.4). The remaining Year 2 survey time was devoted to conducting validation testing within the Boat Lanes.

Final Report LLSS for UXO Characterization
22
Figure 4.1-1. Map showing the location of seven potential survey areas relative to Naval Air Station North Island and the specific LLSS operation areas for the Year 1 and Year 2 surveys.

Final Report LLSS for UXO Characterization
23
4.2. SITE DESCRIPTION AND HISTORY Naval Air Station North Island is located at the north end of the Coronado peninsula. Since its commission in 1917, this installation has served as the major continental U.S. base supporting operating forces in the Pacific, including over a dozen aircraft carriers, the Coast Guard, Army, Marines and Seabees. Naval Amphibious Base Coronado is located on the “Silver Strand” of the Coronado peninsula just south of North Island. Development of the installation was commissioned by the Secretary of the Navy in June 1943 to meet wartime demands for trained landing craft crews to be deployed to the South Pacific area of operations. Since World War II, the base has also provided training for Underwater Demolition Teams, United States Navy SEALs, Brown-water navy personnel, and Naval Reserve Officer Training Corps midshipmen, as well as served as a research and testing site for newly developed amphibious equipment. The offshore areas to the southwest of the Coronado peninsula in which the LLSS demonstration was conducted (Figure 4.1-1) are subject to vessel traffic supporting the Base. The Boat Lanes, in particular, serve as discrete locations for large ships to anchor while they are awaiting activities. There is no record of significant bottom disturbance or munitions contamination in this area resulting from military operations at North Island or Coronado. 4.3. SITE GEOLOGY Surface geology off the coast of San Diego had been well characterized prior to this demonstration by a Naval Oceanographic Office (NAVOCEANO) survey designed to classify the marine environment by mine warfare doctrinal bottom type category. This classification system is intended to provide a “probability of detection” for mine counter measure systems depending on bottom composition, the estimated percent of mine case burial, and density of bottom clutter, but for the purposes of the LLSS demonstration it served as a good indicator of the bottom types (e.g, hard or soft) to be expected in the survey areas. Bottom types for the LLSS survey areas as reported by NAVOCEANO are shown in Figure 4.3-1. This LLSS demonstration confirmed that bottom types at survey area Charlie and in Boat Lanes 7-10 were generally consistent with the sandy silt bottom that typifies the Pacific Ocean off coastal Southern California and was predicted for the majority of the site in Figure 4.3-1. However, local areas of hard bottom were also encountered, which coincided with the acquisition of the highest quality LLSS data because the absence of suspended sediments resulted in lower turbidity in these locations. No significant geologic impediments to LLSS operations were observed in these survey areas and there were no substantial changes in water depths other than the expected gradient (i.e., no ledges or rock piles). However, kelp fronds and stray lobster gear were encountered during survey operations as an entanglement hazard for the FOCUS tow body. During the Year 1 survey, the FOCUS vehicle became hung up on the ground line from an errant lobster trap, which in turn parted a communication cable and eliminated the high-powered acoustic output from the side-scan sonar transducer to the topside data console.

Final Report LLSS for UXO Characterization
24
Figure 4.3-1. NAVOCEANO doctrinal bottom type classifications for the LLSS demonstration
site. 4.4. MUNITIONS CONTAMINATION No munitions contamination was found to be present in the Year 1 survey area adjacent to survey area Charlie or in the Year 2 survey area in Boat Lanes 7-10. Because the LLSS demonstration was not conducted at San Clemente Island (the site of known expended or discarded munitions items, particularly at the SHOBA range), encountering munitions was not expected during the field effort. Regardless, the LLSS does not come into direct contact with the seafloor and thus any munitions it might have encountered would not have been handled or disturbed in any manner during survey operations.
A-1: Rock B-1: Sandy Silt A-2: Sand B-2: Silt A-3: Silty Sand B-3: Clayey

Final Report LLSS for UXO Characterization
25
5.0. TEST DESIGN This section provides a detailed description of the survey design that was originally proposed for the LLSS demonstration as well as a summary of the actual accomplishments for each survey year. Foul weather and reduced water clarity encountered during Year 1 and site access limitations encountered during Year 2 required significant alterations to the original plan. All results for the LLSS demonstration are discussed in Section 6.0. 5.1. CONCEPTUAL EXPERIMENTAL DESIGN The overall objective for this project was to demonstrate the capabilities of the LLSS as a seafloor imaging tool and critically examine its effectiveness in WAA of UXO on the seafloor. As described above, the LLSS represents one type of remote sensor that could be utilized to support U.S. Navy range management or site clean-up efforts. The LLSS fills a specialized niche, providing high resolution data suitable for UXO detection and discrimination at a broad coverage rate compared to traditional optical sensors. The intent of the testing effort was to objectively document both the advantages and limitations of the system in a series of controlled field experiments under a variety of environmental conditions. A robust system-testing regimen was developed to evaluate the performance of the LLSS. This test design required the deployment of a series of inert UXO test objects in pre-established survey areas in the waters adjacent to San Diego’s Coronado Peninsula (Figure 4.1-1). The simulated UXO targets ranged in size, shape and optical reflectance and mimicked a broad spectrum of ordnance-related objects that would be encountered in the marine environment. The simulators were purchased “as-new” such that the physical condition when surveyed did not reflect decades of exposure to seawater/fouling communities that would be expected for “real” UXO items. Potential test locations were selected to provide a range of expected environmental conditions and bottom topographies representing some of the potential aquatic UXO sites across the U.S. for which future LLSS surveys may be useful. The overall survey effort was designed to have a calibration and a validation testing element in order to gather sufficient data to draw the necessary conclusions regarding system performance. As part of the experimental design, all data for individual parameters of interest (e.g., target image quality, target measurement and target positioning) would ultimately be assimilated in a “big picture” manner to evaluate the general ability of the LLSS to correctly distinguish targets under two main classification scenarios: (1) shape as unique identifier and (2) size as unique identifier. Under the first scenario, two targets would have a similar size (< 2 inch difference), but one would be a UXO item while the other is a similar looking non-UXO item. In this case, LLSS image quality is more important than measuring capabilities for making an accurate target identification. High image quality is needed to distinguish target shape (e.g., tapered versus blunt) as well as view unique identifiers (e.g., banding, writing, etc.) present on the object. Under the second scenario, two targets would have similar shape, color and banding, and both would be UXO items. However, these targets would be significantly different sizes (>2 inch

Final Report LLSS for UXO Characterization
26
difference). In this case, LLSS measuring capabilities are more important than image quality and accurate measurements to less than one inch would be needed from the LLSS software to make the proper target identification. 5.2. SITE PREPARATION The nature of underwater work planned for this demonstration project did not require site preparation beyond the deployment of the targets immediately prior to LLSS operations. Targets were configured on a string consisting of a 1500 ft length of braided line to which loops had been added at approximately 75 ft intervals for target attachment. The targets for this survey consisted of nine inert UXO simulators designed to visually mimic real munitions items ranging from the 155 mm projectile to the 70 mm rocket to the 60 mm mortar (Figure 5.2-1). Also included were eleven similarly-sized dummy objects (pipes of varying length, diameter, composition, and color designed mimic the UXO simulators). The UXO simulators were purchased new in “ready-to-use” condition from the U.S. Army Aberdeen Test Center; however some slight modifications were necessary in terms of adding the mounting points, labels, and weights required for underwater use. The dummy objects were created from materials purchased at a local hardware store. When placed on the same string, the collection of target objects was intended to allow for an assessment of the LLSS ability to discriminate true UXO targets (ordnance) from dummy objects (non-ordnance) based on morphometry (shape) and reflective (coatings, lettering) data. As an added measure of assessing the contrast and optical resolution of the system, an image of the ISO 12233 electronic image optical resolution chart enlarged to 36” x 58” was mounted onto a 0.050 inch thick (16 gauge) aluminum sheet with spray adhesive and also attached to the target string for imaging by the LLSS (Figure 5.2-2). This chart was originally developed to quantify the output resolution of high-definition cameras and televisions (HDTV). Digital photographic images of the eye chart, simulated UXO and the dummy objects taken prior to the survey are provided in the field manual presented in Appendix B. The specific properties (coating/finish, markings, length, width, height) for each target were also recorded on a pre-printed log; an example of this log is included in Appendix C (Form LLSS-01). The completed log is provided in Appendix D.
Figure 5.2-1. Inert UXO simulators of a 155 mm projectile (left), 70 mm rocket (middle) and
60 mm mortar (right) used as targets to mimic real munitions items for LLSS calibration and validation elements.

Final Report LLSS for UXO Characterization
27
Figure 5.2-2. Photograph of the ISO 12233 electronic image optical resolution chart mounted to
an aluminum board to be used as part of the calibration survey element. During the Year 1 survey, divers first deployed the braided target line (featuring the UXO simulators, dummy objects and one optical resolution chart) from an inflatable support vessel. For subsequent operations, the test line was deployed from the back deck of the R/V Acoustic Explorer by hand-feeding the line off the stern (anchor first) and then attaching each target on available loops before they went over the side. The arrangement of the test line to be used for system calibration activities featured the following objects in order: Danforth anchor with chain, optical resolution chart, UXO simulators (S1-S9), dummy objects (D1-D11), lead weight, paracord line with standoff buoy. The target line was recovered from the starboard rail using a davit and pulley system with a combination of capstan and hand-over-hand line retrieval (Figure 5.2-3). During the final deployment process, the paracord attached to the standoff buoy became entangled on the ship’s rail and parted, leaving the target line unmarked from the surface until divers could attach a new buoy. The GPS positions of the beginning and end of the target line were marked by the vessel navigation system for recovery. During the Year 2 survey, the target string was deployed and recovered from the R/V Acoustic Explorer using the same processes described above. For calibration purposes, the arrangement of the test line featured the following objects in order: Surface float, standoff line with mushroom anchor, Danforth anchor with chain, alternating UXO simulators and dummy objects (S1, D1, S2, D2, etc), optical resolution chart, lead clump weight, second standoff line with mushroom anchor, second surface float. For subsequent validation (i.e., blind testing) purposes, the arrangement of the test line varied based on different predetermined target orders developed with a random number generator and was unknown to the data acquisition team. During deployment of both the calibration and validation strings, the 100-ft standoff lines were pulled perpendicular to the main line using the inflatable tender vessel from the R/V Acoustic Explorer; this step was necessary to move the surface floats away from the survey track to avoid entanglement with the FOCUS vehicle as it was towed along the main line.

Final Report LLSS for UXO Characterization
28
Figure 5.2-3. Target string recovery process used during the LLSS demonstration surveys.
5.3. SYSTEM SPECIFICATIONS The following hardware was used for LLSS operation and navigation during the two LLSS cruises:
• SM-2000 LLSS • FOCUS ROTV 1500 • LEBUS Hydraulic Drum Winch • IXSEA GAPS • IXSEA PHINS 6000 • EdgeTech 2200-M Modular Sonar System with Full Spectrum Dual Frequency
120/410 kHz Side-Scan Sonar • Mesotech Altimeter • Trimble R8 DGPS Receiver • VRS Network
The following software applications were used for data acquisition and processing (both in real-time and post-processing) during the LLSS demonstration:
• GeoDAS (data acquisition / real-time processing) • CleanSweep2 (post-processing) • Hypack (navigation) • EdgeTech DISCOVER (side-scan)
5.4. CALIBRATION ACTIVITIES

Final Report LLSS for UXO Characterization
29
Proposed Methodology. According to the approved test plan, the calibration element of the proposed LLSS demonstration was to consist of performing a LLSS survey over a 1500 ft (0.25 nautical mile) string of attached targets that would represent potential UXO and non-UXO items to be encountered on the seafloor. At the beginning of each survey for a selected area, a main line (1” nylon braid) containing ~20 attached targets (9 UXO, 11 dummy, 1 optical resolution chart) at ~75 ft spacing was to be deployed at a pre-determined location by the target team. Stand-off buoys were to be placed and visible at the water surface to mark the end points of the line. An acoustic transponder beacon was then to be placed at each end of the string to allow the LLSS survey vessel to stand over the beacons and acquire precise acoustic navigation information. Additionally, a diver with a hand-held beacon integrated into the same acoustic positioning system was to swim along the line and collect data on the precise positions of each of the individual target locations. A sample of the field log developed for documentation of calibration activities is provided in Appendix C (Form LLSS-02) Once the acoustic ranges between the survey vessel and transponder placed on the seafloor were established, the LLSS team was to conduct surveys over the length of the calibration line at various altitudes and tow speeds to determine optimal imaging parameters for the validation surveys. The geodetic position for each object on the string was to be estimated in real time and refined in post-processing. Multiple passes (6 to 10) were to be made over this string of targets and these data were to be analyzed for repeatability. Upon completion, the target string was to be retrieved and targets detached. Spatial results in the LLSS dataset were to be ultimately compared to the true (diver-determined) positions for each of the known test objects on the string to determine the overall positional accuracy of the survey system. The survey configuration providing optimal resolution/coverage would then be utilized for the validation surveys discussed in Section 5.6. Different survey areas were expected to have varying environmental conditions (turbidity, sunlight, bottom type) that would result in adjustment of the survey configuration. Actual Accomplishments – Year 1. A detailed description of the daily activities for the entire Year 1 LLSS demonstration are provided in the Year 1 Cruise Report submitted to ESTCP immediately following the first survey in May 2010 (Appendix E). As explained in this quick-look document, the majority of usable data relevant to the calibration objective were collected on the second day of operations just outside survey area Charlie. Once the target line was on bottom (deployed from the back deck of the R/V Acoustic Explorer), the FOCUS vehicle was lowered into position and acoustic navigation was found to be functioning properly. The real-time VRS differential corrections from the shore-based station were not employed due to lack of cellular phone service, thus resulting in differential GPS positioning with an accuracy of 3 to 5 m based solely on USCG differential correctors. The LLSS image quality was good and two passes were made over the target line with independent piloting of the FOCUS vehicle used to keep the entire array in view. Individual shapes and the optical resolution chart could be clearly identified during each pass and were marked in real-time using the GeoDAS software. The target string was left in place following data acquisition to facilitate further survey activities the following day. Foul weather conditions for the next two days precluded diving operations so the string remained at the same location.

Final Report LLSS for UXO Characterization
30
On the final day of the Year 1 survey, due to some improvement in sea state, divers were used to obtain the precise position of targets on the calibration string deployed just outside survey area Charlie (Figure 4.1-1) by swimming the line with an acoustic beacon in communication with the IXSEA transducer and stopping at individual objects. Because of the water depth at survey area Charlie (~70 ft), the divers only had a limited amount of bottom time available (26 min) and positions were obtained only for the first three objects including the Danforth anchor, the optical resolution chart and the first UXO simulator (S1). The diver-determined object positions were recorded and ultimately compared to the corresponding positions identified in the LLSS dataset in order to provide an assessment of target location accuracies (Section 7.8). It should be noted, however, that the diver-determined positions for the targets were acquired three days after the corresponding LLSS data were collected following a period of severe storms and significant wave action. Although the target string is not believed to have moved substantially during this time, with targets found by divers firmly embedded in the soft sediment, a slight positional shifting was possible. Divers also reported that visibility was less than one foot at the seafloor following the storm, thus indicating that the LLSS would not produce any imagery of the bottom at this time. As a result, no further LLSS data acquisition was attempted for the Year 1 survey. Actual Accomplishments – Year 2. A detailed description of the daily activities for the entire Year 2 LLSS demonstration are provided in the Year 2 Cruise Report submitted to ESTCP shortly after the second survey in October 2010 (Appendix F). Although the majority of the calibration goals were accomplished using data from the Year 1 survey (described above), this project element was repeated in Year 2 to refine conclusions and evaluate certain upgrades that were made to the LLSS data display. During the Year 2 survey, a transmissometer was used to evaluate water clarity at potential survey locations prior to deployment of the LLSS in an attempt to quantify and/or limit the impact of turbid conditions; these tests were not included in the Year 2 Demonstration Plan and represented an unplanned activity that was deemed beneficial at the time of survey. During the transmissometer operations, data were collected at five meter intervals between the surface and seafloor. Final data showed that the best quality LLSS images were obtained at a location where the number of transmissometer corrected signal counts (CSC; an indicator of water clarity) within one meter of bottom was greater than 85% of the maximum CSCs for the entire water column (i.e., water clarity at the seafloor was relatively equal to water clarity at the surface; there was no substantial sediment suspension). Furthermore, the Year 2 data showed specific evidence of LLSS image quality degrading as the instrument moved from clear water to turbid water within the same survey transect. These findings are discussed further in Section 6.3.3. Six passes (A-F) were ultimately made over the calibration line with the FOCUS vehicle. During each pass, concurrent LLSS and side-scan data were collected using GeoDAS and EdgeTech 4200 software, respectively, and both the vessel track and FOCUS track were recorded using Hypack 2010. The target altitude for the FOCUS vehicle was ~4 m above bottom. Although the target line was clearly visible in the side-scan return, the concurrent LLSS data only returned very limited imagery of the targets. These relatively negative results were attributed to a lack of suitable water clarity below 20 m depth. The calibration string was left in place overnight for use the following day.

Final Report LLSS for UXO Characterization
31
After a similar lack of success in obtaining usable LLSS data on the second day, the calibration string was re-deployed at a location at which transmissometer data indicated CSC values >3,000 approximately one meter above the bottom. Five successful passes were made over the second calibration line and moderate to good LLSS imagery was obtained for most targets. Individual shapes and the optical resolution chart could be clearly identified during each pass and were marked in the GeoDAS software. This data was deemed to be of sufficient quantity and quality to satisfy the goals of the calibration element. 5.5. DATA COLLECTION Electronic Data Acquisition. All data acquisition for the LLSS surveys was conducted as outlined in the Year 2 Demonstration Plan. Both vessel and ROTV positional information were ported to topside computers running HYPACK 2009a and GeoDAS software packages to acquire, log and process the various sensor data, as well as all associated GAPS-generated positions, towfish attitude and other metadata. The GeoDAS system was employed as the primary means for generating a helmsman display for steering the survey tracklines over each survey area. All LLSS and associated meta-data were logged in the OIC format by the GeoDAS software. GeoDAS also provided the means to view the LLSS imagery in real-time and in post-survey playback. The EdgeTech side scan sonar data was logged using EdgeTech Discover software. Data from various sensors were integrated into the GeoDAS software package based on the schedule of metadata inputs provided in Figure 5.5-1 and survey vessel specific offsets for the sensor tow point and GPS antenna location were provided to the software as described in Figure 5.5-2. During the Year 1 survey, a cellular phone based virtual reference station (VRS) component (capable of centimeter level accuracy) was integrated into the overall LLSS navigation system to provide real-time corrections to the digital GPS data used as the basis for the GAPS-generated LLSS positions. However, the GPS differential was found to continuously shift from corrected to uncorrected based on intermittent network coverage possibly caused by the Point Loma landmass blocking the signal as well as interference from the Mexican cellular network for certain orientations of the survey vessel. As a result, the VRS technology was not considered integral to the LLSS demonstration, especially since the same type of differential correction could be accomplished in post-processing, and thus this element was eliminated from the Year 2 operations.

Final Report LLSS for UXO Characterization
32
Figure 5.5-1. A screen shot from the GeoDAS SM-2000 interface showing the metadata inputs
used to integrate data from various sensors into the GeoDAS software.

Final Report LLSS for UXO Characterization
33
Figure 5.5-2. A screen shot from the GeoDAS SM-2000 interface showing vessel configuration
and GPS antenna offsets for the April 2010 survey. 5.6. VALIDATION Proposed Methodology. Following the completion of the calibration element, validation testing was to be conducted at the same location to evaluate the functionality of the LLSS as a UXO detection tool. The same target string used in the calibration study was to be deployed with the same UXO simulators and dummy targets reconfigured in a new order determined by deliberate random design prior to the cruise using a random number generator and otherwise unknown to the LLSS survey team. The FOCUS and LLSS was then to make multiple passes over the target line to evaluate the ability of the LLSS to accurately detect the presence of targets (detection frequency) and discriminate the UXO simulators from dummy objects (discrimination success). Deployment and recovery of the targets would be accomplished using methodology similar to that outlined above for the calibration element. Each of the UXO target simulators (S1-S9) and dummy objects (D1-D11) would be assigned a position along the target line (P1-P20) as

Final Report LLSS for UXO Characterization
34
predetermined by a random number generator. The final configuration would be recorded and archived by the SPAWAR Project Manager (PM) until post-processing was complete. Several survey passes with the LLSS would then be performed over the validation line in order to fully investigate the test site with the intent of detecting and identifying all of the placed targets as well as creating a mosaic of the LLSS imagery. Preliminary estimates suggested that up to three validation lines could be accomplished per day, and that the test design may be implemented for up to three survey areas throughout a survey week, under ideal environmental conditions and with the LLSS operating at full capacity. Samples of the field logs developed for validation activities are provided in Appendix C (Forms LLSS-03, LLSS-06, LLSS-08). The primary goal of the proposed validation element was to provide a rigorous prove-out of the LLSS system’s ability to positively detect and identify blind targets. To achieve this goal, the survey team was to attempt make every effort to maximize the number of blind targets encountered within the time constraints of the project to improve the statistical significance of evaluating the positive detection and false alarm frequencies. Accordingly, once the survey of the first validation line was complete, resources would be devoted to the deployment and survey of additional validation lines to the extent possible during the survey day. For each subsequent validation line, the targets would again be randomly reconfigured and deployed to offer the LLSS a new blind target field to test detection and discrimination ability. This approach was selected as a method of increasing the number of potential detection chances from which to draw statistically-valid conclusions regarding the efficiency of system operation and efficacy in UXO detection. Should sufficient time and resources remain available, the project team planned to further evaluate LLSS performance by providing divers to assist with modifying the orientation of some of the targets relative to the sediment-water interface, as well as to partially bury several targets at the sediment surface. This testing would be completed as a modification of an existing validation run. The resulting data would then be used as a qualitative means to evaluate the performance of the LLSS relative to situations likely to occur during open water, hard target UXO searches. Actual Accomplishments – Year 1. As described in the Year 1 Cruise Report (Appendix E), foul weather and the associated lack of visibility in the water column (confirmed by divers to be < 1 ft) prevented further LLSS data acquisition after the initial calibration element was conducted as described above. Thus the validation element could not be accomplished as planned during the Year 1 demonstration; the overall usable data relevant to project goals collected during the Year 1 demonstration was limited to two passes made over the calibration target string during day two of operations, which in turn did allow for an assessment of the majority (10 of 13) of the performance objectives defined for the project (see Section 3.0). Out of these 13 metrics, 7 (depth station keeping, line station keeping, data processing, target analysis, survey production rates, UXO parameter estimates, survey coverage) could be addressed with post-survey processing of the LLSS data and an additional 3 (ease of use, system reliability and maintenance) could be addressed from the shipboard logs. However, all of the blind testing objectives (probability of surrogate target detection, probability of false alarm, target location accuracies) could not be evaluated without completion of the validation element.

Final Report LLSS for UXO Characterization
35
Actual Accomplishments – Year 2. The validation element of the LLSS demonstration was completed during the Year 2 survey and is described in the Year 2 Cruise Report (Appendix F). After collecting additional calibration data on the second full survey day, the target string was recovered and redeployed in Boat Lanes 7-10 with the targets in a different order to be used for validation testing; the Boat Lanes were used for the validation element because the planned access to SCIRC was not permitted. The “blind” target arrangement was determined by the deck team selecting one of 40 pre-printed validation sheets at random from the field binder and attaching the targets to the main line in the indicated order as predetermined by a random number generator. Positions were recorded for the beginning (Danforth anchor) and end (lead clump) of the line based on the vessel DGPS and the final target order was retained by the SPAWAR PM. This sheet was not transferred to the data acquisition team until after final “blind” target identifications were made in post-processing. During the deployment, the final target in the array (UXO simulator S5) became detached from the target line during deployment. This incident caused a hang-up in the final line deployment which required use of the tender vessel to repair. Lost target S5 was ultimately replaced with backup target X3. Once the validation string was successfully in place, the the FOCUS vehicle was deployed for data acquisition after sunset; night operations were proposed as an option in the Year 2 Demonstration Plan depending on available vessel time. Two successful passes were made over the first validation string and good LLSS imagery was obtained for most targets. The marked improvement in LLSS data quality at this time as compared to the same area earlier in the day was attributed to a lack of ambient light interfering with the laser return, which is a known limitation of the system (see Section 2.3). Because of vessel time limitations, the validation string was left in place overnight for use the following day. Upon arriving at the site on the third full survey day, additional passes were made over the validation string but no successful LLSS imagery was obtained; this lack of success was attributed to high levels of ambient light in the water column during the morning hours. The target string was then recovered and redeployed at a different area within Boat Lanes 7-10 with the targets in a different random order selected by the deck team following the same procedure described above. Once again the final target order was retained by the SPAWAR PM and remained unknown to the data acquisition team. The new area was selected based on the results of the transmissometer data that was collected on the previous day, with priority given to areas where transmissometer CSCs were >3,000 within one meter of the bottom. At this time, IXSEA transponder beacons were also attached to the beginning and end of the line at the anchor chain and clump, respectively, to provide precise positions for these points using the GAPS navigation. The use of the transponder beacons in this manner was not established in the Year 2 Demonstration Plan, but was implemented in the field to provide data that would serve as known points of comparison for LLSS positioning data (i.e., accuracy evaluation). Transponder beacons attached directly to the target string replaced the act of divers swimming the beacons to specific targets that was employed in the Year 1 survey. Four passes were made over the second validation line during the middle of the day and once again no successful LLSS imagery was obtained due to unacceptable water clarity conditions. A muddy bottom with high turbidity was suspected based on residual sediment observed on the targets and measured transmissometer data. Side-scan data showing the entire target line were

Final Report LLSS for UXO Characterization
36
collected concurrently and, although no target images were available, this data coupled with the FOCUS navigation path showed that the LLSS system was on track such that resulting data could be used to analyze some quantitative system metrics such as depth station keeping, line station keeping, etc. if necessary. The target string was redeployed at a third area coinciding with transmissometer station 2 (transmissometer CSC = 2,725 1-m off bottom), this time running perpendicular to the shoreline. Once again, the IXSEA transponder beacons were attached to each end of the target line, but following deployment only one could be located by the sub-sea navigation system; the belief was t hat the other was likely wedged beneath the line and not standing upright in the water column. By the time the target line turnaround was complete, the sun had fully set and shipboard operations were taking place in the absence of ambient light. Four successful passes were made over the third validation line and excellent LLSS data were obtained. High resolution images of the individual targets were clearly evident in the real-time return and a distinct transition between muddy bottom and hard bottom could be seen along the length of target string; this transition was confirmed in the concurrent side-scan data. The final pass was made with the FOCUS vehicle at a high altitude (~25 ft) to assess the upper limit at which LLSS data could be obtained in these water conditions. Vessel time limitations required that survey operations be ended following this activity. Details of the day-by-day acquisition of quality LLSS data for the validation element are provided in Section 6.2.

Final Report LLSS for UXO Characterization
37
6.0. DATA ANALYSIS AND PRODUCTS The total usable LLSS image data collected during the demonstration surveys consisted of two passes over a single calibration string in Year 1 as well as five passes over one calibration string and six passes over two validation strings in Year 2. As discussed in Section 5, all target strings contained 22 attached targets (1 Danforth anchor, 1 electronic image resolution chart [eye chart], 9 UXO simulators, 11 dummy objects; Appendix B) spaced approximately 75 ft apart and configured in different orders depending on calibration string versus validation string. Target UXO simulators were inert objects matching the size, shape and coloring of actual military ordnance. Similarly-sized dummy objects (steel pipe of varying lengths, diameters, and physical condition) were placed on the same string to allow for the assessment of the ability to discriminate true UXO targets (ordnance) from dummy objects (non-ordnance) based on morphometry (shape) and reflective data (coatings, lettering). Data collected by the LLSS was recorded with GeoDAS seafloor imaging/data management software customized to accommodate the SM-2000 LLSS. In terms of overall analysis of the LLSS technology, three main parameters were selected on which to base the performance evaluation: (1) image quality, (2) target morphometry, and (3) target positioning. Image quality refers to the relative success of the LLSS and various software applications to produce images that allow for the shape, condition and specific identity of various targets to be clearly identified. Because image quality and the resulting target identification is also analogous to system validation; there are both qualitative (Section 6.2) and quantitative (Section 6.4) evaluations of this parameter. Target morphometry refers to the ability of the LLSS to accurately determine the dimensions (i.e., length, width) of targets identified in the digital images compared to the known dimensions of these same targets. Finally, target positioning refers to the ability of the LLSS to accurately determine the specific horizontal position (i.e., latitude, longitude and/or northing, easting) of targets identified in the digital images compared to the known positions as determined from GPS beacons (accuracy), as well as to show good repeatability in these positions during target reacquisition over multiple passes (precision). The target morphometry and target positioning parameters are discussed in Section 6.3.1 and Section 6.3.2, respectively. In addition to the data analysis objectives determined during the planning phase, water clarity was also identified during the demonstration surveys as an integral parameter affecting LLSS performance. Therefore the transmissometer data collected during the Year 2 survey were included in the data analysis process and used to quantify the level of water clarity needed to produce successful LLSS images. The water clarity requirements for the LLSS as determined from the survey data are discussed in Section 6.3.3. 6.1. PREPROCESSING The purpose of this section is to indicate the steps that were involved in transforming the raw data streams to the data products that were ultimately be used for final analysis. During the data acquisition process, all LLSS image, geolocation and sensor data were merged simultaneously

Final Report LLSS for UXO Characterization
38
using the GeoDAS software. Corrections for sensor layback, altitude above the seafloor and aperture opening were made through settings input into the GeoDAS display prior to the start of data acquisition. Following acquisition, all LLSS files were named with a unique moniker consisting of specific identification codes for survey year (ESTCP1 = Year 1, ESTCP2 = Year 2), general area (SDB = San Diego Bay), specific area (BL = Boat Lanes) and target order (01 = first target arrangement for that survey; incremented sequentially independent of calibration versus validation strings). Multiple passes over the same target string were indicated with a letter (A = Pass 1). For example, the file name for the first pass over the first calibration string of the Year 2 survey was ESTCP2-SDB-BL-01A; the file name for the second pass over the first validation string (third overall target string deployed) was ESTCP2-SDB-BL-03B. At the end of each survey day, all LLSS data collected that day were reviewed (i.e., played back) with the GeoDAS software to develop a general estimate of the number of targets successfully imaged. These files were then saved to a dedicated portable hard drive (in addition to the main data acquisition computer). The corresponding Hypack and side-scan sonar files for these passes were named in the same manner described above and backed up daily to compact disc. 6.2. TARGET SELECTION FOR DETECTION The purpose of this section is to discuss how targets were selected from the preprocessed LLSS data for further image analysis and to describe the final image results. Different sub-sections are provided to describe the image identification process (i.e., how a target of interest was identified in the GeoDAS display), image acquisition summary (i.e., how many successful images were collected during the Year 1 and Year 2 surveys), image post-processing (i.e., what additional steps were taken to enhance LLSS images beyond what resulted from the real-time GeoDAS display), and overall image quality (i.e., what processing steps provided the best LLSS image quality for each pass). No specific “dig list” was produced for this LLSS demonstration because all targets were placed by the project team at known locations, thus random discovery of objects in the environment to be targeted for reacquisition was not relevant. Sample images obtained during the LLSS surveys and processed via various software techniques are provided in the following figures. The complete final data products (i.e., image sets) for both the Year 1 and Year 2 surveys are provided in Appendix G. Image Identification Process. The GeoDAS Target View dialog box (Figure 6.2-1) was used for initial target selection and characterization. This software feature allowed targets to be marked, measured and classified, which facilitated the down selection of target images and associated size and positioning information for further analysis. When using the Target View dialog box, targets are first selected from the GeoDAS waterfall (central image panel in the figure) by either double clicking at the center of the feature of interest to select a standard area (as was done in the example provided) or using the computer mouse to drag a rectangular polygon around the feature. The selected target then opens in a separate

Final Report LLSS for UXO Characterization
39
image panel which allows the analyst to measure and record target position, length, width and height (by shadow measurement), as well as supply target characterization comments. In addition, a separate “ping panel” displays information about each individual scan line of LLSS data (i.e., ping) for the selected target. This information includes heading (the angle of sensor motion compared to true north), course (the angle of sensor intended path compared to true north), pitch (the forward/backward rotation about the lateral axis) and roll (the left/right rotation about the longitudinal axis) of the FOCUS vehicle as determined by GAPS. The “properties panel” displays the current number of pings, image resolution and image position to allow the analyst the abililty to determine target scale. The Target View dialog box also provides options to save the target image to local storage and/or print the target image to a network printer. The “thumb button” allows the analyst to view thumbnail images of all the targets selected and saved for the current project, which may refer to one transect, one day, or one cruise depending on how the operator has configured the settings. Within GeoDAS, a “project” is defined as a database of files associated with a particular imaging event that includes the settings for both the navigation link and the laser as well as target thumbnail images and the target details. The “load” button then allows for the viewing of targets that appear in the thumbnail images for the current project. Right-clicking in the image panel accesses the zoom and image properties menus which allows the analyst to adjust magnification and the image color map as well as possible access to additional image processing utilities (e.g., OIC Image, a separate software application) While Target View is able to mark and characterize targets in real-time, the close spacing of targets along the target string and the speed at which the LLSS was traveling made it difficult to process every target completely before the next target would enter the field of view. Therefore target selection and characterization was also performed post-survey by replaying the LLSS data with the GeoDAS SM-2000 interface. Furthermore, analysis of the LLSS data from the Year 1 survey identified a software coding error in the GeoDAS SM-2000 Interface that affected target measurement functions within the Target View dialog box. The error manifested itself as an inability to collect length and width measurements from the LLSS data for objects falling directly below the sensor (i.e., in the swath nadir as opposed to the outer swath width). Consultation with the OIC software development team resulted in a patch for the program that corrected this error for the Year 2 survey.

Final Report LLSS for UXO Characterization
40
Figure 6.2-1. A screen shot from the GeoDAS SM-2000 interface showing the characterization
of target 14 from Pass 1 in the Target View dialog. Image Acquisition Summary – Year 1. A summary of the LLSS images acquired during the Year 1 survey is provided in Table 6.2-1. Overall, the Year 1 effort successfully imaged 21 out of the 22 potential targets during each of two passes over the calibration string. On the first pass, quality laser images were collected for all 9 simulated UXO objects, 10 out of 11 dummy objects, the eye chart and the Danforth anchor. The target string went outside of the field of view of the LLSS after passing dummy object D08, but the FOCUS pilot was able to reacquire the transect before passing dummy object D06; thus dummy object D07 was not imaged during Pass 1. The second pass over the calibration string proceeded in the opposite direction and captured quality laser images for all 9 simulated UXO objects, all 11 dummy objects and the eye chart. The target string left the field of view of the LLSS prior to passing over the Danforth anchor. Twenty out of the 21 targets imaged during Pass 2 were readily identifiable upon survey playback; simulated UXO S08 (Target #9 in Figure 6.2-3) was the exception. While simulated UXO S08 was clearly imaged during Pass 1 (Target #13 in Figure 6.2-2), it was difficult to find

Final Report LLSS for UXO Characterization
41
during Pass 2 and ultimately was acquired based on survey speed and known target spacing along the transect. Targets were readily identifiable upon survey playback and screen shots from the GeoDAS waterfall for each target in the order of acquisition during Pass 1 and Pass 2 are found in Figure 6.2-2 and Figure 6.2-3, respectively. It should be noted that these images represent raw data collected in real-time and are not presented at full resolution nor are geometrically rectified via post-processing. Processed images from Year 1 are discussed in the following subsections and presented in Figure 6.2-8 below. One factor potentially affecting image quality for multiple images during Year 1 may have involved oversaturation of the laser receiver, exhibited as blacked out areas in the object (e.g., Target #12 and Target #16 in Figure 6.2-3). Light energy reflected by bottom features is captured by the LLSS after passing through an adjustable aperture. The size of the aperture is dynamically controlled by the altitude of the sensor in order to put the aperture opening at an angle to let the light reflected off the bottom to pass through and hit PMT. In general, the aperture is opened wider for a large depth of field and tightened for a shallow depth of field. This action allows only the required light to reach the PMT and excludes extraneous light from outside sources or undesired backscatter. However, for isolated targets the aperture response time is insufficient such that removing this artifact is problematic.
Table 6.2-1. Summary of LLSS images acquired during the Year 1 survey.
Date Target Line Description
LLSS Pass ID
Total Targets Imaged
Target Descriptions
04/20/2010 Calibration Line 2 Pass 1 21 9 UXO simulators, 10 dummy objects, eye chart, Danforth anchor
04/20/2010 Calibration Line 2 Pass 2 21 9 UXO simulators, 11 dummy objects, eye chart
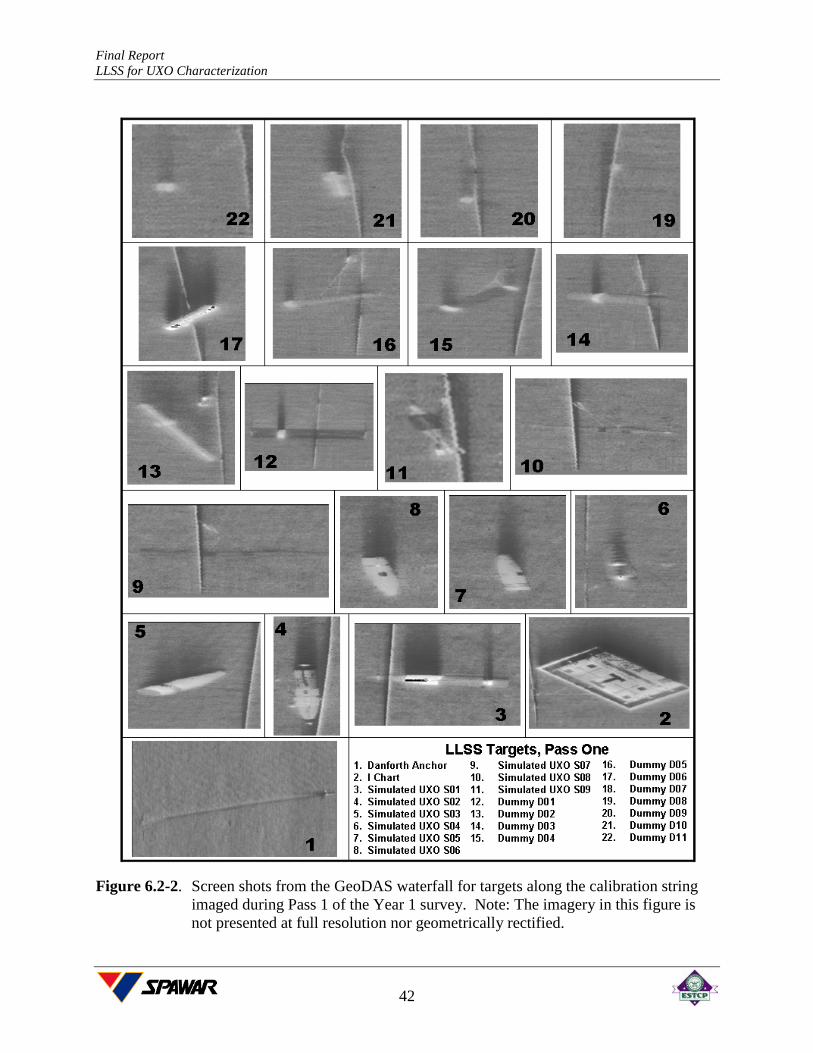
Final Report LLSS for UXO Characterization
42
Figure 6.2-2. Screen shots from the GeoDAS waterfall for targets along the calibration string
imaged during Pass 1 of the Year 1 survey. Note: The imagery in this figure is not presented at full resolution nor geometrically rectified.

Final Report LLSS for UXO Characterization
43
Figure 6.2-3. Screen shots from the GeoDAS waterfall for targets along the calibration string
imaged during Pass 2 of the Year 1 survey. Note: The imagery in this figure is not presented at full resolution.
Image Acquisition Summary – Year 2. A summary of the LLSS images acquired during the Year 2 survey is provided in Table 6.2-2. Overall, the Year 2 survey collected LLSS images

Final Report LLSS for UXO Characterization
44
from seven passes over two separate calibration strings and six passes over two separate validation strings. The specific nature of the objects in one or more of these passes was unidentifiable (i.e., just a general outline was visible) due to reduced water quality, thus preventing quantification of the exact number of UXO simulators versus the number of dummy objects seen in the same detailed manner for every pass as was done for the Year 1 data above. Similarly, detailed descriptions of the trackline positions for each pass (i.e., when the target line passed out of the field of view) could not be generated because of the absence of images for substantial portions of these passes.
Table 6.2-2. Summary of LLSS images acquired during the Year 2 survey.
Date Target Line Description
LLSS Pass ID
Total Targets Imaged
Target Descriptions
09/28/2010 Calibration Line 1 BL01C 2 1 UXO simulator, 1 unidentifiable target
09/28/2010 Calibration Line 1 BL01D 3 1 UXO simulator, 1 dummy object, 1 unidentifiable target
09/28/2010 Calibration Line 2 BL02A 16 5 UXO simulators, 6 dummy objects, 4 unidentifiable targets, eye chart
09/28/2010 Calibration Line 2 BL02B 16 4 UXO simulators, 9 dummy objects,1 unidentifiable target, eye chart, end weight
09/28/2010 Calibration Line 2 BL02C 5 2 UXO simulators, 1 dummy object, 2 unidentifiable targets
09/28/2010 Calibration Line 2 BL02D 1 1 UXO simulator
09/28/2010 Calibration Line 2 BL02E 15 4 UXO simulators, 6 dummy objects, 4 unidentifiable targets, eye chart
09/28/2010 Validation Line 1 BL03A 8 2 UXO simulators, 4 dummy objects, 1 unidentifiable target, end weight
09/28/2010 Validation Line 1 BL03B 10 3 UXO simulators, 3 dummy objects, 4 unidentifiable targets
09/29/2010 Validation Line 3 BL05A 10 4 UXO simulators, 5 dummy objects, end weight w/ IXSEA beacon
09/29/2010 Validation Line 3 BL05B 11 3 UXO simulators, 7 dummy objects, 1 unidentifiable target
09/29/2010 Validation Line 3 BL05C 8 3 UXO simulators, 4 dummy objects, end weight w/ IXSEA beacon
09/29/2010 Validation Line 3 BL05D 10 4 UXO simulators, 5 dummy objects , 1 unidentifiable target
Also in contrast to the Year 1 images, all targets observed in the Year 2 dataset were initially identified upon playback with CleanSweep2 software rather than the GeoDAS waterfall display. This alternative procedure was adopted in order to evaluate the relative advantages and/or disadvantages of using CleanSweep2 as the initial image identification tool rather than entirely for post-processing of images originally identified using GeoDAS (to be discussed in the following sub-section). Target images for the best (or only) pass over Calibration Line 1, Calibration Line 2, Validation Line 1 and Validation Line 3 obtained from the CleanSweep2 software are provided in

Final Report LLSS for UXO Characterization
45
Figure 6.2-4, Figure 6.2-5, Figure 6.2-6, Figure 6.2-7, respectively. A complete library of CleanSweep2 images from all passes is provided in Appendix G.
Figure 6.2-4. Screen shots from CleanSweep2 for targets along Calibration Line 1 imaged
during Pass BL01D of the Year 2 survey.

Final Report LLSS for UXO Characterization
46
Figure 6.2-5. Screen shots from CleanSweep2 for targets along Calibration Line 2 imaged
during Pass BL02B of the Year 2 survey.

Final Report LLSS for UXO Characterization
47
Figure 6.2-6. Screen shots from CleanSweep2 for targets along Validation Line 1 imaged
during Pass BL03B of the Year 2 survey.

Final Report LLSS for UXO Characterization
48
Figure 6.2-7. Screen shots from CleanSweep2 for targets along Validation Line 2 imaged
during Pass BL05C of the Year 2 survey. Image Post-Processing. Following preliminary data analysis, two select target images from the Year 1 GeoDAS display were post-processed using CleanSweep2 software. CleanSweep2 allows the raw LLSS data acquired by GeoDAS to be improved through application of a variety

Final Report LLSS for UXO Characterization
49
of gains and filters that minimize errors from vessel movement and sediment in the water column. The software then creates a visual rendering of the data that is better representative of actual length/width proportions and is suitable for sizing of objects on the seafloor. In addition, CleanSweep2 geographically rectifies the image and exports the visual data to the project file. A comparison of the raw GeoDAS images and the corresponding post-processed CleanSweep2 images for two LLSS targets from the Year 1 data is shown in Figure 6.2-8. The processed images were manually cleaned and filtered to improve image quality and provide higher resolution than was originally available in GeoDAS, but were not geographically rectified in this particular CleanSweep2 display. All quality Year 2 target images from the LLSS display were post-processed using CleanSweep2. As described above, this post-processing step was used as the primary tool for identifying images in the raw LLSS data playback. A comparison of the raw GeoDAS images and the corresponding post-processed CleanSweep2 images for LLSS targets from the best Year 2 data (Pass BL05C) is shown in Figure 6.2-9. According to these side-by-side comparisons, the CleanSweep2 images for the Year 1 data (Figure 6.2-8) showed dramatically improved resolution and horizontal proportionality (i.e., relative lengths and widths true to actual target size without any erroneous stretching or compression) when compared to the raw GeoDAS images. For Year 2 (Figure 6.2-9), the horizontal proportionality was relatively equal between CleanSweep2 and GeoDAS for all targets, thus confirming that the nadir measurement correction made to GeoDAS between surveys was beneficial to the final image display. Based entirely on objective observation, CleanSweep2 appeared to produce higher resolution for images 1-4, but GeoDAS appeared to produce higher resolution for images 5-8. The difference in resolution is particularly evident for image 5 (dummy object D1), where scratching and wear is clearly visible in the GeoDAS image but not visible in the CleanSweep2 image. Another difference between the two datasets was the notable absence of shadows in the CleanSweep2 images that were present in every corresponding GeoDAS image. All of the highest quality Year 2 target images (i.e., Pass BL05C) were also post-processed using an SAIC MS DOS based software tool that was developed specifically for this project to address some of the areas in which GeoDAS and CleanSweep2 capabilities were found to be lacking during Year 1. These shortcomings included the following:
• Limitations due to the file format. LLSS data and metadata collected by GeoDAS are stored in the “.OIC” file format, which can only be read by OIC software products including GeoDAS and CleanSweep2. These programs do not allow the user to view the raw LLSS data and metadata in tabular form for QC or calculation of survey statistics specific to the current project. Due to the proprietary nature of the software, there are no commercially available products that provide this functionality.
• Limitations in the ability to smooth, edit and replace ancillary survey data. The smoothing, de-spiking and manual editing functions of CleanSweep2 are not available for all parameters. For example, these functions cannot be performed within CleanSweep2 for FOCUS altitude data. Editing such data requires the rental or purchase of additional software products designed specifically for this purpose.

Final Report LLSS for UXO Characterization
50
• Limitations associated with the capture of target images. It is not possible to extract and save LLSS target images as they appear in the GeoDAS or CleanSweep2 waterfall display at the full resolution. Instead, the target images produced by these programs are essentially “screen grabs” and do not represent the full visual potential of the LLSS results.
• Limitations associated with file size and data extraction. LLSS data files are large, typically ranging from 250 to 500 MB for the Year 2 survey. In order to trim a .OIC file while maintaining the integrity of the file format, the user must replay and re-record the data in GeoDAS, which is a very time consuming process.
The SAIC software tools allow for the extraction, manipulation and visualization of LLSS data and metadata that was previously stored in the proprietary .OIC format, thus providing additional functionality that is not available within the current versions of the GeoDAS and CleanSweep2 packages. This added functionality includes provisions to accomplish the following:
• Extract and tabulate metadata information from .OIC data files;
• Edit metadata information directly and generate a new .OIC file which incorporates the changes made;
• Average pertinent survey data over a specified time period;
• Extract a specified segment from a .OIC file (i.e., a discrete series of individual line scans), scale the LLSS data by altitude and tow speed over that segment, and produce an image of the extracted data at full resolution; and
• Trim a .OIC file to a given range of individual scans while maintaining the integrity of the file format.
The final images from Pass BL05C post-processed using the SAIC software tool are also shown in comparison to the corresponding raw GeoDAS and post-processed CleanSweep2 images in Figure 6.2-9. According to this side-by-side comparison, the SAIC software produced images comparable to both the GeoDAS and CleanSweep2 displays. The SAIC software was able to achieve image resolution equal to the other platforms as evidenced by the level of detail in the markings visible on image 3 and the sharpness of the banding visible on images 6 and 7. However, there were some slight differences in horizontal proportionality and object rotation between the SAIC and the GeoDAS/CleanSweep2 results, particularly for images 2, 4 and 6; in these cases the GeoDAS/CleanSweep2 images were better representative of actual dimensions. Similar to CleanSweep2, the SAIC software also eliminated the shadows that persisted in the corresponding GeoDAS images for each target.

Final Report LLSS for UXO Characterization
51
Figure 6.2-8. Comparison of the raw GeoDAS images (left) and the post-processed
CleanSweep2 images (right) for UXO simulator S02 and the optical resolution chart from the Year 1 data. Note: The yellow lines on the CleanSweep2 images represent the software drawing tool for sizing purposes.

Final Report LLSS for UXO Characterization
52
Figure 6.2-9. Comparison of the raw GeoDAS images and the post-processed CleanSweep2 and
SAIC software images for all targets identified in Pass BL05C from Year 2.

Final Report LLSS for UXO Characterization
53
Figure 6.2-9. Continued. Overall Image Quality. A side-by-side comparison of the results from the three LLSS image software platforms (GeoDAS, CleanSweep2, SAIC) show various differences in final image

Final Report LLSS for UXO Characterization
54
quality as discussed above. For the identification of targets with unique shapes and obvious features, such as the banding on UXO simulator S04 or the curved shape of dummy object X03 (see Figure 6.2-9), these differences are generally minor and images from any of the three software platforms could be used to identify the target. For targets with a more generic shape, such as dummy object D01 and dummy object D05 (see Figure 6.2-9), however, differences in horizontal proportionality and object rotation could have a significant impact on distinguishing one item from another. To that end, The images produced by the SAIC software were considered adequate representations of the targets. In fact, the positive blind testing identifications for dummy objects D01 and D06 (discussed in Section 6.4) were based almost entirely on the SAIC software images. However, it is clear that additional processing with GeoDAS and/or CleanSweep2 may produce a more “life-like” image that in some situations could aid in the discrimination and otherwise improve decision making based on the specific type of UXO present. Such a situation may occur if live fire was used for certain munitions types while only inert simulators were used for other munitions types. The relative success of the various software applications in determining other properties such as target sizing and target positioning are discussed in the following sections. Altitude Effects on LLSS Performance. With regard to marine survey operations, the term “altitude” refers to height of a sensor off the seafloor as it actively collects data. In order to evaluate the effects of altitude on LLSS performance, the final pass over Validation Line 3 during the Year 2 survey (BL05D) was conducted at a relatively high altitude (~6 m) compared to the standard altitude used during the three previous passes (~4 m). The resulting images and coverage metrics are provided in Figure 6.2-10. When both the low altitude LLSS results for Pass BL05C and the high altitude LLSS results for Pass BL05D are mosaiced at 6 cm resolution for the same portion of the target string, the swath width (i.e., lateral coverage by the sensor perpendicular to direction of travel) increases from 5.7 m to 8.8 m with the approximately 2 m increase in sensor altitude. Consequently, the survey coverage rate increases from 3.1 ha/hr to 4.8 ha/hr, an approximately 50% increase when using the higher altitude. In terms of image quality, the comparative mosaics indicate that the presence of targets and their generic properties (e.g., general shape, orientation) can be observed at both low and high altitude. However, image quality from the CleanSweep2 display was found to be vastly improved at the lower altitude (Figure 6.2-10). The given examples for UXO simulator S2 (107 mm rocket) and dummy object D1 (165 mm pipe) show much greater resolution where unique banding and outlining are visible at low altitude but the same properties are muted or shadowed at high altitude. In conclusion, surveys conducted at high altitude (~6 m) allow for a substantially increased coverage rate and are thus acceptable for identifying the presence/absence of targets in the data return. Surveys conducted at low altitude (~4 m) are more beneficial for specific target identification.

Final Report LLSS for UXO Characterization
55
Figure 6.2-10. Comparison of LLSS target image and seafloor mosaic results for two passes
over Validation Line 3 conducted at different sensor altitudes. 6.3. PARAMETER ESTIMATES The purpose of this section is to discuss the algorithms that were used to estimate target parameters such as morphometry and positioning from the LLSS data as well as the water clarity requirements that were determined to be necessary for optimal performance of the LLSS. In terms of morphometry and positioning, post-survey data analysis involved the review of LLSS images collected during the most successful passes over calibration and validation target strings from both Year 1 and Year 2 and comparison of these results with known target characteristic and positioning information. In terms of water clarity requirements, transmissometer data collected during the Year 2 survey were correlated to the relative success of the LLSS in producing quality images at corresponding locations. The methodology for evaluating each of these parameters and the general results are provided in the following sub-sections. The target characterization data was also used to assess the performance objectives specifically related to UXO parameter estimates and target location accuracies as follows:
• Target length and width measurements calculated from the LLSS data were compared with actual target dimensions to determine the accuracy of UXO parameter estimates.

Final Report LLSS for UXO Characterization
56
• Target length and width measurements calculated from the LLSS for the same target across multiple survey passes were compared to determine the precision of UXO size-related parameter estimates.
• The accuracy of target locations was determined by comparing the horizontal positions for each target derived from the LLSS display with the “true” target positions obtained by acoustic pinger where available.
• The precision of target locations was determined by comparing the horizontal positions for each target as derived from the LLSS display for one pass with the horizontal positions for the same target as derived from the LLSS display for replicate passes over the same target string.
• Altitude data for each pass over the target strings was also extracted from the ancillary survey data and compared to target altitudes to assess the success of the LLSS in depth station keeping.
Specific quantitative results for each of these size and positioning performance objectives, as well as all other non-related performance objectives, are provided in Section 7.0. 6.3.1. Target Morphometry Year 1. As described in Section 6.2, initial attempts to obtain target dimensions from the Year 1 LLSS data identified a coding error in GeoDAS that affected the program’s target measurement functions; a software patch was required from the software vendor to correct this error before any valid target measurements could be generated from the data playback. The dimensions ultimately obtained with the patched version of GeoDAS Target View for objects imaged during Passes 1 and 2 over the Year 1 calibration string are provided in Table 6.3-1. Due to low image resolution, length measurements for target D11 in Pass 1 and both length and width measurements for target S08 in Pass 2 were not possible. Table 6.3-1. Actual and calculated dimensions for targets during the Year 1 survey.
Dimensions Calculated by GeoDAS Actual Dimensions LLSS Pass 1 LLSS Pass 2
Target ID Width (cm)
Length (cm)
Width (cm)
Length (cm)
Width (cm)
Length (cm)
D01 16.5 86.4 16.6 163.7 19.4 204.6 D02 10.2 76.2 15.8 93.7 19.6 82.8 D03 16.5 59.1 16.9 132.7 17.8 143.6 D04 11.4 62.2 16.9 99.6 27.3 63.2 D05 10.2 55.2 13.1 114.6 9.0 128.5 D06 12.7 40.6 14.3 65.3 15.4 86.7 D07 7.3 79.4 N/A N/A 18.0 87.4 D08 3.5 56.2 7.4 38.7 9.1 65.9 D09 5.7 30.5 5.3 44.1 6.6 70.6 D10 10.2 25.1 15.1 28.0 15.2 26.4 D11 5.7 15.2 13.6 N/A 14.3 25.1

Final Report LLSS for UXO Characterization
57
Dimensions Calculated by GeoDAS Actual Dimensions LLSS Pass 1 LLSS Pass 2
Target ID Width (cm)
Length (cm)
Width (cm)
Length (cm)
Width (cm)
Length (cm)
S01 15.5 83.8 20.6 187.9 8.7 196.1 S02 10.7 81.3 23.9 84.9 27.3 80.4 S03 16.0 58.4 24.4 88.7 37.7 37.1 S04 15.2 61.0 27.4 55.3 27.2 78.7 S05 14.7 55.9 27.3 54.7 22.9 75.0 S06 14.2 45.7 25.1 49.0 23.5 51.2 S07 6.1 86.4 6.8 176.4 5.6 125.8 S08 7.1 66.0 7.3 141.8 N/A N/A S09 6.1 35.6 15.1 39.6 17.7 36.7 Eye Chart 91.4 147.3 157.4 244.0 165.7 189.8
The data quality objective (DQO) for target measurement was for the calculated dimensions (length, width) for a particular target to be within +/-5 cm of the actual dimensions. Initially, only fifteen out of the possible 37 (41%) dimension measurements for Pass 1 and 10 out of the possible 38 (26%) dimension measurements for Pass 2 met this data quality objective. However, when length and width measurements were sorted by their orientation to the survey track and plotted against actual values, a distinct pattern to the measurement error was observed for the two passes (i.e., replicates) as shown in Figure 6.3-1. The LLSS measurements that were made along the survey track (parallel to the direction of travel) showed good correlation to actual measurements (slope = 0.93 and 1.00, r2 = 0.94 and 0.92), with image measurements being on average 7% less than actual. Hence the long track accuracy was within 5 cm for any target shorter than 70 cm (7% of 70 cm = 5 cm). In contrast, measurements that were made across the survey track (perpendicular to the direction of travel) were approximately twice the actual values (slope = 2.11 and 2.37, r2 = 0.98 and 1.00). This discrepancy was ultimately related to an error in sensor altitude applied to the magnification of LLSS imagery during collection, which caused a “stretch” effect seen in some of the perpendicular images (e.g., Target #12, Figure 6.2-3).

Final Report LLSS for UXO Characterization
58
(a) Pass 1 y = 2.11x - 2.53R2 = 0.98
y = 0.93x + 1.87R2 = 0.94
0
20
40
60
80
100
120
140
160
180
200
0 20 40 60 80 100
Actual Measurement (cm)
Geo
DA
S M
easu
rem
ent (
cm)
Along Track DimensionAcross Track Dimension
(b) Pass 2
y = 1.00x + 0.86R2 = 0.92
y = 2.37x - 1.16R2 = 1.00
0
50
100
150
200
250
0 20 40 60 80 100
Actual Measurement (cm)
Geo
DA
S M
easu
rem
ent (
cm)
Along Track DimensionAcross Track Dimension
Figure 6.3-1. Influence of target orientation on GeoDAS target measurements for (a) Pass 1 and
(b) Pass 2 over the Year 1 calibration string. The source of the error was detected through a comparison of altitude measurements collected by the FOCUS altimeter and those derived from side-scan first return data. The side-scan sonar altitude (assumed to be correct) was found to be exactly one-half of the reported FOCUS altitude (assumed to be erroneous); this relationship is shown in Figure 6.3-2. The slope of 0.5 for this scatter plot was subsequently attributed to an error in the output range of the FOCUS altimeter, which was believed to have had an assigned output range scaled to 100 m for data analysis purposes but following the survey was discovered to have an actual output range scaled to 50 m. This offset explained the two-fold overestimation of cross-track dimensions (i.e., Pass 1 slope =

Final Report LLSS for UXO Characterization
59
2.11, Pass 2 slope = 2.37; Figure 6.3-1). When correcting these slopes by dividing by two (Pass 1 slope = 1.055, Pass 2 slope = 1.165) and applying the same logic as for the along-track measurements above, the LLSS measurements were found to be 5-16% less than actual measurements. Thus the across-track accuracy was at best within 5 cm for any target shorter than 33 cm (15% of 33 cm = 5 cm). The relationship between assigned output range and along-track versus across-track measurements was re-evaluated and confirmed in the Year 2 survey.
Figure 6.3-2. Relationship between altitude measurements from the FOCUS altimeter and the
side-scan sonar during the Year 1 survey. Year 2. The actual FOCUS altimeter output range was properly scaled to 100 m for the Year 2 survey, which removed the stretching effect on the target sizing function for cross-track dimensions. Of all the target images acquired during Year 2 (Table 6.2-2), only Pass BL05C (Validation Line 3) was selected for target measurement analysis as this pass produced the best quality images that allowed for definitive identification of the specific targets (i.e., measured dimensions could be compared to the corresponding actual dimensions for that object). The dimensions obtained from both the CleanSweep2 and GeoDAS playbacks for objects imaged on Pass BL05C over Validation Line 3 are provided in Table 6.3-2. Although CleanSweep2 was used as the primary software application for selecting target images from the raw LLSS dataset for Year 2, the GeoDAS playback was found to exhibit better measurement capabilities with a stronger correlation between image dimensions and actual dimensions for these targets. When grouped together regardless of orientation relative to the survey track, the overall Year 2 length and width LLSS measurements showed good correlation to actual measurements (slope = 1.05; r2 = 0.97; Figure 6.3-3), with image measurements being on

Final Report LLSS for UXO Characterization
60
average 5% larger than actual. Thus the image measurement accuracy for Year 2 was within 5 cm for any target within the observed range (< 100 cm). Table 6.3-2. Actual and calculated dimensions for targets during the Year 2 survey.
Dimensions Calculated for Pass BL05C Actual Dimensions CleanSweep2 GeoDAS
Target ID Width (cm)
Length (cm)
Width (cm)
Length (cm)
Width (cm)
Length (cm)
D01 16.5 86.4 23.1 118.0 19.0 100.7 D05 10.2 55.2 16.6 71.6 10.9 54.7 D06 12.7 40.6 14.2 55.7 10.5 40.6 S02 10.7 81.3 18.7 76.8 11.0 71.5 S04 15.2 61.0 18.2 79.9 13.4 63.7 S06 14.2 45.7 14.9 56.3 11.7 53.8 X03 6.0 54.9 14.5 65.0 5.6 56.6 Avg. Diff. from Actual (Absolute Value) 10.1 3.4
Standard Deviation 8.2 4.3
Figure 6.3-3. GeoDAS measurements of known targets calculated for Pass BL05C during the
Year 2 validation effort. 6.3.2. Target Positioning As described in Section 2.1, the geodetic positioning (latitude, longitude and/or northing, easting) for the FOCUS vehicle and the resulting LLSS data was determined using an GAPS and PHINS system combining USBL, INS and GPS technologies in one integrated package. Only GAPS was used during the Year 1 survey, with PHINS being added in Year 2. The PHINS

Final Report LLSS for UXO Characterization
61
component was added for Year 2 to determine whether target positioning accuracy could improve from the Year 1 results. When evaluating the positioning capabilities of the LLSS, both accuracy and precision were considered in the overall assessment. In this case, accuracy refers to the position of the targets identified in the LLSS images compared to the known positions of the same targets as determined from GPS beacons placed on the targets themselves. In contrast, precision refers to repeatability of multiple positions for the same targets determined from multiple passes over the same target string. Theoretically, the LLSS precision can be evaluated for any number of targets placed on the seafloor and surveyed multiple times, but LLSS accuracy can only be evaluated for GPS beacons that have also been deployed. Year 1 - Precision. Geodetic positions (i.e., northing, easting) for each LLSS target identified during the two passes over the calibration line during the Year 1 survey were obtained from the GeoDAS playback and plotted in x,y format as shown in Figure 6.3-4; these positions should theoretically be identical assuming that the targets did not move between passes. However, the initial comparison between the Pass 1 position and the Pass 2 position for each target revealed poor precision for the two datasets (i.e., a noted line shift for Pass 2 to the south and east of Pass 1). While the main axis of the LLSS trackline (i.e., target string) coincided for both passes, the northwest/southeast offset was determined to be an average of 80.4 +/- 2.7 m for each individual target. Considering the repeatability (i.e., minimal variance) associated with this offset (coefficient of variation = 3.3%), the cause of the shift was assumed to be related to a consistent software parameter issue within the GAPS setup or incorrect specification of FOCUS cable out distance (~32 m) into the GeoDAS software. One possible error in the GAPS setup may have involved the user controllable parameter called Turn Around Time (TAT), which sets the time delay between the mobile transponder beacon receipt of an interrogation (i.e., ping) from the GAPS hydrophone and the transponder response to that interrogation. The TAT is programmed into both the mobile transponder and the navigation software that controls the GAPS system. This setting must be the same in both locations to allow the software to properly define the total elapsed time from when the system interrogated the transponder to when it received a response. If the TAT setting in the mobile transponder was longer than it was in the navigation software, the system would attribute more time than it should have to distance in the water, which would result in an overestimate in the distance (or layback) between the survey vessel and the sensor platform. The fact that the two passes were conducted over the same line in opposite directions would suggest results showing a consistent trackline but individual target positions offset by twice the layback error.

Final Report LLSS for UXO Characterization
62
3608400
3608500
3608600
3608700
3608800
3608900
3609000
482100 482150 482200 482250 482300 482350 482400 482450 482500
Nor
thin
g (U
TM Z
one
11, m
eter
s)
Easting (UTM Zone 11, meters)
LLSS Pass 1LLSS Pass 2D11
Danforth Anchor
S01
S03
S06S07
S05S04
S02
S08S09
D01D02
D03
D04D05
D06D07
D08
D09D10
D10D11
D09
D08
D06D05
D04
D03D02
D01
S09S08
S07S06
S05S04
S03
Eye ChartS01
S02
Eye Chart
Figure 6.3-4. Uncorrected target positions from two passes over the Year 1 calibration line as
determined from the GeoDAS software. In order to evaluate the precision of the LLSS in the absence of the TAT error, the constant offset was removed by shifting the Eye Chart starting position from Pass 2 to coincide with the Eye Chart position from Pass 1 and then shifting all subsequent Pass 2 target positions the same distance relative to that point. As shown in Figure 6.3-5, the Year 1 precision was greatly improved following this adjustment, with the average difference in target positions between the two passes reduced to 3.9 +/- 2.0 m. The average easting and northing errors were similar and relatively invariant at 2.79 +/- 1.6 m and 2.32 +/- 1.95 m, respectively. The conclusion was drawn that the TAT error was the source of the poor precision observed in the raw dataset and once corrected these results would not be repeated in the Year 2 survey. Year 1 – Accuracy. As part of the accuracy evaluation in Year 1, “true” horizontal positions were collected for three targets at one end of the calibration string by divers placing a second mobile transponder beacon (in addition to the one already mounted on the FOCUS) at each target and holding it in place until a fixed position could be received by the GAPS hydrophone head (see Section 5.4). The targets for which true positions were acquired included UXO simulator S1, the eye chart and the Danforth anchor; all three of these targets were imaged during Pass 1, but only S1 and the eye chart were imaged during Pass 2. When the “true” positions were plotted against the LLSS determined positions for these targets, the “true” positions were found to be approximately 40 m to the southwest of the LLSS determined position (Figure 6.3-5), thus suggesting extremely poor positional accuracy by the LLSS. However, when the concurrent side-scan data (with offset removed) was used to map the Danforth anchor position from both passes, the results were found to agree with the LLSS determined position (also with offset removed); the deviation in side-scan derived position from

Final Report LLSS for UXO Characterization
63
LLSS derived position for the Danforth anchor was 11 m for the vector, with 5 m and 17 m for the easting and northing components, respectively. Thus the diver determined “true” target positions were considered unreliable and likely affected by the same navigation system errors that produced the precision offset discussed above. The conclusion was drawn that once the TAT error described above was corrected, similar poor accuracy results would not be repeated in the Year 2 survey.
3608400
3608500
3608600
3608700
3608800
3608900
3609000
482100 482150 482200 482250 482300 482350 482400 482450 482500
Nor
thin
g (U
TM Z
one
11, m
eter
s)
Easting (UTM Zone 11, meters)
LLSS Pass 1LLSS Pass 2Diver Beacon
"I" Chart
S01
D11
Danforth Anchor
D01D02
D03
D07
D09D10
D08
D06D05
D04
S09S08
S07S06
S05S04
S03
"I" ChartS01
S02
Figure 6.3-5. Corrected target positions from two passes over the Year 1 calibration line with
observed offset removed; also provided are the “true” diver-determined positions for three targets obtained with a mobile transponder beacon.
Year 2 – Precision. To evaluate LLSS precision for the Year 2 data, geodetic positions for each LLSS target identified during four passes over Validation Line 3 were obtained from the CleanSweep2 playback and plotted in x,y format as shown in Figure 6.3-6. These positions should theoretically be identical assuming that the targets did not move between passes. As with the morphometry analysis (see Section 6.2), only Validation Line 3 data were selected for the positioning evaluation because these results represented the highest quality LLSS images with the most easily identifiable targets. As explained in Section 6.2, CleanSweep2 was used as the primary software application in Year 2 for selecting targets from the raw LLS data. Finally, since Figure 6.3-6 shows data for a validation string with targets placed in an unknown order (as opposed to a calibration string with targets placed in a known order), the specific target ID (S1, S2, D1, D2, etc) could not be shown for each position node; a general position identifier (P1, P2, etc.) was used instead. As shown in Figure 6.3-6, target positioning showed good precision between Passes BL05A and BL05C as well as Passes BL05B and BL05D. However, these two groupings showed poor precision between each other. When considering the fact that subsequent LLSS passes were

Final Report LLSS for UXO Characterization
64
conducted with the survey vessel traveling along the target string in alternating directions, these results suggested that the sensor layback was not properly incorporated into the GAPS configuration. With such an error there would be no offset for passes traveling in the same direction but a constant offset of twice the incorrect layback for passes traveling in opposite directions. This trend was observed in Figure 6.3-6.
Figure 6.3-6. Uncorrected target positions from four passes over Year 2 Validation Line 3 as
determined from the CleanSweep2 software. Review of the Year 2 survey logbooks ultimately revealed that during the course of LLSS data acquisition, the source of DGPS positioning for the GAPS was misidentified. During the equipment testing phase (prior to active survey), the DGPS source was switched from a Wide Area Augmentation System (WAAS)-corrected GPS antenna located on the GAPS transducer pole to a U.S. Coast Guard (USCG) differential beacon-corrected GPS antenna located on the top deck of the survey vessel. When the DGPS source was changed from WAAS to differential beacon DGPS, the antenna offsets were not updated in the IXSEA topside controller software system. To remove the consistent bias that resulted, separate positional correctors were calculated to adjust for the 5.5 m forward-aft antenna offset and the 3.37 m port-starboard antenna offset. Once the values for these correctors were determined, they could be applied directly to the navigation data with only the sign of the value (+/-) reversed based on the direction of travel over the target string. The positional correctors were ultimately applied to the geodetic coordinates for the LLSS targets in both the east-northeast and west-southwest directions and the resulting data were once again plotted in x,y format as shown in Figure 6.3-7. These results show good precision between all four passes for Validation Line 3, thus leading to the conclusion that the antenna offset was

Final Report LLSS for UXO Characterization
65
the source of precision error observed for opposite passes in the uncorrected dataset shown in Figure 6.3-6.
Figure 6.3-7. Corrected target positions from four passes over Year 2 Validation Line 3 as
determined from the CleanSweep2 software with proper GPS antenna offsets applied.
In addition to the geodetic position plots shown above, a circular error plot was also developed to concurrently display the relative corrected positions of each target from all four LLSS passes over the target string in a standard x,y coordinate plane (Figure 6.3-8). This graphical approach is commonly employed to compare repeated GPS positions for individual points, and was previously used to show preliminary instrument validation strip results for a marine-towed array survey in San Diego Harbor (SAIC 2010). On Figure 6.3-8, the green dot at the graphical origin represents the corrected position for each target on the validation line as determined from Pass BL05A; for the purposes of the comparison this point is considered the “known” position for each target. The blue, pink and purple shapes then represent the measured position for each target identified on Passes BL05B, BL05C and BL05D, respectively, relative to the position of that same target measured on Pass BL05A (i.e., the graphical origin). The x-value for each point represents the positional offset in the east-west direction while the y-value for each point represents the positional offset in the north-south direction for that specific target. Consequently, the absolute distance from the origin represents the overall magnitude and direction of offset between the two positions. Although 20 targets were deployed on the validation string, relative positions for only eight of the targets were repeatedly plotted in this comparison because these were the only targets that were clearly identifiable in all four passes.

Final Report LLSS for UXO Characterization
66
Figure 6.3-8. Circular error probability plot showing corrected target positions from three
passes over Year 2 Validation Line 3 relative to corrected target positions from Pass BL05A; circular error statistics are also shown.
In order to quantify overall LLSS precision during Year 2, the data from the circular error plot was used to calculate the circular error probability (CEP) for all passes combined. The term CEP is typically associated with the intuitive measure of a weapons system accuracy, but can also be applied as a measure of precision for any ground to ground position comparison (AFOTEC 1988). This statistic is defined as the radius of a circle in which 50% of position values would be expected to fall assuming the system is aiming for a known point (graphical origin). The CEP is mathematically derived from the distance root mean squared (DRMS), which is a single number that expresses two-dimensional accuracy and is defined as the square root of the average of the square errors for each horizontal direction. In order to compute the DRMS for a set of horizontal positions, the standard errors (σ) from the known position in the directions of the coordinate axis are required. The formula for calculating these standard errors is as follows:
σx,y = √(Σ(x,yknown – x,ymeasured)2 / n)

Final Report LLSS for UXO Characterization
67
Once the standard errors from the known position are determined for each horizontal direction, the following formula is used to calculate the DRMS:
DRMS = √(σx2 + σy
2)
Finally, the CEP is calculated from the DRMS as follows:
CEP = DRMS / 2.4
Whereas the CEP represents a measure of 50% probability for two-dimensional distance from the known position, the DRMS represents 65% probability and 2DRMS represents 95% probability. Thus based on the results for Year 2 Validation Line 3 shown in Figure 6.3-8, 50% of repeated LLSS-detected target positions would be expected to fall within 1.65 m of the originally measured position for any target over multiple passes during a given LLSS survey. Furthermore, 65% of repeated LLSS-detected positions would be expected to fall within 1.98 m and 95% of repeated LLSS positions would be expected to fall within 3.96 m. Therefore the minimum level of precision for the LLSS (i.e., maximum linear deviation for repeated positions of the same target) is concluded to be no greater than 4 m (at a 95% confidence level). These precision results are consistent with the difference in target positions of 3.9 +/- 2.0 m measured for the two passes in Year 1. Year 2 – Accuracy. For the Year 2 accuracy evaluation, “true” horizontal positions were collected for the clump weight on one end of Validation Line 3 by attaching an IXSEA mobile transponder beacon to the weight and obtaining the position of that beacon from the GAPS system independent of the LLSS. This weight/beacon combination was then successfully imaged on two LLSS passes over the target string (BL05A and BL05C) and the resulting positions were obtained from both the CleanSweep2 and GeoDAS playbacks. As both software applications were used to obtain comparative target measurements for Validation Line 3, both software applications could be applied to the same data for target positioning comparisons. The SAIC LLSS software tool was not used for target positioning. The circular error plot showing the Year 2 accuracy of the LLSS is provided in Figure 6.3-9. Similar to the precision error plot shown above, the green dot at the graphical origin represents the corrected position for the weight/beacon as determined with GAPS independent of the LLSS; this point is considered the “known” position for that target. The other symbols depict the corrected LLSS positions for the same single target as determined with both CleanSweep2 and GeoDAS software on Passes BL05A and BL05C. The x-value for each point represents the positional offset in the east-west direction while the y-value for each point represents the positional offset in the north-south direction. Consequently, the distance from the origin represents the overall magnitude and direction of offset between the two positions. As shown in Figure 6.3-9, the accuracy was relatively consistent for each software application over both passes, but overall CleanSweep2 produced better positional accuracy than GeoDAS (shapes clustered closer to the graphical origin). Although both software applications receive the same navigation data input, the different image filters applied by CleanSweep2 make better use of this data for georectification, thus producing slightly more accurate positioning. Due to a

Final Report LLSS for UXO Characterization
68
limited dataset (only four points), the CEP and DRMS statistics could not be calculated for the accuracy dataset as was done for the precision dataset above. Instead, arbitrary circles were placed on the accuracy plot to depict the offset radii for each software application. CleanSweep2 produced an accuracy of approximately 2 m while GeoDAS produced an accuracy of approximately 3 m. These Year 2 accuracy values showed a substantial improvement over the highly uncertain diver-determined data from Year 1.
Figure 6.3-9. Corrected LLSS positions for one target on Year 2 Validation Line 3 as
determined over multiple passes with both CleanSweep2 and GeoDAS software relative to the true position as determine with an IXSEA beacon.
6.3.3. Water Clarity Requirements Since the LLSS is essentially an optical instrument based on the ability of a laser light source to scan the seafloor, water clarity was identified as an integral environmental factor affecting LLSS image quality during both the Year 1 and Year 2 demonstration surveys. Therefore, ESTCP requested that water clarity (i.e., transmissivity) effects on LLSS performance be quantified as an added parameter outside of the original test plan. In order to accomplish this goal, the transmissometer data collected during the Year 2 survey (see Section 2.3) was used to calculate a

Final Report LLSS for UXO Characterization
69
minimum beam attenuation coefficient (a common transmissivity measurement) at which the LLSS would be expected to produce successful images during future operations. Transmissivity is defined as the ability of a medium (e.g., water) to transmit light along a straight path. Pure water naturally reduces the intensity of light as it travels farther from the source. As such, beam attenuation is defined as the loss of light from a narrow, well collimated beam due to both absorption and scattering within the medium. When referenced to water, the beam attenuation coefficient describes light losses due to both absorption by dissolved materials and particulates as well as scattering by particulates. Any incident light attenuated, scattered or absorbed decreases the transmissivity of the water; thus the “dirtier” the water, the lower the transmissivity. Transmissivity in water is measured with a transmissometer, a device that sends an incident light beam in a single direction within a known area and then determines how much of that light strikes a light sensor at a fixed distance on the opposite end of the area (i.e., pathlength). If the water contains a significant quantity of foreign materials, most of the light will be absorbed or scattered and very little of the incident beam will reach the receiver; thus the transmissivity measurement will be low. If the water is very clean, however, most of the light will reach the receiver and the transmissivity measurement will be high. Transmissivity is typically proportional to visual observations of relative water clarity. The transmissometer used during the LLSS demonstration survey was a C-Star Deep Unit (manufactured by Wet Labs, Inc.) with a 25 cm pathlength and 532 nm (green) light source. As opposed to a lower energy 650 nm (red) light source, the green light is known to transmit better in seawater and is considered best for estimates of in-situ marine visibility. The C-Star outputs beam attenuation measurements in terms of CSC with an internally applied scale factor and offset. With the instrument in the water, the CSC will range from a minimum value obtained by a blocked beam reading to a maximum value obtained during a clean water calibration. The ratio of the signal output to the calibration output is defined as the transmittance ratio (Tr) and will vary from 0 to 1. As part of the Year 2 survey, transmissometer readings were collected at nine total stations to evaluate local water clarity; a qualitative use of this data was relied upon in real time to locate potentially acceptable areas for LLSS data acquisition. The locations of the transmissometer stations are provided in Figure 6.3-10. During each of these tests, the transmissometer was lowered through the water column using a handline and a reading was taken every 5 m starting at the surface (water depth = 0 m) with the resulting CSC output recorded in the field logbook. As the transmissometer descended within 5 m of the seafloor (as determined by the vessel depth finder), the reading interval was reduced to every 1 m until the unit hit bottom; an example of the resulting data is provided in Figure 6.3-11. The CSC output from one meter off the seafloor was the measurement of most interest for the demonstration because this depth represents the horizon over which the LLSS laser output must penatrate to acquire images of targets resting on the bottom. If the transmissivity is poor at this horizon due to sediment resuspension or other particulates, quality LLSS image acquisition will not be possible.

Final Report LLSS for UXO Characterization
70
Figure 6.3-10. Locations of transmissometer stations during the Year 2 survey relative to
placement of target strings for LLSS operations; shown with beam coefficient for the horizon one meter above the seafloor and corresponding bottom type.
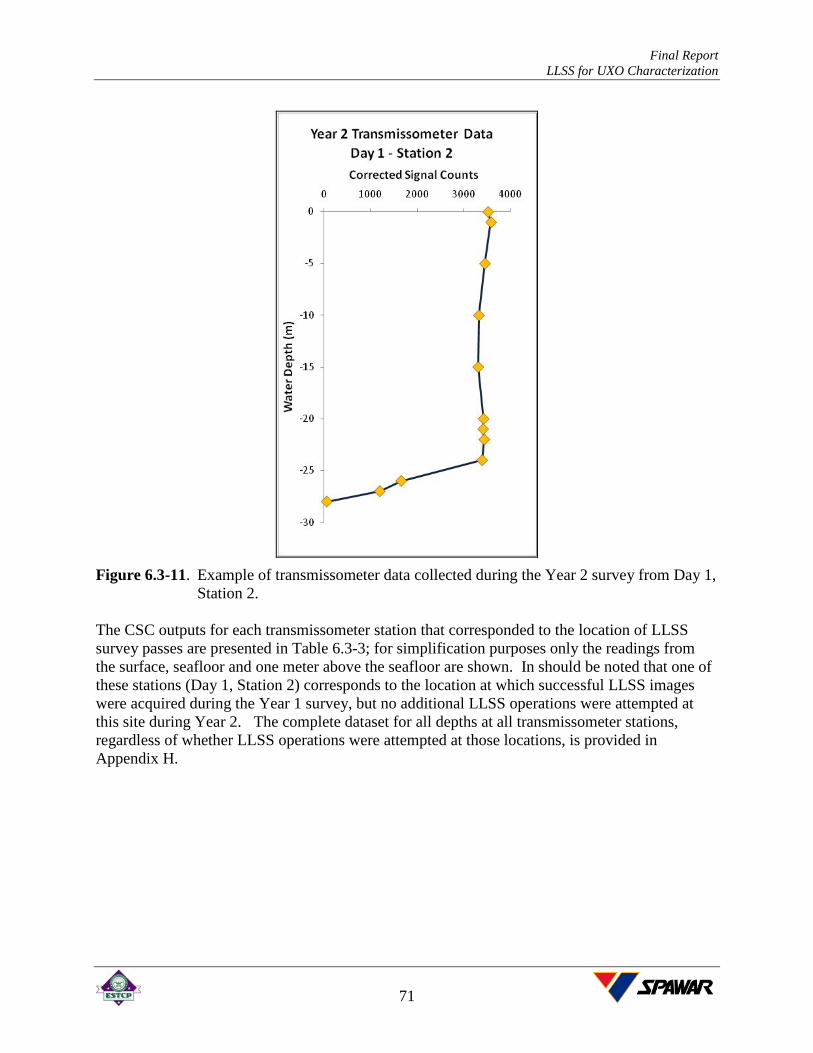
Final Report LLSS for UXO Characterization
71
Figure 6.3-11. Example of transmissometer data collected during the Year 2 survey from Day 1,
Station 2. The CSC outputs for each transmissometer station that corresponded to the location of LLSS survey passes are presented in Table 6.3-3; for simplification purposes only the readings from the surface, seafloor and one meter above the seafloor are shown. In should be noted that one of these stations (Day 1, Station 2) corresponds to the location at which successful LLSS images were acquired during the Year 1 survey, but no additional LLSS operations were attempted at this site during Year 2. The complete dataset for all depths at all transmissometer stations, regardless of whether LLSS operations were attempted at those locations, is provided in Appendix H.

Final Report LLSS for UXO Characterization
72
Table 6.3-3. Transmissometer data collected during the Year 2 survey for locations at which target strings were deployed and LLSS operations were attempted; only values for surface, seafloor and one meter above seafloor shown.
Target Line ID
Water Depth (m)
Corrected Signal Counts, CSC (unitless)
Transmittance Ratio, Tr (unitless)
Beam Attenuation Coefficient, c (m-1)
Transmissometer ID: Day 1, Station 1 Target Line ID: Year 2 Calibration Line 1
BL01 0 2543 0.629 1.856
-20 3000 0.745 1.179 -22 1200 0.288 4.979
Transmissometer ID: Day 2, Station 4 Target Line ID: Year 2 Calibration Line 2 / Validation Line 1 / Validation Line 3
BL02 BL03 BL05
0 3552 0.885 0.490 -17 3047 0.757 1.115 -18 1234 0.297 4.861
Transmissometer ID: Day 3, Station 3 Target Line ID: Validation Line 2
BL04 0 3542 0.882 0.501
-14 2152 0.530 2.543 -15 1978 0.485 2.891
Transmissometer ID: Day 1, Station 2** Target Line ID: Year 1 Calibration Line 2
D01 0 3520 0.877 0.526
-27 1200 0.288 4.979 -28 65 0.000 NA
** Transmissometer data collected during the Year 2 survey at the site of successful images from the Year 1 survey; results are not relevant to Year 2 images.
The CSC outputs at each station were then used to calculate the Tr for each water column horizon using the following equation provided by the transmissometer manufacturer: Tr = (CSCsig – CSCdark) / (CSCcal – CSCdark) Where: CSCsig = measured output signal
CSCdark = dark offset for the instrument obtained by blocking the light path (factory-supplied) = 65
CSCcal = corrected signal counts for clean water obtained during instrument calibration (factory-supplied) = 4006
The Tr is then related to the beam attenuation coefficient by the exponential relationship: Tr = e-cx c = -1/x * ln(Tr) Where: Tr = transmittance ratio (unitless)
x = instrument pathlength (m)
c = beam attenuation coefficient (m-1)

Final Report LLSS for UXO Characterization
73
The results of the transmittance and beam attenuation coefficient calculations for each relevant transmissometer station are also provided in Table 6.3-3. Since the Tr value is a ratio between 0 and 1 and the natural log of this value is directly proportional to the beam attenuation coefficient, at a fixed pathlength the beam attenuation coefficient can range from zero (where Tr = 1; water completely clear) to infinity (where Tr = 0; water completely opaque). A lower beam attenuation coefficient is indicative of greater water clarity and would thus predict more successful LLSS operations. As discussed in Section 6.2, the highest quality LLSS images collected during the Year 2 survey were obtained for Validation Line 3 (BL05) and Calibration Line 2 (BL02). As shown in Figure 6.3-10, both of these target strings corresponded to transmissometer Day 2, Station 4. LLSS images of lesser quality were obtained for Validation Line 1 (BL03), as at transmissometer Day 2, Station 4 and at Calibration Line 1 (BL01), which corresponded to transmissometer Day 1, Station 1. No successful LLSS images were obtained for Validation Line 2 (BL04), which corresponded to transmissometer Day 3, Station 3. The According to the highlighted rows in Table 6.3-3, the beam attenuation coefficients for the water depth horizon one meter above the seafloor (i.e., the layer in which the LLSS operates) for stations BL02/BL03/BL05, BL01 and BL04 were 1.115 m-1, 1.179 m-1, and 2.453 m-1, respectively. Based on this limited comparative dataset, the minimum conclusions were reached that the LLSS will produce high quality images in bottom water with a beam attenuation coefficient <1.115 m-1 and will not produce successful images in bottom water with a beam attenuation coefficient >2.453 m-1. Waters with beam attenuation coefficients between these values will produce LLSS images of variable quality, with values <1.179 m-1 having a greater potential for success. Additional data would be needed to narrow the range for predicted success. Examples of LLSS images of a UXO simulator collected in bottom water with beam attenuation coefficients of 1.115 m-1 and 1.170 m-1, respectively, are shown in Figure 6.3-12. No images could be collected in bottom water with a beam attenuation coefficient of 2.453 m-1 for comparison.
Figure 6.3-12. Examples of LLSS images of a UXO simulator collected in bottom water with
beam attenuation coefficients of 1.115 m-1 (high quality, left) and 1.170 m-1 (medium quality, right).

Final Report LLSS for UXO Characterization
74
The final highlighted row in Table 6.3-3 shows the beam attenuation coefficient calculated during Year 2 for the station at which high quality LLSS target images were collected during Year 1; this site was not reoccupied by the LLSS in Year 2. Based on the discussion above, the beam attenuation coefficient of 4.979 one meter above the bottom indicates that collection of high quality LLSS images would not have been possible at this site should they have been attempted. The fact that successful images were collected at this site in Year 1 implies a beam attenuation coefficient of <1.115 m-1 at that time, thus signifying that water clarity conditions and corresponding potential for LLSS success can change significantly over time for a particular area. Because the beam attenuation coefficient defines water clarity as a function of pathlength and transmittance, this value should theoretically be consistent for a given position at a given time regardless of the specific transmissometer used or the water temperature at which it is operated. Therefore it is a useful tool for quantifying water clarity in a universal manner and efficiently predicting whether the LLSS system will produce successful bottom images prior to the initiation of any actual LLSS operations. By taking transmissometer readings first and calculating the resultant beam attenuation coefficient one meter above the seafloor, the LLSS operator can avoid attempting operations where bottom imaging would be impossible (i.e., c >2.453 m-1) due to decreased water clarity caused by sediment resuspension or the presence of other particulates. Figure 6.3-10 also correlates beam attenuation coefficient to local bottom type as defined by the NAVOCEANO doctrinal bottom type survey (see Section 4.3). As shown, the lowest beam attenuation coefficient of 1.115 m-1 (and by extension the highest quality LLSS data) was obtained at a location (Day 2, Station 4) where the bottom type was primarily rock. The intermediate beam attenuation coefficient of 1.179 m-1 (and by extension the medium quality LLSS data) was obtained at a location (Day 1, Station 1) where the bottom type was primarily sandy silt. High beam attenuation coefficients of 3.554 m-1 and 3.722 m-1 were obtained at locations (Day 2, Station 1 and Day 2, Station 3, respectively) where the bottom type was also sandy silt. Based on the transmissometer results, LLSS data acquisition was not attempted at these sites because the potential for successful imaging was low. Although a bottom type characterization was not available for the location of the elevated beam attenuation coefficient of 2.543 m-1 (Day 3, Station 3), the lack of successful LLSS data at this location implies a soft bottom such as sandy silt, silt or clay. Based on these results, a direct correlation could be made between bottom type and beam attenuation coefficient, and thus also the potential for successful LLSS image acquisition. Hard bottom types such as rock or sand produce clear water conducive to collection of high quality LLSS data while softer bottom types such as silty sand or other fines are more likely to produce turbid water resulting from sediment resuspension that would limit LLSS success. 6.4. TARGET CLASSIFICATION AND TRAINING During Year 1 actitivites, target classification was beyond the scope of the calibration element of this project as the identity of targets along the calibration string was known to the analyst prior to viewing the LLSS data and could otherwise be determined based on target spacing in the absence of successful imagery. Target classification was instead addressed during the Year 2 survey with

Final Report LLSS for UXO Characterization
75
completion of the validation element of the project, during which validation strings were deployed with target orders unknown to the LLSS data acquisition and analysis team. Here, the classification (i.e., identification) of these targets was dependant solely on the LLSS imagery. The methodology and results for this “blind testing” component are provided in the following subsections. Blind Testing Methodology. The LLSS data collected for each validation string featuring a blind arrangement of targets was ultimately used to populate a pre-printed log that served as a de facto “scorecard” for blind testing performance; an example of this log is provided in Appendix C (Form LLSS-06). In order to complete the scorecard, the LLSS data analysis team performed both Tier I and Tier II classification. Tier I classification involved determining the location of each target position (P01, P02, etc.) along the validation string in the software playback (CleanSweep2 or GeoDAS) based the presence of a target in the LLSS image. If a target was present, both visual discrimination and LLSS measurements were used to determine whether the target was a UXO simulator or dummy object (regardless of the specific target ID); a check mark was placed in the appropriate box for each position. Tier II classification then involved using these same processes to determine which specific individual target was present in each image; the corresponding target ID (S1, D1, etc.) was placed in the appropriate box on the scorecard for each position. These steps were accomplished without knowledge of the true target configuration, which was still maintained only by the SPAWAR PM. Once the target classification sections of the scorecard were completed by the LLSS data analysis team, the SPAWAR PM released the separate logs on which the actual target configurations for the validation strings were recorded at the time of deployment; an example of this log is also provided in Appendix C (Form LLSS-03). The true target ID for each position was then transferred onto the blind testing scorecard and the information was compared to the results already entered by the LLSS analysts. A binary scoring system was used to quantify both the Tier I and Tier II results by placing a “1” in the row for each correct classification and a “0” in the row for each incorrect or unknown classification under each parameter. The binary scores were then added up and divided by the total number of targets surveyed to calculate the Tier I and Tier II classification success percentages. These percentages were ultimately used to evaluate the probability of surrogate target detection performance objective, which was defined as the effectiveness of the LLSS for detecting and discriminating surrogate munitions from clutter (i.e., non-munitions) of similar size and shape (see Section 3.6) The information on the blind testing logs was also used to create a contingency table for the overall validation element that was designed to quantify the probability of false alarm (see Section 3.7) and probability of false negative (see Section 3.8) performance objectives, as well as to calculate additional statistics that were not specified in the performance objectives but still deemed useful in evaluating target classification capabilities (e.g., sensitivity, specificity, etc.). For this contingency table, the “positive” condition was defined as a given target is a UXO simulator (i.e., UXO item) while the “negative” condition was defined as a given target is a dummy object (i.e., non-UXO item). The contingency table was configured as follows:

Final Report LLSS for UXO Characterization
76
Reality
LL
SS R
esul
ts UXO Simulators Dummy Objects Total
UXO Simulators A B E
Dummy Objects C D F
Total G H I Where:
• A is the number of true UXO simulators correctly identified as UXO simulators by the LLSS (True Positive),
• B is the number of true dummy objects incorrectly identified as UXO simulators by the LLSS (False Positive; Type I error),
• C is the number of true UXO simulators incorrectly identified as dummy objects by the LLSS (False Negative; Type II error),
• D is the number of true dummy objects correctly identified as dummy objects by the LLSS (True Negative),
• G is the total number of true UXO simulators surveyed (i.e., deployed and covered by the LLSS) in the validation element,
• H is the total number of true dummy objects surveyed (i.e., deployed and covered by the LLSS) in the validation element,
• E is the total number of UXO simulators identified by the LLSS, and
• F is the total number of dummy objects identified by the LLSS.
• I is the total number of targets surveyed in the validation element. Data from the contingency table was used to quantify the following parameters for the LLSS:
• Sensitivity = A/G. Defined as the ratio of true positives identified to total positives surveyed; refers to the likelihood that a true UXO item will be correctly identified as a UXO item.
• Specificity = D/H. Defined as the ratio of true negatives identified to total negatives surveyed; refers to the likelihood that a true non-UXO item will be correctly identified as a non-UXO item.
• True positive predictive value (PPV) = A/E. Defined as the ratio of true positives identified to total positives identified; refers to the likelihood that a target identified as a UXO item truly is a UXO item.

Final Report LLSS for UXO Characterization
77
• True negative predictive value (NPV) = D/F. Defined as the ratio of true negatives identified to total negatives identified; refers to the likelihood that an object identified as a non-UXO item truly is a non-UXO item.
• False positive rate (FPR) = B/H. Defined as the ratio of false positives to total negatives surveyed; refers to the likelihood that a true non-UXO item will be incorrectly identified as a UXO item. Also known as the Type I error rate and/or significance level. Equal to 1-specificity.
• False negative rate (FNR) = C/G. Defined as the ratio of false negatives to total positives surveyed; refers to the likelihood that a true UXO item will be incorrectly identified as a non-UXO item. Also known as Type II error rate. Equal to 1-sensitivity.
Blind Testing Results. All field logs completed for the validation (i.e., blind testing) activities are provided in Appendix D. Although three different validation strings were deployed during the Year 2 survey, successful LLSS images fit for data analysis were only collected for Validation Line 3 (Line ID: BL05; see Section 5.6). The final scorecard prepared for Validation Line 3 showing both Tier I and Tier II classification results and percent success is provided in Figure 6.4-1.
NodeTrue Target
IDTier 1Score
Tier 2Score
X
X
X
X
X
X
X
X
Total Score Total Score: 8 7Total # Targets
Tier 1 Tier 2
9 = % Classification Success 89 78
Percent Classification Success
= X 100
Percent Classification Success
= X 100
1
P20 Simulated UXO Dummy Object X3 X3 1 1
P19 Simulated UXO Dummy Object S2 S2 1
0
P18 Simulated UXO Dummy Object D1 D1 1 1
P17 Simulated UXO Dummy Object Not Observed D11 0
1
P16 Simulated UXO Dummy Object Uknown S7 1 0
P15 Simulated UXO Dummy Object S6 S6 1
1
P14 Simulated UXO Dummy Object S4 S4 1 1
P13 Simulated UXO Dummy Object D6 D6 1
P12 Simulated UXO Dummy Object D5 D5 1 1
Tier 1: General classification of targets
Tier 2Specific ID
Figure 6.4-1. Target classification results for Year 2 Validation Line 3 showing both Tier I and
Tier II success. Potential classification for only 9 of 20 targets (P12-P20) deployed on Validation Line 3 could be completed on this scorecard because, as previously described in Section 6.2, target images were determined not to be available for all 20 nodes due to local areas of high turbidity in the water column preventing successful LLSS data collection at some positions. This phenomenon

Final Report LLSS for UXO Characterization
78
was evident in the real-time LLSS “waterfall” display where the main target string was clearly visible for approximately half the survey transect before almost instantaneously disappearing from view without an appreciable shift in FOCUS trackline (i.e., the target string did not simply move out of the field of view). A map of the target positions at which images were collected during the various passes is provided in Figure 6.4-2; as shown there is a distinct breakpoint from the area where targets were visible and the area where targets were not visible. This breakpoint generally coincided with a change in bottom type from rock to sandy silt as defined by the NAVOCEANO doctrinal bottom type survey. As described above, this change likely resulted in a corresponding increase in beam attenuation coefficient (i.e., decrease in water clarity). The increased potential for sediment resuspension that is associated with the softer bottom explains the lack of high quality target images produced after the breakpoint. The blind testing results provided in Figure 6.4-1 show that the general classification (UXO simulator versus dummy object) was correctly identified for 8 of 9 targets surveyed and the specific target ID was correctly identified for 7 of 9 targets surveyed. These results translate to a Tier I success probability of 89% and a Tier II success probability of 78% based on limited data from one validation string. The target at node P17 was not correctly classified during the Tier I assessment because no image was observed at this position in the LLSS return. Dummy object D11 that was actually present at P17 was a small piece of steel pipe measuring 6 inches long by 2.25 inches wide whose dark color produced little contrast with the background except for the white band containing the label (see Appendix B). Off all the targets deployed, this object was the smallest and most difficult to image with the LLSS, thus defining the lower limit of detection for the system. The target at node P16 was correctly classified during the Tier I assessment but could not be identified during the Tier II assessment because the LLSS image only showed a thin area of contrasting color for which a distinct outline and measurements could not be determined. The UXO simulator S7 that was present at P16 was a 60MM projectile measuring 34 inches long and 2.4 inches wide with a dark colored body and no banding (see Appendix B). The nature of this object produces only slight contrast with the background allowing for general location and type (Tier I classification), but not for determining specific size and shape as needed for Tier II classification.

Final Report LLSS for UXO Characterization
79
Figure 6.4-2. Locations at which targets were observed during multiple LLSS passes over
Year 2 Validation Line 3 showing a distinct breakpoint between successful and non-successful data acquisition and the corresponding bottom type.

Final Report LLSS for UXO Characterization
80
The data from the Validation Line 3 scorecard was also used to populate the previously defined blind testing contingency table as follows:
Reality
LL
SS R
esul
ts UXO Simulators Dummy Objects Total
UXO Simulators 4 0 4
Dummy Objects 0 4 4
Total 4 4 8 Because the parameters depicted in the contingency table (sensitivity, specificity, etc.) are solely dependent on Tier I data, only the targets for which a Tier I classification could be made (whether it be correct or incorrect) were included. Thus the target at node P17 for which no LLSS image was available was removed from the dataset. Based on the available contingency data, the following quantitative metrics were calculated for LLSS performance:
• Sensitivity = 100%
• Specificity = 100%
• True positive predictive value (PPV) = 100%
• True negative predictive value (NPV) = 100%
• False positive rate (FPR) = 0%
• False negative rate (FNR) = 0% It is understood that these statistics were calculated using an extremely limited number of available blind testing data. However, based on the LLSS image quality capabilities presented in Section 6.2 and the LLSS target measuring capabilities presented in Section 6.3.1, similar results are expected for any additional blind testing data that would be collected under favorable environmental conditions (i.e., high water clarity). 6.5. DATA PRODUCTS The primary data products for the LLSS demonstration are the figures and tables included in this Final Report as well as the complete set of processed LLSS images provided in Appendix G. Survey alterations from what was originally proposed in the demonstration plan caused by variable weather and environmental conditions as well as required equipment maintenance resulted in a very limited amount of data, particularly for the validation element. However, survey activities were also used to develop secondary data products such as refined methodologies for system configuration, pre-deployment dry testing and sensor deployment that

Final Report LLSS for UXO Characterization
81
would be integral to the success of future UXO surveys. The results of the Year 1 demonstration were also used to identify a flaw in the GeoDAS software package which facilitated development of a software patch and alternate processing techniques that resulted in greatly improved image quality for this and future LLSS operations.

Final Report LLSS for UXO Characterization
82
7.0. PERFORMANCE ASSESSMENT General Performance Summary. The LLSS demonstration as conducted yielded enough field data to evaluate all of the performance objectives established in Section 3.0 to varying degrees, but the adverse weather and water quality conditions experienced during both the Year 1 and Year 2 surveys greatly limited the final data products compared to what was originally proposed in the test plan. The Year 1 survey focusing primarily on the calibration element of the project and the resulting data (with post-survey processing) were used to address 7 of the 14 metrics (depth station keeping, line station keeping, data processing, target analysis, survey production rates, UXO parameter estimates, survey coverage). Three additional metrics (ease of use, system reliability and maintenance) were addressed from the shipboard logs. The limitations of the Year 1 calibration data were also identified and used to develop a more detailed data processing and analysis plan for the Year 2 survey to better address all of the relevant performance objectives. The Year 2 survey focusing primarily on the validation element of the project with the resulting data (with improved post-processing) was used to address the four remaining metrics that were specifically associated with blind testing (probability of surrogate target detection, probability of false alarm, probability of false negative, target location accuracies). Year 2 data were also used to review, refine and corroborate the results for all of the performance objectives that were previously addressed in Year 1. The final results for all performance objectives developed from both the Year 1 and Year 2 data are presented in the following sections. 7.1. OBJECTIVE: DEPTH STATION KEEPING Level of Accomplishment. Depth station keeping was defined as the percentage of the survey length that the FOCUS vehicle was able to maintain a target altitude above the seafloor. The target altitude selected to obtain the highest resolution LLSS images for the Year 1 survey was 3-4 m. During the survey, the average FOCUS altitude was maintained at 3.7 ± 0.3 m for the first pass over the target string and 3.3 ± 0.3 m for the second pass. Maintaining a slightly lower altitude on the second pass was intentional. A target altitude of 3-4 m was also selected for 12 out of 13 Year 2 passes over various target strings, the sole exception being Pass BL05D which was purposely conducted at a higher altitude to test LLSS operation under different survey conditions (see Section 6.2). The actual altitude of the FOCUS maintained an average of 3.7 ± 0.8 m during Year 2 for the conventional passes. The intentional high altitude pass had a target altitude of 7-8 m and the average FOCUS altitude was maintained at 7.0 ± 0.5 m. Level of Success. The success criterion for depth station keeping of +/- 1 m from desired altitude for over 50% of the survey lines was accomplished for both years of the demonstration.

Final Report LLSS for UXO Characterization
83
7.2. OBJECTIVE: LINE STATION KEEPING Level of Accomplishment. Line station keeping was defined as the difference between the actual cross-track position of the LLSS transducer and the horizontal position of the predetermined survey line. This objective was assessed during the Year 1 survey, where the horizontal track line of the LLSS remained within 3 m of the target survey line for 100% of both passes and within 2.1 m of the target survey line for 99% of both passes. This objective was not further evaluated during the Year 2 survey. Level of Success. The success criterion for line station keeping of maintaining the horizontal track line of the LLSS within 3 m of the predetermined survey line for the entire length of each pass was met during the Year 1 survey. 7.3. OBJECTIVE: DATA PRE-PROCESSING Level of Accomplishment. Data pre-processing was defined as the time required to pre-process a 500 m (1640 ft) segment of LLSS imagery and create spatial data files of the seafloor and/or target field for subsequent mapping. Data pre-processing for Year 1 was conducted on shore and consisted of the export of target position information from GeoDAS and the creation of spatial data files with ESRI’s ARC Map v9.3. Fifteen minutes were required to pre-process and export the target positions from both passes (3000 ft of LLSS data) from GeoDAS and an additional 30 minutes were required to create a map of the target field in ARC Map. Therefore, data pre-processing during Year 1 required an average of 23 minutes per 500 m (1640 ft) segment of LLSS imagery. Data pre-processing for Year 2 was also conducted on shore, but this time it was performed with the CleanSweep2 software and included the removal of spurious data (such as individual line scan recording errors caused by vessel movement) from the raw LLSS imagery acquired by GeoDAS. The LLSS imagery was then georectified as a 4 x 500 m swath and exported as a raster mosaic. Raster mosaics were subsequently imported into an Arc Map project file. This process, which was more rigorous than the Year 1 effort, required an average of 45 minutes per 500 m (1640 ft) swath of LLSS imagery. Level of Success. The success criterion for data pre-processing of less than one hour per data string was met during both years of the demonstration, including the more rigorous process implemented during Year 2. 7.4. OBJECTIVE: TARGET ANALYSIS Level of Accomplishment. Target analysis was defined as the time required to identify and mark acquired targets in mapped data files and compare the target images to the pre-established “dig list” for each data string. During the Year 1 survey, target analysis was aided by the Target View feature of the GeoDAS software. LLSS imagery was reviewed on shore in GeoDAS and the Target View feature was used to mark, measure, characterize, and facilitate the export of target images. This process required approximately two hours from the end of data pre-processing to review the data files, identify and mark acquired targets, and compare the target images to the

Final Report LLSS for UXO Characterization
84
pre-established “dig list” for each data string corresponding to one approximately 500 m (1640 ft) pass over the target string. Target analysis for the Year 2 survey was performed on shore with the CleanSweep2 software and its associated Target View functionality. LLSS imagery was reviewed in CleanSweep2 and each acquired target was marked, measured, and characterized with the CleanSweep2 Target View dialog. For each individual target, gains and filters were adjusted for local variation in the data in order to improve the resolution and quality of the image. Target images were then prepared for export as a high-resolution georectified mosaic. Year 2 target analysis required an average of two and one half hours for each 500 m (1640 ft) swath of LLSS imagery. Level of Success. The success criterion for target analysis of less than three hours per 500 m (1640 ft) segment of LLSS imagery was met for both years of the demonstration. 7.5. OBJECTIVE: SURVEY PRODUCTION RATES Level of Accomplishment. Survey production rate was defined as the area of the seafloor (m2) that can be surveyed in one hour for a particular set of conditions. The two survey conditions governing the survey production rate are the altitude and the tow speed of the LLSS. The target altitude of 3-4 m (4.2-5.6 m swath width) and target tow speed of 1.5 m/s (3 kt) remained the same for all passes during both Year 1 and Year 2 of the demonstration, with the exception of the one intentional high altitude pass that was conducted during Year 2 (target altitude of 7-8 m; see Section 6.2). During Year 1, LLSS imagery was collected at an average rate of 27,972 ± 2,268 m2/hour for the first pass over the target string and 24,948 ± 2,268 m2/hour for the second pass. The variability in these values is a function of the minor adjustments in FOCUS altitude made throughout the pass. The average swath width for each pass was calculated as a theoretical value from the average FOCUS altitude throughout the pass using the following relationship as defined in Section 2.1:
Swath Width = Altitude x 1.4
The average swath width was then multiplied by the target tow speed of 1.5 m/s (assumed to be constant) to obtain the production rate. During Year 2, the average survey production rate was 27,114 + 3,390 m2/hour for twelve conventional low altitude passes and 52,705 m2/hour for the one high altitude pass; only Year 2 passes for which images were observed were included in the average. In order to provide a conservative estimate of production rate only for times at which targets were observed, the average swath width for each pass was calculated from the average FOCUS altitude at the point each target image was acquired (as determined with CleanSweep2) using the formula presented above. The average altitude, swath width and resulting production rate for each Year 2 pass determined in this manner assuming a constant tow speed of 1.5 m/s is presented in Table 7.5-1.

Final Report LLSS for UXO Characterization
85
Table 7.5-1. Average altitude, swath width and resulting production rate for each LLSS pass conducted during the Year 2 demonstration as determined for times at which targets were observed.
Date
Target Line Description
Pass ID
Average Altitude (m)
Average Swath Width (m)
Production Rate (m2/hr)
09/28/2010 Calibration Line 1 BL01C 3.2 4.5 24,268
09/28/2010 Calibration Line 1 BL01D 3.3 4.6 24,830
09/28/2010 Calibration Line 2 BL02A 3.8 5.3 28,497
09/28/2010 Calibration Line 2 BL02B 3.2 4.5 24,193
09/28/2010 Calibration Line 2 BL02C 3.5 4.9 26,440
09/28/2010 Calibration Line 2 BL02D 3.3 4.6 25,082
09/28/2010 Calibration Line 2 BL02E 4.5 6.3 34,250
09/28/2010 Validation Line 1 BL03A 3.2 4.5 24,072
09/28/2010 Validation Line 1 BL03B 4.0 5.6 29,974
09/29/2010 Validation Line 3 BL05A 3.1 4.4 23,709
09/29/2010 Validation Line 3 BL05B 4.1 5.7 30,775
09/29/2010 Validation Line 3 BL05C 3.9 5.4 29,283
09/29/2010 Validation Line 3 BL05D* 7.0 9.8 52,705
Average for 12 Low Altitude Passes 27,114
Standard Deviation for 12 Low Altitude Passes 3,390
Result for 1 High Altitude Pass 52,705 *Pass BL05D was intentionally conducted at high target altitude (7-8 m); all other passes were conducted at a conventional low target altitude (3-4 m). Level of Success. The success criterion for survey production rates of greater than 42,000 m2/hour based on a 5 m altitude (7 m swath width) and 1.5 m/s (3 kt) tow speed was ultimately not applicable to the LLSS demonstration because the applied target altitude for most passes was 3-4 m. The average low altitude production rate of 27,114 m2/hour obtained for Year 2 was slightly below the production rate of 30,240 m2/hour that would be expected when operating at 4 m altitude based on the known capabilities of the system. The high altitude production rate of 52,705 m2/hour was approximately equal to the 52,920 m2/hour production rate that would be expected when operating at 7 m altitude. A level of uncertainty exists in these comparisons however, because it is essentially impossible to maintain the FOCUS vehicle at a constant tow speed and altitude for an entire survey due to prevailing winds and currents, vessel motion caused by sea state and seafloor topography. Therefore the production rates calculated for this demonstration are always dependent on the constantly changing tow speed and altitude and are ultimately a function of the vessel captain’s ability to maintain the target tow speed and the FOCUS pilot’s ability to maintain the target altitude. Variances for these variables were small during the LLSS demonstration, which reduced the level of uncertainty in the production rate calculations.

Final Report LLSS for UXO Characterization
86
7.6. OBJECTIVE: PROBABILITY OF SURROGATE TARGET DETECTION Level of Accomplishment. The probability of surrogate target detection was originally defined as the number of targets correctly identified as either UXO simulators (ordnance) or dummy objects (non-ordnance) in proportion to the number of total targets placed as part of the validation (blind) element of the survey. Due to varying degrees of success in acquiring successful LLSS images under different environmental conditions, however, the definition of this metric was ultimately changed to the number of targets correctly identified as either ordnance or non-ordnance compared to the number of total targets surveyed, thus removing the negative bias produced by targets that were placed but could not be imaged at all due to poor water clarity; this value is equal to the Tier I classification results described in Section 6.4. Data for this objective was taken only for the best pass from the Year 2 validation effort (BL05C) and produced a final probability of 89%. Level of Success. The success criterion of 90% for probability of surrogate target detection was not technically met during the validation element, but it is important to realize that the final Tier I classification value of 89% was based on an extremely limited sample size (only nine targets surveyed) and the one target missed was the smallest and most difficult to identify dummy object. Thus these results are uncertain and would be expected to exceed 90% (and approach 100%) with an increased blind testing sample size featuring the larger ordnance and non-ordnance targets. 7.7. OBJECTIVE: PROBABILITY OF FALSE ALARM Level of Accomplishment. The probability of false alarm was defined as the number of dummy objects falsely identified as UXO simulators (false positives) compared to the total number of dummy objects surveyed on the validation strings; this value is equal to the FPR described in Section 6.4. Data for this objective was taken only for the best pass from the Year 2 validation effort (BL05C) and produced a final FPR of 0%. Level of Success. The success criterion of less than 10% for probability of false alarm was met during the validation element, but this result was based on an extremely limited sample size (only four dummy objects surveyed). However, due to the relatively high level of certainty in the identifications from the high quality LLSS images, this result would be expected to persist with a larger sample size featuring similar high quality images. 7.8. OBJECTIVE: PROBABILITY OF FALSE NEGATIVE Level of Accomplishment. The probability of false negative was defined as the number of UXO simulators falsely identified as dummy objects (false negatives) compared to the total number of UXO simulators surveyed on the validation strings; this value is equal to the FNR described in Section 6.4. Data for this objective was taken only for the best pass from the Year 2 validation effort (BL05C) and produced a final FNR of 0%.

Final Report LLSS for UXO Characterization
87
Level of Success. The success criterion of less than 10% for probability of false negative was met during the validation element, but this result was based on an extremely limited sample size (only four UXO simulators surveyed). Similar to the probability of false alarm results above, this result would be expected to persist with a larger sample size featuring similar high quality images. 7.9. OBJECTIVE: TARGET LOCATION ACCURACIES Level of Accomplishment. Target location accuracy was defined as the horizontal (x, y) position differential between identified targets as they appear in the LLSS data compared to the known positions that were determined by shipboard communication with an acoustic pinger (beacon) held over each target by divers. The original demonstration plan called for the diver determined (known) positions to be obtained for all 20 targets on a calibration string, but challenging field conditions and limited dive times in deep water encountered during the Year 1 survey only allowed for diver determined (known) positions to be obtained for three targets. Divers were not used during the Year 2 survey and instead the mobile beacon was attached directly to the deployed target. A known position was obtained in this manner for only one target during Year 2. The accuracy results for both the Year 1 and Year 2 surveys are discussed in Section 6.3.2. The Year 1 measurements suggested a difference of approximately 40 m between the LLSS positions and known positions for three targets, but these poor results were considered unreliable and attributed to a series of navigation system errors that produced a consistent offset (in opposite directions) for both the LLSS positions and the diver determined positions since they were all based on the same USBL navigation system. Following the necessary corrections to the USBL navigation system and application of appropriate antenna offset correctors, the Year 2 measurements produced a difference between the LLSS position and known position for one target of approximately 2 m when using CleanSweep2 software and approximately 3 m when using GeoDAS software (Figure 6.3-9). These Year 2 values are considered the best quantification of target accuracy produced during the LLSS demonstration. Level of Success. The success criterion for target location accuracies of a horizontal (x,y) difference of +/-50 cm from the known position for a particular target was not met during the LLSS demonstration. However, the 2 m accuracy produced by the CleanSweep2 software coupled with the clear LLSS image of the target associated with this position is considered acceptable for the hypothetical reacquisition of proud of bottom targets during future surveys. 7.10. OBJECTIVE: UXO PARAMETER ESTIMATES Level of Accomplishment. UXO parameter estimates were defined as the length and width of each correctly identified target from the LLSS data compared to the known sizes of each target as measured prior to deployment; this parameter is equal to the target morphometry discussed in Section 6.3.1. When separated by vector, the Year 1 target dimension measurements generated from the LLSS data were within 3.0 +/- 3.5 cm of the actual target dimension in the long track

Final Report LLSS for UXO Characterization
88
direction, but were no better than 50.0 +/- 35.8 cm of the actual target dimension in the across track direction. The poor results for the across track direction were attributed to a software error in the application of sensor altitude to magnify LLSS imagery during data collection, which manifested itself as an apparent “stretch” effect seen in some of the perpendicular images. Following the necessary correction to the sensor altitude application, thus removing the effects of orientation on image proportions, the Year 2 target dimension measurements generated from the LLSS data were 3.4 +/- 4.3 cm for all lengths and widths combined when using the GeoDAS display (Table 6.3-2). These Year 2 values are considered the best quantification of target measurement capabilities produced during the LLSS demonstration. Level of Success. The success criterion of LLSS measured dimensions (length, width) for a particular target within +/-5 cm of the actual dimensions was successfully met during the LLSS demonstration based on the Year 2 data using the GeoDAS display. 7.11. OBJECTIVE: SURVEY COVERAGE Level of Accomplishment. Survey coverage was defined as the percentage of the total survey area that was not covered during survey operations and would thus require re-mapping in order to achieve full coverage. A particular area was considered to be covered if the LLSS sensor passed over that spot and data collection was attempted regardless of whether successful images of the seafloor could be achieved. Because image success is ultimately based on water quality conditions that are independent of the LLSS, successful imagery is not an accurate indicator of whether an area was covered. Instead, coverage is a function of whether a particular area stays in the LLSS field of view. This objective was assessed during the Year 1 survey by comparing the total number of targets visible in the LLSS imagery with the total number of targets deployed (i.e., the total survey area). Although image success is not typically an accurate indicator of LLSS coverage as described above, the number of targets seen was used as a qualitative measure of coverage in this case because the objects were evenly spaced a known distance apart along the survey line and water conditions were of such quality to allow successful LLSS imagery to be achieved over the entire target string. In other words, there was a direct correlation between targets that passed under the LLSS field of view and successful images produced. Of the 20 possible targets placed along the Year 1 target string, 19 were imaged during Pass 1. Therefore, 95% of the total survey area was considered covered and only 5% of the survey area was missed (i.e., requiring re-mapping) when the target string left the LLSS field of view for approximately 5 seconds. All 20 possible targets were imaged during Pass 2, thus achieving 100% coverage of the total survey area and 0% missed. This objective was not further evaluated during the Year 2 survey because water quality conditions did not allow for successful LLSS imagery to be achieved over the entire length of any of the target strings. Thus there was no way of quantifying whether the target string was consistently maintained in the LLSS field of view.

Final Report LLSS for UXO Characterization
89
Level of Success. The survey coverage success criterion of less than 5% of the total survey area missed was met for this demonstration based on the Year 1 data. 7.12. OBJECTIVE: EASE OF USE Level of Accomplishment. Ease of use was defined as the level of effort needed to mobilize and operate the LLSS, particularly in variable weather and water conditions, as an indicator of whether the technology is cost effective in terms of vessel time and manpower. This objective was assessed during both the Year 1 and Year 2 surveys by receiving feedback from technicians and project managers on the usability of the LLSS compared to other survey technology with which they have worked in similar conditions. The major storm that passed through the survey area during Year 1 presented unique challenges to system use in terms of increased sea state and turbidity. Level of Success. The ease of use success criterion of “relative ease” in achieving project goals and producing high quality data was met for this demonstration. Overall, the system is easy to mobilize and demobilize given proper planning to ensure the necessary equipment (e.g., cranes, welders, cables, etc.) is present. Once on the survey vessel, the LLSS/FOCUS is easy to deploy and recover in a variety of sea states. The potential for entanglement or collision with underwater obstacles or the bottom is low assuming accurate characterization of the survey area and proper piloting. However, the ability to produce high quality LLSS images is highly dependent on water clarity and level of ambient light at the time of data collection, both of which may be out of the control of the survey team. 7.13. OBJECTIVE: SYSTEM RELIABILITY Level of Accomplishment. System reliability was defined as the time lost during the survey effort due to equipment breakdowns or other unforeseen technological problems as a percent of the overall survey time. Time lost each survey day for LLSS equipment related reasons was recorded in the survey logbooks for both the Year 1 and Year 2 surveys. These values excluded time lost for weather delays, target string deployment, recovery and repair, and LLSS hangups caused by unforeseen impediments in the survey area (e.g., lobster gear). During the Year 2 demonstration, one entire day of planned operations was lost due to the need for required LLSS equipment repairs. These repairs included time spent reterminating wired connections, purchasing new parts (e.g., O-rings) and waiting for marine epoxy to set. Level of Success. The system reliability success criterion of less than 1% of the entire survey time lost as a result of LLSS failure was not met for this demonstration due to time spent on unplanned equipment repairs during the Year 2 survey. However, this down time coincided with unforeseen delays caused by site access restrictions, so the time lost did not ultimately impact the final survey time. Due to the unpredictable nature of working with electronic equipment underwater, some amount of equipment failure requiring repair time is to be expected for all LLSS operations.

Final Report LLSS for UXO Characterization
90
7.14. OBJECTIVE: MAINTENANCE Level of Accomplishment. Maintenance was defined as the amount of time (minutes) per hour of operations spent on equipment upkeep or repairs compared to time spent processing data or performing other project related tasks. Time spent each survey day on upkeep and repairs was recorded in the survey logbooks for both the Year 1 and Year 2 surveys. Once mobilized for active survey, the required maintenance for the LLSS (not including unforeseen breakdowns and repairs) is low. Once on deck following a survey pass, the FOCUS must be visually checked for debris (e.g., seaweed) and the breakaway line mounts must be taped back into position for safe launch and recovery on the following deployment. Both of these tasks can be accomplished in a matter of minutes. No extensive cleaning, decontamination or calibration steps are required between deployments. At the beginning of each survey day, the GAPS/PHINS inertial navigation system must be calibrated prior to LLSS deployment by having the survey vessel steam in a figure eight pattern with the FOCUS vehicle on deck to allow the gyroscopes to properly align with magnetic north and the operator to confirm that they are communicating properly with the topside controls. During the Year 2 survey, this task was accomplished each day in less than 10 minutes. Level of Success. The maintenance success criterion of less than 10 minutes per hour of survey operation was met for this demonstration.

Final Report LLSS for UXO Characterization
91
8.0. COST ASSESSMENT This section is intended to provide sufficient cost information such that a professional involved in the field could reasonably estimate costs for implementation of the LLSS technology at a given site. In addition, this section provides a discussion of the cost benefit of the LLSS technology in comparison to other marine UXO survey approaches. 8.1. COST MODEL The cost model for this survey is based upon potential expenses for the site preparation, mobilization, survey operation, demobilization and survey product tasks. As per the cost analysis guidance established in the Year 2 Demonstration Plan, the cost model also includes a breakdown of the approximate capital costs for developing and fielding the equipment. The complete cost breakdown for conducting an LLSS survey is shown in Table 8.1-1. The dollar amounts presented for each line item therein are based on five active field survey days off the coast of San Diego, with one additional day each for mobilization and demobilization. Table 8.1-1. Cost breakdown structure for the Year 2 LLSS demonstration conducted off the
coast of San Diego.
Cost Element
Data Tracked During Demonstration Estimated Cost
($K)
Capital Costs
Capital Equipment Purchase 997.0 Ancillary Equipment Purchase 30.1 Software Purchase (GeoDAS) 10.0 Equipment Development (in-house service center) 22.0 Equipment Integration 2.5 Equipment Shakedown and Testing 3.5
Site Preparation Costs
Evaluation Trip/Meetings N/A UXO Simulator Purchase 2.5 Design/Construct Target Strings 4.4 Develop HASP 5.0 Develop/Approve Demonstration Plan 17.0
Mobilization Costs
Personnel Travel (airfare, lodging, vehicle) 6.0 Equipment Prep and Loading (at SAIC warehouse) 4.4 Equipment Transport (truck and forklift rental) 0.9 Equipment Unloading (dockside) 13.0 Equipment Setup (crane and welding) 3.5
Survey Operation Costs
Item Costs Generator Fuel 1.0 Data Storage (external hard drive) 0.3 Software Rental (CleanSweep2) 3.0 Equipment Spares Used N/A Miscellaneous Logistics (shipping, expendables) 0.8 Daily Costs Daily Labor Support Costs (6 workers) 13.0 GAPS/PHINS Rental and Engineering Support (1 worker) 2.9 Survey Vessel 8.0 Unit Costs (3 Survey Days) Survey Cost/Hectare (search and recovery) 4.5

Final Report LLSS for UXO Characterization
92
Cost Element
Data Tracked During Demonstration
Estimated Cost ($K)
Survey Cost/Hectare (wide area assessment) 0.65 Cost/ Survey Hour (search and recovery) 22.1 Cost/ Survey Hour (wide area assessment) 3.2
Demobilization Costs Equipment Breakdown (crane and welding) 3.5 Equipment Prep and Loading (dockside) 13.0 Equipment Transport (truck and forklift rental) 0.9 Equipment Unloading (at SAIC warehouse) 4.4 Personnel Travel (airfare, lodging, vehicle) 6.0
Survey Products Data Processing 17.7 Target Analysis 3.9 Survey Graphic Products 3.9 Survey Report 0.5
8.1.1. Capital Costs The capital costs for the development and fielding of the LLSS equipment include approximations for both capital and ancillary equipment purchases, software purchases, engineering design and development costs (i.e., in-house service center), component and system integration costs, and shakedown and testing costs. They do not include costs for project management, project reporting, maintaining the support facility or other incidentals such as the purchase of specialized equipment to support the development, site license and permit fees, etc. The capital, ancillary and software purchase costs listed on Table 8.1-1 represent the declared asset values for these items within the SAIC service center. Capital equipment includes all specific hardware components needed to complete an LLSS survey in the manner described in this report; this equipment includes everything associated with the SM-2000 LLSS itself (sensor, console, electronics bottle, spares), the FOCUS vehicle (Kongsberg altimeter, control console, fiber optics bottle, SVP sensor, frame and chassis), the FOCUS winch (cable drum, cable counter, slip ring, tow cable), and the supporting geophysical sensors (EdgeTech side-scan sonar/sub-bottom profiler, EdgeTech console). In contrast, ancillary equipment includes the diesel generator needed to power the FOCUS winch; this is an SAIC owned item but could theoretically be replaced with any generator of similar size or shipboard power if the survey vessel can provide sufficient output. The software value represents the cost for purchasing the proprietary GeoDAS platform from the single sole source provider OIC, Inc. that is needed at minimum to operate the LLSS. It should be noted that the overall LLSS as configured for this demonstrations represents a prototype system that was developed by SAIC and a similar system cannot simply be purchased “off the shelf” by an outside contractor. In order to create a duplicate system, the individual components would have to be purchased separately from the manufacturer and then assembled in the manner outlined in Section 2.1. Although the capital equipment purchase costs for this system are listed at $997K, this value reflects the original cost of the system when constructed in the 1990s. It is estimated that a duplicate system could be constructed from more modern hardware for less cost.

Final Report LLSS for UXO Characterization
93
8.1.2. Site Preparation Costs Site preparation costs for LLSS operations conducted in the manner described in this report are relatively minor compared to other UXO survey approaches. In contrast to geophysical based (i.e., magnetometer) technologies such as the marine towed array (MTA; SAIC 2008), the LLSS is an optical based technology and thus does not require substantial effort to be spent on a geophysical systems verification (GSV) prove-out task or establishment of fixed calibration and test sites featuring magnetic targets placed by divers or otherwise deployed by subcontractors prior to the survey. Site preparation for the LLSS demonstration does, however, involve purchase of the materials (e.g., line, anchors, floats, shackles) needed to construct the target string as well as the time needed for the survey personnel to prepare and configure these items shoreside prior to the survey. Also required is the purchase of the targets themselves; because the official UXO simulators are only available directly from a U.S. Army supplier, the cost for these items is relatively high ($2.5K for the set) compared to common inert items (e.g., pipes). The target string expenses represent a one-time cost, however, since these items can be reused for multiple demonstrations (assuming they are not lost during deployment/recovery operations). Furthermore, because LLSS operations are strictly visual and do not directly support any target investigation or recovery operations (aside from topside recovery of the target strings for reuse), the demonstration is considered non-intrusive, which significantly reduces the requirements for development of a detailed health and safety plan (HASP) involving UXO and/or munitions and explosives of concern (MEC) operations; certified UXO specialists are not obligatory as part of the survey team nor is a separate ESS required. Similarly, deployment and recovery of target strings from the survey vessel eliminates the need for diver support as well as an associated dive plan and added health and safety requirements. Instead, the HASP for typical operations of towed sensors on a large offshore vessel and an appropriate laser safety plan are the only documents required to address the typical hazards associated with LLSS operations. The Demonstration Plans produced for both the Year 1 and Year 2 surveys are expected to be applicable almost in their entirety to any future demonstrations of this technology, which would significantly reduce the effort needed for the planning stage. 8.1.3. Mobilization Costs The mobilization costs for the LLSS are made up of the preparation, transport and setup costs for the system as well as travel costs for the specialized personnel required to operate the technology. The values presented for mobilization in Table 8.1-1 are based on transportation of the system from the SAIC Marine Operations facility on Ponderosa Avenue in San Diego to the SPAWAR dock on San Diego Bay, as well as travel for the SAIC employees participating in the demonstration; of the six total employees, two were local to San Diego and thus incurred no travel costs, but the remaining four were required to travel to San Diego from Newport, Rhode Island. Because the overall LLSS contains several extremely large pieces of equipment weighing several thousands of pounds (e.g., FOCUS vehicle, generator, hydraulic winch, piloting console, navigation pole mount, several cases of miscellaneous hardware, etc.), rentals of both a large forklift and a flatbed truck were needed to complete the transport task. The loading (conducted at the SAIC Marine Operations facility) and the unloading (conducted at the

Final Report LLSS for UXO Characterization
94
SPAWAR dock) tasks each encompassed one day and were conducted by the survey personnel as well as additional SAIC employees from the local facility as needed. Due to the overall size of the LLSS components (especially the generator and winch), a shoreside 70-ton crane with a long-boom was required in addition to the shipboard crane to safely load the system from the dock onto the survey vessel. Furthermore, welders were needed to attach mounts for the generator, winch and navigation pole directly to the deck of the survey vessel to allow for the structural tie-down support required for safe operation on a rolling ship. Both the shoreside crane and welding services were provided by local subcontractors, the costs of which are included in the equipment setup task. In general, mobilization costs for the LLSS demonstration were relatively low due to the fact that the surveys were conducted in San Diego, thus limiting equipment transport to approximately 15 miles and eliminating travel costs for a portion of the personnel. Should future LLSS demonstrations be conducted at remote sites, equipment mobilization costs would be expected to rise substantially as the large equipment would have to be shipped either via flatbed truck or barge to the destination. However, personnel mobilization costs would be expected to decrease as less technicians would be required for typical LLSS operations than were needed for the demonstration. 8.1.4. Survey Costs The survey operation costs presented in Table 8.1-1 are broken down into both item costs and daily costs and are also shown in terms of unit costs per coverage area and survey hour. These costs are all based on the Year 2 demonstration, which took place over a period of three active survey days not including the mobilization and demobilization days, the one wet test day in San Diego Bay, or the one day spent on the dock waiting for security clearance during which time equipment maintenance was performed. Item Costs. The individual lump sum item costs for the Year 2 survey included diesel fuel for the generator (needed to operate the FOCUS winch), purchase of a dedicated external hard drive for data management (needed for daily data backup and transport), rental of the proprietary CleanSweep2 software (minimum one week block), and costs for miscellaneous logistics (e.g.., shipping of toolboxes and health and safety equipment, purchase of expendable items such as small tools and paper towels, etc.). Based on the results presented in Section 6, CleanSweep2 may not be required depending on the scope of work to analyze images for future production surveys; a combination of GeoDAS (for acquisition) and SAIC software (for post-processing) could be used instead. The repair and maintenance costs for the LLSS specific to this demonstration have not been calculated because the system has not yet been remobilized to support another UXO survey. Thus the cost for equipment spares is not applicable to this assessment. Instead, the predicted routine maintenance and repair costs typically associated with any LLSS survey are included in the equipment development (i.e., in-house service center) section of the capital costs.

Final Report LLSS for UXO Characterization
95
Daily Costs. The survey vessel R/V Acoustic Explorer was provided directly by the Navy at a daily rate determined by a pre-existing long-term service contract between the vessel owner and SPAWAR. The Year 2 demonstration was performed by six SAIC personnel not including the vessel crew or the SPAWAR PM. Each member of the SAIC crew possessed specialized skills critical to the demonstration and was responsible for filling a unique role during active survey operations; these roles included PM, FOCUS preparation, FOCUS pilot, LLSS data acquisition (software operator), side-scan data acquisition (software operator) and target manager. All survey personnel are “on the clock” at all times when on the survey vessel. As described in Section 5.6, the target manager remained on deck for most of the survey and, along with the SPAWAR PM, was responsible for executing the blind testing target arrangements unknown to the rest of the data acquisition team. All six members of the SAIC crew would be required to maximize efficiency of future LLSS demonstrations, but similar surveys could reasonably be completed with four or five-member survey teams. The GAPS/PHINS navigation system was rented for the survey based on daily rates for the individual components as determined by the IXSEA company. These rates included separate amounts for the individual GAPS and PHINS units as well as three transponder/responder beacons. Also included in the GAPS/PHINS daily costs were travel, per diem and compensation rates for one IXSEA engineer who also participated in the Year 2 survey. The role of this individual was to set up and operate the IXSEA equipment during active survey days as well as to provide any necessary onsite engineering or technical support throughout the operation. Similar onsite support may not be integral to all LLSS demonstrations, but it is greatly beneficial if the survey crew is not familiar with operation of the GAPS/PHINS system, as well as to ensure that any subsea navigation problems are addressed in a time efficient manner. Unit Costs. Similar to both the item and daily costs described above, the unit costs for the LLSS are based on the Year 2 demonstration only. The survey cost/hectare (search and recovery) value provided in Table 8.1-1 ($4.5K) was calculated as the sum of the item and daily costs for three survey days ($76.8K) divided by the total area covered by all the individual passes conducted during those three days (17 Ha); this area did not include vessel turnaround time between each pass during which data was not logged. A breakdown of the swath area covered by each individual pass conducted during the three survey days is provided in Table 8.1-2. As LLSS coverage is ultimately dependent on FOCUS altitude and tow speed, the cost/hectare assumes a conventional low altitude swath of 4 m and tow speed of 1.5 m/s. Table 8.1-2. Survey time and area covered for each LLSS pass conducted during the Year 2
demonstration.
Date
Target Line Description
Pass ID
Time on Pass Swath Area (min) (hrs) (m2) (Ha)
09/27/2010 Calibration Line 1 Test 5.4 0.09 4442.4 0.4 09/27/2010 Calibration Line 1 Test 5.4 0.09 4442.4 0.4 09/27/2010 Calibration Line 1 Test 5.4 0.09 4442.4 0.4 09/27/2010 Calibration Line 1 Test 4.6 0.08 3748.2 0.4

Final Report LLSS for UXO Characterization
96
Date
Target Line Description
Pass ID
Time on Pass Swath Area (min) (hrs) (m2) (Ha)
09/27/2010 Calibration Line 1 Test 5.4 0.09 4442.4 0.4 09/27/2010 Calibration Line 1 Test 4.5 0.08 3699.2 0.4 09/27/2010 Calibration Line 1 Test 5.4 0.09 4442.4 0.4 09/27/2010 Calibration Line 1 Test 5.4 0.09 4442.4 0.4 09/27/2010 Calibration Line 1 Test 5.4 0.09 4442.4 0.4 09/27/2010 Calibration Line 1 Test 3.5 0.06 2883.6 0.3 09/28/2010 Calibration Line 1 BL01A N/A N/A N/A N/A 09/28/2010 Calibration Line 1 BL01B 5.5 0.09 7930.4 0.8 09/28/2010 Calibration Line 1 BL01C 7.5 0.13 6532.8 0.7 09/28/2010 Calibration Line 1 BL01D 5.5 0.09 6526.4 0.7 09/28/2010 Calibration Line 2 BL02A 11.1 0.19 11246.7 1.1 09/28/2010 Calibration Line 2 BL02B 10.7 0.18 7210.6 0.7 09/28/2010 Calibration Line 2 BL02C 7.3 0.12 4367.0 0.4 09/28/2010 Calibration Line 2 BL02D 10.9 0.18 10825.9 1.1 09/28/2010 Calibration Line 2 BL02E 7.6 0.13 5625.6 0.6 09/28/2010 Validation Line 1 BL03A 7.4 0.12 4257.3 0.4 09/28/2010 Validation Line 1 BL03B 6.1 0.10 3385.3 0.3 09/29/2010 Validation Line 1 BL03C 10.9 0.18 9772.9 1.0 09/29/2010 Validation Line 1 BL03D 4.7 0.08 3922.1 0.4 09/29/2010 Validation Line 2 BL04A 5.0 0.08 2678.2 0.3 09/29/2010 Validation Line 2 BL04B 2.0 0.03 968.2 0.1 09/29/2010 Validation Line 2 BL04C 10.9 0.18 5518.9 0.6 09/29/2010 Validation Line 2 BL04D 4.7 0.08 2828.0 0.3 09/29/2010 Validation Line 3 BL05A 10.8 0.18 12188.5 1.2 09/29/2010 Validation Line 3 BL05B 10.8 0.18 8189.7 0.8 09/29/2010 Validation Line 3 BL05C 8.6 0.14 6842.9 0.7 09/29/2010 Validation Line 3 BL05D 10.0 0.17 8255.3 0.8
Three Day Total 209 3.5 170,499 17 N/A = Pass attempted but no LLSS data collected; pass not included in total. It is important to note, however, that this unit cost reflects the actual results of the Year 2 survey during which coverage was focused on very specific (i.e., small) swaths of seafloor along which known targets were deployed (i.e., search and recovery mode); the goal of this demonstration was not to sweep broad areas of the seafloor looking for unknown targets (i.e., WAA mode). As described in Section 5.6, substantial portions of the three survey days were thus spent searching for suitable water quality conditions and deploying/recovering the target strings and as a result were not spent actively collecting LLSS data. Since the cost/hectare is ultimately dependent on daily survey costs, these activities are included in the calculation. As a result, the cost/hectare value is greatly increased for search and recovery. Since the ultimate goal of this cost assessment is to evaluate the performance of the technology for future full-scale production surveys (i.e., not targeting specific seeded items), the cost/hectare was extrapolated for WAA mode by dividing the total costs for three survey days ($76.8K) by the product of survey production rate (as determined in Section 7.5) and the total survey time expected for three WAA survey days (24 hours). An estimate of 8 hours per WAA survey day was used for this calculation assuming a 12 hour working day with 4 hours spent on vessel steam time and turnaround time between passes (no data logged); this parameter could theoretically

Final Report LLSS for UXO Characterization
97
increase to 20-24 hours assuming round-the-clock operations with some maintenance time, steam time and turnaround time. The survey cost/hectare (wide area assessment) value provided in Table 8.1-1 ($0.65K) is based on the production rate for a conventional low altitude (4 m) pass. In contrast to the survey cost/hectare, the cost/survey hour (search and recovery) value provided in Table 8.1-1 ($22.1K) was calculated as the total cost for three survey days ($76.8K) divided by the precise amount of total time spent collecting data over selected target areas (3.5 hours; obtained from the data logging times embedded in the GeoDAS files). A breakdown of the time spent actively logging data for each individual pass conducted during the three survey days is provided in Table 8.1-2. Again, this cost is reflective of actual results for the Year 2 survey conducted largely in search and recovery mode; thus time spent not actively collecting LLSS data is not included in the calculation. As a result, this value is also greatly increased relative to WAA mode. In order to extrapolate the cost/survey hour for WAA mode, the WAA cost/hectare (described above) was multiplied by the production rate (as determined in Section 7.5). The cost/survey hour (wide area assessment) value provided in Table 8.1-1 ($3.2K) is based on the production rate for a conventional low altitude (4 m) pass. 8.1.5. Demobilization Costs Demobilization for the LLSS is best described as the inverse of the mobilization. All of the same manpower and rental equipment is required and all of the same tasks are performed, just in the opposite order. Thus the costs for the two tasks are assumed to be equal and cost breakdown for demobilization includes the same line items as mobilization (see Section 8.1.3). For the Year 2 LLSS demonstration, demobilization occurred at the SPAWAR dock on San Diego Bay. The same shoreside crane and welding companies were subcontracted for the equipment breakdown and the same personnel (survey team plus additional staff from the local SAIC facility) performed the dockside equipment preparation and loading. Once again, rentals of both a large forklift and a flatbed truck were required to complete the transport task; although the same exact equipment was used, these, rentals were separate from the mobilization (i.e., the equipment was returned during the active survey days and then rented again in order to reduce costs). Unloading, cleaning and storage of the equipment was then performed at the SAIC Marine Operations facility. The dockside loading and the warehouse unloading tasks were each performed in one day. Finally, the SAIC Newport staff was required to travel home from San Diego. 8.1.6. Survey Product Costs The survey product costs for the LLSS include personnel hours spent on data processing (i.e., viewing LLSS data in the various software applications), target analysis (i.e., measurements and positioning), survey graphic production (i.e., saving and organizing final target images) and survey reporting (i.e., producing a summary of data collection within one week of the conclusion of survey activities). The cost of the various survey products for the Year 2 LLSS demonstration are provided in Table 8.1-1. The products themselves are described in the text of this report.

Final Report LLSS for UXO Characterization
98
8.2. COST DRIVERS The primary cost drivers for the LLSS demonstration were the daily labor costs for the specialized and relatively large staff (six SAIC technicians plus the IXSEA engineer) needed to operate the equipment and the daily charter rate for the survey vessel. Shorter and less complex surveys could likely be accomplished with less personnel as these operations become more routine. Although vessels other than the R/V Acoustic Explorer are capable of supporting the LLSS technology, any vessel that is contracted must be of sufficient size to physically handle the large winch and generator as well as feature an A-frame large enough to launch the FOCUS vehicle. The vessel charter was arranged by SPAWAR through an existing service contract. Should a large research vessel similar to the R/V Acoustic Explorer be chartered from an outside contractor, the daily costs could substantially increase compared to the amount provided for this line item in Table 8.1-1. Furthermore, the survey vessel costs incurred for the Year 2 demonstration were based on approximately 12-hour survey days with all personnel returning to shore each night. Should a potential future survey occur offshore with all personnel required to live aboard the survey vessel during operations, the vessel costs would be expected to escalate accordingly, though additional costs for shoreside lodging and per diem would be avoided. Night operations would be recommended for relatively shallow water sites to avoid the effects of ambient light in the water column (see Section 2.3), but would not be a limiting factor for deep water sites. In addition to the cost drivers described above, mobilization and demobilization costs must also be factored into the planning of any future demonstrations. As described in Section 8.1.3, the mobilization costs for the Year 2 survey were relatively low since most of the large equipment did not have to be transported far from the SAIC Marine Operations facility in San Diego to the SPAWAR dock on San Diego Bay. Should future surveys occur cross-country or overseas, equipment shipping costs could rise into the tens of thousands of dollars. Any survey occurring outside of San Diego would also require increased travel costs for part of the SAIC staff needed to operate the equipment. Finally, another cost driver that did not factor into the Year 2 demonstration but that may impact future surveys are recovery costs for maintenance and/or replacement of the capital equipment. As the present LLSS equipment was manufactured nearly 20 years ago, several of the digital components are oversized compared to present day equivalents and some replacement parts are difficult to obtain. A newly-produced commercial system would be expected to be more reliable and less complex to integrate and operate, thus reducing pressure of this driver. A newer FOCUS vehicle with a smaller footprint and reduced power requirements is currently being evaluated. 8.3. COST BENEFIT It is difficult to evaluate the cost benefit of the LLSS compared to other marine UXO survey approaches in a traditional sense because no alternative commercial technology exists that is

Final Report LLSS for UXO Characterization
99
capable of producing a comparable optical based survey product at a similar production rate suitable for WAA. In terms of simply mapping and identifying targets, the costs for an LLSS survey can be compared to costs for a conventional magnetometer survey using one of several marine magnetometer platforms (e.g., MTA, transverse gradiometer) for anomaly mapping. In terms of producing visual images of targets, LLSS costs can be compared to intrusive investigation and underwater video surveys using either divers or an ROV. Underwater video would produce an optical based survey product similar to that of the LLSS, but the production rate would be substantially reduced. Each of these alternative approaches would also provide similar quality three-dimensional mapped data files that will support detailed target analyses, creation of survey graphics and GIS documents, and subsequent target relocation, investigation, and recovery operations. Any comparison between the LLSS and alternative technologies must also assume that potential targets are proud of the seafloor for WAA objectives, otherwise they would not be detectable by the LLSS. Table 8.1-3 below provides the comparative unit costs for the LLSS and alternative UXO survey approaches including the MTA (magnetometer survey to identify magnetic anomalies only), divers (performing intrusive investigation to identify targets following a magnetometer survey) and an ROV (performing remotely controlled excavation to identify targets following a magnetometer survey). The MTA costs were taken as listed from the Cost and Performance Report for UXO Detection and Characterization in the Marine Environment (ESTCP Project MM-0324; ESTCP 2009). The diver costs were generated from standard SAIC rates for providing a dive team to perform intrusive investigation and underwater videography in a marine offshore environment. These values are based on an estimated daily rate of $18K for a six-man dive team (one supervisor, four UXO divers, one UXO safety diver) assuming six magnetic anomalies covering one acre of survey area (based on 2.75 linear miles of magnetometer survey) are intrusively investigated per day to a depth of one foot below the sediment-water interface, the diving occurs in clear and open water to allow access by divers, and the dive depths do not exceed 30 feet from surface. This daily rate also incorporates joint travel regulations per diem and reflects required overtime labor for diving operations. However, the daily rate for divers could change substantially depending on per diem rates for specific locations, number of dive teams utilized, local rates for boats and support equipment and water conditions at the site. For Table 8.1-3, the survey cost/hectare for divers was calculated by dividing the $18K daily rate by the one acre (0.4 Ha) are expected to be covered in that day. In contrast, the cost/survey hour was calculated by dividing the $18K daily rate by eight survey hours, assuming a twelve hour work day with four hours spent on steam time and equipment setup. Finally, the ROV costs are based on competitive bidding for ROV intrusive investigation and underwater video surveys at a marine offshore area.

Final Report LLSS for UXO Characterization
100
Table 8.1-3. Cost benefit analysis for the LLSS compared to alternative marine UXO survey approaches.
Survey Approach
Survey Cost/Hectare ($K)
LLSS 4.5 MTA (magnetic anomaly mapping only) 1.1 Divers (video and/or intrusive) 45 ROV (video and/or intrusive) 10.0 Note: All unit costs include equipment, personnel, mobilization, demobilization and planning.
The information provided in Table 8.1-3 shows that the LLSS is more expensive than an MTA magnetometer survey both per hectare and per hour (mainly due to large personnel and survey vessel requirements). It is important to realize, though, that the MTA does not generate real-time visual images of the targets; it only identifies the locations of magnetic anomalies as spikes in the magnetic return. The LLSS is less expensive and more efficient than a full intrusive and/or underwater video investigation using divers or an ROV in terms of coverage, but more expensive than these techniques in terms of time. The latter can be explained by the fact that the LLSS has relatively large equipment and personnel requirements, but actual data acquisition (i.e. active survey time) occurs very quickly once the sensor is in the water. Neither divers nor an ROV can generate visual images of the seafloor unless they are accompanied by an underwater camera, but they are typically used to investigate targets in place or recover them for identification at the surface following a magnetometer survey. Since the LLSS can both locate targets and provide visual images of them for identification, this technology can be seen as combining the best aspects of the other approaches into one integrated package. To that end, the per unit area costs associated with the LLSS are less than the costs of the other approaches combined, thus making the LLSS a relatively cost effective and versatile method for underwater UXO characterization.

Final Report LLSS for UXO Characterization
101
9.0. IMPLEMENTATION ISSUES This section is intended to provide information that will aid in the future implementation of the LLSS technology. It is also meant to describe lessons learned during the demonstration and discuss other pertinent issues such as potential environmental regulations that may apply to the use of the technology, end-user concerns, reservations, and decision-making factors, relevant procurement issues, current availability of the technology, and any specialized skills or training needed to implement the technology. Brief descriptions and references for other documents such as guidance or protocols are provided as appropriate. 9.1. ENVIRONMENTAL CHECKLIST There were no environmental issues associated with the LLSS demonstration. All operations were non-intrusive and thus did not require permits or explosives safety submissions and were not subject to any other local environmental regulations. 9.2. OTHER REGULATORY ISSUES There were no specific regulatory issues associated with the LLSS demonstration. All activities were overseen by SPAWAR and conducted within the constraints of the project specific Demonstration Plan and HASP, both of which were reviewed and approved by the ESTCP and Navy prior to initiating work. In addition, all activities were conducted within the boundaries of Navy training ranges and/or other controlled areas (e.g., boat lanes) and were coordinated with the Navy, as required, to obtain clearance and avoid any potential conflicts with ongoing Naval operations. All requests for information, site visits and formal presentations for this project were coordinated and overseen by the SPAWAR PM. One regulatory lesson learned during the LLSS demonstration was the concern over whether standard operating procedures and health and safety plans developed for this project were adequate for laser safety at the site of proposed work (i.e., SCIRC). The connotations associated with the term “laser” are such that all work performed with this type of instrument is often automatically assumed, particularly by the military, to involve some type of cutting, weapons guidance, or other activities capable of inflicting serious bodily harm (e.g., severe burns, blindness), rather than simply producing a visual scan of the seafloor. Therefore additional approvals and special clearance were required on top of that which was normally expected. Although the general HASP for this project was approved by both the ESTCP and Navy prior to mobilization, planned access to the San Clemente Island Shore Bombardment Area (SHOBA) range for the Year 2 survey was ultimately suspended by the Navy Laser Safety Officer when it was determined that sufficient advance notice (>3 months) was not given as to the nature of the work to be conducted at the site. In response to this action, SAIC provided a site-specific Laser Operational Plan for the LLSS/Focus System to be included as Appendix A to the approved HASP. Thus access to the SHOBA range was ultimately denied and the demonstration was forced to proceed at an alternate site.

Final Report LLSS for UXO Characterization
102
9.3. END USER ISSUES The most likely end users of this technology are commercial UXO service provider firms under contract to the DoD. Direct DoD users include Army, Navy and Marine Corps installation managers who are responsible for training ranges with marine MEC contamination problems. The results of this demonstration are expected to be of immediate interest to both the Navy and members of the U.S. Army Corps of Engineers (USACE) nationwide.
The LLSS instrumentation used in this demonstration (not including the GAPS/PHINS navigation system) is a custom-built prototype that, with a few exceptions, has been constructed with commercial off the shelf (COTS) components. The unique aspects of the LLSS are the fiberglass sensor platform, the heavy duty tow cable and underwater electronics housings, the pilot guidance display, and some custom-designed printed circuit boards. Each of these components is fully documented and could be purchased from the original manufacturers. There are no proprietary technologies embedded in the LLSS. However, the GeoDAS and CleanSweep2 software platforms required to operate the LLSS are proprietary and must be either purchased or rented from the single sole source vendor Oceanic Imaging Consultants (OIC), Honolulu, Hawaii. The SAIC image processing software developed for this demonstration is property of SAIC and not available commercially, but this package is only useful for data post-processing and is not required for data acquisition. 9.4. AVAILABILITY OF THE TECHNOLOGY The complete LLSS (including FOCUS ROTV) is the property of SAIC and is housed and maintained at the SAIC Marine Operations facility on Ponderosa Avenue, San Diego, California. It can be made available to support other demonstrations and/or marine UXO survey operations. However, as mentioned above, the software platforms required to operate the LLSS are property of OIC and must be purchased or rented from them prior to any survey activities. SAIC is interested in, and would support, the creation of a new LLSS featuring more state-of-the-art electronic components that would significantly decrease the overall size and maintenance requirements of the unit while simultaneously improving durability and performance. However, this plan would be contingent on an end user that could provide enough opportunity to justify the investment costs of a new system. SAIC is also interested in further development of the software platforms required to operate the LLSS. 9.5. SPECIALIZED SKILLS OR TRAINING No specialized training is required to operate the LLSS aside from company-specific or project-specific health and safety training for both marine offshore and laser operation. Specialized skills in maintaining and troubleshooting the LLSS, piloting the FOCUS vehicle and operating the LLSS software are required to ensure optimal performance, and these skills can only be acquired through prior work with the LLSS technology. The various members of an LLSS survey team should also possess sufficient skills and experience in oceanography, large boat survey operations, marine navigation, electrical engineering, and software design.

Final Report LLSS for UXO Characterization
103
An LLSS survey is by nature a non-intrusive effort that merely captures images of proud targets on the seafloor. If, however, this survey is to be accompanied by any diver-assisted intrusive or recovery operations, then all divers would be required to possess appropriate commercial diving certifications and any divers potentially characterizing or handling munitions would be required to possess appropriate EOD training and experience. A magnetometer could be added to the LLSS to locate buried munitions and potentially mitigate the need for intrusive diver support.

Final Report LLSS for UXO Characterization
104
10.0. REFERENCES Air Force Operational Test and Evaluation Center (AFOTEC). 1988. Air Force Operational
Test and Evaluation Center, Volume 2, Number 1. January. Environmental Security Technology Certification Program (ESTCP). 2009. Cost and
Performance Report. UXO Detection and Characterization in the Marine Environment. ESTCP Project MM-0324. December.
Science Applications International Corporation (SAIC). 2008. Final Report. UXO Detection
and Characterization in the Marine Environment. ESTCP Project MM-0324. November. SAIC. 2010. Technical Note: Preliminary IVS Survey Results from MTA Survey of Selected
Site in San Diego Harbor.

Year 1 Report LLSS for UXO Characterization
105
APPENDICES

Year 1 Report LLSS for UXO Characterization
APPENDIX A: POINTS OF CONTACT
POINT OF CONTACT
Name
ORGANIZATION Name
Address
Phone Fax
E-mail Role in Project
Herb Nelson
ESTCP Munitions Management Program Office 901 North Stuart Street Suite 303 Arlington, VA 22203
Tel: 703-696-8726 Fax: 703-696-2124 Email: [email protected]
ESTCP Program Manager for Munitions Response
John Downey
Fleet Area Control and Surveillance Facility, San Diego P.O. Box 357062 San Diego, CA 92135
Tel: 619-545-1754 Fax: 619-545-4711 Email: [email protected]
Navy Senior Range Safety Officer
Mike Putnam
SPAWAR Systems Center Pacific; Code 71750 53475 Strothe Road San Diego, CA 92152
Tel: 619-553-2926 Fax: 619-553-2775 Email: [email protected]
Lead Investigator / SPAWAR Project Manager
Gregory Tracey
SAIC 221 Third Street Newport, RI 02840
Tel: 401-848-4631 Fax: 401-849-1585 Email: [email protected]
SAIC Project Manager
John Morris Tel: 401-848-4755 Fax: 401-849-1585 Email: [email protected]
Survey Manager
Jesse Swanko Tel: 401-848-4612 Fax: 401-849-1585 Email: [email protected]
Target Manager
Jediah Bishop Tel: 401-848-4636 Fax: 401-849-1585 Email: [email protected]
LLSS Software Specialist
Christopher Calabretta Tel: 401-848-4623 Fax: 401-849-1585 Email: [email protected]
GIS Specialist
Shane Grovhoug
SAIC 4211 Ponderosa Avenue San Diego, CA 92123
Tel: 858-514-5407 Fax: 858-694-0421 Email: [email protected]
Task Manager
Seth Mogk Tel: 858-514-5449 Fax: 858-694-0421 Email: [email protected]
LLSS Operator
Richard Theisen Tel: 858-514-5446 Fax: 858-694-0421 Email: [email protected]
FOCUS Operator
Glen Carter Tel: 858-514-5400 Fax: 858-694-0421 Email: [email protected]
Lead Diver
David Graham
SAIC 13691 Danielson Street Suite D Poway, CA 92064
Tel: 858-826-1359 Fax: Unknown Email: [email protected]
Software Engineer

Year 1 Report LLSS for UXO Characterization
107
POINT OF CONTACT
Name
ORGANIZATION Name
Address
Phone Fax
E-mail Role in Project
Bob Rosser
Rosser Marine & Charter Co., Inc. Marine Operations Div. 1220 Rosecrans Street San Diego, CA 92106
Tel: 619-993-4039 Fax: 619-225-1161 Email: [email protected]
Survey Vessel Captain, R/V Acoustic Explorer
Rick Morton
IXSEA, Inc. 500 West Cummings Park Suite 1000 Woburn, MA 01801
Tel: 781-937-8800 Fax: 781-937-8806 Email: [email protected]
GAPS/PHINS USBL Navigation Vendor
Masaomi Uchida
Oceanic Imaging Consultants, Inc. 1144 10th Avenue Suite 200 Honolulu, HI 96816
Tel: 808-539-3706 Fax: 808-791-4075 Email: [email protected]
LLSS Software Vendor
Dale Berlin Maxim Crane Works, L.P. 6232 Fairmount Ave San Diego, CA 92120
Tel: 619-517-0659 Fax: 619-563-7833 Email:[email protected]
70-ton Crane Services Vendor
Lance Lane
Southcoast Welding and Manufacturing 2591 Faivre Street, Bldg 1 Chula Vista, CA 91911
Tel: 619-429-1337 Fax: 619-429-1336 Email: [email protected]
Welding Services Vendor
Kevin Gayken Hawthorne Lift Systems 10930 Willow Court San Diego, CA 92127
Tel: 858-207-2802 Fax: 858-207-2875 Email: [email protected]
Forklift Rental Vendor
Unknown
Ryder System, Inc. RTR San Diego 5345 Overland Avenue San Diego, CA 92123
Tel: 858-565-4221 Fax: Unknown Email: Unknown
Flatbed Truck Rental Vendor
Unknown
Holiday Inn San Diego Bayside 4875 North Harbor Drive San Diego, CA 92106
Tel: 619-224-3621 Fax: 619-224-3629 Email: Unknown
Hotel

Year 1 Report LLSS for UXO Characterization
APPENDIX B
Field Plan: Simulated UXO and “Dummy” Object Identification Manual. Laser Line Scan System for UXO Characterization. Presentation.
23 September 2010.

Year 1 Report LLSS for UXO Characterization
109
APPENDIX C
Sample Field Logs Developed for LLSS Survey Operations.

Year 1 Report LLSS for UXO Characterization
APPENDIX D
Completed Field Logs for LLSS Survey Operations.

Year 1 Report LLSS for UXO Characterization
APPENDIX E
Year 1 Cruise Report: Laser Line Scan System for UXO Characterization. ESTCP Project No. MM-0911. Draft Version 1.0. May 2010.

Year 1 Report LLSS for UXO Characterization
APPENDIX F
Year 2 Cruise Report: Laser Line Scan System for UXO Characterization. ESTCP Project No. MM-0911. Draft Version 1.0. October 2010.

Year 1 Report LLSS for UXO Characterization
APPENDIX G
All LLSS Images Produced During the Year 1 and Year 2 Surveys. (Final Data Product)

Year 1 Report LLSS for UXO Characterization
APPENDIX H
Complete Transmissometer Dataset Collected During the Year 2 Survey.