Laser light-scattering study of polyacrylamides with and without hydrolyzation in 0.35M KH2PO4...
6
Laser Light-scattering Study of Polyacrylamides With and Without Hydrolyzation in 0.35M KH 2 PO 4 Aqueous Solution MOHAMMAD SIDDIQ, CHI WU Department of Chemistry, The Chinese University of Hong Kong, N. T., Shatin, Hong Kong Received 16 July 1996; accepted 11 September 1996 ABSTRACT: Both the hydrolyzed and unhydrolyzed polyacrylamides with different mo- lar masses were characterized in 0.35 M KH 2 PO 4 aqueous solution at 257C by laser light scattering ( LLS ) . The Laplace inversion of precisely measured intensity – intensity time correlation function leads to an estimate of the characteristic line-width distribu- tion G ( G ) which can be further reduced to a translational diffusion coefficient distribu- tion G ( D ) . A combination of the measured weight-average molar mass M w and G ( D ) enables us to establish a calibration of D (cm 2 /s) Å ( 4.46 { 0.02 ) 1 10 05 M 00.50{0.003 . Using this calibration, we convert each G ( D ) into a corresponding molar mass distribu- tion. The calculated M w from such a molar mass distribution is reasonably close to the measured M w from static LLS. Most important is that when 0.35 M KH 2 PO 4 aqueous solution is used as solvent, both the hydrolysed and unhydrolysed polyacrylamides can be represented by an identical calibration; namely, in 0.35 M KH 2 PO 4 aqueous solution, the polyelectrolytes effect in the hydrolysed polyacrylamides has been suppressed. Therefore, the hydrolysed polyacrylamides can be characterized as a normal neutral polymer in 0.35 M KH 2 PO 4 aqueous solution, which makes a routine characterization of the hydrolysed polyacrylamides much easier. q 1997 John Wiley & Sons, Inc. J Appl Polym Sci 63: 1755 – 1760, 1997 Key words: laser light scattering; characterization of polyacrylamides; polyelectro- lytes effect INTRODUCTION usually determined by either viscosity measure- ment or size-exclusion chromatography ( SEC ) . 1–4 It is known that the molar mass estimated from Polyacrylamide contains both carbonyl and am- ides groups along its hydrophobic backbone. Poly- viscosity has a large uncertainty because of the errors associated with the Mark – Houwink – Sa- acrylamide and its various anionic or cationic co- polymers and derivatives form one of the most kurada parameters. As for SEC, a proper calibra- tion of the SEC columns requires a series of nar- important series of water-soluble polymers in var- ious industrial applications. Linear polyacryl- rowly distributed polyacrylamides standards, which is rather difficult to obtained in practice. amides with a high molar mass are particularely Moreover, a normal SEC is not able to character- useful in the applications of flocculation and en- ize a sample with an average molar mass higher hanced oil recovery. than Ç 5 1 10 6 . The average molar mass of polyacrylamide are Dynamic laser light scattering ( LLS ) has been used in the characterization of macromolecules, Correspondence to: Chi Wu. such as poly ( tetrafluoroethylene ) , 5 branched ep- Contract grant sponsor: Research Grants Council of Hong oxy polymer, 6 poly(ethylene), 7 and dextrane. 8 Kong. Recently, a complementary method of combining Contract grant number: CUHK A / C No. 221600460. q 1997 John Wiley & Sons, Inc. CCC 0021-8995/97 / 131755-06 static and dynamic LLS has been developed to 1755 8e8f 3898 / 8E7C$$3898 01-27-97 15:34:59 polaa W: Poly Applied
-
Upload
mohammad-siddiq -
Category
Documents
-
view
212 -
download
0
Transcript of Laser light-scattering study of polyacrylamides with and without hydrolyzation in 0.35M KH2PO4...

Laser Light-scattering Study of Polyacrylamides With andWithout Hydrolyzation in 0.35M KH2PO4 Aqueous Solution
MOHAMMAD SIDDIQ, CHI WU
Department of Chemistry, The Chinese University of Hong Kong, N. T., Shatin, Hong Kong
Received 16 July 1996; accepted 11 September 1996
ABSTRACT: Both the hydrolyzed and unhydrolyzed polyacrylamides with different mo-lar masses were characterized in 0.35M KH2PO4 aqueous solution at 257C by laserlight scattering (LLS). The Laplace inversion of precisely measured intensity–intensitytime correlation function leads to an estimate of the characteristic line-width distribu-tion G (G ) which can be further reduced to a translational diffusion coefficient distribu-tion G (D ) . A combination of the measured weight-average molar mass Mw and G (D )enables us to establish a calibration of D (cm2/s) Å (4.46 { 0.02) 1 1005M00.50{0.003 .Using this calibration, we convert each G (D ) into a corresponding molar mass distribu-tion. The calculated Mw from such a molar mass distribution is reasonably close to themeasured Mw from static LLS. Most important is that when 0.35M KH2PO4 aqueoussolution is used as solvent, both the hydrolysed and unhydrolysed polyacrylamides canbe represented by an identical calibration; namely, in 0.35M KH2PO4 aqueous solution,the polyelectrolytes effect in the hydrolysed polyacrylamides has been suppressed.Therefore, the hydrolysed polyacrylamides can be characterized as a normal neutralpolymer in 0.35M KH2PO4 aqueous solution, which makes a routine characterizationof the hydrolysed polyacrylamides much easier. q 1997 John Wiley & Sons, Inc. J ApplPolym Sci 63: 1755–1760, 1997
Key words: laser light scattering; characterization of polyacrylamides; polyelectro-lytes effect
INTRODUCTION usually determined by either viscosity measure-ment or size-exclusion chromatography (SEC).1–4
It is known that the molar mass estimated fromPolyacrylamide contains both carbonyl and am-ides groups along its hydrophobic backbone. Poly- viscosity has a large uncertainty because of the
errors associated with the Mark–Houwink–Sa-acrylamide and its various anionic or cationic co-polymers and derivatives form one of the most kurada parameters. As for SEC, a proper calibra-
tion of the SEC columns requires a series of nar-important series of water-soluble polymers in var-ious industrial applications. Linear polyacryl- rowly distributed polyacrylamides standards,
which is rather difficult to obtained in practice.amides with a high molar mass are particularelyMoreover, a normal SEC is not able to character-useful in the applications of flocculation and en-ize a sample with an average molar mass higherhanced oil recovery.than Ç 5 1 106.The average molar mass of polyacrylamide are
Dynamic laser light scattering (LLS) has beenused in the characterization of macromolecules,
Correspondence to: Chi Wu. such as poly(tetrafluoroethylene),5 branched ep-Contract grant sponsor: Research Grants Council of Hong oxy polymer,6 poly(ethylene),7 and dextrane.8Kong.
Recently, a complementary method of combiningContract grant number: CUHK A/C No. 221600460.q 1997 John Wiley & Sons, Inc. CCC 0021-8995/97/131755-06 static and dynamic LLS has been developed to
1755
8e8f 3898/ 8E7C$$3898 01-27-97 15:34:59 polaa W: Poly Applied
1756 SIDDIQ AND WU
characterize special macromolecules, such as phe- (known as the excess Rayleigh ratio Rvv(q ) ) of adilute polymer solution of different concentrationsnolphthalein poly(ether ketone) or poly(ether
sulfone),9–11 poly(sulfoalkyl methacrylate),12 C (g/mL) at different scattering angles u weremeasured. Rvv (q ) is related to the weight averageand hydroxyethyl cellulose acetate.13
After the hydrolyzation, polyacrylamide be- molar mass Mw as17
comes polyelectrolytes in aqueous solution, andits characterization becomes problematic.14 In KC
Rvv (q )É 1
MwS1 / 1
3»R2
g …q2D / 2A2C (1)this study, we found that when 0.35M KH2PO4
aqueous solution is used as solvent, the polyelec-trolytes effect is suppressed so that the hy-
where K Å 4p2n2(dn /dC )2 / (NAl40) and q Å (4pn /drolysed polyacrylamide can be characterized as
l0) sin (u /2) with NA , dn /dC , n and l0 being thea neutral polymer.Avogadro number, the specific refractive index in-crement, the solvent refractive index, and thewavelength of the light in vacuo, respectively; A2EXPERIMENTALis the second virial coefficient; and »R2
g …1/2z (or
written as »Rg … ) is the root-mean square z-averageSample Synthesisradius of gyration of the polymer chain in solu-
Acrylamide monomer was recrystalized twice in tion. After measuring the values of Rvv (q ) , we arebenzene before its polymerization in highly puri- able to determine Mw , »Rg … , and A2 from a Zimmfied deionized water. A proper amount of acryl- plot which incorporate q- and C -extrapolation onamide was dissolved in a three-neck round bottom a single grid. Equation (1) shows that a preciseflask filled with a glass stirring rod with a values of dn /dC is critically important in the de-TeflonTM pad, a reflux condensor, and a nitrogen termination of Mw . In this study, a novel and highbubling tube. The polymerization was initiated by precision differential refractometer was used.18 Itadding hydrogen peroxide, and the reaction tem- has been found that dn /dC Å 0.176 mL/g for theperature was kept at 56 { 17C. After the reaction, polyacrylamide samples in 0.35M KH2PO4 aque-polyacrylamide was precipitated in methanol and ous solution at T Å 257C and l Å 532 nm.dried under vacuum at 60 { 17C. Such obtained In dynamic LLS, precise intensity–intensitypolyacrylamide was further fractionated in a time correlation functions G (2) (t , q ) in the self-methanol water mixture. Two polyacrylamide beating mode were measured, which has the fol-fractions and two hydrolysed polyacrylamides lowing form:15,16
samples with a hydrolysis degree of Ç 25% wereused in this study, which are labelled as PAM1, G (2) (t , q ) Å »I (t , q )I (0, q ) …PAM2, PAM3, and PAM4 hereafter. For each frac- Å A[1 / bÉg (1) (t , q )É2] (2)tion, five solutions with a concentration range of5.40 1 1005–2.72 1 1004 g/mL were prepared by
where q is the scattering vector; b, a parameterdilution. All polymer solutions were clarified atdepending on the detection coherence; t , the delayroom temperature using a 0.5 mm Millipore filter.time; g (1) (t , q ) , a normalized first-order electricfield time correlation function; and A , a measuredbase line. It should be stated that A is not treatedLaser Light Scatteringas an adjustable parameter in this study. Instead,
A modified commercial light-scattering spectrom- we insisted on the agreement between A and theeter (ALV/SP-125 equipped with an ALV-5000 calculated baseline within 0.1%, which requiresmulti-t digital time correlator and a solid-state a careful (dust free) solution preparation. For alaser, ADLAS DPY 425II; output power É 400 polydisperse sample, g (1) (t , u ) is related to themW at l Å 532 nm) was used. The primary beam line-width distribution G (G ) byis vertically polarized with respect to the scatter-ing plane (the optical table surface, in this case). g (1) (t , u ) Å »E (t , u )E*(0, u ) …The detail of the LLS instrumentation and theorycan be found elsewhere.15,16 All LLS measure- Å *
`
0G (G )e0Gt dG (3)
ments were carried out at 25 { 0.17C. In staticLLS, the angular dependence of the excess abso-lute time-averaged scattered light intensities A Laplace inversion of g (1) (t , q ) can lead to G (G ) .
8e8f 3898/ 8E7C$$3898 01-27-97 15:34:59 polaa W: Poly Applied
LIGHT-SCATTERING STUDY OF POLYACRYLAMIDES 1757
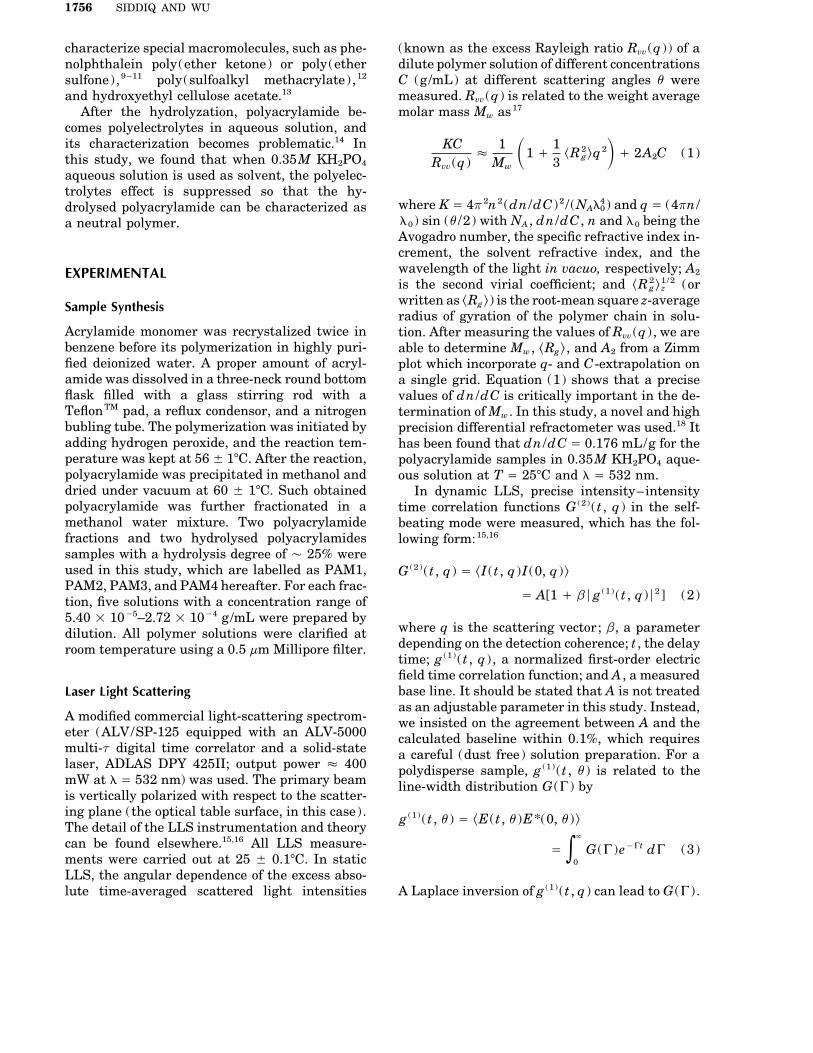
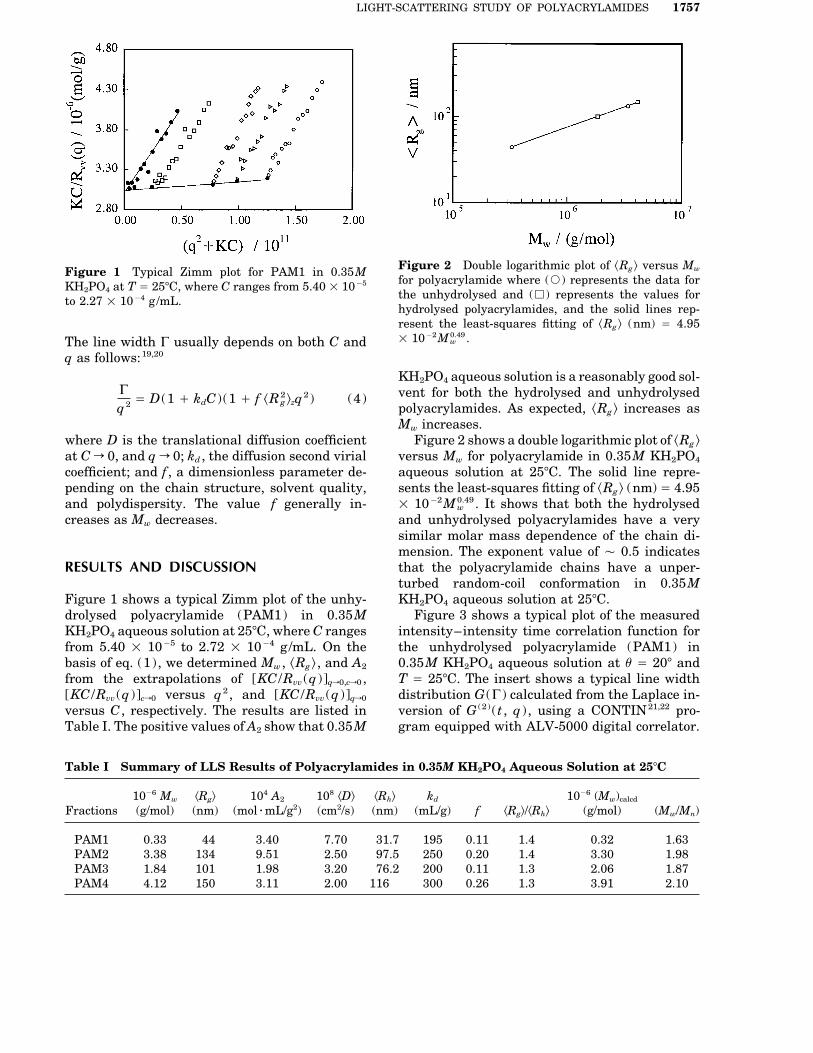
Figure 2 Double logarithmic plot of »Rg … versus MwFigure 1 Typical Zimm plot for PAM1 in 0.35Mfor polyacrylamide where (s ) represents the data forKH2PO4 at T Å 257C, where C ranges from 5.40 1 1005
the unhydrolysed and (h ) represents the values forto 2.27 1 1004 g/mL.hydrolysed polyacrylamides, and the solid lines rep-resent the least-squares fitting of »Rg … (nm) Å 4.951 1002M0.49
w .The line width G usually depends on both C andq as follows:19,20
KH2PO4 aqueous solution is a reasonably good sol-vent for both the hydrolysed and unhydrolysedG
q2 Å D (1 / kdC ) (1 / f »R2g …zq2) (4)
polyacrylamides. As expected, »Rg … increases asMw increases.
Figure 2 shows a double logarithmic plot of »Rg …where D is the translational diffusion coefficientat C r 0, and q r 0; kd , the diffusion second virial versus Mw for polyacrylamide in 0.35M KH2PO4
aqueous solution at 257C. The solid line repre-coefficient; and f , a dimensionless parameter de-pending on the chain structure, solvent quality, sents the least-squares fitting of »Rg … (nm) Å 4.95
1 1002M0.49w . It shows that both the hydrolysedand polydispersity. The value f generally in-
creases as Mw decreases. and unhydrolysed polyacrylamides have a verysimilar molar mass dependence of the chain di-mension. The exponent value of Ç 0.5 indicatesthat the polyacrylamide chains have a unper-RESULTS AND DISCUSSIONturbed random-coil conformation in 0.35MKH2PO4 aqueous solution at 257C.Figure 1 shows a typical Zimm plot of the unhy-
drolysed polyacrylamide (PAM1) in 0.35M Figure 3 shows a typical plot of the measuredintensity–intensity time correlation function forKH2PO4 aqueous solution at 257C, where C ranges
from 5.40 1 1005 to 2.72 1 1004 g/mL. On the the unhydrolysed polyacrylamide (PAM1) in0.35M KH2PO4 aqueous solution at u Å 207 andbasis of eq. (1), we determined Mw , »Rg… , and A2
from the extrapolations of [KC /Rvv (q ) ]qr0,cr0 , T Å 257C. The insert shows a typical line widthdistribution G (G ) calculated from the Laplace in-[KC /Rvv(q ) ]cr0 versus q2 , and [KC /Rvv (q ) ]qr0
versus C , respectively. The results are listed in version of G (2) (t , q ) , using a CONTIN21,22 pro-gram equipped with ALV-5000 digital correlator.Table I. The positive values of A2 show that 0.35M
Table I Summary of LLS Results of Polyacrylamides in 0.35M KH2PO4 Aqueous Solution at 257C
1006 Mw »Rg… 104 A2 108 »D… »Rh… kd 1006 (Mw)calcd
Fractions (g/mol) (nm) (molrmL/g2) (cm2/s) (nm) (mL/g) f »Rg…/»Rh… (g/mol) (Mw/Mn)
PAM1 0.33 44 3.40 7.70 31.7 195 0.11 1.4 0.32 1.63PAM2 3.38 134 9.51 2.50 97.5 250 0.20 1.4 3.30 1.98PAM3 1.84 101 1.98 3.20 76.2 200 0.11 1.3 2.06 1.87PAM4 4.12 150 3.11 2.00 116 300 0.26 1.3 3.91 2.10
8e8f 3898/ 8E7C$$3898 01-27-97 15:34:59 polaa W: Poly Applied

1758 SIDDIQ AND WU
Figure 3 Typical measured intensity–intensity timeFigure 5 Translational diffusion coefficient distribu-correlation function G (2) (q , t ) for PAM1 in 0.35Mtions G (D ) for two hydrolysed and two hydrolysed poly-KH2PO4 at u Å 207 and T Å 257C. The insert showsacrylamide fractions in 0.35M KH2PO4 at T Å 257C.the line-width distribution G (G ) calculated from the
Laplace inversion of G (2) (q , t ) .and unhydrolysed polyacrylamides in 0.35MKH2PO4 aqueous solution at 257C. From each
After measuring each polyacrylamide sample at G (D ) , we can calculate a hydrodynamic radiusa set of concentrations and scattering angles, we distribution f ( Rh ) and the average hydrodynamicare able to determine the translational diffusion
radius »Rh … [Å*`
0f ( Rh )Rh dRh ] using the Stokes–coefficient D .
Einstein equation DÅ kBT / (6phRh ) , where kB , T ,Figure 4 shows a typical dynamic Zimm plotand h, are the Boltzmann constant, the absolutefor the unhydrolysed polyacrylamide (PAM2) intemperature, and solvent viscosity, respectively.0.35M KH2PO4 aqueous solution at 257C. On theThe values of »Rg … / »Rh … are also listed in Table I.basis of Eq. (4), D , f , and kd can be calculated,It is known that the value of »Rg … / »Rh … reflectsrespectively, from (G /q2)cr0,qr0 , (G /q2)cr0 versusthe chain conformation. The values of »Rg … / »Rh …q2 , and (G /q2)qr0 versus C . The results are alsoÇ 1.3–1.4 indicate that the polyacrylamidesummarized in Table I, where » … means that thechains have a flexible coil conformation in 0.35Mvalues obtained are averaged ones. With a pair ofKH2PO4 aqueous solution at room temperature.kd and f , G (G ) in Figure 3 can be converted into
Figure 6 shows a double logarithmic plot of »D …G (D ) .Figure 5 shows the translational diffusion coef-
ficient distributions G (D ) for both the hydrolysed
Figure 6 Double logarithmic plots of »D … versus Mw
for Polyacrylamides, where the symbols are the sameas in Figure 2, and the solid lines represent the least-squares fittings of »D … (cm2/s) Å (4.44 1 1005)Figure 4 Typical dynamic Zimm plot for PAM2 in
0.35M KH2PO4 at T Å 257C. M00.501w .
8e8f 3898/ 8E7C$$3898 01-27-97 15:34:59 polaa W: Poly Applied
LIGHT-SCATTERING STUDY OF POLYACRYLAMIDES 1759
versus Mw . The solid line represents a least-squares fitting of »D … Å »kD …M0 »aD… with »kD … (Mw )calcd Å
*`
0Fw (M )M dM
*`
0Fw (M ) dM
Å 4.44 1 1005 and »aD … Å 0.50 for the polyacryl-amides in 0.35M KH2PO4 aqueous solution at257C, where » … means that the values of »kD… and»aD … were obtained from »D … and Mw rather thanfrom D and M for monodisperse species. The value Å
k1/aDD *`
0G (D ) dD
*`
0G (D )D1/aD dD
(10)of »aD …Ç 0.5 further indicates the polyacrylamidechains have a unperturbed random coil conforma-tion in 0.35M KH2PO4 aqueous solution at 257C.Theoretically, with these calibrations, G (D ) can We found that the weight-average molar massesbe transformed into a molar mass distribution, calculated from G (D ) using »kD … and »aD… are 20%e.g., a differential weight distribution of molar less than Mw measured directly from static LLS.mass fw (M ) . For the convenience of discussion, This is expectable because we have used »kD … andthe principle is outlined as follows. In static LLS, »aD … instead of kD and aD . Therefore, we have towhen C r 0 and q r 0, use a recently developed light-scattering method
to find kD and aD first, namely, a method of com-bining static and dynamic LLS results, i.e., MwRvv (u ) } »I … } *
`
0fw (M )M dM (5)
and G (D ) , obtained from two or more polyacryl-amide fractions. The detail of this LLS methodhas already been reported elsewhere.23,24 UsingOn the other hand, in dynamic LLS,this method, we found that kD Å 5.52 1 1005 andaD Å 0.514 if using both the hydrolysed and unhy-g (1) (t r 0) Å »E (t )E*(0) …tr0drolysed polyacrylamides; kD Å 5.31 1 1005 andaD Å 0.509 if using only two of the hydrolysedÅ *
`
0G (G ) dG } »I … (6)
polyacrylamides; and kD Å 5.31 1 1005 and aD
Å 0.510 if using only two of the unhydrolysed poly-A comparison of eqs. (5) and (6) leads to acrylamides. A comparison of these kD and aD val-
ues shows that both the hydrolysed and unhy-drolysed can be represented by the same calibra-*
`
0G (G ) dG } *
`
0G (D )D dD tion between D and M , namely D (cm2/s) Å (5.4
{ 0.1)1 1005M )00.514{0.005 . This suggests that thepolyelectrolytes effect has been suppressed in} *
`
0fw (M )M dM (7)
0.35M KH2PO4 aqueous solution. Using this cali-
where G (G ) } G (D ) . Equation (7) can be rewrit-ten as
*`
0G (D )D d ( ln D ) } *
`
0fw (M )M2 d ( ln M ) (8)
Since d ( ln D ) } d ( ln M ) , we have
fw (M )M2 } G (D )D or fw (M ) }G (D )D
M2 (9)
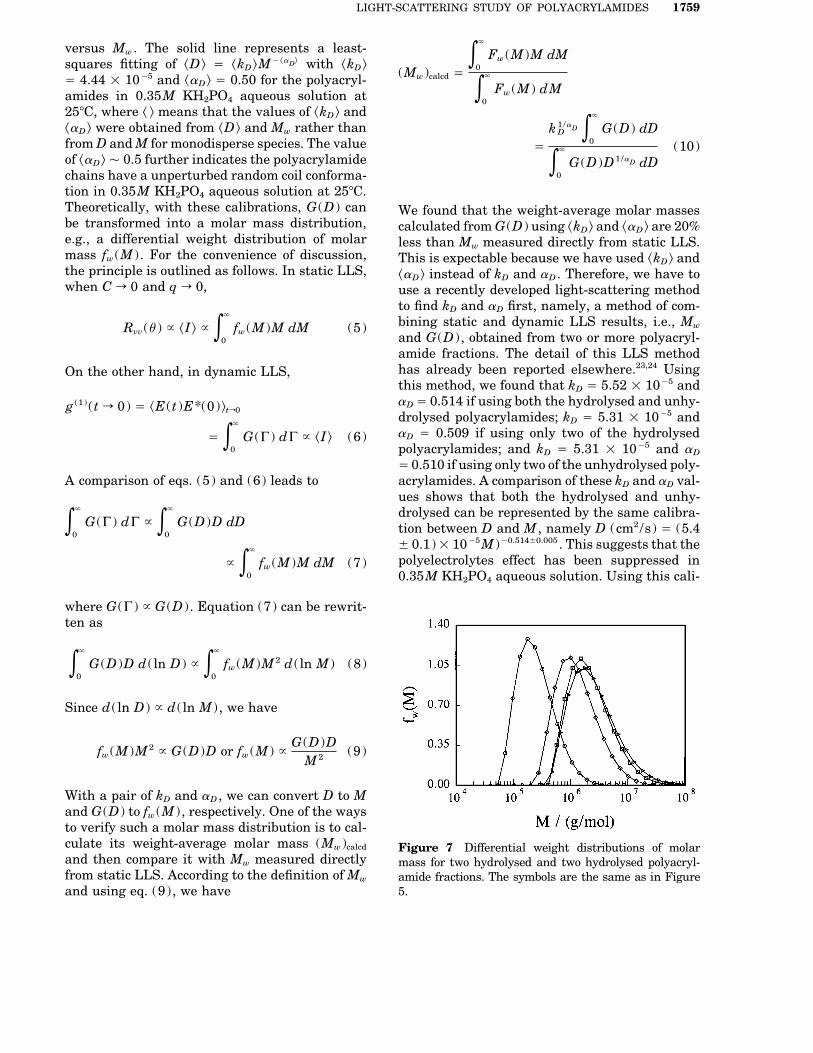
With a pair of kD and aD , we can convert D to Mand G (D ) to fw (M ) , respectively. One of the waysto verify such a molar mass distribution is to cal-culate its weight-average molar mass (Mw )calcd Figure 7 Differential weight distributions of molarand then compare it with Mw measured directly mass for two hydrolysed and two hydrolysed polyacryl-from static LLS. According to the definition of Mw amide fractions. The symbols are the same as in Figure
5.and using eq. (9), we have
8e8f 3898/ 8E7C$$3898 01-27-97 15:34:59 polaa W: Poly Applied

1760 SIDDIQ AND WU
bration, we converted each G (D ) into a corre- REFERENCESsponding molar mass distribution.
Figure 7 shows differential weight distribu- 1. H. M. Rafi’ee Fanood and M. H. George, Polymer,29, 128–134 (1988).tions of molar mass fw (M ) of different fractions of
2. M. H. Rafi’ee Fanood and M. H. George, Polymer,polyacrylamides. From each fw(M ) , we can calcu-28, 2241–2244 (1987).late the weight-average molar mass (Mw )calcd and
3. J. Klein and A. J. Westercamp, Polym. Sci. Chem.,polydispersity index Mw /Mn , which are listed in19, 707 (1981).Table I. The values of (Mw )calcd agree reasonably
4. G. A. Ouano and J. W. Kaye, J. Polym. Sci., 12,with those measured directly from static LLS. The1151 (1974).
values of Mw /Mn shows that all fractions are mod- 5. C. Wu and J. D. Lilge, J. Appl. Polym. Sci., 50,erately distributed. 1753 (1993).
6. B. Chu, C. Wu, and W. Buck, Macromolecules, 22,831 (1989).
7. C. Wu, J. Zuo, and B. Chu, Macromolecules, 22,633 (1989).CONCLUSION
8. C. Wu, Macromolecules, 26, 3821 (1993).9. C. Wu, S. Bo, M. Siddiq, and G. J. Yang, Macromol-
A combination of static and dynamic LLS results ecules, 29, 2989 (1996).can be used to characterize both the hydrolysed 10. C. Wu, M. Siddiq and K. F. Woo, Macromolecules,and unhydrolysed polyacrylamides. Our result in- 28, 14914 (1995).dicates that the polyelectrolytes effects can be 11. C. Wu, M. Siddiq, S. Q. Bo, and T. Chen, Macromol-
ecules, 29, 3160 (1996).suppressed in 0.35M KH2PO4 aqueous solution,12. P. Wu, M. Siddiq, C. Huiyang, and C. Wu, Macro-and the polyacrylamides behaves as a random
molecules, 29, 277 (1996).coil. A calibration between the translational diffu-13. C. Wu, M. Siddiq, S. Jiang, and Y. Huang, J. Appl.sion coefficient (D ) and molar mass (M ) , namely,
Polym. Sci., 58, 117 (1995).D (cm2/s) Å (5.40 { 0.1) 1 1005M )00.514{0.005 , has14. W. Siebourg, R. D. Lundberg, and R. W. Lenz, Mac-been established. Using this calibration, we ob- romolecules, 13, 1013 (1980).
tained not only the weight-average molar mass 15. R. Pecora and J. Berne, Dynamic Light Scattering,Mw but also molar mass distribution in dynamic Plenum Press, NY, 1976.LLS. The established methadology and the cali- 16. B. Chu, Laser Light Scattering, 2nd Ed., Academicbration between D and M can be used in future Press, NY, 1991.to characterize polyacrylamides with an ultrahigh 17. B. H. Zimm, J. Chem. Phys., 16, 1099 (1948).
18. C. Wu and K. Q. Xia, Rev. Sci. Instrum., 65, 587molar mass, which cannot be characterized by(1994).other conventional methods, such as SEC and vis-
19. W. H. Stockmayer and M. Schmidt, Pure. Appl.cometry.Chem., 54, 407 (1982).
20. W. H. Stockmayer and M. Schmidt, Macromole-cules, 17, 509 (1984).Mohammad Siddiq acknowledges the Hong Kong Com-
monwealth Scholarship Commission (Government of 21. S. W. Provencher, Biophys. J., 16, 27 (1976).22. S. W. Provencher, J. Chem. Phys., 64, 2772 (1976).Hong Kong) for its generous financial support. He also
wishes to acknowledge Gomal University, Pakistan, for 23. C. Wu, Colloid Polym. Sci., 271, 947 (1993).24. C. Wu, J. Polym. Sci., Polym. Phys., 32, 803 (1994).granting him the study leave.
8e8f 3898/ 8E7C$$3898 01-27-97 15:34:59 polaa W: Poly Applied