
Laser-Arc Hybrid Welding of Thick Section Ni-base … Reports/FY 2011/11-3099 NEUP...Final Report...
76
Laser-Arc Hybrid Welding of Thick Section Ni-base Alloys – Advanced Modeling and Experiments Nuclear Energy Enabling Technologies Dr. Tarasankar Debroy Pennsylvania State University In collabora7on with: Oak Ridge Na,onal Laboratory Alison Hahn, Federal POC Jack Lance, Technical POC Project No. 11-3099
Transcript of Laser-Arc Hybrid Welding of Thick Section Ni-base … Reports/FY 2011/11-3099 NEUP...Final Report...

Laser-Arc Hybrid Welding of Thick Section Ni-base Alloys – Advanced
Modeling and Experiments
Nuclear Energy Enabling Technologies Dr. Tarasankar Debroy
Pennsylvania State University
In collabora7on with: Oak Ridge Na,onal Laboratory
Alison Hahn, Federal POC Jack Lance, Technical POC
Project No. 11-3099
Final Report Abstract Laser-Arc Hybrid Welding of Thick Section Ni-base Alloys – Advanced
Modeling and Experiments The Pennsylvania State University
Hybrid laser-arc welding of nickel-base alloys can increase productivity and decrease costs during construction and repair of critical components in nuclear power plants. However, laser and hybrid welding of nickel-base alloys is not well understood. This project sought to understand the physical processes during hybrid welding necessary to fabricate quality joints in Alloy 690, a Ni-Cr-Fe alloy. This document presents a summary of the data and results collected over the course of the project. The supporting documents are a collection of the research that has been or will be published in peer-reviewed journals along with a report from the partner at the national lab. Understanding the solidification behavior of Alloy 690 is important for knowing the final properties of the weldment. A study was undertaken to calculate the solidification parameters, such as temperature gradient, solidification rate, and cooling rate in Alloy 690 welds. With this information and measured cell and dendrite arm spacings, an Alloy 690 map was constructed to guide process parameter development and interpret fusion zones in later hybrid welds. This research is contained in “Solidification Map of a Nickel Base Alloy.” The keyhole formed under high laser intensity gives the hybrid welding technique the greater penetration depths compared to arc welding. However, keyhole behavior can form defects in the material, so knowing transient keyhole characteristics is important. With international collaborators, a study was undertaken to validate a new process monitoring tool known as inline coherent imaging (ICI), which is able to measure the keyhole depth with spatial and temporal resolutions on the order of 10 microns and 10 microseconds. ICI was validated for five alloy systems, including Alloy 690. Additionally, the keyhole growth rates at the start of welding were measured with unprecedented accuracy. This research is contained in “Real Time Monitoring of Laser Beam Welding Keyhole Depth by Laser Interferometry.” During full penetration welding of thick sections, root defects can form, which result in unacceptable weld quality. A study was undertaken to determine the competing forces in root defect formation by independently changing the weight forces and surface tension forces. The weight force was altered by changing the plate thickness, and the surface tension force was altered by changing the surface condition at the bottom surface. Root defects do depend on these two forces. This research is contained in “Mitigation of Root Defect in Laser and Hybrid Laser-Arc Welding.” Validation of the hybrid laser-arc model is necessary to properly model heat and mass transfer and fluid flow in Alloy 690 hybrid welds. Therefore, the developed model was validated for low

carbon steel. Temperatures calculated by the model were included into a microstructural model in order to calculate the phase fractions. Process maps were developed for the selection of welding parameters to avoid martensite formation. This research is contained in “Fusion Zone Microstructure in Full Penetration Laser-Arc Hybrid Welding of Low Alloy Steel.” Alloy 690 suffers from ductility dip cracking, a form of hot cracking. This type of cracking inhibits the use of multipass welding to join Alloy 690. Our partners at ORNL performed some hot ductility testing with Alloy 690 samples using digital image correlation. The results of this work is contained in the report “Summary of 690 ductility dip cracking testing using Gleeble and digital image correlation.” Macro-porosity is a limiting factor in the widespread deployment of laser and hybrid laser-arc welding for construction and repair of nuclear power plant components. Keyhole instability and fluctuation results in the formation of large bubbles, which become trapped at the advancing solid-liquid interface as pores. Laser and hybrid laser-arc welds were fabricated for a range of conditions. Porosity levels in the welds were measured in X-ray computed tomography (CT), which provides very detailed data on the size and locations of the pores inside the weld. Based on the porosity size and location distributions, the mechanism that leads to lower porosity in higher power hybrid-laser arc welds was determined. This research is explained in detail in “Porosity in Thick Alloy 690 Welds – Experiments, Modeling, Mechanism, and Remedy”.
Objectives and Accomplishments
1. Process Development and Weld Characterization Parameters were developed for the successful laser and hybrid laser-gas metal arc (GMA) welding of Alloy 690. Dozens of trial GMA welds were fabricated to determine the correct voltage, current, wire feed speed, shielding gas composition, and torch angle for successful welding of Alloy 690 with different consumables. The correct GMA conditions were combined with a laser to perform the first hybrid laser-GMA welds on Alloy 690. The resulting welds were characterized in terms of welding defects, such as pores, root defects, ductility dip cracks, and solidification cracks. The fusion zone profile and solidification structures were also analyzed. Micro-hardness measurements were performed on the welds to determine the effect of welding on mechanical properties. Appendices A, B, C, and D provide additional details on welding process development and weld characterization.
2. Heat and Fluid Flow and Thermal Cycle Modelling An existing heat transfer and fluid flow model was adapted to calculate the temperature and fluid velocity fields during laser welding of Alloy 690. Thermal cycles, cooling rates, temperature gradients, solidification rates, solidification morphology parameters, and spatial variation of solidification parameters were calculated using the adapted model, which models the keyhole heat source with a point by point heat balance at the keyhole walls. Additional developments led to a heat transfer and fluid flow model for the simulation of hybrid laser-GMA welding, which requires the introduction of a volumetric heat source to model the addition of a consumable electrode into the weld pool. The temperature outputs were coupled with a microstructure model to accurately predict the effects of welding speed and laser-arc separation distance on the resulting microstructure in full penetration welds. This work led to process maps demonstrating the effects of different process parameters on final microstructure. Appendices A and D provide additional details on heat and fluid flow and thermal cycle modeling.
3. Solidification and Microsegregation Solidification of Alloy 690 welds was thoroughly characterized in terms of spatial variations of scale and morphology (i.e. cells and columnar dendrites). The sizes and morphologies were correlated to the calculated cooling rates and morphology parameters from the heat transfer and fluid flow model. This correlation was used to construct a solidification map for Alloy 690 showing the effects of temperature gradients and solidification rates on scale and morphology of the solidification structures. Scheil calculations predicted limited partitioning of alloying elements to the liquid during solidification. A slight increase in chromium was expected. The small interdendritic regions and EDS analysis confirmed that microsegregation was limited in Alloy 690 compared to other nickel-base alloys. Appendix A provides additional details on solidification and microsegregation Please refer to appendix A for more information.
4. Calculation and Measurement of Residual Stress Great progress has been made with the calculation of residual stress fields. A key ingredient for these calculations is knowledge of the 3D temperature fields during welding. These fields have been determined for number laser and hybrid laser-arc welding conditions. Depending on the heating and cooling rates, the residual stress fields will differ. The spallation neutron source at Oak Ridge National Lab can be used to measure residual stress fields. Diffraction of the neutrons at the weld sample can be translated into residual stress. A proposal was written and revised in order to obtain beam time at the spallation neutron source. Unfortunately, the proposal was not selected over the course of three reviews.
5. Mechanical Property Testing
Extensive mechanical property testing was undertaken at Oak Ridge National Lab (ORNL). As-machined and annealed testing samples were mechanically tested at room temperature. A hot ductility test was performed where the sample is rapidly heated and cooled at rates up to 110˚C/s and then strained to fracture at 871˚C in a Gleeble thermos-mechanical simulator. During testing digital image correlation (DIC) was used to measure the local strain field near the location of failure. The initial speckle pattern application procedure for DIC was not appropriate for the high temperatures, which were tested in this study. So, the co-investigators at ORNL developed a new coating technique, which can withstand higher testing temperatures. Appendix E provides additional details on mechanical property testing.
Publications and Presentations
J.J. Blecher, T.A. Palmer, and T. DebRoy, “Porosity in Thick Alloy 690 Welds – Experiments, Modeling, Mechanism, and Remedy”, in preparation. H.L. Wei, J.J. Blecher, T.A. Palmer, and T. DebRoy, “Fusion Zone Microstructure in Full Penetration Laser-Arc Hybrid Welding of Low Alloy Steel”, Welding Journal, 94, 135s-144s (2015). J.J. Blecher, T.A. Palmer, and T. DebRoy, “Mitigation of Root Defect in Laser and Hybrid Laser-Arc Welding”, Welding Journal, 94, 73s-82s (2015). J.J. Blecher, C.M. Galbraith, C. Van Vlack, T.A. Palmer, J.M. Fraser, P.J.L. Webster, and T. DebRoy, ‘Real Time Monitoring of Laser Beam Welding Keyhole Depth by Laser Interferometry,’ Science and Technology of Welding and Joining, 19, 560-564 (2014). J.J. Blecher, T.A. Palmer, and T. DebRoy, ‘Solidification Map of a Nickel Base Alloy,’ Metallurgical and Materials Transactions A, 45A, 2142-2151 (2014).
J.J. Blecher, T.A. Palmer, and T. DebRoy, ‘Root Defects in Laser and Hybrid Laser-Arc Welds,’ presented at AWS Professional Program at FABTECH, 2014, 11 – 13 November 2014, Atlanta, GA.
J.J. Blecher, H. Wei, T.A. Palmer, and T. DebRoy, ‘Solidification in High-Power Laser Welding of Inconel® Alloy 690,’ presented at AWS Professional Program at FABTECH, 2013, 18 – 21 November 2013, Chicago, IL.

OVERVIEW
Purpose: This work seeks to demonstrate the utility of laser-GMA hybrid welding to thick sections of Ni-base alloys through numerical modeling of the heat transport, fluid flow, solidification, and residual stress.
Objectives:•Perform laser-GMA hybrid welds on Inconel Alloy 690 with various filler metals.
•Characterize resulting microstructure and segregation of the alloying elements in the fusion zone.
•Develop an existing heat transfer and fluid flow model to understand the phenomena that occur during laser-GMA hybrid welding.
•Calculate and measure the residual welding stress field.
•Measure the mechanical properties of the weld.
IMPACTLogical Path:
Outcomes: The outcomes of this work include a quantitative understanding of the laser-GMA hybrid welding process of Alloy 690. The effect of welding conditions on weld pool geometry, solidification parameters, microsegregation, residual stress fields, mass transport, and mechanical properties will be determined.
DETAILS
Principal Investigator: Dr. Tarasankar DebRoy
Institution: The Pennsylvania State University
Collaborators: Dr. T.A. Palmer (ARL/PSU) and Dr. W. Zhang (OSU)
Duration: Oct. 2011 to Dec. 2014
TPOC: Herschel Smartt
Workscope: MS-NT4
Project Number #:120327
Total Funding Level: $482,503
RESULTS
Accomplishments: A manuscript describing the differences between laser and hybrid laser-arc welding is in preparation. One of the differences discussed is the effect of technique on keyhole porosity as shown above in the X-ray CT images. The top image is a laser weld. The bottom image is a hybrid weld.
Laser-Arc Hybrid Welding of Thick Section Ni-base Alloys – Advanced Modeling and Experiments

Appendix A:
Solidification Map of a Nickel-Base Alloy

Solidification Map of a Nickel-Base Alloy
J.J. BLECHER, T.A. PALMER, and T. DEBROY
The solidification behavior of the advanced nickel-base alloys, such as Inconel� Alloy 690, isimportant for understanding their microstructure, properties, and eventual service behavior innuclear power plant components. Here, an experimental and theoretical program of research isundertaken with the aim of developing a quantitative understanding of the solidificationbehavior under a wide range of temperature gradients and solidification growth rates. Thetemperature gradient and solidification rates vary spatially by several orders of magnitudeduring keyhole mode laser welding. Therefore, the solidification structure is experimentallycharacterized from microscopic examinations of the resulting fusion zones and correlated withfundamental solidification parameters to provide a widely applicable solidification map that canbe employed for a broad range of solidification processes. The cell and secondary dendrite armspacings are quantitatively correlated with cooling rates. An Alloy 690 solidification map, whichillustrates the effect of temperature gradient and solidification rate on the morphology and scaleof the solidification structures, is also presented.
DOI: 10.1007/s11661-013-2149-1� The Minerals, Metals & Materials Society and ASM International 2013
I. INTRODUCTION
HIGH performance nickel-base alloys are widelyused in industry[1–5] because of their superior structuralstability, desirable mechanical properties, and highresistance to stress corrosion cracking. For example,Inconel� Alloy 690, a high chromium content nickel-base alloy, is widely used in installation and repair of thesteam generator tubing and pressurized water reactorcomponents.[6] Fabrication and maintenance of thesealloy parts require an understanding of their solidifica-tion behavior because of its significant impact on themechanical properties. Unlike well established alloysystems, such as stainless steels,[7] a quantitative under-standing of Alloy 690 solidification behavior is notcurrently available.
Previous studies on the solidification behavior of Alloy690 have provided useful knowledge about the morphol-ogy of the solidification structure. Cellular and columnardendritic structures were observed in both arc and laserwelded fusion zones.[8–13] Characterization of the solid-ification structures showed that cell spacings and thesecondary dendrite arm spacings varied with heat inputper unit length during the fabrication process. The scale ofthe solidification structures were correlated with heatinput because the heat input could be accurately deter-mined. However, it is now well established that the heatinput does not uniquely define the solidification structurebecause the same heat input can result in significantlydifferent thermal conditions depending on the fabricationspeed and the power used.[14]
The scale of the cells or dendrites depends primarilyon the fundamental solidification parameters, such asthe temperature gradient (G) and the solidificationgrowth rate (R). The cooling rate can be directly relatedto the scale of the solidification structures, regardless ofthe heat input or other attributes of a fabricationprocess.[15] A morphological map showing solidificationstructures as a function of fundamental solidificationparameters can provide significant benefits to theconstruction of new power plants and the refurbishmentof existing plants. This enhanced understanding of thesolidification mechanisms will lead to improved fabri-cation and performance of Alloy 690 in high tempera-ture applications.Realistic calculations of the solidification parameters
during welding have been enabled by recent advances innumerical modeling. For example, Zhang et al.[16] uti-lized a heat transfer and fluid flow model and showedthat calculated thermal cycles during cooling after arcspot welding agreed well with the corresponding exper-imental thermal cycles. Rai et al.[17–19] calculated G, R,GR, and the morphology parameter (G/R) at the trailingedge of the weld pool during laser welding of a widerange of alloys. Anderson et al.[5,20] made use of thecolumnar to equiaxed transition (CET) model[21–23] inorder to study stray grain formation in single crystalalloys. Using coupled models, Tan et al.[24] determinedthe temperature field during laser spot welding ofstainless steel to calculate a number of solidificationcharacteristics, such as grain growth direction, mor-phology, and cell and secondary dendrite arm spacing.Numerical modeling has been used extensively tocalculate solidification parameters[5,16–20,24] and to studythe solidification behavior of alloys.In this study, the solidification behavior of a Ni-Cr-Fe
alloy, Alloy 690, is investigated based on experimentallydetermined solidification structure and theoretically
J.J. BLECHER, Ph.D. Candidate, T. DEBROY, Professor, andT.A. PALMER, Associate Professor, are with the Department ofMaterials Science and Engineering, The Pennsylvania State University,University Park, PA 16802. Contact e-mail: [email protected]
Manuscript submitted August 12, 2013.Article published online December 24, 2013
2142—VOLUME 45A, APRIL 2014 METALLURGICAL AND MATERIALS TRANSACTIONS A
calculated solidification parameters, such as tempera-ture gradients and the solidification growth rates.During microscopic analysis, the laser welds exhibit awide range of cellular and columnar dendritic structuresacross the fusion zone. The local temperature gradientsand solidification rates during keyhole mode laserwelding are calculated with a well-tested numerical heattransfer and fluid flow model. In addition, the scale ofcellular and dendritic structures are then correlated tothe cooling rates, allowing relations between coolingrate and cell and secondary dendrite arm spacing to bedeveloped. The critical G/R parameter for the transitionfrom cells to dendrites is then determined and used tocalculate the area fractions of columnar dendrites in thetransverse cross sections of the experimental fusionzones. A solidification map for Alloy 690 is thenconstructed to predict the formation of cells anddendrites and the scale of the cells and dendrite armsfor given values of G and R.
II. EXPERIMENTS AND MODELDEVELOPMENT
A. Experimental Welds
Autogenous bead-on-plate welds were made on12.7 mm thick Inconel� Alloy 690 plate with an IPGPhotonics� YLR-12000-L ytterbium fiber laser. The1070 to 1100 nm wavelength laser light was directed tothe workpiece through a 200 lm process fiber andfocused with a YW50 Precitec� welding head. Theoptics included 200 mm focus length collimating andfocusing lenses. Beam characterization with aPRIMES� Focus Monitor confirmed a 200 mm focuslength, a 300 lm beam diameter at focus, and adivergence angle of 150 mrad. The focus plane of thelaser beam was positioned at the surface of the work-piece with no offset. Laser power varied between 1.0 and5.6 kW, and travel speed was held constant at34 mm s�1. The composition of the Alloy 690 plate isshown in Table I.
Standard metallographic techniques were used toprepare transverse sections of the laser welds. Electro-lytic etching in 10 wt pct oxalic acid for several secondsrevealed the microstructure of the fusion zone and basemetal. A Nikon� Epiphot microscope imaged themicrostructures at magnifications between 100 and1000 times magnification. A Nikon� DS-Fi2 cameraand Nikon� NIS Elements software were used tocapture micrographs. Series of 10 to 30 images at 100times magnification were stitched together into largerimages using Adobe� Photoshop CS5. Secondary den-drite arm spacing, cell spacing, and morphology areameasurements were performed with ImageJ software.The linear intercept method was used to measure the
secondary arm spacings and cell spacings. Four mea-surements per micrograph at 1000 times magnificationwere used to determine cell spacings for each locationand corresponding cooling rate. If one cell spacingmeasurement fell outside of the mean plus or minus onestandard deviation, it was not included in the reportedmean. The reported secondary arm spacings are anaverage of three or more measurements in one 1000times magnification micrograph. Each dendrite used inthe measurement had a minimum of seven arms.
B. Mathematical Modeling and SolidificationCalculations
The three-dimensional (3D) finite difference basedheat transfer and fluid flow model used in this paper hasbeen documented elsewhere in the literature,[17–19,25–28]
so only a brief description of the features will bepresented here. Calculation of the keyhole profile isdone before the heat transfer and fluid flow calculationsand is based on the method proposed by Kaplan,[29]
which performs a point by point heat balance at thekeyhole wall. The profile and resulting heat flux at thekeyhole wall are then incorporated into the heat transferand fluid flow model as a heat source. The equations forthe conservation of mass, momentum, and energy aresolved for enthalpy and fluid velocity. The resultingtemperature fields are used to determine the solidifica-tion parameters. The Alloy 690 material properties usedfor these calculations are shown in Table II.The heat transfer and fluid flow model has been
extensively evaluated and validated for keyhole modelaser beam welding for a variety of materials, includingaluminum, stainless steel, tantalum, titanium, vana-dium, and structural steel alloys.[17–19] In addition toaccurately predicting the experimental weld pool dimen-sions for various welding powers, speeds, and laser beamprofiles, the solidification parameters G, GR, and G/Rwere calculated at the weld centerline.[18] The model hasalso been employed to quantitatively study the solidifi-cation of austenitic stainless steels[35] and the effect ofcooling rate on the primary solidification phase. Thecalculated and measured thermal cycles and coolingrates agreed, which allowed for the establishment ofrelations between cooling rates (1000 to 10,000 K s�1)and spacings of primary and secondary dendrites.The temperature gradient (G) and solidification
growth rate (R) are calculated from the temperaturefield, which is output by the heat transfer and fluid flowmodel. These parameters, G and R, have been calculatedfor every position along the solidification front, which isa 3D surface from which the 2D transverse cross-sectionis extracted. The combined forms of G and R include thecooling rate (GR) and the solidification morphologyparameter (G/R). The cooling rate can be directly
Table I. Composition of Alloy 690 Plate
Composition (Wt Pct) Ni Cr Fe Mn Si C Cu S
Alloy 690 59.96 29.62 9.68 0.19 0.08 0.03 <0.01 0.004
METALLURGICAL AND MATERIALS TRANSACTIONS A VOLUME 45A, APRIL 2014—2143

related to the size of the features in the fusion zone. Themorphology parameter can be used to describe theshape of the solidification structures, such as (fromhighest G/R value to lowest) planar, cellular, columnardendritic, and equiaxed dendritic.
In order to calculate G and R, the direction of heatflow at the liquidus temperature must be determined,which is the gradient of the temperature field
rT ¼ @T@x
iþ @T@y
jþ @T@z
k; ½1�
where T is temperature and i, j, and k are unit vectorsin the x, y, and z direction, respectively. The heat flowdirection at a certain position in space is expected tobe normal to the 3D liquidus surface. The temperaturegradient, G, is
G ¼ rTk k ¼
ffiffiffiffiffiffiffiffiffiffiffiffiffiffiffiffiffiffiffiffiffiffiffiffiffiffiffiffiffiffiffiffiffiffiffiffiffiffiffiffiffiffiffiffiffiffiffiffiffiffiffiffi
@T
@x
� �2
þ @T
@y
� �2
þ @T
@z
� �2s
; ½2�
which is simply the magnitude of the vector. The solid-ification direction is assumed to be aligned opposite tothe heat transfer direction. Therefore,
cos a ¼� @T
@x
rTk k ; ½3�
where a is the angle between the welding direction andsolidification growth direction. In order for theassumption to be valid, the orientation of the easygrowth direction, h100i, of the pre-existing grain mustbe parallel to the solidification direction. In polycrys-talline material with randomly oriented grains, thiscondition is not usually met, however, with mean grainsizes much smaller than the dimensions of the weld,competitive growth will quickly select the best orienta-tion during solidification. The solidification rate, R, is
R ¼ U cos a; ½4�
where U is the welding speed. Figure 1(a) shows therelationship between U, R, and a on the 3D solidificationsurface and the resulting transverse cross-section of the
weld. The variation of a with depth along the centrallongitudinal plane for a 2.8 kW weld is shown inFigure 1(b). It should be noted that R is also a functionof the angle between the easy growth direction of the grainand the welding direction. However, this angle is typicallyneglected for the case of polycrystalline materials.
III. RESULTS AND DISCUSSION
A. Microstructural Characterization
Bead-on-plate laser welds were made on Alloy 690plates at a travel speed of 34 mm s�1 and powersranging from 1.0 to 5.6 kW. The combination of laserpower and welding speed resulted in the formation of akeyhole in each weld. Calculated temperature and fluidvelocity fields are shown in Figure 2 for powers of 1.0,2.8, and 4.7 kW. The boiling [3085 K (2812 �C)],liquidus [1650 K (1377 �C)], and solidus [1616 K(1343 �C)] temperature contours are plotted. The char-acteristic high depth to width ratio of keyhole modelaser weld pools is observed as is the Marangoni effectdriven fluid flow, which drives molten metal to the edgesof the pool. As expected, an increase in the laser powerproduces a larger pool overall. The width of the twophase mushy region also increases, which suggestsdifferent thermal cycles along the solidification front.A comparison of the experimental and calculated weldpool dimensions is shown in Figure 3. Good agreementis observed between both sets of values, except at the5.6 kW width where material expulsion was observed.At powers exceeding 5.6 kW and up to 10.6 kW,significant liquid metal expulsion occurred, indicatingthe onset of drilling.Examination of the fusion zone microstructure
revealed two distinct morphologies, cells and columnardendrites, and a range of scales. Figure 4 shows repre-sentative micrographs of cells and columnar dendrites inthe transverse fusion zone of the 3.8 kW weld. Themicrograph of the cells is taken near the root of theweld, where the scale of the cell spacing is about 3 lmdue to the relatively high cooling rates. At this location,cell growth occurs in a variety of directions, and the cells
Table II. Material Properties of Alloy 690 Used in the Calculations
Material Property Value Reference
Absorptivity of liquid 0.313 [30]Density of liquid at the melting point (kg m�3) 7500 [31]Density of liquid at the boiling point (kg m�3) 6100 [31]Viscosity of liquid (kg m�1 s�1) 0.0051 [31]Solidus temperature [K (�C)] 1616 (1343) [32]Liquidus temperature [K (�C)] 1650 (1377) [32]Enthalpy of solid at solidus (kJ kg�1) 879 [33]Enthalpy of liquid at liquidus (kJ kg�1) 1200 [33]Specific heat of solid (J kg�1 K�1) 665 [33]Specific heat of liquid (J kg�1 K�1) 673 [33]Thermal conductivity of solid (J m�1 s�1 K�1) 33 [34]Thermal conductivity of liquid (J m�1 s�1 K�1) 46 [31]Thermal conductivity of liquid at boiling point (J m�1 s�1 K�1) 47 [31]Coefficient of thermal expansion (K�1) 1.0 9 10�6 [31]Temperature coefficient of surface tension (mN m�1 K�1) �0.37 [31]
2144—VOLUME 45A, APRIL 2014 METALLURGICAL AND MATERIALS TRANSACTIONS A

are elongated reaching lengths of 60 lm or longer.While not observable in Figure 4, some cells grewperpendicular to the transverse plane. On the otherhand, columnar dendrites are located near the center ofthe weld finger and are much coarser than the cells withdendrite arm sizes of 4 to 5 lm. The middle and righthand side portion of Figure 4(b) shows well developedcolumnar dendrites, and left hand side shows tertiarydendrites and the weld centerline.
A broader overview of the 2.8 kW weld fusion zonealong with the calculated solidification direction (i.e.,��T) is given in Figure 5. Overall, the general wineglassshape of keyhole mode laser welds is observed as well assome porosity near the bottom of the weld due tokeyhole instability. In terms of cell, dendrite, and grainorientation, the direction of growth is a function ofposition in the weld. The calculated orientation vectorsare shown as unit vectors, so in 3D, the vectors have thesame magnitude. Small vectors indicate significantgrowth in the x-direction, perpendicular to the page.In the middle part of the weld finger, mainly horizontalgrowth dominates. For rest of the weld, the solidifica-tion structures grow vertically towards the top surface ofthe workpiece but to different degrees. At the top of theweld, growth is at 45 deg to the horizontal, while at theweld root growth is almost vertical.
The large spatial variation of solidification structuresize and morphology in both the whole fusion zone andindividual micrographs is illustrated in Figures 5(b)through (d). Part b shows the microstructure near thetop of the weld. Cells and dendrites exist together in thismicrograph with cells towards the left and dendrites inthe center and towards the right. This spatial variationindicates that the morphology parameter G/R is decreas-ing from left to right in Figure 5(b). The orientation ofgrowth becomes steeper from the fusion line to thecenter of the weld. Figure 5(c) also shows both cells anddendrites, but variation in scale is clear. Individual cellsare barely resolved at the fusion line, while relativelylarge dendrite arms can be seen at the centerline. Thisobservation indicates that the cooling rate has decreaseddramatically from the fusion line to the centerline.
Fig. 1—The 3D solidification surface and resulting weld profile, (a),and variation of the angle a with depth along the central longitudi-nal plane for a 2.8 kW weld, (b), are shown. Also shown is the rela-tionship between the welding speed, U, the solidification rate, R, andangle between the two vectors, a.
Fig. 2—The calculated molten pool profiles during keyhole modelaser welding are shown at different laser powers, (a) 1.0 kW, (b)2.8 kW, and (c) 4.7 kW. The boiling point, liquidus temperature,and solidus temperatures are 3085 K, 1650 K, and 1616 K (2812 �C,1377 �C, and 1343 �C), respectively. The fluid velocity reference vec-tor of 500 mm s�1 is also shown.
METALLURGICAL AND MATERIALS TRANSACTIONS A VOLUME 45A, APRIL 2014—2145

Significant horizontal columnar dendrite growth isshown in Figure 5(c). Only fine cells growing in a nearlyvertical direction are observed in Figure 5(d). This
observation indicates relatively high values of GR andG/R are expected.Qualitatively, the observed growth directions and
calculated growth directions agreed well, indicating thatthe experimental and calculated heat transfer directionsare quite close. While observation of the fusion zoneindicates that G/R varied enough to produce cells andcolumnar dendrites, the variation was not significantenough to produce equiaxed dendrites or significantamounts of planar solidification, which is observablejust at the edge of the fusion zone in Figure 5. Withtypical values for alloying element diffusion in liquidmetal, the minimum G/R value necessary for planarsolidification can be estimated[15] and is on the order of7000 K s mm�2. So, based on experimental observa-tions, G/R is at least 7000 K s mm�2 at the edge of thefusion zone, but at all other locations, the value is less.
B. Solidification Parameters
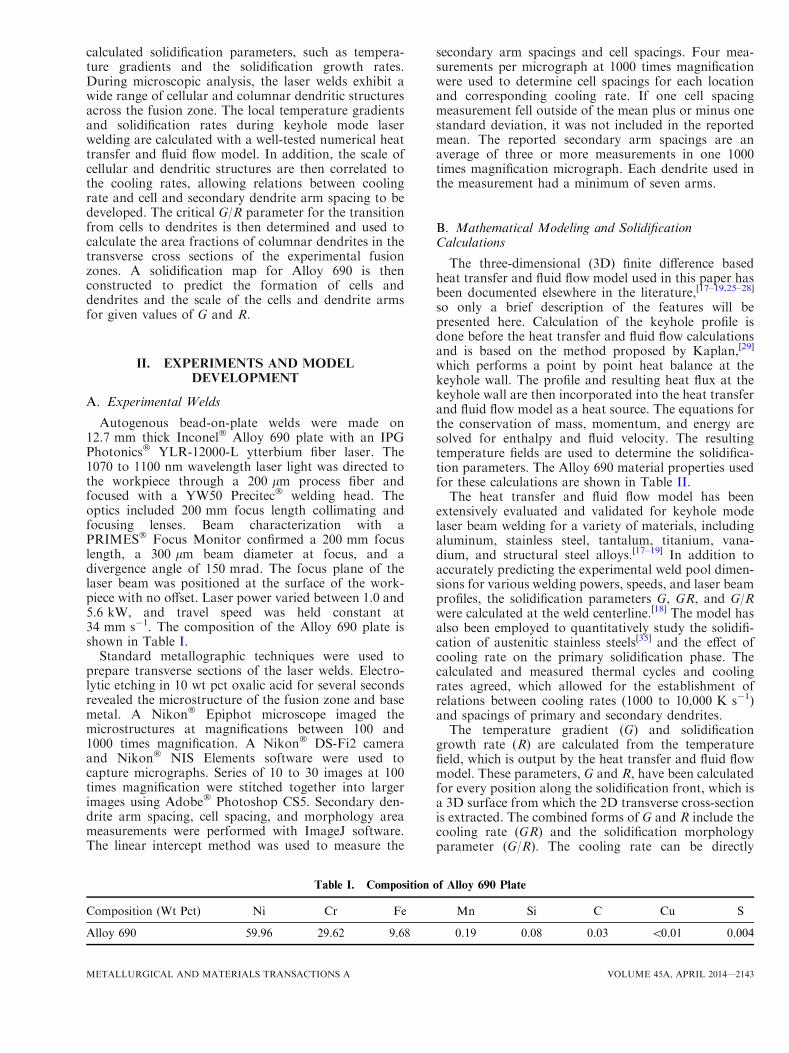
Figure 6 illustrates the variation of G and R as afunction of depth along the central x–z plane in a2.8 kW weld. The weld pool profile along the centrallongitudinal plane is shown as well in order to demon-strate how the shape of the solidification front affects thesolidification parameters. The direction of heat transfer,which is aligned to the solidification direction, can bediscerned by the slope of the liquidus contour [1650 K(1377 �C)]. A more vertical slope (i.e., the surfacenormal is closer aligned to the weld direction) producesa higher solidification rate. If the slope is close to zero,or the liquidus contour is nearly horizontal, the solid-ification rate is low. The magnitude of temperaturegradient is qualitatively represented by how close the
Fig. 3—The calculated and experimental molten pool dimensions areshown as a function of laser power for a travel speed of 34 m s�1.The experimental and calculated molten pool widths and depthsshow good agreement.
Fig. 4—The solidification structures observed in this study are (a)cells and (b) dendrites. The cells and dendrites near the root andcenter of the fusion zone, respectively, of a 3.8 kW weld are shown.
Fig. 5—The scale, mode, and orientation of solidification variesacross the transverse section of the 2.8 kW weld. In (a) the generalprofile is shown with the positions of (b), (c), and (d) highlightedwith rectangles. The calculated orientation of the solidifying cells,dendrites, and grains are shown in (a) based on the direction of heatflow at those positions.
2146—VOLUME 45A, APRIL 2014 METALLURGICAL AND MATERIALS TRANSACTIONS A
solidus and liquidus lines are to one another, or,alternatively, the width of the mushy zone. A largermushy zone is associated with a lower temperaturegradient.
In Figure 6, the slope of the liquidus contour and thewidth of the mushy zone decrease from the top to half thedepth of the weld, which is represented by the increase inthe temperature gradient and decrease in solidificationrate. This behavior is typically observed in ellipsoidalweld pools produced by arcs and low intensity lasers.[36,37]
However, due to the nature of the keyhole heat source,which extends into the depth of the weld pool, at half thedepth along the weld centerline, both the verticality of theliquidus contour and mushy zone width increase sharply.This change results in a decrease of G and increase of R.These two characteristics, mushy zone width and liquiduscontour slope, then decrease again as the liquidus contourapproaches the bottom of the keyhole. Along the centralx–z plane, the temperature gradient varies over fourorders of magnitude from the top of the weld to thebottom, and the shapes of these two curves will impact thecombined forms of G and R.
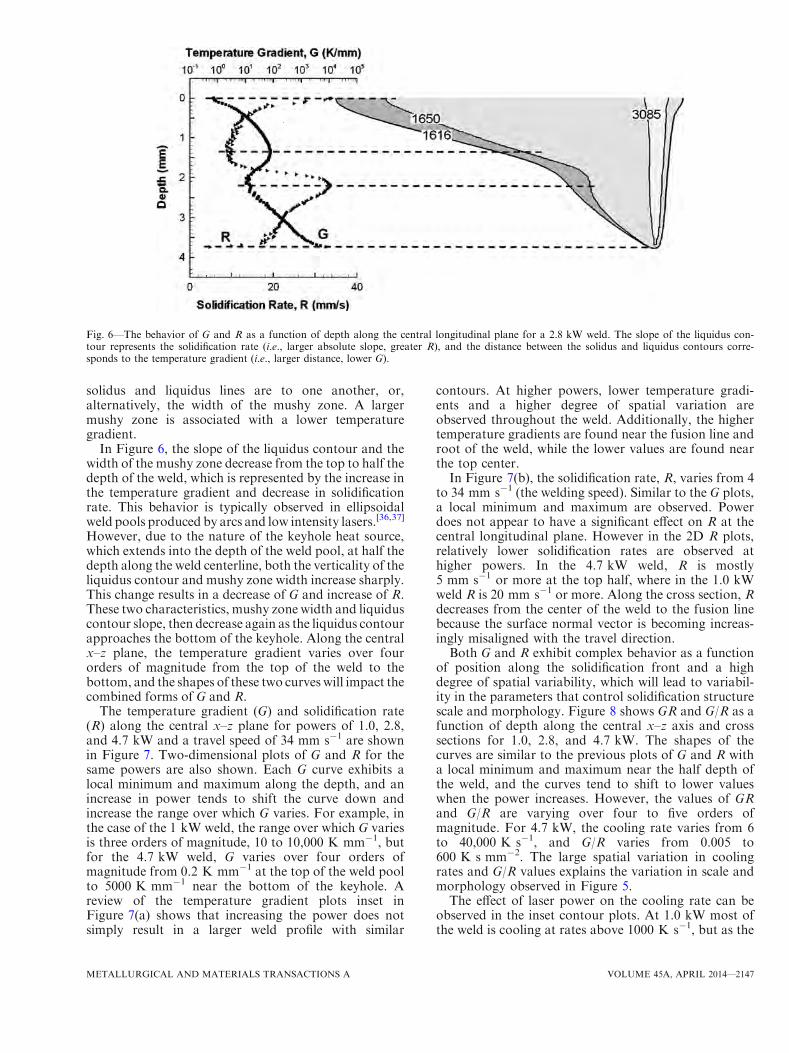
The temperature gradient (G) and solidification rate(R) along the central x–z plane for powers of 1.0, 2.8,and 4.7 kW and a travel speed of 34 mm s�1 are shownin Figure 7. Two-dimensional plots of G and R for thesame powers are also shown. Each G curve exhibits alocal minimum and maximum along the depth, and anincrease in power tends to shift the curve down andincrease the range over which G varies. For example, inthe case of the 1 kW weld, the range over which G variesis three orders of magnitude, 10 to 10,000 K mm�1, butfor the 4.7 kW weld, G varies over four orders ofmagnitude from 0.2 K mm�1 at the top of the weld poolto 5000 K mm�1 near the bottom of the keyhole. Areview of the temperature gradient plots inset inFigure 7(a) shows that increasing the power does notsimply result in a larger weld profile with similar
contours. At higher powers, lower temperature gradi-ents and a higher degree of spatial variation areobserved throughout the weld. Additionally, the highertemperature gradients are found near the fusion line androot of the weld, while the lower values are found nearthe top center.In Figure 7(b), the solidification rate, R, varies from 4
to 34 mm s�1 (the welding speed). Similar to the G plots,a local minimum and maximum are observed. Powerdoes not appear to have a significant effect on R at thecentral longitudinal plane. However in the 2D R plots,relatively lower solidification rates are observed athigher powers. In the 4.7 kW weld, R is mostly5 mm s�1 or more at the top half, where in the 1.0 kWweld R is 20 mm s�1 or more. Along the cross section, Rdecreases from the center of the weld to the fusion linebecause the surface normal vector is becoming increas-ingly misaligned with the travel direction.Both G and R exhibit complex behavior as a function
of position along the solidification front and a highdegree of spatial variability, which will lead to variabil-ity in the parameters that control solidification structurescale and morphology. Figure 8 shows GR and G/R as afunction of depth along the central x–z axis and crosssections for 1.0, 2.8, and 4.7 kW. The shapes of thecurves are similar to the previous plots of G and R witha local minimum and maximum near the half depth ofthe weld, and the curves tend to shift to lower valueswhen the power increases. However, the values of GRand G/R are varying over four to five orders ofmagnitude. For 4.7 kW, the cooling rate varies from 6to 40,000 K s�1, and G/R varies from 0.005 to600 K s mm�2. The large spatial variation in coolingrates and G/R values explains the variation in scale andmorphology observed in Figure 5.The effect of laser power on the cooling rate can be
observed in the inset contour plots. At 1.0 kW most ofthe weld is cooling at rates above 1000 K s�1, but as the
Fig. 6—The behavior of G and R as a function of depth along the central longitudinal plane for a 2.8 kW weld. The slope of the liquidus con-tour represents the solidification rate (i.e., larger absolute slope, greater R), and the distance between the solidus and liquidus contours corre-sponds to the temperature gradient (i.e., larger distance, lower G).
METALLURGICAL AND MATERIALS TRANSACTIONS A VOLUME 45A, APRIL 2014—2147

power increases, significant parts of the weld are coolingat rates less than 1000 K s�1. At the highest power, alarge section of the top of the weld is cooling at less than100 K s�1. The 2D G/R plots also show the effects ofpower on the distribution of the solidification structuremorphology. The G/R contour of 13 K s mm�2 ischosen because it is close to the transition value fromcellular to columnar dendritic morphologies, so atvalues less than 13 K s mm�2, the morphology is likelyto be dendritic. As power increases, the amount of theweld enclosed by the transition value contour increases,which means the area of the fusion zone containingdendritic structures should increase. Another observa-tion of the same contour shows that it is not continuousalong the depth for the 1 kW weld, indicating thattransitions from dendrites to cells to dendrites may beobservable at the center of the fusion zone.
The calculated solidification rates shown in Figure 8(a)are greater than 10 mm s�1 in most cases indicating that
rapid solidification may play an important role in thefusion zones of thesewelds.[38]A calculation considering aNi-30 wt pct Cr binary system shows that the underco-oling is within the experimental range consistent withequilibrium solidification. If the thermal and kineticundercooling are neglected, the total undercooling, DT,can be determined by[39]
DT ¼ DTC þ DTR ¼DG
R�mLRr 1� kð ÞC0
Dþ 2/
r; ½5�
where DTC is the constitutional undercooling, DTR is theundercooling due to curvature, D is the diffusioncoefficient for chromium in molten nickel,[40] G/R isthe morphology parameter, mL is the slope of theliquidus line in the Ni-Cr binary phase diagram, R is thesolidification rate, r is the radius of curvature of thegrowing cell or dendrite, k is the distribution coefficientin the Ni-Cr system,[41] C0 is the composition of the Ni-Cr alloy, and / is the Gibbs–Thomson coefficient. TheG/R value is taken from Figure 8(b) for values at high
Fig. 7—The solidification parameters, (a) temperature gradient (G)and (b) solidification rate (R), are plotted as a function of depthalong the central x–z plane and in 2D contour plots for variouspowers.
Fig. 8—The combined forms of solidification rate and temperaturegradient, (a) cooling rate (GR) and (b) morphology parameter (G/R),are plotted as a function of depth along the central x–z plane and in2D contour plots for various powers.
2148—VOLUME 45A, APRIL 2014 METALLURGICAL AND MATERIALS TRANSACTIONS A

solidification rates. The value for the radius of curvatureand Gibbs–Thomson coefficient are typical values fromKurz and Fisher.[38] For the values given in Table III,the undercooling is 13 K. Kraus[42] measured undercoo-lings as high as 30 K in stainless steel weld pools, whereequilibrium solidification was observed. Due to the lowcalculated undercooling, the effects of rapid solidifica-tion were not included in the model.
C. Scale of the Solidification Structures
The size and scale of cells and dendrites are known tovary as a function of cooling rate.[15] The cooling ratevaried significantly over the range of laser powersinvestigated. The measured cell and secondary dendritearm spacings were correlated to the calculated coolingrates (GR) at various positions in the weld cross section.Figure 9 shows the effect of the calculated cooling rateon experimental cell spacing and secondary dendritearm spacing. The n value, which is defined as
log spacingð Þ ¼ n log GRð Þ þ log bð Þ ½6�
is provided for each structure. The relation in Eq. [6] iswell established in the study of secondary arm spacingsand is based on the solidification time being inverselyproportional to the cooling rate.[15] A more detaileddescription by Kurz and Fisher,[38] which uses a similarrelation, assumes competing growth between two cylin-ders (i.e., secondary dendrite arms).
In Figure 9, the cell spacing ranges from 3.9 lm at8000 K s�1 to 1.7 lm at 90,000 K s�1. The secondarydendrite arm spacing varies from 4.0 lm at 200 K s�1 to1.4 lm at 7000 K s�1. These data compare well tosimilar data for 201 stainless steel.[43] Additionally, themeasured cell and secondary arm spacings from theliterature for Alloy 690 showed cell and dendrite armspacings of about 4 lm for comparable heat inputs.[8,10]
The data points shown in Figure 9 represent a combi-nation of 87 and 58 linear intercept measurements forcells and dendrite arms, respectively. The standarddeviations for the measurements vary from 0.06 to1.01 lm. Median standard deviations are 0.35 and0.28 lm for cell and secondary dendrite arm spacings,respectively, and are comparable to the standard devi-ations of similarly sized stainless steel spacing measure-ments.[35]
The following relations give the size of the solidifica-tion structures in microns as a function of cooling rate(K s�1) in the general form k = b(GR)n, based on thefitted lines in Figure 9
kCS ¼ 60:6 GRð Þ�0:31; ½7�
kDAS ¼ 17:9 GRð Þ�0:29; ½8�
where kCS is the cell spacing and kDAS is the secondarydendrite arm spacing. These cooling rate relations aremuch more precise than any heat input relations since,as demonstrated previously, the cooling rate can varysignificantly as a function of position in a weld pool forany given heat input. These data are not limited to justlaser welding and can be applied to various processesthat require or incorporate solidification processing,including casting, conventional arc welding, and otherhigh energy beam processes.
D. Morphology of the Solidification Structures
The parameter G/R, which determines the morphol-ogy of the solidification structure, can be calculated andcorrelated to the experimental microstructure in thefusion zone. In the fusion zone, the solidificationstructure consisted mostly of cells and columnar den-drites since significant amounts of equiaxed dendritesand planar solidification were not observed. The areafractions of cells and columnar dendrites were measuredby optical microscopy. The values of G/R werecorrelated with the observed solidification structure inthe fusion zone. The computed G/R values were13 K s mm�2 or lower in all areas where columnardendrites were observed. Similarly, the computed G/Rvalues were 21 K s mm�2 or higher where cellularstructure was observed. The transition between colum-nar dendrites and cellular structure occurred between 13and 21 K s mm�2. By using the value of G/R thatcorresponds to the cells and columnar dendrites, thearea fractions of the two solidification structures in thetransverse cross-section of the weld can be calculated.
Table III. The Values Necessary for the Undercooling Calculation are Given
D Ref. [40] G/R mL Ref. [41] R r Ref. [38] k Ref. [41] C0 u Ref. [38]
5 9 10�9 (m2 s�1) 106 (K s m�2) �2 (K/wt pct Cr) 0.034 (m s�1) 5 9 10�8 (m) 0.55 30 (wt pct Cr) 10�7 (K m)
Fig. 9—The measured cell spacing (circles) and secondary dendritearm spacing (squares) are shown as a function of calculated coolingrate. The 201 stainless steel[43] system is shown for comparison.
METALLURGICAL AND MATERIALS TRANSACTIONS A VOLUME 45A, APRIL 2014—2149

A transverse cross section of the fusion zone is shownin Figure 10. If the G/R value is less than the criticalvalue for the transition from dendrites to cells, then they–z face of the control volume is assigned to the dendritearea, or D in the schematic. In this way the total area ofcells and dendrites is determined. The area fractions arethe areas of cells or dendrites divided by the total area.Figure 11 shows the experimental and calculated fusionzone area fractions of columnar dendrites with twodifferent critical G/R values. Only the fraction of cellsand columnar dendrites are considered, since significantamounts of equiaxed dendrites and planar solidificationwere not observed. For the conditions examined in this
study, the area fraction of columnar dendrites barelyexceeds 0.5 for a laser power of 4.7 kW. The modelcalculations and experimental measurements agree.The size and morphology of the solidification struc-
tures within the experimental welds have been correlatedto calculate solidification parameters. A solidificationmap for Alloy 690 can now be constructed to predict thesolidification morphology and the scale of the structure.This map is shown in Figure 12. The solid straight linedelineates the cellular and columnar dendritic regions ofthe map. Cooling rates are represented by the dashedcurved lines and show the cell spacings and secondarydendrite arm spacings calculated from Eqs. [5] and [6],respectively. This map has a number of practicalapplications. For any given welding parameters, theminimum size of secondary arm spacings can bedetermined immediately based on the welding speedsince the solidification rate can not exceed the weldingspeed. For example, if the welding speed is set to25 mm s�1, then a secondary arm spacing of 1.3 lm ispossible, while a value of 1.0 lm is not. On the otherhand, cell spacings greater than 2.6 lm would beexpected for most of the weld, where the temperaturegradient is 1000 K mm�1 or less. Spacings less than2.6 lm would be confined to high temperature gradientand cooling rate regions, such as the root of the weldand near the fusion line. In addition, the wide range of Gand R values makes the map applicable to any process,where solidification processing of Alloy 690 is necessary.
IV. SUMMARY AND CONCLUSIONS
The solidification parameters of Inconel� Alloy 690during keyhole mode laser welding have been calculatedusing a mathematical model, and correlated with exper-imentally determined solidification structure. The largevariation in the solidification parameter values in thefusion zone of the laser welds allowed for the construction
Fig. 10—A schematic of the calculated fusion zone shows how thearea fractions of cells and dendrites are calculated. If the calculatedG/R value of a given control volume is greater than the criticalvalue, then the area of the y–z face is assigned to the cell area frac-tion. Otherwise, the area is added to the dendrite area fraction.
Fig. 11—A comparison between the calculated and experimentalarea fractions of columnar dendrites shows good agreement. The dif-ferent G/R values represent the lowest value at which cells wereobserved and greatest value where columnar dendrites were observed.
Fig. 12—The solidification map shows the transition from cellular tocolumnar dendritic morphology with various cooling rates. Alongeach cooling rate is the cell spacing and secondary dendrite armspacing, which are determined from Eqs. [5] and [6]. With this mapthe scale and morphology of the solidification structures can be pre-dicted quantitatively.
2150—VOLUME 45A, APRIL 2014 METALLURGICAL AND MATERIALS TRANSACTIONS A

of a solidification map that describes the scale andmorphology of the solidification structures for givenvalues of G and R.
1. A large spatial variation of the calculated solidifica-tion parameters was observed. Along the centrallongitudinal plane, the G/R value could vary up tofive orders of magnitude. In both the transversecross section and the central longitudinal plane,increases in laser power lead to a significantincrease in the spatial variation of the solidificationparameters.
2. The measured cell and secondary dendrite armspacings were correlated to the calculated solidifica-tion parameters and expressed as functions of cool-ing rate in the form k = b(GR)n. These expressionscan be applied for a variety of welding processesand conditions. G/R values of 13 and 21 K s mm�2,which are associated with the transition from cellu-lar to columnar dendritic solidification structures,were used to calculate the dendrite area fractions,which agreed with the measured values.
3. A map of solidification scales and morphologies forAlloy 690 was constructed based on the data pre-sented in this work. The cell and dendrite arm sizesand the cellular and dendritic morphology regionsare plotted as a function of the temperature gradi-ent, G, and the solidification rate, R. The utility ofthe map was highlighted by describing how mini-mum secondary dendrite arm spacings can beselected based on the welding speed. Due to thelarge range of G and R values captured in thesekeyhole mode laser welds, the map has very wideapplicability to a range of materials processes fromcasting to arc and laser welding.
ACKNOWLEDGMENTS
The authors would like to thank Mr. Jay Tresslerand Mr. Ed Good for their assistance during the weld-ing experiments and metallography. This research wasperformed using funding received from the DOEOffice of Nuclear Energy’s Nuclear Energy UniversityPrograms under Grant Number 120327.
REFERENCES1. Q.Z. Zuo, F. Liu, L. Wang, and C. Chen:Metall. Mater. Trans. A,
2013, vol. 44A, pp. 3014–27.2. F. Azarmi and C.P. Leither: Metall. Mater. Trans. A, 2012,
vol. 43A, pp. 4703–10.3. M. Xie, R. Helmink, and S. Tin: Metall. Mater. Trans. A, 2012,
vol. 43A, pp. 1259–67.4. C.L. Brundidge, D. Vandrasek, B. Wang, and T.M. Pollock:
Metall. Mater. Trans. A, 2012, vol. 43A, pp. 965–76.5. T.D. Anderson, J.N. DuPont, and T. DebRoy: Acta Mater., 2010,
vol. 58, pp. 1441–54.
6. T. Allen, J. Busby, M. Meyer, and D. Petti: Mater. Today, 2010,vol. 13, pp. 14–23.
7. S. Fukumoto and W. Kurz: ISIJ Int., 1999, vol. 39, pp. 1270–79.8. G.J. Abraham, R. Bhambroo, V. Kain, G.K. Dey, and V.S. Raja:
J. Mater. Eng. Perform., 2013, vol. 22, pp. 427–32.9. S.-L. Jeng and Y.-H. Chang: Mater. Sci. Eng. A, 2012, vol. 555,
pp. 1–12.10. H.T. Lee and J.L. Wu: Corros. Sci., 2009, vol. 51, pp. 439–45.11. H.T. Lee and T.Y. Kou: Sci. Technol. Weld. Join., 1999, vol. 4,
pp. 246–56.12. T.-Y. Kou, H.T. Lee, and C.C. Tu: Sci. Technol. Weld. Join., 2003,
vol. 8, pp. 39–48.13. T.-Y. Kou and H.-T. Lee: Mater. Sci. Eng. A, 2002, vol. 338,
pp. 202–12.14. A. Raghavan, H. Wei, T.A. Palmer, and T. DebRoy: J. Laser
Appl., 2013, vol. 25, art. no. 052006.15. S. Kou: Welding Metallurgy, 2nd ed., Wiley, Hoboken, NJ, 2003.16. W. Zhang, G.G. Roy, J.W. Elmer, and T. DebRoy: J. Appl. Phys.,
2003, vol. 93, pp. 3022–33.17. R. Rai, G.G. Roy, and T. DebRoy: J. Appl. Phys., 2007, vol. 101,
art. no. 054909.18. R. Rai, J.W. Elmer, T.A. Palmer, and T. DebRoy: J. Phys. D,
2007, vol. 40, pp. 5753–66.19. R. Rai, S.M. Kelly, R.P. Martukanitz, and T. DebRoy: Metall.
Mater. Trans. A, 2008, vol. 39A, pp. 98–112.20. T.D. Anderson, J.N. DuPont, and T. DebRoy: Metall. Mater.
Trans. A, 2010, vol. 41A, pp. 181–93.21. J.D. Hunt: Mater. Sci. Eng., 1984, vol. 65, pp. 75–83.22. M. Gaumann, R. Trivedi, and W. Kurz: Mater. Sci. Eng. A, 1997,
vols. 226–228, pp. 763–69.23. M. Gaumann, C. Bezencon, P. Canalis, and W. Kurz: Acta
Mater., 2001, vol. 49, pp. 1051–62.24. W. Tan, N.S. Bailey, and Y.C. Shin: J. Manuf. Sci. Eng., 2012,
vol. 134, p. 041010.25. W. Zhang, C.-H. Kim, and T. DebRoy: J. Appl. Phys., 2004,
vol. 95, pp. 5210–19.26. H.Zhao andT.DebRoy: J.Appl. Phys., 2003, vol. 93, pp. 10089–96.27. B. Ribic, R. Rai, and T. DebRoy: Sci. Technol. Weld. Join., 2008,
vol. 13, pp. 683–93.28. B. Ribic, S. Tsukamoto, R. Rai, and T. DebRoy: J. Phys. D, 2011,
vol. 44, art. no. 485203.29. A. Kaplan: J. Phys. D, 1994, vol. 27, pp. 1805–14.30. S. Krishnan and P.C. Nordine: J. Appl. Phys., 1996, vol. 80,
pp. 1735–42.31. W.F. Gale and T.C. Totemeier: Smithells Metals Reference Book,
8th ed., Elsevier Butterworth-Heinemann, Burlington, VT, 2004.32. Special Metals Corporation: INCONEL� Alloy 690 Data Sheet,
Publication Number SMC-079, 2009, http://www.specialmetals.com/documents/Inconel%20alloy%20690.pdf, Accessed 9 July2013.
33. L.B. Pakratz: Thermodynamic Properties of Elements and Oxides,U.S. Dept. of the Interior, Bureau of Mines, District of Columbia,1982.
34. Y.V. Glagoleva, N.B. Pushkareva, Y.E. Lapshova, O.V. Sadyreva,V.R. Polev, V.I. Gorbatov, S.G. Taluts, and I.G. Korshunov:Phys. Met. Metallogr., 2006, vol. 102, pp. 48–54.
35. M.A. Valiente-Bermejo, L. Karlsson, and T. DebRoy: 14th NordicLaser Materials Processing Conference, 2013, pp. 3–14.
36. W. Liu and J.N. Dupont: Acta Mater., 2004, vol. 52, pp. 4833–47.37. J.M. Vitek: Acta Mater., 2005, vol. 53, pp. 53–67.38. W. Kurz and D.J. Fisher: Fundamentals of Solidification, 3rd ed.,
Trans Tech Publications, Brookfield, VT, 1989.39. S.A. David and J.M. Vitek: Int. Mater. Rev., 1989, vol. 34,
pp. 213–45.40. S. Nikolic, A. Golubovic, V. Radojevic, A. Valcic, and B.
Jordovic: J. Metall., 2004, vol. 10, pp. 289–93.41. P. Nash: Alloy Phase Diagrams, ASM International, Materials
Park, OH, 1991, vol. 3.42. H.G. Kraus: Weld. J., 1987, vol. 66, pp. S353–59.43. A. Paul and T. DebRoy: Metall. Trans. B, 1988, vol. 19B,
pp. 851–58.
METALLURGICAL AND MATERIALS TRANSACTIONS A VOLUME 45A, APRIL 2014—2151

Appendix B:
Real Time Monitoring of Laser Beam Welding Keyhole Depth by Laser Interferometry

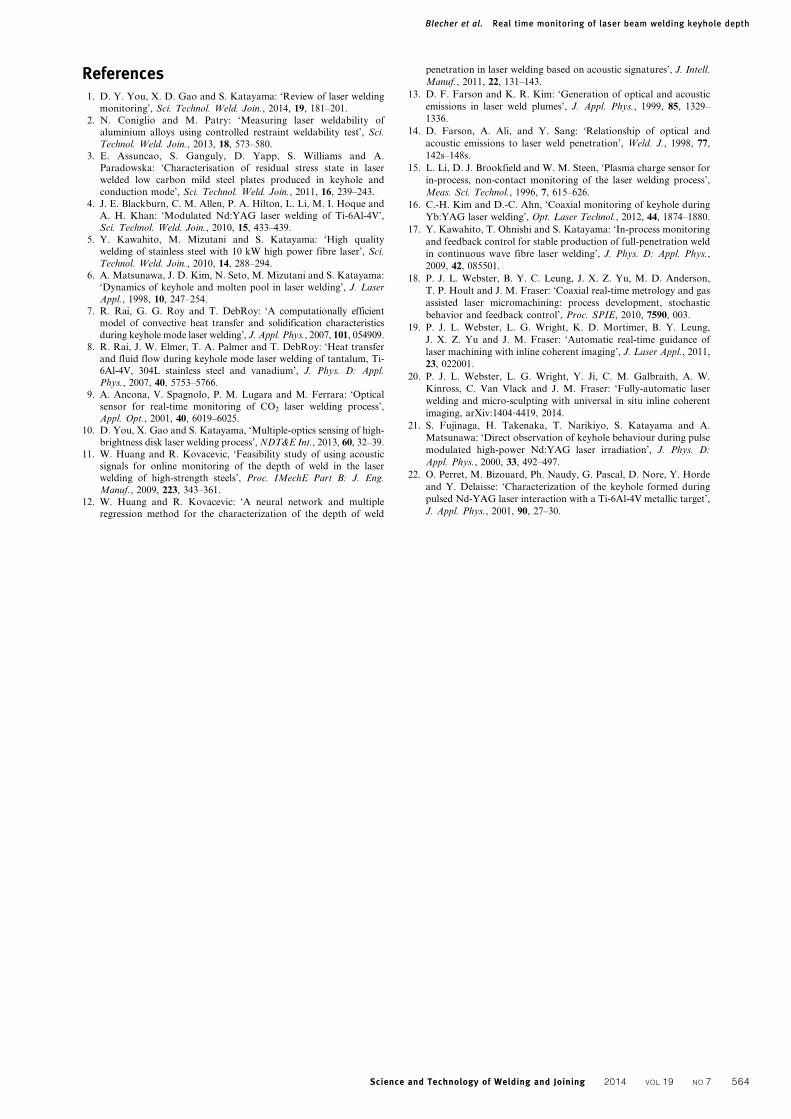
Real time monitoring of laser beam weldingkeyhole depth by laser interferometry
J. J. Blecher*1, C. M. Galbraith2, C. Van Vlack3, T. A. Palmer4, J. M. Fraser2,P. J. L. Webster3 and T. DebRoy1
The utility of a new laser interferometric technique, inline coherent imaging, for real time keyhole
depth measurement during laser welding is demonstrated on five important engineering alloys.
The keyhole depth was measured at 200 kHz with a spatial resolution of 22 mm using a probe
beam, which enters the keyhole coaxially with the process beam. Keyhole fluctuations limited
average weld depth determination to a resolution on the order of 100 mm. Real time keyhole depth
data are compared with the weld depths measured from the corresponding metallographic cross-
sections. With the exception of an aluminium alloy, the technique accurately measured the
average weld depth with differences of less than 5%. The keyhole depth growth rates at the start
of welding are measured and compare well with order of magnitude calculations. The method
described here is recommended for the real time measurement and control of keyhole depth in at
least five different alloys.
Keywords: Laser keyhole, Welding, Weld monitoring, Laser interferometry, Keyhole depth, Keyhole growth rate
IntroductionThe ability of lasers to produce deep penetration weldsin thick plates of 20 mm and more depends on theformation of a stable keyhole.1–5 At present there is nowidely accepted technique for the real time measurementof keyhole depth during laser welding. While X-rayvideography views the keyhole directly in plates thinenough to allow X-ray transmission,6 the technique isnot generally used outside a laboratory environment.Mathematical modelling of heat transfer can predictsteady state keyhole depths for various materials7,8 butrequires access to a rigorously validated numericalmodel. Popular methods for monitoring depth andporosity generation rely on indirect observation of thekeyhole behaviour, such as capturing the optical9,10 andacoustic11,12 signals produced by vapour escaping thekeyhole.13,14 Other techniques include measuring plasmacharge,15 viewing the weld with cameras,10,16,17 orutilising a combination of sensors.10,17 Owing to theirnature, however, indirect measurements are subject tonumerous difficulties, requiring additional calibrationeach time a process or material parameter changes. Aneed exists for a direct measurement of keyhole depthwith a high degree of process flexibility.
Recently developed inline coherent imaging (ICI)
directly measures the keyhole depth in real time.18–20
The high quality spatial and temporal resolution
inherent in this technique can capture keyhole depth
changes smaller than 10 mm over time periods shorter
than 10 ms.20 ICI is an interferometric technique that
directs a probe beam coaxially with the process beam
into the keyhole. As long as a keyhole is present, ICI
can directly measure the keyhole depth in any partial
penetration weld regardless of other process parameters.
For example, ICI has been used to measure the drill
hole depth in ferrous alloys during laser machining,18,19
and its application in laser welding is just beginning.20
In this paper, the utility of ICI to provide real time
measurements of keyhole depth is demonstrated in DH36
steel, 304 stainless steel, InconelH Alloy 690, Ti–6Al–4V,
and 2219 aluminium alloys. A wide range of industries,
including construction, energy, aerospace, and automo-
tive, utilise and join the alloys used in this study or
compositionally similar alloys. Keyhole depth measure-
ments are performed for each alloy and compared with
metallographic cross-sections. The initiation and growth
of the keyhole at the beginning of welding for the five
alloys are also studied with ICI. These data allow direct
measurement of the keyhole growth rates in the first 5 ms
of welding with unprecedented temporal resolutions on
the order of 5 ms. The keyhole growth rates are estimated
using energy balance between the laser energy and the
energy necessary to evaporate the liquid metal. The
theoretical growth rates show order of magnitude
agreement with the measured rates, indicating the
measured growth rates are realistic.
1Department of Materials Science and Engineering, The PennsylvaniaState University, University Park, PA 16802, USA2Department of Physics, Engineering Physics and Astronomy, Queen’sUniversity at Kingston, Kingston, Ontario, K7L 3N6, Canada3Laser Depth Dynamics Inc., Kingston, Ontario, K7L 2L1, Canada4Applied Research Laboratory, The Pennsylvania State University,University Park, PA 16802, USA
*Corresponding author, email [email protected]
� 2014 Institute of Materials, Minerals and MiningPublished by Maney on behalf of the InstituteReceived 18 April 2014; accepted 25 May 2014DOI 10.1179/1362171814Y.0000000225 Science and Technology of Welding and Joining 2014 VOL 19 NO 7 560

ExperimentsAn IPG Photonics YLS-1000-IC laser with a 100 mm coreprocess fibre coupled to a Laser Mechanisms AccuFiberhead with a 60 mm focal length collimator and a 150 mmfocal length lens were used to produce bead on plate weldson DH36 steel, 304 stainless steel, InconelH Alloy 690, Ti–6Al–4V, and 2219 aluminium alloys. The nominalcompositions are given in Table 1. A laser power andwelding speed of 1?1 kW and 25 mm s21 respectively,
was used with coaxial argon shielding gas for the welding
experiments. The focus of the process beam was located at
the surface of the material for all experiments. During
welding, ICI data were collected in real time. After
welding, six transverse sections were prepared from each
weld using standard metallographic techniques. A Nikon
DS-Fi2 camera attached to a Nikon Epiphot microscope
and Nikon NIS Elements software captured micrographs
of the welds.
Table 1 Compositions of various alloys that were welded in this study are given
Alloy Fe C Mn Si Cr Ni Ti Al V Cu
DH36 Bal. 0?18 1?25 0?30 0?25 0?40 … … 0?10 0?35304 Bal. 0?08 1?50 2?00 20?00 10?00 … … … …Alloy 690 10?00 0?03 0?19 0?08 30?00 Bal. … … … …Ti–6Al–4V 0?30 0?10 … … … … Bal. 6?00 4?00 …AA 2219 … … 0?30 … … … 0?06 Bal. 0?10 6?30
1 Metallographic cross-sections of a DH36 steel, b 304 stainless steel, c alloy 690, d Ti–6Al–4V, and e 2219 aluminium
are shown: each weld was created with laser power of 1?1 kW and welding speed of 25 mm s21
Blecher et al. Real time monitoring of laser beam welding keyhole depth
Science and Technology of Welding and Joining 2014 VOL 19 NO 7 561

Detailed descriptions of ICI are available in theliterature,18–20 so only a brief discussion of the importantfeatures is given here. ICI utilises a Michelson inter-ferometer construction with a reference and probe beam,using a superluminescent diode with a wavelength of843 nm and FWHM of 20 nm as the light source. Theprobe beam is directed through the same optics as the highpower process beam and into the keyhole, where the probebeam reflects off surfaces along its path. The referencebeam is set along a path of known distance with app-ropriate dispersion matching optics. The two beams arerecombined and directed to a spectrometer, which collectsthe interference pattern (measured integration time:1?5 ms). The positions of the scattering surfaces alongthe laser axis are determined with a resolution of 22 mmfrom the spectral interference pattern. After sampling ofthe interference pattern at 200 kHz over the length of theweld, the keyhole depth as a function of position isdetermined.
Results and discussionAutogenous bead on plate laser welds were made on fivealloys while simultaneous ICI measurements wereconducted. The metallographic cross-sections for eachweld are shown in Fig. 1. Keyhole mode welding wasachieved for each alloy, and with the exception of thehigh thermal conductivity aluminium alloy, the typicalwineglass shape is apparent. The weld depths in DH36steel, 304 stainless steel, Alloy 690, and Ti–6Al–4Vappear to be very similar. However, the width of thetitanium weld is greater than the others.
An example of the real time ICI measured keyholedepth in Alloy 690 along the length of the weld is shownin Fig. 2. The small panel on the left of the figure showsa small portion of the pre-scan, which gives the positionof the surface, shown as the black line at the top, and isnecessary to acquire absolute keyhole depth measure-ments with the greatest possible accuracy. The faintsignal around 2400 mm depth in the pre-scan is due to animaging artifact and does not represent a real scatteringsurface. The large image displays both the raw ICI dataand the depth of the keyhole. Dark spots in the imageindicate the position of a reflective interface along thebeam path. Typically, the strongest reflections are fromthe molten metal at the bottom of the keyhole, however
due to the dynamic nature of the keyhole shape, scatterfrom the keyhole front wall and side wall can beobserved at intermediate depths. Blue points representthe ICI measured keyhole depth as determined by adepth tracking algorithm. At distance zero in Fig. 2, thelaser weld starts, and the keyhole depth increases to2?3 mm once 4 mm of weld length has been fabricated.Over the course of the weld, the ICI measured keyholedepth fluctuates between extremes of 2?1 and 2?8 mm,which represent a maximum change of 22% in themeasured depth of the weld determined from themetallographic cross-section.
An important issue in any new technique is theaccuracy of the measurements. Figure 3 shows a compar-ison of the average ICI depth measurements and welddepths determined by transverse metallographic cross-sections. The metallographic depths shown in this figureare an average of six measurements taken at different
2 ICI image of weld in Alloy 690 is presented: left panel
shows height of plate surface determined from pre-
scan measurement: large pane shows raw ICI data
(dark spots) and keyhole depth (blue dots)
3 Comparison of ICI depth measurements and depths
from metallographic cross-sections is shown: ICI weld
depth was averaged from depth tracking algorithm
across entire weld region; black bars represent stan-
dard deviation of depths measured by each technique;
two sets of measurements agree except in case of AA
2219
4 ICI measured keyhole depths during first 5 ms, or
0?125 mm, of welding show how fast keyhole initiates
and grows for each alloy: aluminium 2219 is slowest to
initiate and grow keyhole, while Ti–6Al–4V is fastest
Blecher et al. Real time monitoring of laser beam welding keyhole depth
Science and Technology of Welding and Joining 2014 VOL 19 NO 7 562

positions in the weld with the black bars representing onestandard deviation, which is estimated from the same sixmeasurements. For the ICI data set, the black bars aregiven by the standard deviation of measurements takenover the length of the weld and are representative of realvariation in the keyhole depth. The precision of aninstantaneous ICI keyhole depth measurement is limitedby the axial resolution of the system, which at 22 mm, isan order of magnitude smaller than the observed keyholedepth fluctuations. In every case the measured keyholedepth is slightly smaller than the measured weld depth,which agrees with modelling results showing that the welddepth is always slightly greater than the keyhole depth.7,8
With the exception of the 2219 aluminium alloy, verygood agreement is observed between the ICI and themetallographic measurements across a wide alloy com-position range, indicating that inline coherent imagingcan be used as a real time process monitoring tool forcapturing keyhole depths. To give a consistent compar-ison, the same imaging parameters were used for all fivealloys. In the case of aluminium, the high melt reflectivityresulted in intermittent saturation of the ICI system.When combined with the large, rapid fluctuations inkeyhole depth characteristic of this alloy, the averagedICI depth measurements were biased toward artificiallyshallow values. Optimisation of imaging parameters andalgorithmic interpretation of the ICI data is expected toimprove the accuracy in aluminium weld depths.
To demonstrate the spatial and temporal resolution ofthe technique, the initial formation and growth ofkeyholes are shown in Fig. 4. At time zero, the laserbeam turns on, and processing begins. In aluminium,there is a 1?6 ms delay between the beam turning on anda rapid increase in depth at a rate of 0?56 m s21. Theobserved delay is consistent with aluminium’s relativelyhigh reflectivity and thermal conductivity. In the otheralloys during the initial 1 ms of welding, the keyholesgrew at rates between 0?91 and 1?11 m s21. Otherstudies have found initial growth rates in 304 stainlesssteel21 and Ti–6Al–4V22 for laser powers of 2?3 and8?7 kW to be 1?50 and 0?66 m s21 respectively, whenmeasured with X-ray transmission videography, whichhas temporal resolutions21,22 of 200 ms, compared to the5 ms achieved here. The difference in temporal resolutionis important for two reasons in this case. First, a moreaccurate determination of the onset of keyhole forma-tion can be made for the aluminium alloy. Second, thegrowth rates in the other four alloys can be differ-entiated. With X-ray transmission videography, thegrowth rates in steel, stainless steel, Alloy 690, and Ti–6Al–4V would have appeared the same. Unfortunately,the accuracy of the X-ray and ICI keyhole depthmeasurement techniques cannot be compared since thisinformation was not given in the studies of X-raytransmission videography.
Order of magnitude keyhole growth rates can beestimated by equating the laser energy absorbed by theworkpiece and the energy necessary to evaporate theliquid metal at any point on the vaporising surface. Thistheoretical growth rate is
u~gIL
rDHv
(1)
where g is the absorptivity of the liquid metal, IL is thepeak intensity of the laser, approximately 130 kW mm22,r is the density of the liquid metal, and DHv is the latentheat of vaporisation. The necessary material propertiesand the measured and calculated growth rates are shownin Table 2. The order of magnitude estimates agree withthe ICI measured keyhole growth rates in DH36 steel, 304stainless steel, Alloy 690, and Ti–6Al–4V, indicating thatthe scale analysis can be used to estimate the keyholegrowth rates in these alloys when the relevant processparameters and material properties are known. In thecase of aluminium alloy 2219, the ICI measured keyholegrowth rate was lower than that estimated by scaleanalysis assuming no heat loss. The comparison showsconsiderable heat loss by conduction in the alloy.
ConclusionsThe application of inline coherent imaging to keyholedepth monitoring in laser welding has been demon-strated. The findings from this work are listed below.
1. Real time keyhole depth measurements fromautogenous bead on plate welds of five alloys werecompared to depths from metallographic transversecross-sections. The two sets of data show good agree-ment, indicating that the technique can be applied to awide range of different alloys and maintain the ability tomeasure the keyhole depth in real time.
2. The initiation and growth of the keyholes wasinvestigated with real time measurements. The observedkeyhole growth rates between 0?56 and 1?11 m s21
compare well to previous measurements, which usedX-ray videography. The initial keyhole growth ratesmeasured by the inline coherent imaging technique agreewell with the corresponding values estimated by scaleanalysis.
Acknowledgements
The authors would like to thank Mr. Ed Good for hisassistance with the metallography. This research wasperformed using funding received from the DOE Officeof Nuclear Energy’s Nuclear Energy UniversityPrograms under grant no. 120327, the NaturalSciences and Engineering Research Council of Canada,the Ontario Centres of Excellence, and the CanadianFoundation for Innovation.
Table 2 Material properties used in heat balance and measured and calculated keyhole growth rates are given
DH36 304 S.S. A690 Ti–6Al–4V AA2219
Absorptivity g 0?33 0?32 0?29 0?31 0?19Density r/kg m23 7050 7070 7480 3970 2560Heat of Vaporisation DHv/kJ kg21 6260 6330 6450 8810 10 720Measured growth rate u/m s21 0?91 1?09 0?98 1?11 0?56Calculated growth rate u/m s21 0?97 0?93 0?78 1?15 0?90
Blecher et al. Real time monitoring of laser beam welding keyhole depth
Science and Technology of Welding and Joining 2014 VOL 19 NO 7 563
References1. D. Y. You, X. D. Gao and S. Katayama: ‘Review of laser welding
monitoring’, Sci. Technol. Weld. Join., 2014, 19, 181–201.
2. N. Coniglio and M. Patry: ‘Measuring laser weldability of
aluminium alloys using controlled restraint weldability test’, Sci.
Technol. Weld. Join., 2013, 18, 573–580.
3. E. Assuncao, S. Ganguly, D. Yapp, S. Williams and A.
Paradowska: ‘Characterisation of residual stress state in laser
welded low carbon mild steel plates produced in keyhole and
conduction mode’, Sci. Technol. Weld. Join., 2011, 16, 239–243.
4. J. E. Blackburn, C. M. Allen, P. A. Hilton, L. Li, M. I. Hoque and
A. H. Khan: ‘Modulated Nd:YAG laser welding of Ti-6Al-4V’,
Sci. Technol. Weld. Join., 2010, 15, 433–439.
5. Y. Kawahito, M. Mizutani and S. Katayama: ‘High quality
welding of stainless steel with 10 kW high power fibre laser’, Sci.
Technol. Weld. Join., 2010, 14, 288–294.
6. A. Matsunawa, J. D. Kim, N. Seto, M. Mizutani and S. Katayama:
‘Dynamics of keyhole and molten pool in laser welding’, J. Laser
Appl., 1998, 10, 247–254.
7. R. Rai, G. G. Roy and T. DebRoy: ‘A computationally efficient
model of convective heat transfer and solidification characteristics
during keyhole mode laser welding’, J. Appl. Phys., 2007, 101, 054909.
8. R. Rai, J. W. Elmer, T. A. Palmer and T. DebRoy: ‘Heat transfer
and fluid flow during keyhole mode laser welding of tantalum, Ti-
6Al-4V, 304L stainless steel and vanadium’, J. Phys. D: Appl.
Phys., 2007, 40, 5753–5766.
9. A. Ancona, V. Spagnolo, P. M. Lugara and M. Ferrara: ‘Optical
sensor for real-time monitoring of CO2 laser welding process’,
Appl. Opt., 2001, 40, 6019–6025.
10. D. You, X. Gao and S. Katayama, ‘Multiple-optics sensing of high-
brightness disk laser welding process’, NDT&E Int., 2013, 60, 32–39.
11. W. Huang and R. Kovacevic, ‘Feasibility study of using acoustic
signals for online monitoring of the depth of weld in the laser
welding of high-strength steels’, Proc. IMechE Part B: J. Eng.
Manuf., 2009, 223, 343–361.
12. W. Huang and R. Kovacevic: ‘A neural network and multiple
regression method for the characterization of the depth of weld
penetration in laser welding based on acoustic signatures’, J. Intell.
Manuf., 2011, 22, 131–143.
13. D. F. Farson and K. R. Kim: ‘Generation of optical and acoustic
emissions in laser weld plumes’, J. Appl. Phys., 1999, 85, 1329–
1336.
14. D. Farson, A. Ali, and Y. Sang: ‘Relationship of optical and
acoustic emissions to laser weld penetration’, Weld. J., 1998, 77,
142s–148s.
15. L. Li, D. J. Brookfield and W. M. Steen, ‘Plasma charge sensor for
in-process, non-contact monitoring of the laser welding process’,
Meas. Sci. Technol., 1996, 7, 615–626.
16. C.-H. Kim and D.-C. Ahn, ‘Coaxial monitoring of keyhole during
Yb:YAG laser welding’, Opt. Laser Technol., 2012, 44, 1874–1880.
17. Y. Kawahito, T. Ohnishi and S. Katayama: ‘In-process monitoring
and feedback control for stable production of full-penetration weld
in continuous wave fibre laser welding’, J. Phys. D: Appl. Phys.,
2009, 42, 085501.
18. P. J. L. Webster, B. Y. C. Leung, J. X. Z. Yu, M. D. Anderson,
T. P. Hoult and J. M. Fraser: ‘Coaxial real-time metrology and gas
assisted laser micromachining: process development, stochastic
behavior and feedback control’, Proc. SPIE, 2010, 7590, 003.
19. P. J. L. Webster, L. G. Wright, K. D. Mortimer, B. Y. Leung,
J. X. Z. Yu and J. M. Fraser: ‘Automatic real-time guidance of
laser machining with inline coherent imaging’, J. Laser Appl., 2011,
23, 022001.
20. P. J. L. Webster, L. G. Wright, Y. Ji, C. M. Galbraith, A. W.
Kinross, C. Van Vlack and J. M. Fraser: ‘Fully-automatic laser
welding and micro-sculpting with universal in situ inline coherent
imaging, arXiv:1404?4419, 2014.
21. S. Fujinaga, H. Takenaka, T. Narikiyo, S. Katayama and A.
Matsunawa: ‘Direct observation of keyhole behaviour during pulse
modulated high-power Nd:YAG laser irradiation’, J. Phys. D:
Appl. Phys., 2000, 33, 492–497.
22. O. Perret, M. Bizouard, Ph. Naudy, G. Pascal, D. Nore, Y. Horde
and Y. Delaisse: ‘Characterization of the keyhole formed during
pulsed Nd-YAG laser interaction with a Ti-6Al-4V metallic target’,
J. Appl. Phys., 2001, 90, 27–30.
Blecher et al. Real time monitoring of laser beam welding keyhole depth
Science and Technology of Welding and Joining 2014 VOL 19 NO 7 564

Appendix C:
Mitigation of Root Defect in Laser and Hybrid Laser-Arc Welding
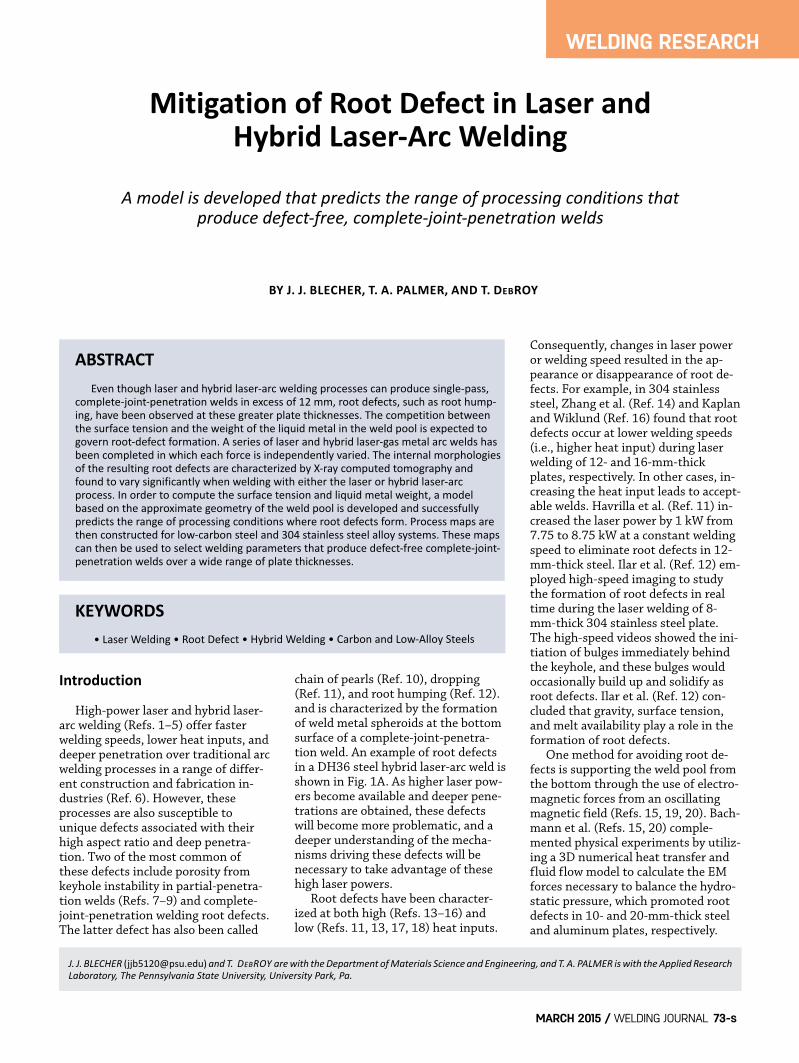
WELDING RESEARCH
MARCH 2015 / WELDING JOURNAL 73-s
Introduction
High-power laser and hybrid laser-arc welding (Refs. 1– 5) offer fasterwelding speeds, lower heat inputs, anddeeper penetration over traditional arcwelding processes in a range of differ-ent construction and fabrication in-dustries (Ref. 6). However, theseprocesses are also susceptible tounique defects associated with theirhigh aspect ratio and deep penetra-tion. Two of the most common ofthese defects include porosity fromkeyhole instability in partial-penetra-tion welds (Refs. 7–9) and complete-joint-penetration welding root defects.The latter defect has also been called
chain of pearls (Ref. 10), dropping(Ref. 11), and root humping (Ref. 12).and is characterized by the formationof weld metal spheroids at the bottomsurface of a complete-joint-penetra-tion weld. An example of root defectsin a DH36 steel hybrid laser-arc weld isshown in Fig. 1A. As higher laser pow-ers become available and deeper pene-trations are obtained, these defectswill become more problematic, and adeeper understanding of the mecha-nisms driving these defects will benecessary to take advantage of thesehigh laser powers. Root defects have been character-ized at both high (Refs. 13–16) andlow (Refs. 11, 13, 17, 18) heat inputs.
Consequently, changes in laser poweror welding speed resulted in the ap-pearance or disappearance of root de-fects. For example, in 304 stainlesssteel, Zhang et al. (Ref. 14) and Kaplanand Wiklund (Ref. 16) found that rootdefects occur at lower welding speeds(i.e., higher heat input) during laserwelding of 12- and 16-mm-thickplates, respectively. In other cases, in-creasing the heat input leads to accept-able welds. Havrilla et al. (Ref. 11) in-creased the laser power by 1 kW from7.75 to 8.75 kW at a constant weldingspeed to eliminate root defects in 12-mm-thick steel. Ilar et al. (Ref. 12) em-ployed high-speed imaging to studythe formation of root defects in realtime during the laser welding of 8-mm-thick 304 stainless steel plate.The high-speed videos showed the ini-tiation of bulges immediately behindthe keyhole, and these bulges wouldoccasionally build up and solidify asroot defects. Ilar et al. (Ref. 12) con-cluded that gravity, surface tension,and melt availability play a role in theformation of root defects. One method for avoiding root de-fects is supporting the weld pool fromthe bottom through the use of electro-magnetic forces from an oscillatingmagnetic field (Refs. 15, 19, 20). Bach-mann et al. (Refs. 15, 20) comple-mented physical experiments by utiliz-ing a 3D numerical heat transfer andfluid flow model to calculate the EMforces necessary to balance the hydro-static pressure, which promoted rootdefects in 10- and 20-mm-thick steeland aluminum plates, respectively.
Mitigation of Root Defect in Laser and Hybrid LaserArc Welding
A model is developed that predicts the range of processing conditions that produce defectfree, complete-joint-penetration welds
BY J. J. BLECHER, T. A. PALMER, AND T. DEBROY
ABSTRACT Even though laser and hybrid laserarc welding processes can produce singlepass,completejointpenetration welds in excess of 12 mm, root defects, such as root humping, have been observed at these greater plate thicknesses. The competition betweenthe surface tension and the weight of the liquid metal in the weld pool is expected togovern rootdefect formation. A series of laser and hybrid lasergas metal arc welds hasbeen completed in which each force is independently varied. The internal morphologiesof the resulting root defects are characterized by Xray computed tomography andfound to vary significantly when welding with either the laser or hybrid laserarcprocess. In order to compute the surface tension and liquid metal weight, a modelbased on the approximate geometry of the weld pool is developed and successfullypredicts the range of processing conditions where root defects form. Process maps arethen constructed for lowcarbon steel and 304 stainless steel alloy systems. These mapscan then be used to select welding parameters that produce defectfree completejointpenetration welds over a wide range of plate thicknesses.
KEYWORDS • Laser Welding • Root Defect • Hybrid Welding • Carbon and LowAlloy Steels
J. J. BLECHER ([email protected]) and T. DEBROY are with the Department of Materials Science and Engineering, and T. A. PALMER is with the Applied ResearchLaboratory, The Pennsylvania State University, University Park, Pa.
Blecher Supplement_Layout 1 2/12/15 1:09 PM Page 73

WELDING RESEARCH
WELDING JOURNAL / MARCH 2015, VOL. 9474-s
However, the predicted EM force val-ues were slightly less than the experi-mental values necessary to hold theliquid in place since only the weight ofthe liquid metal column above the bot-tom pool surface was taken into ac-count. While EM support can be usedto weld thick sections, utilizing theprocess in a production environmentmay not be practical, and the applica-tion of EM forces can change the fluidflow patterns during welding (Ref. 20).Therefore, it is necessary to develop adeeper understanding of the condi-tions that promote root defect forma-tion in order to intelligently selectwelding parameters that suppress it. In this paper, the formation of rootdefects is investigated for laser and hy-brid laser-arc welding under a variety ofwelding conditions. For the first time,the 3D internal structure of the root de-fect nuggets in a structural steel plateweld was characterized by X-ray-com-puted tomography (CT) and was foundto depend on the welding process em-ployed. The melt volume and the sur-face tension of the molten DH36 steelwere independently varied to determine
the effect of each on root defect forma-tion. Melt volume was varied by chang-ing the heat input of the welds, and sur-face tension was altered by removingthe oxide scale on the bottom surface ofthe plate prior to welding. Increasingmelt volume or decreasing surface ten-sion led to root defects being formed. Inorder to quantify each effect, a force bal-ance considering the weight of the liq-uid steel and the surface tension at theweld root is developed for an idealizedweld pool and used to determine theconditions for the formation of root de-fects. Process maps for defect-free, com-plete-joint-penetration laser welds, forwhich substantial experimental resultshave been reported, and selected hybridlaser-arc welds were developed for low-carbon steel and 304 stainless steel.
Experimental Methods
Bead-on-plate laser and hybridlaser-arc welds were performed on 4.8-and 9.8-mm-thick DH36 steel plate.An IPG Photonics® YLR-12000-L yt-terbium fiber laser with a Precitec®YW50 welding head was used for laser
A
B
C
Fig. 1 — A— The typical weld root defects formed during hybrid lasergas metal arcwelding with a laser power, welding speed, and welding wire feed rate of 5 kW, 30mm/s, and 229 mm/s, respectively; B — the roots of hybrid welds made under identicalprocess conditions (welds 7, 8) without bottom surface oxide scale; C — with bottomoxide scale. On the plate with scale, root defects formed due to the low surface tension.
Fig. 2 — A — A comparison of thetransverse hybrid weld (welds 7, 8)cross sections with identical weldingconditions with the exception of bot-tom surface oxide scale, which was notpresent; B — the bottom surface oxidescale was present. The sizes of thewelds are similar, suggesting that theweight of the liquid metal is similar andthat the reduction in surface tension isdue to the oxide scale presence, whichled to the root defects.
Table 1— Welding Conditions for LBW and HLAW Welds
Weld Number Oxide Removed Welding Process Plate Thickness (mm) Root Defects Weld Speed (mm/s) WFS (mm/s)
1 no LBW 4.8 no 30 —2 no LBW 4.8 no 40 —3 no LBW 9.5 yes 15 —4 no HLAW 4.8 yes 30 1275 no HLAW 4.8 yes 30 1526 no HLAW 4.8 yes 30 2297 yes HLAW 4.8 no 40 1278 no HLAW 4.8 yes 40 127
Note: Oxide removed refers to the bottom surface oxide scale being removed.
A
B
Blecher Supplement_Layout 1 2/12/15 11:28 AM Page 74

WELDING RESEARCH
MARCH 2015 / WELDING JOURNAL 75-s
welding. The optics system utilizes col-limating and focusing lenses with 200-and 500-mm focal lengths, respective-ly. The 1-m laser wavelength is trans-ported to the welding head through a200-m-diameter process fiber. Thefocused spot size and full divergenceangle were measured with a Primes®Focus Monitor and are 0.52 mm and64 mrad, respectively. A Lincoln Elec-tric® Power Wave 455 M/STT powersource with a Binzel® WH 455D water-cooled welding gun was used with ER
70S-6 welding wire for the hybridwelding experiments. In both the laser and hybrid laser-arc welding processes performed here,laser power, defocus, laser-arc separa-tion distance, and arc voltage werekept constant at 5 kW, 8 mm, 3 mm,and 31 V, respectively, while wire feedspeed, arc current and travel speedwere varied when welding on 4.8-mm-thick plate. A positive 8-mm defocusindicates that the position of focus isabove the plate. When welding on a9.8-mm-thick plate, 7-kW laser powerand zero defocus were selected. Addi-tionally, to test the effect of the oxidepresence on the bottom surface, twotypes of plate were used, one with onlythe top surface of the plate sand blast-ed to remove the oxide. The other
plate had the oxide removed on bothsides. A summary of the welding pa-rameters is given in Table 1. Oxide re-moved refers to whether the oxidescale was removed on both sides priorto welding. The welding processeswere laser beam welding (LBW) andhybrid laser-arc welding (HLAW).Standard metallographic techniqueswere used to inspect the transversecross-sections of the welds. X-ray CT images were captured witha General Electric® v|tome|x CT sys-tem. The accelerating voltage and cur-rent for each scan were 280 kV and 180A, respectively. The voxel (i.e., 3D pix-el) size with a magnification of 20×was50 m. DatosX® software handled thereconstruction of the individual X-rayimages to produce the 3D image. Thedefect detection module in the VolumeGraphics® VGStudio Max software wasused to highlight the internal porestructure of the weld defects.
Results and Discussion
Root Defect Formation and Characterization
Based on previous research (Refs.12, 15, 19, 20), surface tension andweld pool volume are thought to play apart in the formation of root defects.The surface tension at the bottom ofthe plate will restrain the liquid metalin the weld pool and discourage rootdefect formation. On the other hand,the weight of the molten metal in theweld pool will act to promote the for-mation of root defects. The competi-tion between these two forces will de-termine whether defects will form. In order to investigate the relation-ship between the surface tension andweld pool volume, both were inde-pendently varied during welding ex-periments. The presence of oxygen inmolten iron has a significant effect onthe surface tension. At high oxygencontents between 0.06 and 0.1 wt-%,the surface tension of liquid iron islowered by 50% or more (Ref. 21) ofits oxygen-free value, 1.91 N/m (Ref.22). Oxygen content can be controlledindirectly by the removal of the oxidescale, which is present on both sur-faces of the plate. In these experi-ments, welds with a high surface ten-sion were ensured by first removingthe oxide scale from both surfaces of
Fig. 3 — The transverse weld cross sections for: A — A laser weld (weld 1); B— a hybrid weld (weld 4) are shown.The laser conditions are the same, butthe hybrid weld has increased heatinput, larger amount of melted volume,and greater weight that must be supported by the surface tension force.
Fig. 4 — The internal structure of rootdefects in: A — Hybrid lasergas metalarc weld in 4.8mmthick plate (weld6). The direction of welding is indicatedby the arrow. The strands of porositythat stretch from the bottom of theplate and connect in the center of thedefect were common in all the hybridwelds where root defects formed; B —laser weld in 9.5mmthick plate (weld3) as determined by Xray computedtomography. Only individual pores areobserved. Evidence of gouging due tomaterial loss to root defects can be observed at the top of the plate.
A
B
B
A
Blecher Supplement_Layout 1 2/12/15 11:28 AM Page 75

WELDING RESEARCH
WELDING JOURNAL / MARCH 2015, VOL. 9476-s
the steel plate. Low surface tensionweld pools were acquired by only re-moving the oxide scale from the topsurface and not grinding the bottomsurface. Oxygen pickup is a contribu-tor but not the sole source of root de-fects. In this case, the oxide scale actsas a source of oxygen that leads to alower surface tension of the moltenmetal at the root of the weld but is nota necessary condition for root defectformation. The volume of the weldpool was varied by increasing the heatinput by transitioning from laser tohybrid laser-arc welding or by increas-ing plate thickness. Higher heat inputsand greater plate thicknesses producemore molten metal during completejoint penetration welding. In examining the effect of lowersurface tension, hybrid welds (welds 7,
8) were made under thesame conditions, with theexception of the oxidescale presence on the bot-tom surface. The weldwith scale (weld 8)formed root defects mostlikely because the re-
straining surface tension force wasmuch lower due to the increased oxy-gen content. On the other hand, theweld without scale (weld 7) formed noroot defects. A comparison of the bot-tom surfaces and transverse weld crosssections are shown in Fig. 1B, C andFig. 2, respectively. In Fig. 1, irregular-ly spaced root defects can be observedin the weld with bottom surface oxidescale. While the weld without scalecontains some reenforcement on thebottom surface, there are no observ-able defects. As can be observed in Fig.2, root defects have a profound effecton the weld cross section. The weldwithout scale has a clearly identifiablearc zone at the top, which is muchwider than the rest of the weld. In theweld with scale, the weld width is
much narrower, and the complexshape of the porosity in the root de-fect nugget is observable. Eleven hy-brid welds were made with and eighthybrid welds made without bottomsurface oxide scale. In all cases, thewelds without bottom surface scaledid not form root defects, while thosewith scale did form defects. The effect of heat input and liquidmetal volume on the root defect for-mation was investigated next for a se-ries of welds made at a travel speed of30 mm/s. As shown in Table 1, thelaser weld (weld 1) has a heat input of167 J/mm, while the hybrid welds(welds 4–6) had estimated heat inputsbetween 426 and 695 J/mm. Thehigher heat inputs should increase thesize of the weld pool, which will in-crease the overall weight that must bebalanced against the surface tensionforce at the bottom of the pool. At thelowest heat input, there were no rootdefects, but defects formed at the highheat inputs. The effect of heat inputon the size of the weld and amount ofmaterial melted can be observed in
Fig. 6 — Process maps for: A — Low-carbon steels; B — 304 stainless steel— were constructed from available reports of laser welding and cuttingexperiments. The maps indicate with what processing conditions accept-able complete penetration welds can be made with respect to other inter-action modes.
Fig. 5 — The comparison of surface tension force andweight force for the experimental welds considered. Thenumbers next to each weld indicate the processing con-ditions as shown in Table 1. Compared to experimentalresults, all the welds are found to be on the correct sideof the Fg = Fs line.
Table 2 — Average and Standard Deviations of Three Measurements for the Top Surface and Bottom Surface Weld Width and Weld Length and the Estimated Arc Force
Weld Number D (mm) d (mm) l (mm) Arc Force (mN)
1 2.2 ± 0.1 1.6 ±0.2 3.7 ± 0.8 0.02 1.9 ± 0.2 1.5 ± 0.1 3.4 ± 0.7 0.03 4.2 ± 0.2 2.5 ± 0.1 6.9 ± 0.6 0.04 4.9 ± 0.2 2.5 ± 0.1 13.8 ± 0.7 9.05 6.4 ± 0.9 2.6 ± 0.3 17.0 ± 2.3 39.46 7.8 ± 0.4 3.3 ± 0.4 28.6 ± 1.8 74.37 6.1 ± 0.3 2.2 ± 0.3 15.8 ± 2.2 14.08 3.9 ± 0.5 2.0 ± 0.2 8.4 ± 2.2 14.0
A B
Blecher Supplement_Layout 1 2/13/15 2:06 PM Page 76
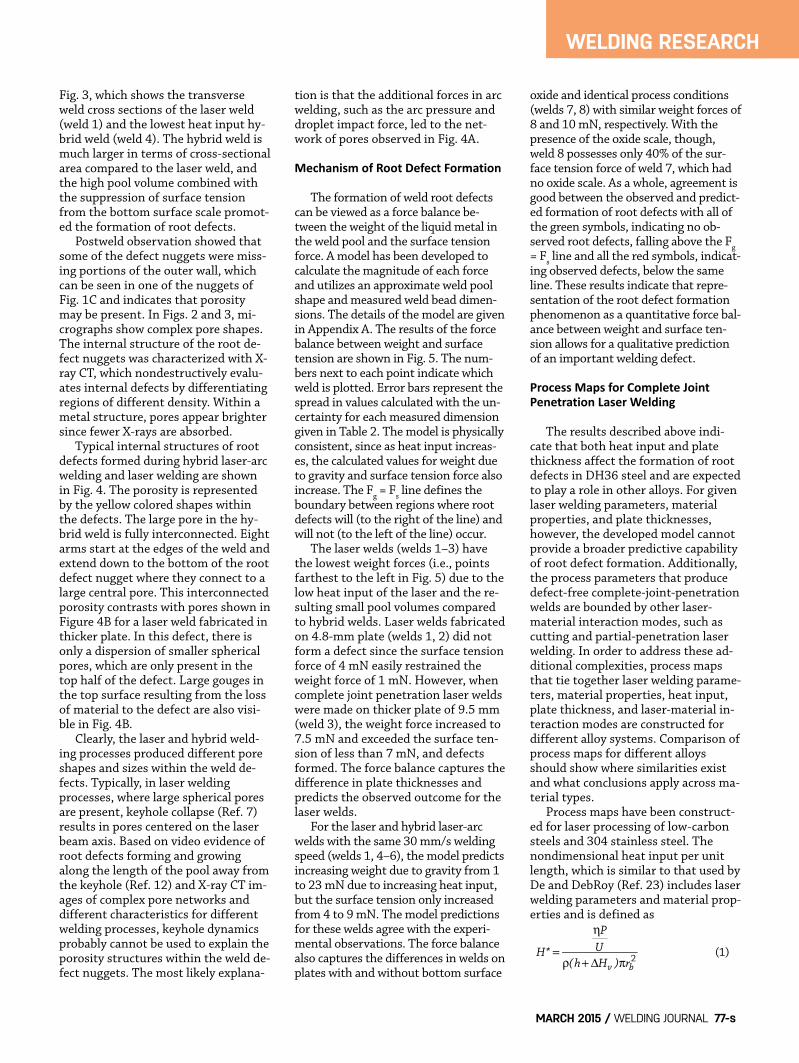
WELDING RESEARCH
MARCH 2015 / WELDING JOURNAL 77-s
Fig. 3, which shows the transverseweld cross sections of the laser weld(weld 1) and the lowest heat input hy-brid weld (weld 4). The hybrid weld ismuch larger in terms of cross-sectionalarea compared to the laser weld, andthe high pool volume combined withthe suppression of surface tensionfrom the bottom surface scale promot-ed the formation of root defects. Postweld observation showed thatsome of the defect nuggets were miss-ing portions of the outer wall, whichcan be seen in one of the nuggets ofFig. 1C and indicates that porositymay be present. In Figs. 2 and 3, mi-crographs show complex pore shapes.The internal structure of the root de-fect nuggets was characterized with X-ray CT, which nondestructively evalu-ates internal defects by differentiatingregions of different density. Within ametal structure, pores appear brightersince fewer X-rays are absorbed. Typical internal structures of rootdefects formed during hybrid laser-arcwelding and laser welding are shownin Fig. 4. The porosity is representedby the yellow colored shapes withinthe defects. The large pore in the hy-brid weld is fully interconnected. Eightarms start at the edges of the weld andextend down to the bottom of the rootdefect nugget where they connect to alarge central pore. This interconnectedporosity contrasts with pores shown inFigure 4B for a laser weld fabricated inthicker plate. In this defect, there isonly a dispersion of smaller sphericalpores, which are only present in thetop half of the defect. Large gouges inthe top surface resulting from the lossof material to the defect are also visi-ble in Fig. 4B. Clearly, the laser and hybrid weld-ing processes produced different poreshapes and sizes within the weld de-fects. Typically, in laser weldingprocesses, where large spherical poresare present, keyhole collapse (Ref. 7)results in pores centered on the laserbeam axis. Based on video evidence ofroot defects forming and growingalong the length of the pool away fromthe keyhole (Ref. 12) and X-ray CT im-ages of complex pore networks anddifferent characteristics for differentwelding processes, keyhole dynamicsprobably cannot be used to explain theporosity structures within the weld de-fect nuggets. The most likely explana-
tion is that the additional forces in arcwelding, such as the arc pressure anddroplet impact force, led to the net-work of pores observed in Fig. 4A.
Mechanism of Root Defect Formation
The formation of weld root defectscan be viewed as a force balance be-tween the weight of the liquid metal inthe weld pool and the surface tensionforce. A model has been developed tocalculate the magnitude of each forceand utilizes an approximate weld poolshape and measured weld bead dimen-sions. The details of the model are givenin Appendix A. The results of the forcebalance between weight and surfacetension are shown in Fig. 5. The num-bers next to each point indicate whichweld is plotted. Error bars represent thespread in values calculated with the un-certainty for each measured dimensiongiven in Table 2. The model is physicallyconsistent, since as heat input increas-es, the calculated values for weight dueto gravity and surface tension force alsoincrease. The Fg = Fs line defines theboundary between regions where rootdefects will (to the right of the line) andwill not (to the left of the line) occur. The laser welds (welds 1–3) havethe lowest weight forces (i.e., pointsfarthest to the left in Fig. 5) due to thelow heat input of the laser and the re-sulting small pool volumes comparedto hybrid welds. Laser welds fabricatedon 4.8-mm plate (welds 1, 2) did notform a defect since the surface tensionforce of 4 mN easily restrained theweight force of 1 mN. However, whencomplete joint penetration laser weldswere made on thicker plate of 9.5 mm(weld 3), the weight force increased to7.5 mN and exceeded the surface ten-sion of less than 7 mN, and defectsformed. The force balance captures thedifference in plate thicknesses andpredicts the observed outcome for thelaser welds. For the laser and hybrid laser-arcwelds with the same 30 mm/s weldingspeed (welds 1, 4–6), the model predictsincreasing weight due to gravity from 1to 23 mN due to increasing heat input,but the surface tension only increasedfrom 4 to 9 mN. The model predictionsfor these welds agree with the experi-mental observations. The force balancealso captures the differences in welds onplates with and without bottom surface
oxide and identical process conditions(welds 7, 8) with similar weight forces of8 and 10 mN, respectively. With thepresence of the oxide scale, though,weld 8 possesses only 40% of the sur-face tension force of weld 7, which hadno oxide scale. As a whole, agreement isgood between the observed and predict-ed formation of root defects with all ofthe green symbols, indicating no ob-served root defects, falling above the Fg= Fs line and all the red symbols, indicat-ing observed defects, below the sameline. These results indicate that repre-sentation of the root defect formationphenomenon as a quantitative force bal-ance between weight and surface ten-sion allows for a qualitative predictionof an important welding defect.
Process Maps for Complete Joint Penetration Laser Welding
The results described above indi-cate that both heat input and platethickness affect the formation of rootdefects in DH36 steel and are expectedto play a role in other alloys. For givenlaser welding parameters, materialproperties, and plate thicknesses,however, the developed model cannotprovide a broader predictive capabilityof root defect formation. Additionally,the process parameters that producedefect-free complete-joint-penetrationwelds are bounded by other laser-material interaction modes, such ascutting and partial-penetration laserwelding. In order to address these ad-ditional complexities, process mapsthat tie together laser welding parame-ters, material properties, heat input,plate thickness, and laser-material in-teraction modes are constructed fordifferent alloy systems. Comparison ofprocess maps for different alloysshould show where similarities existand what conclusions apply across ma-terial types. Process maps have been construct-ed for laser processing of low-carbonsteels and 304 stainless steel. Thenondimensional heat input per unitlength, which is similar to that used byDe and DebRoy (Ref. 23) includes laserwelding parameters and material prop-erties and is defined as
(1)2=
η
ρ + Δ πH*
PU
(h H ) rv b
Blecher Supplement_Layout 1 2/12/15 11:28 AM Page 77

WELDING RESEARCH
WELDING JOURNAL / MARCH 2015, VOL. 9478-s
where is absorptivity, P is laser pow-er, rb is the laser beam radius at focus,U is the welding speed, is the liquidmetal density, h is the enthalpy of theliquid at the boiling point, and Hv isthe heat of vaporization. Both the nu-merator and denominator have unitsof energy per unit length, J/m. Equa-tion 1 compares the amount of energyabsorbed from the laser per unitlength in the numerator to theamount of energy per unit length nec-essary to heat the alloy from roomtemperature to the boiling point (de-nominator). For the experiments con-sidered here, H* is typically greaterthan one, indicating that absorbedlaser energy is a multiple of the energyto heat the alloy to the boiling point.The material property values that wereused to calculate H* for each alloy aregiven in Table 3. Estimated resistivi-ties (Ref. 24) were used to calculate ab-sorptivity (Ref. 25), and density, en-thalpy, and heat of vaporization wereobtained from available references(Refs. 24, 26). When H* is plotted as a function ofplate thickness, four regions definingcutting, complete-joint-penetrationweld without defects, complete-joint-penetration weld with defects, andpartial-penetration weld, can be iden-tified. In the case of cutting low-car-bon steel or stainless steel in the pres-ence of oxygen gas, laser energy ac-counts for approximately half of thetotal energy input into the systemwith oxidation of liquid iron account-ing for the other half (Refs. 27, 28).Other processes, such as hybrid laser-arc welding, are not considered inthese maps, but as shown previously,the addition of another heat sourcecan increase the chances of root defectformation. The process maps for the laserwelding of low-carbon steel (Refs. 18,27, 29–53) and 304 stainless steel(Refs. 14–16, 39, 40, 54–70) areshown in Fig. 6. Experimental H* datafor cutting, complete-joint-penetra-
tion welds without root defects, andpartial penetration welds are deter-mined by macrographs of the welds orexplicit statements in the text andplotted for every material type. Rootdefects reported in the literature areassumed to form because of the com-petition between the surface tensionand liquid metal weight forces and notother phenomena, such as keyhole in-stability, which leads to macroporosity.The lines defining each region are fitto the complete-joint-penetrationlaser welding data. All the conditionsshown are for a laser only, except asindicated in Fig. 6A, where a set of hy-brid laser-GMAW conditions (Ref. 18)is used to show another case of rootdefects in low-carbon steel. The points indicating root defectformation for low-carbon steel in 12-mm-thick plate (Ref. 31) are situatedclose to the cutting-complete jointpenetration transition line. On theother hand, because of the availabilityof data, a line indicating the transitionfrom defect-free welds to welds withroot defects can be drawn for 304stainless steel and fully encloses thecomplete-joint-penetration laser weld-ing space for the alloy. According tothe process map, the laser welding pa-rameters for complete-joint-penetra-tion welds in excess of 16 mm are verylimited, so only careful selection ofprocessing parameters can produce adefect-free weld. For the same space inlow-carbon steel, relatively thickplates of 25 mm can be welded atnondimensional heat inputs of lessthan 40. Comparison of the process mapsshows relatively similar behaviors atlower heat inputs and plate thickness-es. This similarity across process mapsis highlighted by the thick solid blackline, which encloses an identicalprocess space in the defect-free zone,and can be used to produce defect-freecomplete-joint-penetration welds foreach alloy. For example, process pa-rameters yielding an H* of 12 will pro-
duce a defect-free weld in 8-mm-thickplate of low-carbon steel and 304stainless steel. Identical H* values forplate thicknesses between 3.5 and 10mm can be used across alloy systems.The parameters shown in Fig. 6 canspeed process parameter development,especially in thick plates, wheregreater heat inputs lead to longer cool-ing times between trial welds. For ex-ample, if laser optics are fixed (i.e.,minimum laser beam radius cannotchange), then welding engineers canquickly select nondimensional heat in-put from Fig. 6 for a given plate thick-ness and calculate via Eq. 1 the laserpowers and welding speeds that willproduce defect-free, complete-joint-penetration welds. At higher heat inputs and platethicknesses, the behaviors of each al-loy diverge. A very small defect-freecomplete-joint-penetration processspace is observed in 304 stainlesssteel. The opposite is observed in low-carbon steels. The process maps indi-cate that two conditions are necessarybefore root defects can form duringlaser welding. First, the plate thicknessmust be 10 mm or greater. Second, thenondimensional heat input must begreater than 16, which is also a mini-mum value associated with root de-fects. Once these two conditions aremet, the formation of root defects be-comes possible. However, as shown inthe process maps, satisfying the condi-tions does not guarantee root defectformation. For example, the mean av-erage H* value for root defect forma-tion in low-carbon steel and 304 stain-less steel laser welds is 33, so thechances of forming root defects in-creases as the heat input increases. From the process maps, 304 stain-less steel is more susceptible to root de-fect formation than low-carbon steel.The reason is the difference in surfacetension, which is 1.91 N/m (Ref. 22)and 1.17 N/m (Ref. 79) for steel andstainless steel, respectively. The densityof each liquid alloy is 7030 kg/m3 for
Table 3 — Values Used to Construct the Process Maps
Alloy – 1m - 10.6 m (kg/m3) h (kJ/kg) Hv (kJ/kg)
Steel 0.34 0.12 7030 2390 6260304SS 0.34 0.12 7070 2290 6330
Note: Absorptivity, , depends on the wavelength of the laser beam.
Blecher Supplement_Layout 1 2/12/15 11:28 AM Page 78

WELDING RESEARCH
MARCH 2015 / WELDING JOURNAL 79-s
steel and 7070 kg/m3 for 304 stainlesssteel (Ref. 24). Both surface tension anddensity should affect the formation ofroot defects as shown in Eq. A5 and A7,and only surface tension is very differ-ent between the two alloys. Close inspection of Fig. 6A, B indi-cates that root defects are associatedwith relatively higher heat inputs. Forlow-carbon steel, the root defects inboth laser and hybrid welding condi-tions are close to the cutting transi-tion line, indicating high heat input. Inthe case of 304 stainless steel, all theheat inputs associated with root de-fects are greater than the defect-freeheat inputs for the same plate thick-nesses, 10, 12, and 16 mm. Some researchers have concludedthat the root defects are associatedwith low heat input (Refs. 11, 18, 31).However, the data compiled in Fig. 6A,B suggest that the opposite is true. Incases where lower heat inputs certain-ly led to root defect formation, it ap-pears that the researchers were alreadyoperating at a high heat input. For ex-ample, for 12-mm-thick low-carbonsteel plate (Ref. 31) and nondimen-sional heat inputs between 35 and 40,defects formed, but at lower heat in-puts of 29 and 33 and higher heat in-puts of 45 and 50 root defects did notform. Additionally, all of these heat in-puts are relatively high because com-plete-joint-penetration defect-freewelds were made at nondimensionalheat inputs as low as 5 and 7 (Ref. 31).By considering the whole range ofprocess parameters captured in thenondimensional heat input parameter,the fact that root defects are a highheat input phenomenon becomes clearand unambiguous.
Summary and Conclusions
The root defect in complete-joint-penetration laser and hybrid laser-arcwelding has been experimentally andtheoretically investigated. Welding pa-rameters, plate preparation, and platesize were varied to produce welds withand without root defects. Optical mi-croscopy and X-ray CT characterizedthe internal structure of the defectnuggets for different welding process-es. A force balance between the weightof the liquid metal and the surface ten-sion was developed to describe thecompeting forces driving the onset of
defect formation. Process maps fortwo alloy systems have been con-structed based on the experimentalwelding and cutting parameters re-ported in the literature. The conclu-sions of this work are listed below. 1) The qualitative effect of surfacetension and weight of liquid metal onthe formation of root defects was deter-mined by varying the welding parame-ters. A decrease in surface tension dueto the presence of oxide scale on thebottom plate surface led to the defectformation while no defects formed forthe same conditions on a plate with theoxide scale removed. Larger weld poolswere formed either by increasing heatinput with the addition of an arc orlaser welding on 9.5-mm-thick plate.The larger pools led to root defects,while the laser welds on 4.8-mm-thickplate formed smaller pools and did notresult in root defects. 2) With the use of X-ray CT, the in-ternal structure of defect nuggetsformed during hybrid laser-arc and laserwelding were found to be different. Inhybrid welding, the structure consistedof a network of large pore strands thatstretched from the edge of the bottomweld bead to the center of the defectnugget. On the other hand, defectnuggets resulting from a laser weldshowed a dispersion of small sphericalpores. The additional arc pressure anddroplet impact forces in hybrid weldingare the likely factors for the differencein porosity structure. 3) Based on the observations ofsurface tension and weight of liquidmetal, a force balance between the twowas developed for an idealized weldpool and applied to the experimentalconditions used in the study. The forcebalance calculations matched the ex-perimental observations in terms ofroot defect formation for all of the cas-es considered. The results showed thatthe force balance has utility for pre-dicting the defect formation, assumingthe pool geometry is known or can becalculated. 4) The process maps for low-carbonsteel and 304 stainless steel revealedthat identical H* values between 5 and15 can be used to fabricate defect-freewelds in plate thicknesses between 3.5and 10 mm for the two alloys consid-ered. 5) The compiled data show that twoconditions, plate thicknesses greater
than 10 mm and H* values greaterthan 15, must be met before root de-fects can form. Consideration of theheat inputs necessary to form root de-fects in low-carbon steel and stainlesssteel demonstrated that root defectsare a high heat input phenomenon, soin most cases, reducing heat input willeliminate defect formation.
The authors would like to thankMr. Jay Tressler for performing thewelding experiments and Mr. Ed Goodfor preparing the metallographic andX-ray specimens. This research wasperformed using funding receivedfrom the DOE Office of Nuclear Ener-gy’s Nuclear Energy University Pro-grams under Grant Number 120327.
1. Zhang, J., Shan, J. G., Ren, J. L, andWen, P. 2013. Reducing the porosity in die-cast magnesium alloys during laser weld-ing. Welding Journal 92(4): 101-s to 109-s. 2. Roepke, C., Liu, S., Kelly, S., and Mar-tukanitz, R. 2010. Hybrid laser arc weldingprocess evaluation on DH36 and EH36steel. Welding Journal 89(7): 140-s to 150-s. 3. Sachez-Amaya, J. M., Boukha, Z.,Amaya-Vazquez, M. R., and Botana, F. J.2012. Weldability of aluminum alloys withhigh-power diode laser. Welding Journal91(5): 155-s to 161-s. 4. Victor, B., Farson, D. F., Ream, S., andWalters, C. T. 2011. Custom beam shapingfor high-power fiber laser welding. WeldingJournal 90(6): 113-s to 120-s. 5. Wu, S. C., Yu, X., Zuo, R. Z., Zhang,W. H., Xie, H. L., and Jiang, J. Z. 2013.Porosity, element loss, and strength modelon softening behavior of hybrid laser arcwelded Al-Zn-Mg-Cu alloy with synchro-tron radiation analysis. Welding Journal92(3): 64-s to 71-s. 6. Ribic, B., Palmer, T. A., and DebRoy,T. 2009. Problems and issues in laser-archybrid welding. Int. Mater. Rev. 54(4):223–244. 7. Matsunawa, A., Kim, J.-D., Seto, N.,Mizutani, M., and Katayama, S. 1998. Dy-namics of keyhole and molten pool in laserwelding. J. Laser Appl. 10(6): 247–254. 8. Tucker, J. D., Nolan, T. K., Martin, A.J., and Young, G. A. 2012. Effect of travelspeed and beam focus on porosity in alloy690 laser welds. JOM 64(12): 1409–1417.
Acknowledgments
References
Blecher Supplement_Layout 1 2/12/15 11:28 AM Page 79
WELDING RESEARCH
WELDING JOURNAL / MARCH 2015, VOL. 9480-s
9. Madison, J. D., and Aagesen, L. K.2012. Quantitative characterization ofporosity in laser welds of stainless steel.Scripta Mater. 67(9): 783–786. 10. Salminen, A., Piili, H., and Purto-nen, T. 2010. The characteristics of highpower fibre laser welding. Proc. IMechE,Part C J. Mech. Eng. Sci. 224(C5):1019–1029. 11. Havrilla, D., Rominger, V., Holzer,M., Harrer, T., and Andreev, A. 2013. Ad-vanced welding techniques with optimizedaccessories for high brightness 1 mlasers. Proc. SPIE 8603, High-Power LaserMater. Process.: Lasers, Beam Deliv., Diagn.,and Appl. II. Ed. F. Dorsch, 86030N. SPIE. 12. Ilar, T., Eriksson, I., Powell, J., andKaplan, A. 2012. Root humping in laserwelding — an investigation based on highspeed imaging. 7th Conf. Laser Assist. NetShape Eng./Int. Conf. Photonic Eng. Eds. M.Schmidt, F. Vollertsen, and M. Geiger, pp.27–32. Elsevier Sci. 13. Punkari, A., Weckman, D. C., andKerr, H. W. 2003. Effects of magnesiumcontent on dual beam Nd:YAG laser weld-ing of Al-Mg alloys. Sci. Technol. Weld. Join-ing 8(4): 269–281. 14. Zhang, M., Chen, G., Zhou, Y., andLiao, S. 2014. Optimization of deep pene-tration laser welding of thick stainless steelwith a 10 kW fiber laser. Mater. Des. 53:568–576. 15. Bachmann, M., Avilov, V., Gu-menyuk, A., and Rethmeier, M. 2014. Ex-perimental and numerical investigation ofan electromagnetic weld pool support sys-tem for high power laser beam welding ofaustenitic stainless steel. J. Mater. Process.Technol. 214(3): 578–591. 16. Kaplan, A. F. H., and Wiklund, G.2011. Advanced welding analysis methodsapplied to heavy section welding with a 15kW fibre laser. Weld. World 53: 295–300. 17. Ohnishi, T., Kawahito, Y., Mizutani,M., and Katayama, S. 2013. Butt weldingof thick, high strength steel plate with ahigh power laser and hot wire to improvetolerance to gap variance and control weldmetal oxygen content. Sci. Technol. Weld.Joining 18(4): 314–322. 18. Piili, H., Salminen, A., Harkko, P.,and Lehtinen, J. 2008. Study of phenome-non of fibre-laser-mig/mag-hybrid-weld-ing. ICALEO 2008 – 27th Int. Congr. Appl.Lasers Electro-Opt. pp. 506–515. LaserInst. of America. 19. Avilov, V. V., Gumenyuk, A., Lam-mers, M., and Rethmeier, M. 2012. PA po-sition full penetration high power laserbeam welding of up to 30-mm-thick AlMg3plates using electromagnetic weld poolsupport. Sci. Technol. Weld. Joining 17(2):128–133. 20. Bachmann, M., Avilov, V., Gu-menyuk, A., and Rethmeier, M. 2012. Nu-merical simulation of full penetration laser
beam welding of thick aluminium plateswith inductive support. J. Phys. D: Appl.Phys. 45(3): 035201. 21. Keene, B. J. 1988. Review of datafor the surface tension of iron and its bina-ry alloys. Int. Mater. Rev. 33(1): 1–37. 22. Keene, B. J. 1993. Review of datafor the surface tension of pure metals. Int.Mater. Rev. 38(4): 157–192. 23. De, A., and DebRoy, T. 2004. Asmart model to estimate effective thermalconductivity and viscosity in the weld pool.J. Appl. Phys. 95(9): 5230–5240. 24. Gale, W. F. 2004. Smithells MetalsReference Book, 8th Edition. Burlington,Mass., Elsevier Butterworth-Heinemann. 25. Dowden, J., and Phiroze, K. 1995. Amathematical investigation of the penetra-tion depth in the keyhole welding withcontinuous CO2 lasers. J. Phys. D: Appl.Phys. 28(11): 2252–2261. 26. Pakratz, L. B. 1982. Thermodynam-ic properties of elements and oxides. U.S.Dept. of the Interior, Bureau of Mines, Dis-trict of Columbia. 27. Hsu M. J., and Molian, P. A. 1994.Thermochemical modeling in CO2 lasercutting of carbon steel. J. Mater. Sci.29(21): 5607–5611. 28. Ivarson, A., Powell, J., and Magnus-son, C. 1991. The role of oxidation in lasercutting stainless and mild steel. J. LaserAppl. 3(3): 41–45. 29. Krasnoperov, M. Y., Pieters, R. R. G.M., and Richardson, I. M. 2004. Weld poolgeometry during keyhole laser welding ofthin steel sheets. Sci. Technol. Weld. Joining9(6): 501–506. 30. Sokolov, M., Salminen, A.,Kuznetsov, M., and Tsibulskiy, I. 2011.Laser welding and weld hardness analysisof thick section S355 structural steel.Mater. Des. 32(10): 5127 –5131. 31. Rominger, V., Haug, P., Speker, N.,and Holzer, M. 2013. High-power full pen-etration welding behavior. Laser Tech. J.10(3): 36–40. 32. Assuncao, E., Ganguly, S., Yapp, D.,Williams, S., and Paradowska, A. 2011.Characterization of residual stress state inlaser welded low carbon mild steel platesproduced in keyhole and conduction mode.Sci. Technol. Weld. Joining 16(3): 239–243. 33. Cui, C., Hu, J., Gao, K., Pang, S.,Yang, Y., Wang, H., and Guo, Z. 2008. Ef-fects of process parameters on weld metalkeyhole characteristics with CO2 laser buttwelding. Lasers Eng. 18(5-6): 319 –327. 34. Hamatani, H., Miyazaki, Y., Otani,T., and Ohkita, S. 2006. Minimization ofheat-affected zone size in welded ultra-fined grained steel under cooling by liquidnitrogen during laser welding. Mater. Sci.Eng. A 426(1–2): 21–30. 35. Ion, J. C., Salminen, A. S., and Sun,Z. 1996. Process diagrams for laser beamwelding of carbon manganese steels. Weld-
ing Journal 75(7): 225-s to 232-s. 36. Oefele, F., Musiol, J., Zaeh, M. F.2008. Influence of remote-laser-weldingparameters for an 8 kW fibre laser on theseam quality of steels. ICALEO 2008 – 27thInt. Congr. Appl. Lasers Electro-Opt. pp.399–405. Laser Inst. of America. 37. Mori, K., and Miyamoto, I. 1997.In-process monitoring of laser welding bythe analysis of ripples in the plasma emis-sion. J. Laser Appl. 9(3): 155–159. 38. Vollertsen, F., Grunenwald, S., Reth-meier, M., Gumenyuk, A., Reisgen, U.,Olschok, S. 2010. Welding thick steelplates with fibre lasers and GMAW. Weld.World 54(3–4): R62–R70. 39. Brown, R. T. 2008. Keyhole weldingstudies with a moderate-power, high-brightness fiber laser. J. Laser Appl. 20(4):201–208. 40. Nakamura, S., Sakurai, M.,Kamimuki, K., Inoue, T., and Ito, Y. 2000.Detection technique for transition be-tween deep penetration mode and shallowpenetration mode and shallow penetrationmode in CO2 laser welding of metals. J.Phys. D: Appl. Phys. 33(22): 2941–2948. 41. Kumar, N., Kataria, S., Shanmu-garajan, B., Dash, S., Tyagi, A. K., Pad-mananbham, G., and Raj, B. 2010. Contactmechanical studies on continuous waveCO2 laser beam weld of mild steel with am-bient and under water medium. Mater. Des.31(8): 3610–3617. 42. Miranda, R., Quintino, L., Willams,S., and Yapp, D. 2010. Welding with highpower fiber laser API5L-X100 pipelinesteel. 5th Int. Mater. Symp./14th Conf. Soc.-Port.-Mater. Eds. L. G. Rosa and F. Margari-do, pp. 592–596. Trans Tech Publ. 43. Quintino, L., Costa, A., Miranda, R.,Yapp, D., Kumar, V., and Kong, C. J. 2007.Welding with high power fiber lasers — apreliminary study. Mater. Des. 28(4):1231–1237. 44. Suder, W. J., and Williams, S. 2014.Power factor model for selection of weldingparameters in CW laser welding. Opt.Laser. Technol. 56: 223–229. 45. Chen, S.-L. 1998. The effect of gascomposition on the CO2 laser cutting ofmild steel. J. Mater. Process. Technol.73(1–3): 147–159. 46. Lo, K. H. 2012. A comparative studyon Nd:YAG laser cutting of steel and stain-less steel using continuous, square, andsine waveforms. J. Mater. Eng. Perform.21(6): 907–914. 47. Malikov, A. G., Orishich, A. M., andShulyat’ev, V. B. 2009. Experimental opti-mization of the gas-assisted laser cuttingof thick steel sheets. Quantum Electron.39(6): 547–551. 48. O’Neill, W., and Steen, W. M. 1995.A three-dimensional analysis of gas en-trainment operating during the laser-cut-ting process. J. Phys. D: Appl. Phys. 28(12):
Blecher Supplement_Layout 1 2/12/15 11:28 AM Page 80

WELDING RESEARCH
MARCH 2015 / WELDING JOURNAL 81-s
12–18. 49. Powell, J., Al-Mashikhi, S. O., Ka-plan, A. F. H., and Voisey, K. T. 2011. Fibrelaser cutting of thin section mild steel: anexplanation of the ‘striation free effect.Opt. Lasers Eng. 49(8): 1069–1075. 50. Shariff, S. M., Sundararajan, G., andJoshi, S. V. 1999. Parametric influence oncut quality attributes and generation ofprocessing maps for laser cutting. J. LaserAppl. 11(2): 54–63. 51. Sobih, M., Crouse, P. L., and Li, L.2007. Elimination of striation in laser cut-ting of mild steel. J. Phys. D: Appl. Phys.40(22): 6908–6916. 52. Wandera, C., Kujanpaa, V., and Salmi-nen, A. 2010. Laser power requirement forcutting thick-section steel and effects of pro-cessing parameters on mild steel cut quality.Proc. IMechE Part B: J. Eng. Manuf. 225(B5):651–661. 53. Zaied, M., Miraoui, I., Boujelbene, M.,and Bayraktar, E. 2013. Analysis of heat af-fected zone obtained by CO2 laser cuttingof low carbon steel (S235). 3rd Int. Congr.Adv. Appl. Phys. Mater. Sci. Eds. A. Y. Oral,Z. B. Bahsi, and A. Sonmez, pp. 323–326.Amer. Inst. Phys. 54. Nath, A. K., Sridhar, R., Ganesh, P.,and Kaul, R. 2002. Laser power couplingefficiency in conduction and keyhole weld-ing of austenitic stainless steel. Sadhana27: 383–292. 55. Bhargava, P., Paul, C. P., Mundra, G.,Premsingh, C. H., Mishra, S. K., Nagpure,D., Kumar, A., and Kukreja, L. M. 2014.Study on weld bead surface profile and an-gular distortion in 6-mm-thick butt weldjoints on SS304 using fiber laser. Opt.Laser Eng. 53: 152–157. 56. Nakabayashi, T., Wani, F.,Hayakawa, A., Suzuki, S., and Yasuda, K.2003. Thick plate welding with Nd:YAGlaser and COIL. 1st Int. Symp. High-PowerLaser Macroprocess. Eds. I. Miyamoto, K. F.Kobayashi, K. Sugioka, R. Poprawe, H. Hel-vajian, pp. 416–421. SPIE. 57. Panstar, H., Salminen, A., Jansson,A., and Kujanpaa, V. 2004. Quality andcosts analysis of laser welded all steel sand-wich panels. J. Laser Appl. 16(2): 66–72. 58. Kawahito, Y., Mizutani, M., andKatayama, S. 2007. Elucidation of high-power fibre laser welding phenomena ofstainless steel and effect of factors on weldgeometry. J. Phys. D: Appl. Phys. 40(19):5854–5859. 59. Ghany, K. A., and Newishy, M.2005. Cutting of 1.2-mm-thick austeniticstainless steel sheet using pulsed and CWNd:YAG laser. J. Mater. Process. Technol.168(3): 438–447. 60. Hsu, M. J., and Molian, P. A. 1995.Off-axial, gas-jet-assisted, laser cutting of6.35-mm-thick stainless steel. Trans. ASME117(2): 272–276. 61. Ilavarasan, P. M., and Molian, P. A.
1995. Laser cutting of thick sectionedsteels using gas flow impingement on theerosion front. J. Laser Appl. 7(4): 199–209. 62. Purtonen, T., and Salminen, A.2014. A study on the effect of cutting posi-tion on performance of fiber laser cuttingof stainless steel tubes. Weld. World 58(2):193–204. 63. Sheng, P. S., and Joshi, V. S. 1995.Analysis of heat-affected zone formationfor laser cutting of stainless steel. J. Mater.Process. Technol. 53(3–4): 879–892. 64. Sparkes, M., Gross, M., Celotto, S.,Zhang, T., and O’Neill, W. 2008. Practicaland theoretical investigations into inertgas cutting of 304 stainless steel using ahigh brightness fiber laser. J. Laser Appl.20(1): 59–67. 65. Stelzer, S., Mahrle, A., Wetzig, A.,and Beyer, E. 2013. Experimental investi-gations on fusion cutting stainless steelwith fiber and CO2 laser beams. 7th Int.WLT Conf. Lasers Manuf. Eds. C. Emmel-mann, M. F. Zaeh, T. Graf, and M. Schmidt,pp. 392–397. Elsevier Sci. BV. 66. Wandera, C., Salminen, A., and Ku-janpaa, V. 2009. Inert gas cutting of thick-section stainless steel and medium-sectionaluminum using a high power fiber laser. J.Laser Appl. 21(3): 154–161. 67. Kuo, T. Y., and Jeng, S. L. 2005.Porosity reduction in Nd-YAG laser weld-ing of stainless steel and inconel alloy byusing a pulsed wave. J. Phys. D: Appl. Phys.38(5): 722–728. 68. Rizzi, D., Sibillano, T., Calabrese, P.P., Ancona, A., and Lugara, P. M. 2011.Spectroscopic, energetic, and metallo-graphic investigations of the laser lapwelding of AISI 304 using the responsesurface methodology. Opt. Lasers Eng.49(7): 892–898. 69. Hartwig, L., Ebert, R., Kloetzer, S.,Weinhold, S., Dreschel, J., Peuckert, F.,Schille, J., and Exner, H. 2010. Materialprocessing with a 3 kW single mode fibrelaser. J. Laser Micro/Nanoeng. 5(2):128–133. 70. Kawahito, Y., Mizutani, M., Kataya-ma, S. 2009. High quality welding of stain-less steel with 10 kW high power fibrelaser. Sci. Technol. Weld. Joining 14(4):288–294. 71. Mills, K. C. 2002. Recommended Val-ues of Thermophysical Properties for SelectedCommercial Alloys. Cambridge, Woodhead. 72. Blecher, J. J., Palmer, T. A., and De-bRoy, T. 2014. Solidification map of a nick-el base alloy. Metall. Mater. Trans. A 45A(4):2142–2151. 73. Brohnstein, I. N. 2007. Handbook ofMathematics, 5th Edition. New York, N.Y.,Springer. 74. Halliday, D., Resnick, R., and Walk-er, J. 2005. Fundamentals of Physics, 7th Ed.Hoboken, N.J., John Wiley & Sons, Inc. 75. Lin, L., and Eagar, T. W. 1986. Pres-
sures produced by gas tungsten arcs. Met-all. Trans. B. 17B(3): 601–607. 76. Rai, R., and DebRoy, I. 2008. Nu-merical simulation of heat transfer andfluid flow in GTA/ laser hybrid welding.Sci. Technol. weld. Joining 13(8): 683–693. 77. Zhang, W., Kim, C.-H., and DebRoy,T. 2004. Heat and fluid flow in complexjoints during gas metal arc welding — PartII: Application to fillet welding of mildsteel. J. Appl. Phys. 95(9): 5220–5229. 78. Basu, S., and DebRoy, T. 1992. Liq-uid metal expulsion during laser irradia-tion. J. Appl. Phys. 72(8): 3317–3322. 79. He, X., Norris, J. T., Fuerschbach, P.W., and DebRoy, T. 2006. Liquid metal ex-pulsion during laser spot welding of 304stainless steel. J. Phys. D: Appl. Phys. 39(3):525–534. 80. Garandet, J. P., Vinet, B., and Gros,P. 1994. Considerations on the pendantdrop method: a new look at Tate’s law andHarkin’s correction factor. J. Colloid InterfaceSci. 165(2): 351–354.
Appendix A
Calculation of Surface Tensionand Liquid Metal Weight
To calculate the force balance be-tween surface tension and liquid metalweight, the approximated weld pool issplit into two general parts as illustrat-ed in Fig. A1. The leading segment ofthe weld pool, where the laser is inter-acting with the liquid metal, is round-ed and semicircular in shape and ex-tends through the thickness of theplate. The trailing section of the weld,especially at higher welding speeds,can take a triangular appearance at thetop surface but does not extendthrough the entire plate thickness.There is some boundary between thepool and solidified material that ex-tends from the end of the pool on thetop surface to the edge of the pool onthe bottom surface. Similarly, the vol-ume of the idealized weld pool, shownin Fig. A1, is split into two parts, acylinder surrounded by half of a trun-cated cone, which are numbered 1 and2, respectively, near the heat sourcesand an overlapping trapezoid basepyramid, which is divided between arectangular base pyramid (3) and twotriangle base pyramids (4 and 5). Thisidealized volume is comparable to nu-merical modeling results of partial-penetration laser welds made undersimilar conditions with depths of pen-etration close to the plate thickness
Blecher Supplement_Layout 1 2/12/15 11:28 AM Page 81

WELDING RESEARCH
WELDING JOURNAL / MARCH 2015, VOL. 9482-s
used here (Ref. 72). The various shapes are numberedas 1) cylinder, 2) truncated cone, 3)rectangle base pyramid, and 4) and 5)triangle base pyramid. The volumesare calculated as (Ref. 73)
V1 = 1⁄4πd2t (A1)
V2 = 1⁄24(πt)(D2 + d2 + Dd)− 1⁄2V1 (A2)
V3 = 1⁄3dtl − 1⁄2V1 (A3)
V4 = V5 = 1⁄12(D − d)tl (A4)
where d is the bottom surface weldwidth, t is the plate thickness, D is thetop surface weld width, and l is thedistance from the position of maxi-mum weld width to the trailing edge ofthe weld pool. Plate thickness isknown, and the top and bottom sur-face widths can be measured from theweld bead. The distance, l, can be esti-mated from the top surface weld bead.Three measurements were made forthe values D, d, and l in each weld andare given in Table 2 along with thestandard deviations. Most of the liquid steel in the weldis supported partially by underlyingsolid material, which either solidifiedor never melted. So, the entire weightof the liquid metal is not supported bythe surface tension force at the bot-tom of the pool. This situation is ac-counted for by assuming each columnof liquid is supported by a surface act-ing as an inclined plane (Ref. 74). Thevolume of liquid unsupported by anysurface is the cylinder lying in the cen-ter of the truncated cone. The force ofthe liquid metal in the idealized weldpool that must be supported by thesurface tension force is
Fg = g[V1 + (V2 + V4 + V5 + Vs)sin21
+ V3sin22] (A5)
where is the density of liquid iron,7200 kg/m3 (Ref. 24), g is accelerationdue to gravity, 1 is the angle that thecone and the triangle base pyramidsmake with the bottom of the plate,and 2 is the angle that the rectangle
base pyramid makes with the platebottom. Vs is a small volume that isnot considered in the five volumes andis determined by disc integration oftriangle ABC in Fig. 7B. Some of the welds considered arehybrid laser-arc welds, where fillermetal is added to the molten pool. Inthis case, the filler metal was assumedto be spread evenly over the area ofthe idealized weld with each of the fivevolumes increasing based on top sur-face area fractions of each shape. Thevolume of filler metal added over thelength of the weld pool is
where vw is the wire feed speed, dw isthe diameter of the filler metal wire,and U is the welding speed. The firstfraction describes the volume of fillermetal added to the weld per unit time.The time necessary for the arc to tra-verse the length of the weld pool is cal-culated in the second fraction. Addi-tionally, arc pressure from the plasmawill act on the weld pool during hybridlaser-gas metal arc welding. The totalarc force has been measured by Linand Eagar (Ref. 75) in gas tungsten arcwelds for various torch angles andwelding currents. The estimated forces(Ref. 75) are listed in Table 2, andsince the arc is located over the rectan-gle base pyramid, the forces have beenadded to the rectangle base pyramid. In the above derivations, recoilforce and droplet impact force havenot been taken into account. The re-coil force results from evaporation atthe molten pool surface, and thedroplet impact force is due to the addi-tion of liquid metal to the pool fromthe consumable electrode. The recoilpressure is a function of the equilibri-um vapor pressure, which itself de-pends on the temperature of the liquidmetal. Using the vapor pressure of liq-uid iron (Ref. 24), the recoil force (Ref.76) with a 46 mm2 weld pool surfacearea and 2500 K surface temperatureis 0.4 mN. Due to the relatively lowvalue of recoil force at a fairly hightemperature, the effects of recoil pres-sure were neglected. Similarly, when
the droplet mass and acceleration areestimated (Ref. 77) for the weldingconditions studied, the maximumforce is less than 1 mN, which is negli-gible compared to the other forces. The surface tension force is the re-straining force that holds the liquidmetal in the pool and prevents the for-mation of the root defect. This force iscalculated as (Refs. 78,79)
Fs=d (A7)
where is the surface tension of liquidsteel at the melting point. In thisgeometry, the root of the weld poolacts as a pendant drop prior to detach-ment (Ref. 80). According to this for-mulation, the maximum surface ten-sion force is normal to the plate. Thedetermination of the surface tensionfor the pendant drop is calculated thesame as Eq. A7 when the force is setequal to the weight of the droplet. Forthe plate that was ground on the bot-tom, the surface tension was taken as1.91 N/m (Ref. 22), the value for pureiron. For those welds made on platescontaining oxide scale on the bottomsurface, the surface tension was takenas 0.88 N/m (Ref. 21), a value consis-tent with oxygen impurities in iron.
VV d D l
UMw w
4
12 (A6)
2= π + Fig. A1 — The idealized weld pool,
which is used to estimate the volumeand weight of the liquid metal, isshown as — A — A topdown view out-lining the five volumes used to calculatetotal volume; B — a 3D view with thevarious variables, dimensions, and individual volumes.
A
B
Blecher Supplement_Layout 1 2/12/15 11:28 AM Page 82

Appendix D:
Microstructure and Geometry in Low Alloy Steel Laser-Arc Hybrid Welding

WELDING RESEARCH
APRIL 2015 / WELDING JOURNAL 135-s
Introduction Hybrid laser-arc welding is a processthat combines laser beam welding andconventional arc welding in order to in-corporate the benefits of both processes(Refs. 1–4). Hybrid laser-gas metal arc(GMA) welding produces wider weldpools than autogenous laser welding,and deeper weld penetration than GMAwelding with the same parameters(Refs. 5–8). The combination of laserand arc energy sources allows for com-plete-joint-penetration welds to be achieved at sig-nificantly higher welding velocities in asingle pass, while at the same time al-lowing large root openings in weldjoints to be bridged (Refs. 9, 10). As aresult, welding productivity can be
greatly enhanced over that achieved byeither laser or GMA welding alone(Refs. 11–13). In addition, hybrid laser-GMA welding has significant advan-tages in acquiring the desired weld met-al microstructures, since lower coolingrates can be more easily obtained thanin autogenous laser welding. However,martensite, which has very low ductilityand toughness (Ref. 14), can still formin hybrid welding (Ref. 15). Previous work on the hybrid laser-GMA welding of steels has largely fo-cused on the experimental postcharac-terization of weld geometries, mi-crostructures, and mechanical proper-ties (Refs. 15–21). However, thesepostmortem evaluations provide littledetail on the evolution of weld poolgeometries and the cooling rates with-
in the fusion zone. In order to under-stand and predict weld metal mi-crostructural evolution, the thermalcycles experienced during these weld-ing processes must be known. The in-teractions between the heat sourcesand materials during complete-joint-penetration hybrid laser-GMA weldinglead to rapid thermal cycles in theweld pool, which in turn impacts mi-crostructure evolution. Phase transfor-mations during cooling in the weld fu-sion zone have been extensively inves-tigated both experimentally and theo-retically. Bhadeshia et al. developed aphase transformation model (Refs.22–24) based on thermodynamics andphase transformation kinetics. Thismodel can quantitatively predict themicrostructures and properties ofweld deposits for different alloy com-positions, cooling rates, and prioraustenite grain sizes. Direct measurement of temperatureprofiles in the interior of the weld poolstill remains a major challenge. On theother hand, a well-tested three-dimen-sional mathematical model can provideaccurate temperature fields and coolingrates at discrete locations throughoutthe fusion zone (Refs. 25, 26). Severalstudies focused on the numerical mod-eling of the fluid flow and heat transferconditions within the molten weld poolof hybrid laser-arc welding (Refs. 6, 27).Ribic et al. (Ref. 27) numerically studiedthe effect of laser arc separation dis-tance and laser power on heat transferand fluid flow in partial-penetration hy-brid laser-gas tungsten arc (GTA) weld-ing by using a three-dimensional nu-merical model. They found that the dis-tance between the laser and arc signifi-
Fusion Zone Microstructure and Geometry inCompleteJointPenetration LaserArc Hybrid
Welding of LowAlloy SteelA process map indicates a martensitefree microstructure can be
maintained over a wide range of welding parameters
BY H. L. WEI, J. J. BLECHER, T. A. PALMER, AND T. DEBROY
ABSTRACT The fusion zone geometry and microstructure in completejointpenetration hybridlaser gas metal arc welds of a lowalloy steel are examined experimentally and theoretically. Weld geometry and spatially variable cooling rates are investigated using a threedimensional heat transfer and fluid flow model. Experimentally measured microstructures are compared with those estimated from a microstructure model based on kinetics and thermodynamics of phase transformations, for a range of laser arc separationdistances and heat inputs. Considerable variations in both cooling rates and microstructure were observed for the range of process parameters utilized. In fact, the experimental results and calculations show that for the same heat input, a predominantly ferriticand predominantly martensitic microstructure can be obtained, depending on the laserarc separation distance and resulting cooling rate. A process map is constructed showing the effect of welding speed, laser power, and laser arc separation distance on cooling rates and microconstituent volume fractions. The map indicates a martensitefreemicrostructure can be maintained over a wide range of welding parameters.
KEYWORDS • Hybrid Welding • Heat Transfer and Fluid Flow • Microstructure • Complete Joint Penetration • Laser • Gas Metal Arc • Cooling Rate
H. L. WEI ([email protected]), J. J. BLECHER, and T. DEBROY are with Department of Materials Science and Engineering, and T. A. PALMER is with Applied Re-search Laboratory, The Pennsylvania State University, University Park, Pa.
Wei Supplement April 2015_Layout 1 3/12/15 4:00 PM Page 135

WELDING RESEARCH
WELDING JOURNAL / APRIL 2015, VOL. 94136-s
cantly affected the cooling rates andthat the weld penetration was maxi-mized at an optimal laser arc separationdistance (Ref. 27). Cho et al. (Ref. 6)simulated the molten weld pool geome-try in laser-arc hybrid welding by solv-ing the equations of continuity, mo-mentum, and energy using a commer-cial package. They reported that thewidth of the weld was determinedmainly by the GMA heat source and thepenetration depth was strongly influ-enced by the laser (Ref. 6). However,there are very few systematic studies fo-cused on the numerical simulation of
weld profile evolution, cooling rateswithin the fusion zone, and the corre-sponding influence on the weld metalmicrostructures in complete-joint-pene-tration hybrid laser-GMA welding. Theprevious numerical studies (Refs. 6, 27)have discussed partial-penetration hy-brid welding, where the fluid flow andheat transfer at the bottom of themolten weld pool are significantly dif-ferent than those in complete-joint-penetration welding. In this work, the evolution of macro-and microstructures of complete-joint-penetration laser-GMA hybrid welds inDH 36 steel is analyzed using funda-mental transport phenomena andphase transformation theory. A three-dimensional heat transfer and fluidflow model has been developed to studythe effect of welding velocity and laserarc separation distance on weld geome-tries and cooling rates. Using the calcu-lated cooling rates from the heat trans-fer and fluid flow model, a phase trans-formation model (Refs. 22–24) basedon thermodynamics and phase transfor-mation kinetics is used to provide a
quantitative description of the final mi-crostructures of the weld metal. Thecomputed volume fractions of the weldmetal allotriomorphic ferrite, Wid-manstätten ferrite, acicular ferrite, andmartensite are validated with corre-sponding experimental results for vari-ous welding conditions. The combinedmodels are used to construct processmaps capable of predicting the effect ofwelding parameters on resulting coolingrates and microstructures.
Experimental Procedure Bead-on-plate complete-joint-penetration hybrid laser-GMA weldswere made on 4.8-mm-thick DH 36steel. An IPG Photonics® YLR-12000-Lytterbium fiber laser with a Precitec®YW50 welding head and a Lincoln Elec-tric® Power Wave 455 M/STT weldingpower source with a Binzel® WH 455Dwater-cooled welding gun were used forhybrid welding. The maximum power ofthe fiber laser is 12 kW, with a wave-length of 1070–1080 nm. The opticssystem utilizes collimating and focusinglenses with 200- and 500-mm focallengths, respectively. The laser is trans-ported to the welding head through a200-mm-diameter process fiber. The fo-cal spot of the laser beam in the absenceof plasma was approximately 0.56 mmin diameter. The laser was focused 8mm above the surface of the plate. Thelaser power used in the welding experi-ments was fixed at 5.0 kW for all thecases. The electrode was 0.045-in.- (1.1-mm-) diameter ER70S-6 wire. Thechemical compositions of DH 36 steeland ER70S-6 welding wire are given inTable 1. The metal transfer mode forthe welding wire was in spray mode.The shielding gas was a mixture of 95%argon and 5% CO2 with a flow rate of 95ft3/h (44.8 L/min). The welding veloci-ties and laser arc separation distanceswere varied to study their effects on theweld profiles and weld metal mi-crostructures. The key welding parame-ters are listed in Table 2. The top andbottom surfaces of the plate were
Fig. 1 — Top surface and symmetry planeof weld pool with temperature contoursand velocity fields for the following:A — Welding speed of 20.0 mm/s, laserarc separation distance of 1 mm; B —welding speed of 30.0 mm/s, laser arcseparation distance of 1 mm. Fig. 2 — Comparison of experimental and
simulated weld cross sections for the hy-brid laserGMA complete-joint-penetra-tion welding of DH 36 steel for thefollowing: A — Welding speed of 20.0mm/s, laser arc separation distance of 1mm; B — welding speed of 30.0 mm/s,laser arc separation distance of 1 mm.
Fig. 3 — Top surface and symmetryplane of weld pool with temperaturecontours and velocity vectors for the fol-lowing: A — Welding speed of 40.0mm/s, laser arc separation distance of 1mm; B — welding speed of 40.0 mm/s,laser arc separation distance of 5 mm.
Table 1 — Chemical Composition of Base Metal DH 36 Steel (Ref. 10) and Welding Wire ER 70S6 (wt%)
C Mn Si Ni Mo Cr V P S Al Nb Ti Cu
Base 0.06 1.39 0.19 0.14 0.03 0.11 0.06 0.011 0.004 0.025 0.01 0.01 0.25 Metal
Welding 0.09 1.63 0.90 0.05 0.05 0.05 0.05 0.007 0.007 0.000 0.00 0.00 0.20Wire
A
A
A
B
B
B
Wei Supplement April 2015_Layout 1 3/12/15 4:00 PM Page 136

WELDING RESEARCH
APRIL 2015 / WELDING JOURNAL 137-s
ground to remove scale prior to weldingin order to avoid weld root defects dur-ing complete-joint-penetration welding.The sides of the plate were supported,so the welds were made without con-tacting the table below. Selected weldswere sectioned, polished, etched, andphotographed to reveal the weld fusionzone profile and microstructures. Thevolume fractions of selected microcon-stituents in the weld metal are deter-mined by using the point countingmethod following the International In-stitute of Welding (IIW) guidelines (Ref.28).
Mathematical Model A three-dimensional heat transferand fluid flow model for complete-joint-penetration hybrid laser-GMA weldingwas developed by modifying previousnumerical simulation work (Refs. 27,29, 31). Zhao et al. (Ref. 31) developed atransport phenomena-based numericalmodel to predict the keyhole geometryand temperature profiles in the weld-ment during keyhole laser welding. Raiet al. (Ref. 29) developed a convectiveheat transfer model for both partial andcomplete-joint-penetration keyholemode laser welding of a structural steelbased on the work of Zhao et al. (Ref.
31). Ribic et al. (Ref. 27) proposed athree-dimensional heat transfer andfluid flow model for partial-penetrationhybrid laser-GTA welding. In this work,complete-joint-penetration hybridlaser-GMA welding is studied.Marangoni force-driven velocityboundary conditions at the bottomsurface are assumed, which is different
from that of partial-penetration hybridwelding. In addition, the heat transferfrom the metal droplets during GMAWis integrated into the numerical modelfor hybrid laser-GMA welding. The ma-terial properties used in order to com-plete the welding calculations are givenin Table 3. Details of the numerical sim-ulation model are presented below.
Calculation of Keyhole Profile
The keyhole geometry is calculatedusing a model that considers materialproperties, welding process parameters,and specimen geometries. The detailedinformation about the model is avail-able elsewhere (Refs. 30, 31) and onlythe salient features are presented here.The keyhole profile is calculated basedon a point by point energy balance atthe keyhole walls and is determined it-eratively. Multiple reflections of the
laser beam within the keyhole are as-sumed and the number of reflections isdependent on the keyhole geometry.The keyhole wall local temperature istaken as the boiling point of the alloy(Refs. 30, 31). Planar heat conductionfrom the keyhole wall into the work-piece is assumed due to the significantlyhigher temperature gradient in all direc-tions in the horizontal plane comparedto the vertical directions. Once the pro-file calculation is completed, the tem-perature distribution from the keyholemodel is stored in a data file with alltemperatures inside the keyhole as-signed the boiling point temperature.This file is read into the heat transferand fluid flow model, and at each hori-zontal x-y plane, the keyhole boundaryis identified by a minimum and a maxi-mum x value for any y value.
Heat Transfer in Weld Pool andBoundary Conditions
After the calculation of the keyholeprofile, equations of conservation ofmass, momentum, and energy aresolved in three dimensions in the heattransfer and fluid flow model. Detailsabout this model are available in the lit-erature (Refs. 22, 23, 29) and only the
Fig. 4 — Comparison of experimental andsimulated weld cross sections for the hybridlaserGMA complete-joint-penetrationwelding of DH 36 steel for the following: A— Welding speed of 40.0 mm/s, laser arcseparation distance of 1 mm; B — weldingspeed of 40.0 mm/s, laser arc separationdistance of 5 mm.
Table 2 — Welding Process Parameters for CompleteJointPenetration Hybrid Laser GMA Welding ofDH 36 Steel
Weld Laser Power Arc Current Arc Voltage Welding Laser ArcNumber (kW) (A) (V) Speed (mm/s) Separation (mm)
1 5.0 248 31 20.0 1.02 5.0 235 31 30.0 1.03 5.0 232 31 40.0 1.04 5.0 232 31 40.0 5.0
A
B
Fig. 5 — Calculated cooling curves at dif-ferent y locations on the top surface of thefusion zone of weld 1 with welding speedof 20.0 mm/s, laser arc separation distance of 1 mm. The symbol y representsthe distance from the weld centerline.
Fig. 6 — Comparison of the calculatedcooling rates of the top center fusionzone for weld 1 with welding speed of20.0 mm/s, laser arc separation distanceof 1 mm, and weld 2 with welding speedof 30.0 mm/s, laser arc separation distance of 1 mm.
Wei Supplement April 2015_Layout 1 3/12/15 4:00 PM Page 137

WELDING RESEARCH
WELDING JOURNAL / APRIL 2015, VOL. 94138-s
salient features are presented here. Themolten metal is assumed to be an in-compressible, laminar, and Newtonianfluid. The liquid metal flow in the weldpool can be represented by the followingmomentum conservation equation(Refs. 30, 31):
where is the density, t is the time, xi isthe distance along the ith (i = 1, 2, and3) orthogonal direction, uj is the velocitycomponent along the j direction, isthe effective viscosity, and Sj is thesource term for the jth momentum equa-tion and is given as
where p represents pressure, U is thewelding speed, and is the coefficientof volume expansion. The third termrepresents the frictional dissipation inthe mushy zone according to the Car-man-Kozeny equation for flow througha porous media (Refs. 32, 33) where fL isthe liquid fraction, B is a very smallcomputational constant to avoid divi-sion by zero, and C is a constant ac-counting for the mushy zone morpholo-
gy [a value of 1.6 × 10⁴ was used in thepresent study (Ref. 34)]. The fourthterm is the buoyancy source term (Refs.23, 34, 35). The last term accounts forthe relative motion of the workpiece rel-ative to the laser and arc heat sources(Ref. 23). The following continuity equation issolved in conjunction with the momen-tum equation to obtain the pressurefield.
In order to trace the weld pool liq-uid/solid interface, i.e., the phasechange, the total enthalpy H is repre-sented by a sum of sensible heat h andlatent heat content DH, i.e., H = h + DH
u
t
u u
x
x
u
xS
j i j
i
i
j
ij
( )ρ
∂∂
+ ρ∂
∂
= ∂∂
μ∂∂
⎛⎝⎜
⎞⎠⎟
+ (1)
Sp
x x
u
x
Cf
f Bu
g T T Uu
x
jj j
j
j
L
Lj
refj
j( )
( )
= − ∂∂
+ ∂∂
μ∂∂
⎛
⎝⎜
⎞
⎠⎟
−−
+
⎛
⎝⎜⎜
⎞
⎠⎟⎟
+ρ β − − ρ∂∂
1
(2)
2
3
u
xi
i
( )∂ ρ∂
= 0 (3)
Fig. 7 — Comparison of the calculatedcooling rates of the fusion zone located 1mm above the bottom surface for weld 3with welding speed of 40.0 mm/s, laser arcseparation distance of 1 mm, and weld 4with welding speed of 40.0 mm/s, laser arcseparation distance of 5 mm.
Fig. 8 — Comparison of the optical mi-crostructures of the top center of the fusion zone by different welding speeds.Magnification 500x. A — Welding speedof 20.0 mm/s, laser arc separation distance of 1 mm; B — welding speed of 30.0mm/s, laser arc separation distance of 1mm. The symbols , W, and a representallotriomorphic, Widmanstätten, and acicular ferrite, respectively.
Table 3 — Material Properties Used for the Calculation of Temperature and Velocity Fields (Ref. 29)
Physical Property DH 36 Steel
Boiling point (K) 3133Solidus temperature (K) 1745Liquidus temperature (K) 1785Density (kg/m3) 7200Thermal conductivity (W/mK) 21Inverse Bremsstrahlung absorption coefficient (1/m) 100Absorption coefficient (flat surface) 0.16Molecular viscosity (Pas) 0.0067Coefficient of thermal expansion (l/K) 1.96 x 10⁵
Temperature coefficient of surface tension (N/m K) –0.5 x 10³
Enthalpy of solid at melting point (J/kg) 1.20 x 10⁶
Enthalpy of liquid at melting point (J/kg) 1.26 x 10⁶
Specific heat of solid (J/kg K) 710.6Specific heat of liquid (J/kg K) 836.0
A
B
Fig. 9 — Comparison of the optical mi-crostructures of the fusion zone located 1mm above the bottom surface by differentlaser arc separation distances. Magnifica-tion 500x. A — Welding speed of 40.0mm/s, laser arc separation distance of 1mm; B — welding speed of 40.0 mm/s,laser arc separation distance of 5 mm. Thesymbols , W, a, and M represent allotriomorphic, Widmanstätten, acicular ferrite,and martensite, respectively.
A
B
Wei Supplement April 2015_Layout 1 3/12/15 4:00 PM Page 138
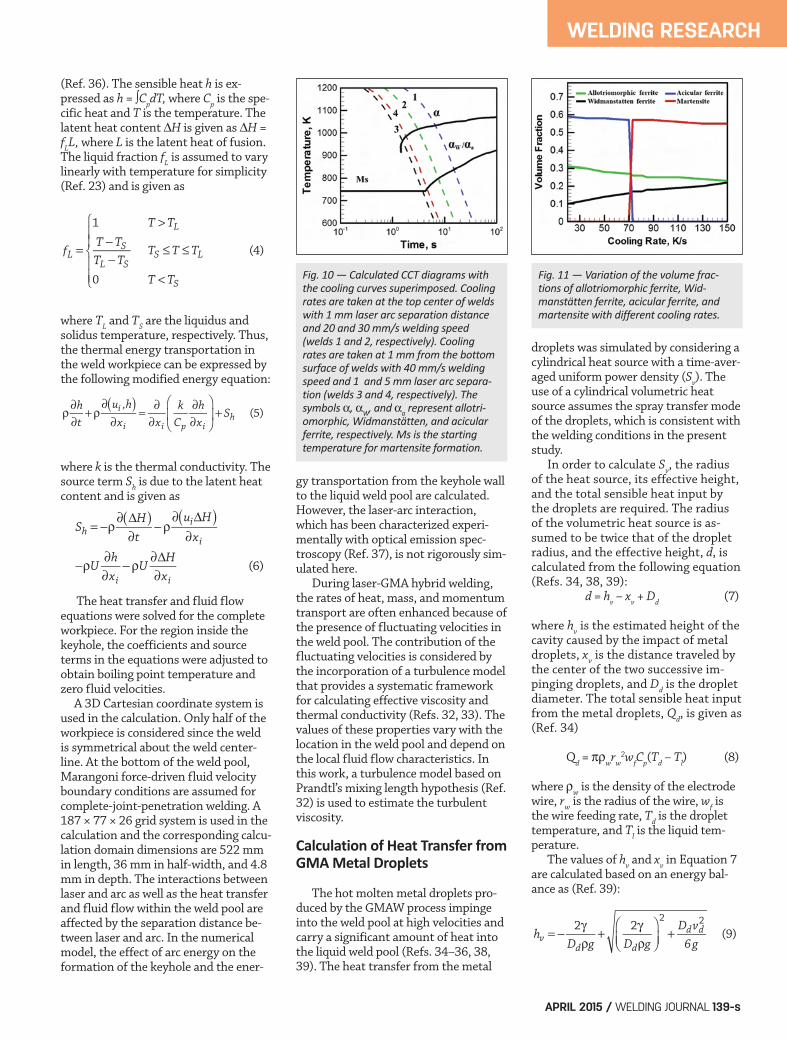
WELDING RESEARCH
APRIL 2015 / WELDING JOURNAL 139-s
(Ref. 36). The sensible heat h is ex-pressed as h = CpdT, where Cp is the spe-cific heat and T is the temperature. Thelatent heat content DH is given as DH =fLL, where L is the latent heat of fusion.The liquid fraction fL is assumed to varylinearly with temperature for simplicity(Ref. 23) and is given as
where TL and TS are the liquidus andsolidus temperature, respectively. Thus,the thermal energy transportation inthe weld workpiece can be expressed bythe following modified energy equation:
where k is the thermal conductivity. Thesource term Sh is due to the latent heatcontent and is given as
The heat transfer and fluid flowequations were solved for the completeworkpiece. For the region inside thekeyhole, the coefficients and sourceterms in the equations were adjusted toobtain boiling point temperature andzero fluid velocities.
A 3D Cartesian coordinate system isused in the calculation. Only half of theworkpiece is considered since the weldis symmetrical about the weld center-line. At the bottom of the weld pool,Marangoni force-driven fluid velocityboundary conditions are assumed forcomplete-joint-penetration welding. A187 × 77 × 26 grid system is used in thecalculation and the corresponding calcu-lation domain dimensions are 522 mmin length, 36 mm in half-width, and 4.8mm in depth. The interactions betweenlaser and arc as well as the heat transferand fluid flow within the weld pool areaffected by the separation distance be-tween laser and arc. In the numericalmodel, the effect of arc energy on theformation of the keyhole and the ener-
gy transportation from the keyhole wallto the liquid weld pool are calculated.However, the laser-arc interaction,which has been characterized experi-mentally with optical emission spec-troscopy (Ref. 37), is not rigorously sim-ulated here. During laser-GMA hybrid welding,the rates of heat, mass, and momentumtransport are often enhanced because ofthe presence of fluctuating velocities inthe weld pool. The contribution of thefluctuating velocities is considered bythe incorporation of a turbulence modelthat provides a systematic frameworkfor calculating effective viscosity andthermal conductivity (Refs. 32, 33). Thevalues of these properties vary with thelocation in the weld pool and depend onthe local fluid flow characteristics. Inthis work, a turbulence model based onPrandtl’s mixing length hypothesis (Ref.32) is used to estimate the turbulentviscosity.
Calculation of Heat Transfer fromGMA Metal Droplets
The hot molten metal droplets pro-duced by the GMAW process impingeinto the weld pool at high velocities andcarry a significant amount of heat intothe liquid weld pool (Refs. 34–36, 38,39). The heat transfer from the metal
droplets was simulated by considering acylindrical heat source with a time-aver-aged uniform power density (Sv). Theuse of a cylindrical volumetric heatsource assumes the spray transfer modeof the droplets, which is consistent withthe welding conditions in the presentstudy. In order to calculate Sv, the radiusof the heat source, its effective height,and the total sensible heat input bythe droplets are required. The radiusof the volumetric heat source is as-sumed to be twice that of the dropletradius, and the effective height, d, iscalculated from the following equation(Refs. 34, 38, 39):
d = hv – xv + Dd (7)
where hv is the estimated height of thecavity caused by the impact of metaldroplets, xv is the distance traveled bythe center of the two successive im-pinging droplets, and Dd is the dropletdiameter. The total sensible heat inputfrom the metal droplets, Qd, is given as(Ref. 34)
Qd = prwrw2wfCp(Td – Tl) (8)
where rw is the density of the electrodewire, rw is the radius of the wire, wf isthe wire feeding rate, Td is the droplettemperature, and Tl is the liquid tem-perature. The values of hv and xv in Equation 7are calculated based on an energy bal-ance as (Ref. 39):
f
T T
T TT T
T T T
T T
L
L
S
L SS L
S
=
>−−
≤ ≤
<
⎧
⎨⎪⎪
⎩⎪⎪
1
0
(4)
ht
u ,h
x xk
Chx
Si
i i p ih (5)
( )ρ∂
∂+ ρ
∂∂
= ∂∂
∂∂
⎛
⎝⎜
⎞
⎠⎟ +
SHt
u H
x
Uhx
UH
x
hi
i
i i
( )( )= −ρ∂ Δ
∂− ρ
∂ Δ∂
−ρ ∂∂
− ρ ∂Δ∂
(6)
hD g D g
D v6gv
d d
d d= − γρ
+ γρ
⎛⎝⎜
⎞⎠⎟
+2 2(9)
2 2
Fig. 10 — Calculated CCT diagrams withthe cooling curves superimposed. Coolingrates are taken at the top center of weldswith 1 mm laser arc separation distanceand 20 and 30 mm/s welding speed(welds 1 and 2, respectively). Coolingrates are taken at 1 mm from the bottomsurface of welds with 40 mm/s weldingspeed and 1 and 5 mm laser arc separation (welds 3 and 4, respectively). Thesymbols , W, and a represent allotriomorphic, Widmanstätten, and acicularferrite, respectively. Ms is the startingtemperature for martensite formation.
Fig. 11 — Variation of the volume frac-tions of allotriomorphic ferrite, Widmanstätten ferrite, acicular ferrite, andmartensite with different cooling rates.
Wei Supplement April 2015_Layout 1 3/12/15 4:00 PM Page 139
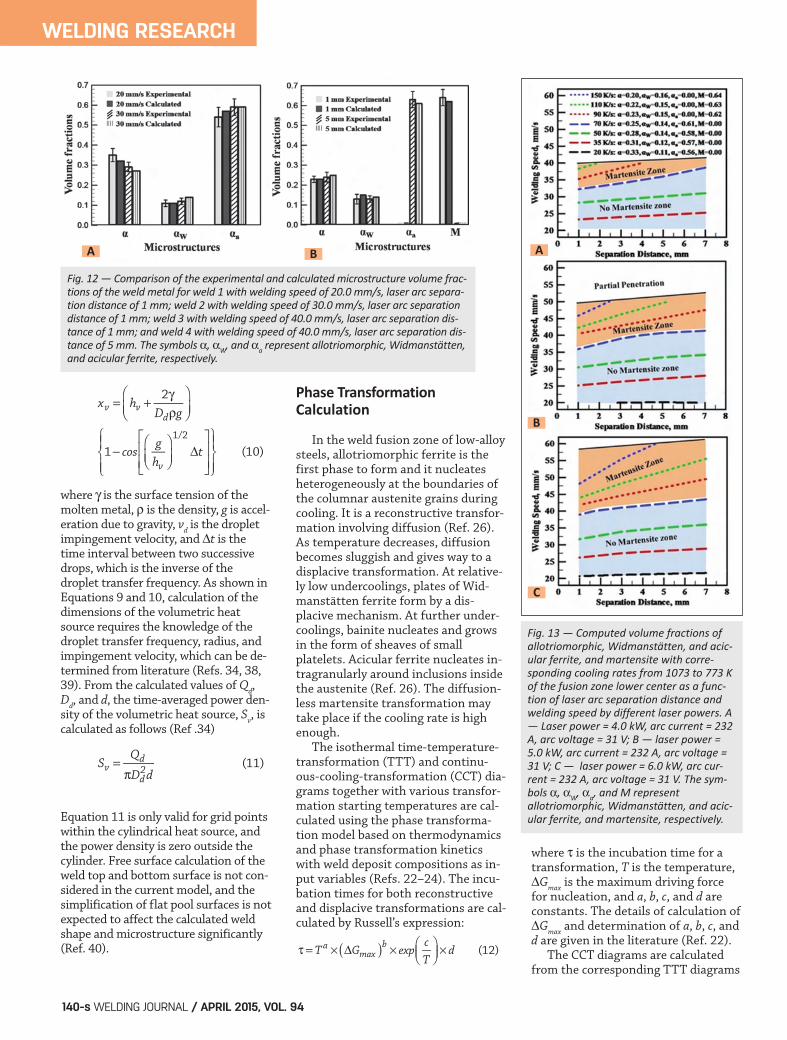
WELDING RESEARCH
WELDING JOURNAL / APRIL 2015, VOL. 94140-s
where is the surface tension of themolten metal, r is the density, g is accel-eration due to gravity, vd is the dropletimpingement velocity, and Dt is thetime interval between two successivedrops, which is the inverse of thedroplet transfer frequency. As shown inEquations 9 and 10, calculation of thedimensions of the volumetric heatsource requires the knowledge of thedroplet transfer frequency, radius, andimpingement velocity, which can be de-termined from literature (Refs. 34, 38,39). From the calculated values of Qd,Dd, and d, the time-averaged power den-sity of the volumetric heat source, Sv, iscalculated as follows (Ref .34)
Equation 11 is only valid for grid pointswithin the cylindrical heat source, andthe power density is zero outside thecylinder. Free surface calculation of theweld top and bottom surface is not con-sidered in the current model, and thesimplification of flat pool surfaces is notexpected to affect the calculated weldshape and microstructure significantly(Ref. 40).
Phase TransformationCalculation
In the weld fusion zone of low-alloysteels, allotriomorphic ferrite is thefirst phase to form and it nucleatesheterogeneously at the boundaries ofthe columnar austenite grains duringcooling. It is a reconstructive transfor-mation involving diffusion (Ref. 26).As temperature decreases, diffusionbecomes sluggish and gives way to adisplacive transformation. At relative-ly low undercoolings, plates of Wid-manstätten ferrite form by a dis-placive mechanism. At further under-coolings, bainite nucleates and growsin the form of sheaves of smallplatelets. Acicular ferrite nucleates in-tragranularly around inclusions insidethe austenite (Ref. 26). The diffusion-less martensite transformation maytake place if the cooling rate is highenough. The isothermal time-temperature-transformation (TTT) and continu-ous-cooling-transformation (CCT) dia-grams together with various transfor-mation starting temperatures are cal-culated using the phase transforma-tion model based on thermodynamicsand phase transformation kineticswith weld deposit compositions as in-put variables (Refs. 22–24). The incu-bation times for both reconstructiveand displacive transformations are cal-culated by Russell’s expression:
where t is the incubation time for atransformation, T is the temperature,DGmax is the maximum driving forcefor nucleation, and a, b, c, and d areconstants. The details of calculation ofDGmax and determination of a, b, c, andd are given in the literature (Ref. 22). The CCT diagrams are calculatedfrom the corresponding TTT diagrams
SQ
D dv
d
d2=
π(11)
x hD g
cosgh
t
v vd
v
= + γρ
⎛⎝⎜
⎞⎠⎟
−⎛⎝⎜
⎞⎠⎟
Δ⎡
⎣⎢⎢
⎤
⎦⎥⎥
⎧⎨⎪
⎩⎪
⎫⎬⎪
⎭⎪
2
1 (10)1/2
T G expcT
damax
b( )τ = × Δ × ⎛⎝⎜
⎞⎠⎟ × (12)
Fig. 12 — Comparison of the experimental and calculated microstructure volume frac-tions of the weld metal for weld 1 with welding speed of 20.0 mm/s, laser arc separation distance of 1 mm; weld 2 with welding speed of 30.0 mm/s, laser arc separationdistance of 1 mm; weld 3 with welding speed of 40.0 mm/s, laser arc separation distance of 1 mm; and weld 4 with welding speed of 40.0 mm/s, laser arc separation distance of 5 mm. The symbols , W, and a represent allotriomorphic, Widmanstätten,and acicular ferrite, respectively.
A B
Fig. 13 — Computed volume fractions ofallotriomorphic, Widmanstätten, and acicular ferrite, and martensite with corre-sponding cooling rates from 1073 to 773 Kof the fusion zone lower center as a func-tion of laser arc separation distance andwelding speed by different laser powers. A— Laser power = 4.0 kW, arc current = 232A, arc voltage = 31 V; B — laser power =5.0 kW, arc current = 232 A, arc voltage =31 V; C — laser power = 6.0 kW, arc cur-rent = 232 A, arc voltage = 31 V. The sym-bols , W, a, and M representallotriomorphic, Widmanstätten, and acicular ferrite, and martensite, respectively.
A
B
C
Wei Supplement April 2015_Layout 1 3/12/15 4:00 PM Page 140
WELDING RESEARCH
APRIL 2015 / WELDING JOURNAL 141-s
based on the Scheil additive rule (Ref.41):
where ta is the incubation time requiredto reach a specified state on a TTT dia-gram for isothermal reactions, t is thetime to that stage for the nonisother-mal reactions, and dt is the time inter-val at temperature T. In this procedure,the total time to reach a specified stateof transformation for nonisothermal re-actions is obtained by adding the frac-tions of time to reach this stage isother-mally until the sum reaches unity. The inclusion of the weld depositcompositions also leads to the calcula-tion of the appropriate part of thephase diagram needed to obtain para-equilibrium compositions for kineticanalysis. These data are combined withaustenite grain parameters and thecomputed cooling curves from the heattransfer and fluid flow model to calcu-late the volume fractions of allotriomor-phic, Widmanstätten ferrite, acicularferrite, and martensite (Ref. 23). Themodeling results are used to better un-derstand the experimentally observedmicrostructures of the weld metal incomplete-joint-penetration hybridlaser-GMA welding.
Results and Discussion
Calculated Temperature andVelocity Fields
The effects of welding speed andlaser arc separation distance on weldprofiles and temperature and velocityfields are studied separately for com-plete-joint-penetration hybrid laser-GMA welding. Both these parametershave been shown to significantly affectthe weld quality and welding productivi-ty. Figure 1 shows the calculated tem-perature and fluid flow fields in threedimensions when the welding speed in-creases from 20 to 30 mm/s with a con-stant laser arc separation distance of 1mm. The temperature is indicated bycontour lines and the velocity field isrepresented by arrows. There is an in-tense temperature gradient on the topand bottom surfaces of the weld poolbecause the temperature of the liquidmetal at the keyhole wall equals theboiling point, while the liquid metal at
the weld pool boundary remains at thesolidus temperature. The molten metalmoves radially outward for both the topand bottom surfaces because of theMarangoni convection produced by thespatial gradient of surface tension re-sulting from the temperature gradient.The maximum outward flow velocitiesof the top surface are 155.6 and 194.2mm/s for welding speeds of 20 and 30mm/s, respectively. The momentum isthen transferred by viscous dissipationto the inner layers of the weld pool adja-cent to the surface. The comparison between these cal-culated and experimental weld poolgeometries is shown in Fig. 2. The topsurface width decreases from 9.6 to 7.0mm, and the bottom surface width de-creases from 3.6 to 2.0 mm when thewelding speed increases from 20 to 30mm/s. The boiling point contours indi-cate the cross-sectional geometry of thekeyhole, while the solidus temperaturecontours indicate the fusion zoneboundary. It is observed that the widthsof the top and bottom surfaces, as wellas the shape of the fusion zone predict-ed by the heat transfer and fluid flowmodel, agreed well with the correspon-ding experimental results. The weldpool dimensions decrease significantlywith the increasing welding speed as thetop surface widens due to Marangoniconvection. Furthermore, the bottomwidth is also larger than the minimumweld profile width at the middle of theplate thickness, indicating the signifi-cant effect of convective heat transfer. Figure 3 shows the calculated tem-perature and fluid flow fields when thelaser arc separation distance increasesfrom 1 to 5 mm with a welding speed of40 mm/s. When the laser arc separationdistance is changed, the nominal totalheat input of the welding process is con-stant, while the heat input decreasesfrom 0.63 to 0.41 kJ/mm with a weld-ing velocity increase from 20 to 30mm/s, as shown in Fig. 2. The comput-ed length of the weld pool increasesfrom 18 to 23 mm with the increasinglaser arc separation distance. The heatfrom the laser and arc as well as thedroplet is more concentrated near thelaser beam incident point at shorterlaser arc separation distance. The heatdistribution over the top surface of theweld pool significantly changes whenthe arc axis is further separated fromthe laser beam. The top part of the liq-
uid weld pool is stretched and the dis-tance along the welding direction fromthe maximum weld width to the laserbeam incidental point is significantly increased. Figure 4 shows the comparison be-tween these calculated and experimen-tal weld pool geometries. The top sur-face width increases from 5.1 to 6.8mm, and the bottom surface width in-creases from 1.2 to 1.6 mm when thelaser arc separation distance increasesfrom 1 to 5 mm. It can be observedfrom Figs. 1 and 3 that the effects ofwelding speed and laser arc separationdistance on the weld profiles are differ-ent. When the welding speed increasesfrom 20 to 30 mm/s, the weld poolshrinks significantly in all locationsalong the weld depth. However, only thetop part of the weld pool significantlyincreases when the laser arc separationdistance increases from 1 to 5 mm. Thebottom part has a slight change and themiddle part of the weld pool is almostunaffected by the laser arc separationdistance. Changes in these processingconditions impact the resulting weldpool geometries in different ways. Forexample, the increase of the weldingspeed reduces the net energy absorbedby the workpiece. On the other hand,the increase of the laser arc separationdistance mainly influences the energydistribution of the heat sources.
Cooling Rates
The cooling rates over the austenitedecomposition range from 1073 to773 K within the weld fusion zone arecalculated using this same heat trans-fer and fluid flow model. The calculat-ed cooling rates are then used in themodeling of the weld metal mi-crostructures of low-alloy steels. Fig-ure 5 shows the calculated coolingcurves between 773 and 1073 K at dif-ferent locations on the top surface ofthe weld with a welding speed of 20mm/s. It can be seen that the coolingrates are almost independent of posi-tion. The cooling rates within the fu-sion zone and the cooling rate in theheat-affected zone (HAZ) are both at alevel of approximately 20 K/s. Thesesimilarities in cooling rates allow a sin-gle cooling condition to be assumedfor each horizontal plane across theweld depth. The comparison of the calculated
∫ ( ) =dtt Ta
t1 (13)
0
Wei Supplement April 2015_Layout 1 3/12/15 4:00 PM Page 141

WELDING RESEARCH
WELDING JOURNAL / APRIL 2015, VOL. 94142-s
cooling curves at the top surface of thefusion zone for welding velocities of20 and 30 mm/s and a 1-mm separa-tion distance are shown in Fig. 6. Thecalculated cooling rate between 1073and 773 K increases from 21.3 to 48.4K/s with the increasing weld speed.The corresponding cooling times are14.1 and 6.2 s, respectively. As expect-ed, the cooling rate increases with in-creasing welding speed and resultingdecrease in heat input. The calculated cooling curves be-tween 1073 and 773 K along the center-line 1.0 mm above the bottom surfaceof the weld for laser arc separation dis-tances of 1 and 5 mm at a welding speedof 40 mm/s are shown in Fig. 7. This po-sition is chosen because the width ofthe weld pool is the smallest at thisdepth, which indicates that the weldmetal at this region is more prone tocontain martensite. The calculated cool-ing rates from 1073 to 773 K are 83.3and 66.7 K/s when the laser arc separa-tion distance increases from 1 to 5 mm.The corresponding cooling times are 3.6and 4.5 s, respectively. Ribic et al. (Ref.27) reported that for hybrid laser-GTAwelding with heat input of 0.10 kJ/mm,the cooling time from 1073 to 773 K in-creased from 0.45 to 0.75 s with the in-crease of laser arc separation distancefrom 3.5 to 9.2 mm. As can be seenfrom Fig. 3A, B, the weld pool length in-creases with the increasing laser arc sep-aration distance. The isothermals alsoexpand for regions beyond the liquidweld pool so that the spatial gradient oftemperature decreases for the tempera-ture range from 1073 to 773 K. There-fore, the cooling rate decreases with in-creasing laser arc separation distance,which is consistent with the result re-ported by Ribic et al. (Ref. 27). In order to validate the calculation ofthe cooling rates between 1073 and 773K, the calculated cooling rates for differ-ent welding conditions are comparedwith the results available in the litera-ture that examine the effects of changesin heat input and plate thickness on thecooling rate during arc welding (Ref.42). The literature results show thecooling time from 1073 to 773 K forthe welding speeds of 20, 30, and 40mm/s are approximately 13.1, 6.0, and3.9 s, compared with the values of 14.1,6.2, and 3.6 s calculated by the heattransfer and fluid flow model. There-fore, the cooling rates between 1073
and 773 K obtained from the literatureand the 3D heat transfer and fluid flowmodel show good agreement.
Microstructures
The comparison of the fusion zonemicrostructures located at the top sur-face of the weld for welding speeds of20 and 30 mm/s at laser arc separationdistance of 1 mm is shown in Fig. 8.For a welding speed of 20 mm/s, themicrostructure contains 35% allotri-omorphic ferrite, 11% Widmanstättenferrite, and 54% acicular ferrite. Whenthe welding speed increases to 30mm/s, the amount of allotriomorphicferrite decreases to 29%, Widmanstät-ten ferrite increases to 12%, and acicu-lar ferrite increases to 59%. The aver-age length of the acicular ferrite de-creases from 13.1 to 7.1 m and thewidth decreases from 3.1 to 1.2 mwhen the welding speed increasesfrom 20 to 30 mm/s. The hardnesstesting results show the microhard-ness value increases from 223 to 248HV. The average microhardness of thebase metal is 174 ± 11 HV. The differ-ences in microstructure contribute tothe higher microhardness of the weldmetal with a higher welding speed. The comparison of the fusion zonemicrostructures located 1.0 mm abovethe bottom surface of the weld for alaser arc separation distance of 1 and 5mm at a welding speed of 40 mm/s isshown in Fig. 9. The volume fraction ofmartensite is about 64% for the laserarc separation distance of 1 mm, com-pared with a separation distance of 5mm when no martensite is present. Theamounts of allotriomorphic ferrite andWidmanstätten ferrite are about 23 and13%, respectively, for 1-mm separationdistance. The volume fraction of acicu-lar ferrite is about 63%, and theamounts of allotriomorphic ferrite andWidmanstätten ferrite are about 24 and13%, respectively, for a laser arc separa-tion distance of 5 mm. The microhard-ness decreases from 283 to 238 HVwhen the laser arc separation distanceincreases from 1 to 5 mm. The highermicrohardness indicates martensite ispresent and signifies a lower toughnessof the weld (Refs. 21, 43, 44), which isdetrimental to the mechanical proper-ties of the joint. Figure 10 shows the CCT diagramscomputed from the TTT diagram based
on the Scheil additive rule, superim-posed with the cooling curves at select-ed locations in the four welds. The cool-ing curves of the welds with weldingspeeds of 20 and 30 mm/s at a laser arcseparation distance of 1 mm both inter-cept with the diffusive and displacivetransformation curves, so allotriomor-phic ferrite, Widmanstätten ferrite, bai-nite, and acicular ferrite are expected.The cooling curve of the weld with alaser arc separation distance of 1 mm atthe welding speed of 40 mm/s inter-cepts with the upper C curve and themartensite transformation line whilethe cooling curve for the weld with alaser arc separation distance of 5 mm atthe welding speed of 40 mm/s inter-cepts with both the upper and lower Ccurves but not the martensite transfor-mation line. As a result, martensite isexpected with the laser arc separationdistance of 1 mm but not for the laserarc separation distance of 5 mm, al-though the net heat input of the weld-ing process is identical. The variation of the calculated vol-ume fractions of allotriomorphic andWidmanstätten ferrite, acicular ferrite,and martensite with cooling rates isshown in Fig. 11. For the compositionof DH 36 steel and austenite grain sizesobserved in the experimental welds, aci-cular ferrite is the predominant phase,comprising nearly 60% of the mi-crostructure up to the critical coolingrate for martensite. Widmanstätten fer-rite increases with cooling rate at the ex-pense of allotriomorphic ferrite. Thesetwo phases combine to make up 40% ofthe microstructure. The calculated re-sults are consistent with the data re-ported in previous work (Ref. 24). Both the experimentally measuredand calculated quantitative volumefractions of different phases of thefour welds are shown in Fig. 12. Goodagreement between the two sets ofdata is observed. Figure 12A showsthe volume fractions of allotriomor-phic ferrite and acicular ferrite slightlydecrease while Widmanstätten ferriteincreases with the increasing weldingspeed. Figure 12B shows the marten-site volume fraction is about 52%when the laser arc separation distanceis 1 mm, but no martensite is ob-served when the laser arc separationdistance increases to 5 mm. A verysmall amount of acicular ferrite is ob-served experimentally for a laser arc
Wei Supplement April 2015_Layout 1 3/12/15 4:00 PM Page 142

WELDING RESEARCH
APRIL 2015 / WELDING JOURNAL 143-s
separation distance of 1 mm, com-pared to 5-mm separation distancewhen acicular ferrite is the predomi-nant phase. It should be noted the welding condi-tions including the heat input are allidentical when the laser arc separationdistance changes from 1 to 5 mm. Thereason for the large difference of theweld metal microstructures with thechanging laser arc separation distancelies in the fact that the cooling condi-tion, especially the cooling rate between1073 and 773 K, significantly decreaseswhen the laser arc separation distanceincreases from 1 to 5 mm. The coolingrate exceeds the critical cooling rate formartensite transformation with laserarc separation distance of 1 mm while itdecreases to a value lower than the criti-cal cooling rate for martensite transfor-mation when the laser arc separationdistance increases to 5 mm.
Process Map
In order to further understand theinfluence of welding parameters on thecooling rates and corresponding volumefractions of the microstructures of theweld fusion zone, a comprehensiveprocess map is presented in Fig. 13. Themap considers various combinations ofwelding speed, laser arc separation dis-tance, and laser power. The arc currentand arc voltage are 232 A and 31 V, re-spectively, for all the welding condi-tions. The laser powers for Fig. 13A–Care 4, 5, and 6 kW, respectively. Themaps show the combinations of separa-tion distance and welding speed thatproduce a given cooling rate and corre-sponding microstructure in terms ofvolume fractions of different phasesand microconstituents. The criticalcooling rate for martensite transforma-tion is about 71 K/s, which is calculatedby the model for microstructure evolu-tion (Refs. 22–24). Cooling rates below71 K/s are shown in dashed lines as azone without martensite, while coolingrates greater than 71 K/s are shown indotted lines as another zone withmartensite in Fig. 13. The upper boundon the process maps is the partial pene-tration line, above which complete pen-etration is not possible. In general, welding speed has agreater effect on cooling rate than sep-aration distance, and at low weldingspeeds of 20 mm/s, the cooling rate is
almost independent of separation dis-tance. The effect of power can also beobserved in Fig. 13. As power increas-es, the cooling rates shift to higherwelding speeds for a given separationdistance. For example, at 1 mm sepa-ration distance, the required weldingspeeds to obtain a 70 K/s cooling rateare 32 and 39 mm/s for 4 kW and 6kW laser powers, respectively. It is im-portant to know how cooling rates af-fect the microstructure. As the coolingrate increases from 20 to 150 K/s, thevolume fraction of Widmanstätten fer-rite increases from 0.10 to 0.22 at theexpense of the allotriomorphic ferrite,which decreases from 0.31 to 0.23.The amount of acicular ferrite decreas-es from 0.59 to 0.57 from low coolingrates up to the critical cooling ratewhen acicular ferrite disappears andmartensite forms instead. These maps provide a means for un-derstanding microstructure evolutionduring hybrid laser-arc welding and canbe used to select welding parametersthat optimize the weld microstructureor minimize welding time yet limit theformation of martensite. For example,as stated previously, if the power is in-creased from 4 to 6 kW for a constantseparation distance of 1 mm, then thewelding speed can be increased by 22%from 32 to 39 mm/s without the forma-tion of martensite. Increasing the sepa-ration distance from 1 to 7 mm furtherincreases the possible welding speed to42 mm/s. Compared to the initial condi-tions in this example, the total increasein welding speed is 31% due to a 33%increase in laser power and a 6-mm in-crease in separation distance. The weld-ing speed and the resulting time tomake a weld are important. When com-paring the costs of hybrid laser-GMAwelding with conventional arc weldingfor pipe joining applications, Reutzel etal. (Ref. 45) found that weld time com-prised between 24 and 41% of the totalfabrication time, depending on pipe di-ameter, with other tasks, such as fitup,preparation of the weld, and movementof the part, making up the rest of thetime. Additionally, since the welding isoccurring with the same cooling rate,there would be no change in the mi-crostructure. The utility of the processmap indicates significant promise forunderstanding the evolution of mi-crostructures in the fusion zone of hy-brid laser-GMA complete-joint-penetra-
tion welding by a combination of phasetransformation model and the thermalcycles calculated from the heat transferand fluid flow model.
Summary and Conclusions The effect of laser arc separation dis-tance and welding speed on fusion zonegeometry and microstructure duringcomplete-joint-penetration hybridlaser-gas metal arc welding of low-alloysteel was investigated experimentallyand theoretically. A heat transfer andfluid flow model was used to calculatethe weld pool geometry and coolingrates, which were applied to a mi-crostructure model to compute thephase fractions of selected microcon-stituents. Experimental weld geome-tries and microstructures were com-pared to the calculated values, and thetwo sets of data agreed well. The follow-ing conclusions can be drawn from thiswork: 1. The effect of welding speed andlaser arc separation distance on weldpool geometry was investigated in com-plete-joint-penetration hybrid laser-arcwelding. The weld length and widthboth at the top and bottom of the poolincreased with increasing laser arc sepa-ration distance for the same heat input.The weld pool dimensions decreasedwith increasing welding speed as ex-pected. 2. Cooling rate was also affected bythe hybrid welding parameters. Whenthe welding speed increased, whichchanged the net heat input, the coolingrate increased. When the laser arc sepa-ration distance decreased, which alteredthe heat distribution of the combinedpower sources but not the heat input,the cooling rate increased. At high weld-ing speeds, the decrease in separationdistance can have a significant enougheffect on the cooling rate to formmartensite in the microstructure. 3. The experimental weld mi-crostructures consisted of acicular fer-rite, allotriomorphic ferrite, Wid-manstätten ferrite, and martensite.Martensite existed only in the weld withthe laser arc separation distance of 1mm and a welding speed of 40 mm/s.Acicular ferrite formed at the expenseof martensite when the separation dis-tance increased to 5 mm. Increasing thewelding speed from 20 to 30 mm/s re-sulted in a decrease of allotriomorphic
Wei Supplement April 2015_Layout 1 3/12/15 4:00 PM Page 143
WELDING RESEARCH
WELDING JOURNAL / APRIL 2015, VOL. 94144-s
ferrite and an increase in Widmanstät-ten and acicular ferrite. 4. Utilizing the combined models, aprocess map has been constructed thatillustrates the effects of welding speed,separation distance, and laser power oncooling rate and microconstituent vol-ume fractions. Identical cooling ratesand microconstituent volume fractionscan be obtained with various combina-tions of process parameters. In general,welding speed and laser power have amore significant effect on cooling ratesthan separation distance; however, athigh welding speeds, the separation dis-tance can be the deciding factor formartensite formation.
The authors would like to thankMr. Jay Tressler for performing thehybrid welding experiments, Mr. EdGood and Dr. Jay Keist for assistingwith the metallography, and Prof.Lars-Erik Svensson for assisting withthe microstructure identification andquantification. This research was per-formed using funding received fromthe DOE Office of Nuclear Energy’sNuclear Energy University Programsunder Grant Number 120327.
1. Steen, W. M. 1980. Arc augmented laserprocessing of materials. Journal of Applied Physics51(11): 5636–5640. 2. Tusek, J., and Suban, M. 1999. Hybrid weld-ing with arc and laser beam. Science and Technologyof Welding and Joining 4(5): 308–311. 3. Page, C. J., Devermann, T., Biffin, J., andBlundell, N. 2002. Plasma augmented laser weld-ing and its applications. Science and Technology ofWelding and Joining 7(1): 1–10. 4. Chen, Y. B., Lei, Z. L., Li, L. Q., and Wu, L.2006. Experimental study on welding characteris-tics of CO2 laser TIG hybrid welding process. Sci-ence and Technology of Welding and Joining 11(4):403–411. 5. Zhou, J., and Tsai, H. L. 2008. Modeling oftransport phenomena in hybrid laser-MIG key-hole welding. International Journal of Heat andMass Transfer 51(17-18): 4353–4366. 6. Cho, J. H., and Na, S. J. 2009. Three-dimen-sional analysis of molten pool in GMA-laser hy-brid welding. Welding Journal 88(2): 35-s to 43-s. 7. Vollertsen, F., Grunenwald, S., Rethmeier,M., Gumenyuk, A., Reisgen, U., and Olschook, S.2010. Welding thick steel plates with fibre lasersand GMAW. Welding in the World 54(3–4):R62–R70. 8. Le Guen, E., Fabbro, R., Carin, M., Coste, F.,and Le Masson, P. 2011. Analysis of hybrid
Nd:YAG laser-MAG arc welding processes. Opticsand Laser Technology 43(7): 1155–1166. 9. Cao, X., Wanjara, P., Huang, J., Munro, C.,and Nolting, A. 2011. Hybrid fiber laser-arc weld-ing of thick section high strength low alloy steel.Materials and Design 32(6): 3399–3413. 10. Roepke, C., Liu, S., Kelly, S., and Mar-tukanitz, R. 2010. Hybrid laser arc weldingprocess evaluation on DH36 and EH36 steel.Welding Journal 89(7): 140-s to 150-s. 11. Bagger, C., and Olsen, F. O. 2005. Reviewof laser hybrid welding. Journal of Laser Applica-tions 17(1): 2–14. 12. Gao, M., Zeng, X. Y., and Hu, Q. W. 2006.Effects of welding parameter on melting energy ofCO2 laser-GMA hybrid welding. Science and Tech-nology of Welding and Joining 11(5): 517–522. 13. Rao, Z. H., Liao, S. M., and Tsai, H. L.2011. Modeling of hybrid laser-GMA welding: Re-view and challenges. Science and Technology ofWelding and Joining 16(4): 300–305. 14. Callister, W. D., and Rethwisch, D. G. 2009.Materials Science and Engineering. Wiley, U.S.A. 15. Roepke, C., and Liu, S. 2009. Hybrid laserarc welding of HY-80 steel. Welding Journal 88(8):159-s to 167-s. 16. Gao, M., Zeng, X. Y., Hu, Q. W., and Yan, J.2008. Weld microstructure and shape of laser-archybrid welding. Science and Technology of Weldingand Joining 13(2): 106–113. 17. Moore, P. L., Howse, D. S., and Wallach,E.R. 2004. Microstructures and properties oflaser-arc hybrid welds and autogenous laser weldsin pipeline steels. Science and Technology of Weldingand Joining 9(4): 314–322. 18. Swanson, P. T., Page, C. J., Read, E., andWu, H. Z. 2007. Plasma augmented laser weldingof 6 mm steel plate. Science and Technology of Weld-ing and Joining 12(2): 153–160. 19. Chen, Y. B., Feng, J. C., Li, L.Q., Chang, S.,and Ma, G. L. 2013. Microstructure and mechani-cal properties of a thick-section high-strengthsteel welded joint by novel double-sided hybrid fi-bre laser-arc welding. Materials Science and Engi-neering A – Structural Materials Properties Mi-crostructure and Processing 582: 284–293. 20. Gao, M., Zeng, X. Y., Yan, J., and Hu, Q. W.2008. Microstructure characteristics of laser-MIGhybrid welded mild steel. Applied Surface Science254(18): 5715–5721. 21. McPherson, N. A., Suarez-Fernandez, N.,Moon, D. W., Tan, C. P. H., Lee, C. K., and Baker, T.N. 2005. Laser and laser-assisted arc weldingprocess for DH 36 microalloyed steel ship plate.Science and Technology of Welding and Joining 10(4):460–467. 22. Bhadeshia, H. K. D. H. 1982. Thermody-namic analysis of isothermal transformation dia-grams. Metal Science 16(3): 159–165. 23. Bhadeshia, H. K. D. H., Svensson, L. E.,and Gretoft, B. 1985. A model for the develop-ment of microstructure in low-alloy steel (Fe-Mn-Si-C) weld deposits. Acta Metallurgica 33(7):1271–1283. 24. Bhadeshia, H. K. D. H., and Svensson, L. E.1993. Modeling the evolution of microstructure insteel weld metal. Mathematical Modeling of WeldPhenomena. H. Cerjak and K. E. Eastering, eds. In-stitute of Materials, London, pp. 109–180. 25. Mundra, K., and DebRoy, T. 1996. Numer-ical prediction of fluid flow and heat transfer inwelding with a moving heat source. Numerical heattransfer, Part A 29: 115–129. 26. Mundra, K., and DebRoy, T. 1993. Calcula-tion of weld metal composition change in high-
power conduction mode carbon-dioxide laserwelded stainless steels. Metallurgical TransactionsB – Process Metallurgy 24(1): 145–155. 27. Ribic, B., Rai, R., and DebRoy, T. 2008. Nu-merical simulation of heat transfer and fluid flowin GTA/Laser hybrid welding. Science and Technolo-gy of Welding and Joining 13(8): 683–693. 28. International Institute of Welding (IIW),Guide to the light microscope examination of fer-ritic steel weld metals. 1991. Welding in the World29: 160–176. 29. Rai, R., Kelly, S. M., Martukanitz, R. P.,and DebRoy, T. 2008. A convective heat transfermodel for partial and full penetration keyholemode laser welding of a structural steel. Metallur-gical and Materials Transactions A 39A: 98–112. 30. Kaplan, A. 1994. A model of deep penetra-tion laser welding based on calculation of the key-hole profile. Journal of Physics D: Applied Physics27: 1805–1814. 31. Zhao, H., and DebRoy, T. 2003. Macrop-orosity free aluminum alloy weldments throughnumerical simulation of keyhole mode laser weld-ing. Journal of Applied Physics 93: 10089–10097. 32. Wilcox, D. C. 1993. Turbulence Modeling forCFD (California: DCW Industries). 33. Launder, B. E., and Spalding, D. B. 1972.Lectures in Mathematical Models of Turbulence. Lon-don, UK: Academic Press. 34. Zhang, W., Kim, C. H., and DebRoy, T.2004. Heat and fluid flow in complex joints dur-ing gas metal arc welding — Part II: Application tofillet welding of mild steel. Journal of AppliedPhysics 95(9): 5220–5229. 35. Essers, W. G., and Walter, R. 1981. Heattransfer and penetration mechanisms with GMAand plasma-GMA welding. Welding Journal 60(2):37-s to 42-s. 36. Lancaster, J. F. 1984. The Physics of Weld-ing. New York, N.Y.: Pergamon Press. 37. Ribic, B., Burgardt, P., and DebRoy, T.2011. Optical emission spectroscopy of metal va-por dominated laser-arc hybrid welding plasma.Journal of Applied Physics 109(8): 083301. 38. Kumar, S., and Bhaduri, S. C. 1994. Three-dimensional finite element modeling of gas metal-arc welding. Metallurgical and Materials Transac-tions B 25B: 435–441. 39. Yang, Z., and DebRoy, T. 1999. Modelingmacro- and microstructures of gas-metal-arc weld-ed HSLA-100 steel. Metallurgical and MaterialsTransactions B — Process Metallurgy and MaterialsProcessing Science 30(3): 483–493. 40. Kou, S. 2012. Fluid flow and solidificationin welding: Three decades of fundamental re-search at the university of Wisconsin. WeldingJournal 91(11): 287-s to 302-s. 41. Takahashi, M., and Bhadeshia, H. K. D. H.1991. A model for the microstructure of some ad-vanced bainitic steels. Materials Transactions32(8): 689–696. 42. Masubuchi, K. 1980. Analysis of WeldedStructures. New York, N.Y.: Pergamon Press. 43. Ribic, B., Palmer, T. A., and DebRoy, T.2009. Problems and issues in laser-arc hybridwelding. International Materials Reviews 54(4):223–244. 44. Sevim, I. 2006. Effect of hardness to frac-ture toughness for spot welded steel sheets. Mate-rials and Design 27(1): 21–30. 45. Reutzel, E. W., Sullivan, M. J., and Mikesic,D. A. 2006. Joining pipe with the hybrid laser-GMAW process: Weld test results and cost analy-sis. Welding Journal 85(6): 66–71.
References
Acknowledgments
Wei Supplement April 2015_Layout 1 3/12/15 4:00 PM Page 144

Appendix E:
Summary of 690 Ductility Dip Cracking Testing Using Gleeble and Digital Image Correlation

Summary of 690 ductility dip cracking testing using Gleeble and digital image
correlation
Xinghua Yu, Stan David and Zhili Feng
Oak Ridge National Laboratory
Introduction:
A hot ductility test is commonly used to evaluate ductility dip cracking. In conventional hot
ductility tests, the ductility can be only determined from the reduction in cross-sectional area of
the specimen, which is an indirect estimation of high temperature ductility. Extensometer can be
used to measure the total strain of the specimen. However, due to thermal gradient in the
specimen, there is a high temperature and strain gradient on the specimen from the center to the
end. Total strain is not a good indication of real ductility. As a result, there is a need to measure
local total strain before failure to access ductility. High-temperature digital image correlation
(DIC) can be a powerful tool to track in situ development of non-uniform strain and distortion. It
is a promising technique to track localized development of strain as a function of time. Current
research applied hot ductility test with high temperature DIC to study ductility dip cracking of
Alloy 690.
Experimental:
3 690 specimens with 7mm in diameter and 70mm gauge length were machined from a thick-
wall tube provided by electric power research institute. Composition of Alloy 690 is listed in
Table 1. 2 specimens were annealed in furnace in argon atmosphere at 1100°C for 1 hour.
Tensile tests have been performed on both as-machined condition and as- annealed condition
with staining rate of 0.0003/s. Hot ductility tests were conducted in a Gleeble® 3500
thermomechanical simulator. The system setup is shown in Fig. 1. Random patterns were created
by painting white background and black speckles on to the specimen surface. The sample was
heated to 1327°C at 110°C/s and cooled to 871°C at 50°C/s. Load was then applied at a stroke
rate of 7mm/s while the temperature was maintained at 871°C. During testing, an in-situ optical
image correlation method was used to measure displacement on the surface of an object by
tracking random patterns on the samples. Digital cameras (Point Grey GRAS-50S5C-C) linked

with a computer were used for image acquisition. Sigma® lenses (28-300mm f/3.5-6.3 DG) were
used for zooming purpose. Since the thermal radiation from the hot sample at elevated
temperature will lessen image contrast, therefore results in large errors in DIC, current study
adopted monochromatic light illumination and narrow bandpass filter. 3x4 high-brightness green
LED array (Visual Instrumentation model 900405, wavelength 530±5nm) and Edmund® 532nm
hard-coated bandpass filter (Part number 65155) were used. Images were taken at 0.1 second
intervals. Images were post-processed by the Vic-3D® software developed by Correlated
Solutions and the strain maps were obtained. A region of interest (ROI) in the middle of each
sample, which is about 5 mm by 55 mm in area, was selected for strain analysis.
Table 1. Composition of Alloy 690
C S Si Cu Mn Fe Cr Ni
0.018 0.0006 0.03 <0.01 0.19 9.67 29.73 Balanced
Figure 1. System setup for full field strain measurement during hot ductility test
Results:
Tensile tests: Engineering strain stress curves from tensile tests and hot ductility test are shown
in Fig 2. The yield stresses and ultimate tensile stresses have been summarized in Table 2.

Figure. 2 stress-strain curves for Alloy 690 tensile and hot ductility tests.
Table 2 yield stresses and ultimate tensile stresses for tensile and ductility tests.
As‐machined
As‐annealed
Hot ductility
Yield strength (MPa) 280 201 148
Ultimate Tensile Strength (MPa) 646 601 240
DIC results: High temperature DIC with tradition speckle coating technique is capable of
obtaining full field strain map at slow strain rate for temperature lower than 1100°C. However,
exposure of the organic speckle coating required to measure strain was found to degrade and
spall when exposed to high temperatures (871°C) and at a strain rate of 0.1/s. Fig. 3 shows strain
maps in the tensile direction (exx) superimposed with original specimen images at different stages
during hot ductility test. Fig. 2a clearly shows good contrast between black speckles and white
background at 871°C before tension was applied. Speckle coatings were still bonded to the

specimen surface when 0.03 strain is applied. Coatings, however, start to spall when strain
reaches 0.05 and correlation calculation cannot proceed anymore.
Figure 3. exx Strain maps of (a) before loading (b) when 0.03 strain was applied (c) when 0.05
strain is applied
Improving coating technique: The problem was overcome at Oak Ridge National Laboratory
(ORNL) by modifying the surface condition of the samples and applying very thin coating of the
surface speckle patterns. Upon surface treating the paint adheres extremely well on to the
specimen. Fig 4 shows the strain map of an annealed Alloy 600 sample with improved coating
technique before fracture. The measured local strain was as high as 119%. The current surface
treated coating can be used up to 1100°C and can withstand strain rate >0.1/s.

Figure 4. Strain map of an annealed Alloy 600 sample with improved coating showing good
speckles up to 1.2 strain

Appendix F:
Porosity in Thick Alloy 690 Welds – Experiments, Modeling, Mechanism, and Remedy

1
Porosity in Thick Alloy 690 Welds – Experiments, Modeling, Mechanism,
and Remedy
J. J. Blecher1, T. A. Palmer2, and T. DebRoy1 1Department of Materials Science and Engineering, The Pennsylvania State University,
University Park, Pennsylvania, 16802, USA 2Applied Research Laboratory, The Pennsylvania State University, University Park,
Pennsylvania, 16802, USA
Abstract
Laser welding processes present significant opportunities for thick section welding during the
construction and repair of nuclear power plant components. However, the impact of laser-based
welding processes on the fusion zone geometry and defect levels in Alloy 690 are not well
understood. A series of laser and hybrid laser-arc welds are fabricated with varying laser powers
and welding speeds. While the porosity levels attributed to keyhole collapse remain high in the
laser welds for all power levels, the addition of the arc in the hybrid laser-arc welds appears to
inhibit the presence of the porosity at laser powers in excess of 4 kW. At lower powers, the region
where filler metal enters the weld pool at a high speed, is relatively large compared to the overall
pool size and inhibits the motion and escape of bubbles, resulting in large amounts of trapped
porosity. The dimensions of the volumetric heat source, which serves as a proxy for region where
filler metal enters the weld pool, are calculated for various electrode diameters and currents.

2
I. Introduction Joining thick sections of Inconel® Alloy 690, a Ni-Cr-Fe alloy, is critical for construction and
repair of nuclear power plants [1]. The current joining techniques include submerged metal arc
welding (SAW) [2,3] and gas tungsten arc welding (GTAW) [4-6]. These traditional welding
processes are widely available, but they are limited by slow welding speeds, high heat inputs, and
shallow weld penetrations, which require a large number of passes to fabricate thick section
components in excess of 6 mm [4]. On the other hand, laser and hybrid laser-gas metal arc (GMA)
welding processes produce deeper penetrations per pass and reduce the total heat input compared
to arc welding, limiting distortion and heat affected zone size [7]. In addition, these processes can
produce single-pass welds in joints where multipass arc welding would typically be used.
However, the effects of laser and hybrid welding on fusion zone geometry and porosity
characteristics in Alloy 690 must be characterized before their wider deployment in power plant
component fabrication.
Several researchers have investigated the effects of Alloy 690 laser welding on joint geometry
[8-13] and porosity [11-13]. These previous studies have been limited to laser powers of 4 kW or
less in full penetration welds of 3 mm and partial penetration weld depths of 6 mm or less. In
terms of joint geometry, low power laser welds in Alloy 690 have a high depth to width ratio [8-
13] with a relatively narrow width and high depth, which is similar to that observed in the laser
welding of common structural alloys [14,15]. Thick section joining of Alloy 690 will require
higher laser powers and larger penetration depths.
Aside from these attractive weld pool geometries, porosity has been found to be a major
obstacle for implementation of laser welding in the fabrication of Alloy 690 joints [11-13]. In
general, there are three possible types of porosity during welding. One type of porosity results
from high solubility of monatomic and diatomic O, N, and H in molten metal and low solubility
in the solid [16]. During solidification, the solubility decreases, gas evolution occurs, and the
bubbles become trapped as pores. Pore coalescence is another form of porosity in welds [17] and
is found in base metals with high pre-existing levels of porosity, such as die-cast magnesium
alloys. For example, Zhao and DebRoy [17] found an increase in porosity compared to the base
metal during laser welding of die-cast Mg due to the expansion and coalescence of pre-existing
pores during laser welding. The third form of porosity is produced by keyhole instability, where
the bottom tip of the keyhole acts as the source of large bubbles, and is limited to high energy

3
beam welding processes [18]. Keyhole porosity is by far the largest cause of macroporosity in
laser and hybrid laser-arc welding [19-22].
Several researchers have investigated the effects of laser welding on keyhole porosity in Alloy
690. Kuo et al. [11] found Alloy 690 to be more susceptible to keyhole porosity than AISI 304
stainless steel during pulsed laser welding. Tucker et al. [13] found that optimized values of
defocus and welding speed could not fully remove porosity in laser welded Alloy 690. Equilibrium
vapor pressure-temperature relations [23,24], such as those shown in Figure 1, may explain why
Alloy 690 is more prone to keyhole porosity. An ideal solution is assumed for the calculation of
vapor pressure, which is the sum of the product of the alloying element mole fraction and the vapor
pressure for the pure substance (i.e. Fe, Cr, Ni, Ti, Al, and V) at each temperature. Near the boiling
point at 1 atmosphere, the temperature gradient of vapor pressure is higher for Alloy 690 as
compared to other common structural alloys. As a result, small changes in temperature at the
keyhole wall, which will be close to the boiling point, will produce larger changes in pressure,
resulting in more instability and porosity. Power modulation [10], a defocused beam, and
increased welding speeds help to reduce porosity levels in laser welded Alloy 690, but there is no
generally accepted methodology for eliminating keyhole porosity. For specific conditions, trial
and error optimization and design of experiments may be used to remove porosity. However, such
an approach can be time-consuming and overly expensive.
Previous research shows that laser welding has significant difficulty producing defect free
welds in Alloy 690. However, hybrid welding processes may have the potential to overcome the
inability of autogenous laser welding to produce single pass, thick section, low defect content
Alloy 690 joints. This welding method is an especially attractive option for Ni-base alloys because
of its ability to add filler metals and to produce weld metal compositions that can promote desirable
weld metal properties [25]. Over a range of laser powers and welding speeds, the effects of laser
and hybrid laser-gas metal arc welding processes on weld shape and size and porosity formation
have been compared. Characterization of porosity in laser and hybrid welds is undertaken using
X-ray computed tomography (CT). A mechanism for reducing porosity levels at higher powers is
presented. In this physical model, the overall size of the molten pool and the addition of filler
metal are suspected to play a role in the porosity characteristics. Calculations of the interaction
volume dimensions are made to demonstrate the difference in process parameters.

4
II. Experimental Methods
Bead on plate laser and hybrid laser-GMA welds were made on 12.7 mm thick Alloy 690 plate.
For both the laser and hybrid welds examined here, the same combinations of laser welding
conditions were used. A 200 µm diameter transport fiber connected an IPG Photonics® YLR-
12000-L fiber laser to a YW50 Precitec® welding head. Within the head, the optics included a
200 mm and 500 mm focal length collimator and focal lenses, respectively. A PRIMES® Focus
Monitor beam characterization tool measured the beam diameter at focus and the divergence angle
as 0.52 mm and 64 mrad, respectively. The focus position was placed 8 mm below the top plate
surface, so the beam diameter at the top surface was 0.73 mm. Consistent with beam
characterization studies [26], the beam profile near focus was top hat, while one Rayleigh length
(8.1 mm in this case) or more from focus the beam profile had a Gaussian shape. The welding
speed and laser power was varied between 10 and 20 mm/s and 2 and 6 kW, respectively.
For the hybrid welds, a Lincoln Electric® Power Wave 455 M/STT power source with a
Binzel® WH 455D water cooled welding gun were used. The torch angle was maintained at 15˚
from vertical. A gas mixture of Ar-25% He shielded the weld from the atmosphere at a 2.7 m/hr
flow rate. Inconel® Filler Metal (FM) 52 wire with a diameter of 1.1 mm was used as the
consumable electrode and is compositionally identical to Alloy 690, as shown in Table 1. The
wire feed speed was set to 121 mm/s. The laser-arc separation distance was held constant at 3 mm
with the laser leading. The arc voltage was set to 32 V, and the current was estimated as 200 A
based on the instantaneous values displayed on the power source, the wire feed speed, and the
diameter of the filler metal wire. Standard metallographic techniques were used to prepare and
analyze transverse cross section samples of each weld. The samples were electrolytically etched
in a 10 wt.% oxalic acid solution.
A General Electric® v|tome|x X-ray computed tomography (CT) system was used to inspect
and characterize the internal porosity in each weld. An accelerating voltage of 250 kV and current
of 200 µA were used to image the laser welds. Because the hybrid welds were approximately 10
mm wider at the top surface of the weld than the relatively narrow laser welds, the voltage and
current were increased to 285 kV and 230 µA, respectively, during characterization of the hybrid
weld. In order to image the entire weld volume, the resolution in all directions was 50 µm and 66
µm for the laser and hybrid welds, respectively. DatosX® software reconstructed the individual

5
X-ray images into a 3D representation. Volume Graphics® VGStudio Max software with the
defect detection module measured the sizes and locations of individual pores within the welds.
III. Results and Discussion
The fusion zone geometry is an important characteristic for comparing laser and hybrid welds.
For example, the depth of the weld is related to the maximum weldable plate thickness in a single
pass, and the width is related to the plate gap bridgeability with higher weld widths allowing for
higher tolerances during plate fit-up before welding. Generally, hybrid welds have a greater width
than laser welds, while the depths are similar. Transverse weld profiles obtained from a series of
laser and hybrid welds produced here are shown in Figure 2. The linear heat input during laser
welding was varied between 100 W/mm and 600 W/mm. On the other hand, the heat input during
hybrid laser-arc welding was higher with the addition of the arc and ranged between 400 W/mm
and 1200 W/mm.
The measured weld pool widths and depths are shown in Table 2. For the laser welds, the
widths and depths increase steadily with laser power with maximum widths and depths of 5.9 and
7.6 mm, respectively, at a laser power of 6 kW and a welding speed of 10 mm/s. Hybrid weld
depth increases with power up to 9.1 mm, but the width does not increase significantly and ranges
from 11.2 to 15.2 mm across the power range from 2 kW to 6 kW. The hybrid weld widths are
significantly greater than the laser weld widths due to the addition of the arc, which acts as a broad
heat source. The difference in width is 5 mm or more in most cases, but the weld pool depths did
not differ significantly between the two processes, although the hybrid welds were about 1 to 2
mm deeper than the laser welds under similar conditions.
Due to the addition of the arc and the increased heat input, the hybrid welds also display a
much larger cross-sectional area compared to the laser welds. At laser powers of 2 kW, the
influence of the arc on the hybrid weld pool shape is evident [27] and dominates the characteristics
of the weld pool. For example, the characteristic shape of a GMA weld is obvious at a welding
speed of 20 mm/s, while at the very bottom of the weld, the finger penetration of the laser can be
observed. Since the arc parameters are 31 V and about 200 A, the arc power is on the order of 6
kW compared to the 2 kW of the laser. At higher laser powers of 4 and 6 kW, the influence of the
arc on the weld pool shape is diminished due to the parity in power of the arc and laser with only
the increased width of the arc being evident.

6
Large pores in the solidified weld metal are formed when bubbles from the bottom of the
keyhole become trapped by the advancing solid liquid interface [18]. Using AISI 304 stainless
steel as the base metal, Naito et al. [28] found that keyhole induced porosity is reduced but not
entirely eliminated in hybrid laser-GTA welding compared to laser welding. The same is true here
in the laser and hybrid welds produced as part of this study. A comparison of porosity in laser and
hybrid welds (6 kW, 10 mm/s) measured with X-ray CT is shown in Figure 3. X-ray CT provides
a high degree of spatial resolution for the precise location and size of pores. The solid metal
regions are light colored, while the pores are shown in a darker color. For the laser weld shown in
Figure 3, the level of porosity is much greater, with 103 pores identified in the X-ray CT scan with
a median pore volume of 0.14 mm3. The 17 pores in the hybrid weld have a smaller median
volume of 0.02 mm3. Figure 3 shows the superiority of the hybrid welding process in terms of
overall porosity compared to the laser welding process. Outside of the start of the weld, which
may be on a ‘run-off plate’ in a welding shop, and the weld reinforcement, which can removed in
a production environment, there is only one pore in the entire hybrid weld.
Total porosity volume and pore size distributions are important for understanding how and
why the porosity characteristics differ in laser and hybrid welds. The total pore volume for a
constant weld length (70 mm in this case) shows significance of the overall porosity, while size
distributions show how the pore sizes change with welding process and conditions. These porosity
characteristics among laser and hybrid welds for a variety of conditions are shown in Figure 4.
Clearly, the two highest heat input hybrid welds (i.e. 4 and 6 kW and 10 mm/s) have the lowest
porosity values. The 4 kW weld has only 3 pores with two of those being in the weld
reinforcement. These same high heat input welding conditions, which would be used for thick
section welding of Alloy 690, produce the lowest levels of porosity. The laser welds with the same
laser power and welding speed conditions show much higher overall porosity levels, which are up
to 90.5 mm3 in 1600 mm3 of weld metal. These porosity levels are many times higher than the
hybrid welds, which can have porosity values as low as 0.2 mm3 in 3000 mm3 of weld metal.
In the 4 and 6 kW cases, porosity decreased when transitioning from laser to hybrid welding.
The 2 kW, 10 mm/s hybrid weld does not show the same low porosity as the 4 and 6 kW hybrid
welds and, in fact, has a higher porosity than the laser weld made with the same conditions. The
same is true in the welds made at a welding speed of 20 mm/s. This difference in behavior may
be traced to a combination of filler metal addition and small weld pool volume during the 2 kW
7
welds. The filler metal is entering the molten pool at a relatively high rate of speed, on the order
of 1.5 m/s or faster [29]. Bubbles that form near the bottom of the keyhole need to move towards
the top of the weld pool to escape. This mobility towards the top is likely hindered by the filler
metal entering the pool at a high velocity. In addition, the pool volume is relatively small
compared to the higher laser power welds, further limiting the bubble mobility towards the top of
the pool.
The size of the filler metal-weld pool interaction zone can be estimated, using a cylindrical
volumetric heat source (VHS) model [29,30]. The model assumes that liquid droplets are
accelerated from the end of the consumable electrode, strike the molten pool, and transfer heat and
momentum to the weld. The height, depth, and energy intensity of the VHS can be calculated
based on the material properties and welding parameters. A detailed description of the VHS model
is available in the literature [30-32], and the equations necessary for the calculations performed
here are available in Appendix A. Knowledge of the relationship between the arc current and
droplet detachment frequency is an important component of the calculations. Especially important
is the transition current from globular to spray transfer. However, most studies of droplet
detachment have focused on mild steel electrodes with little attention paid to other filler metals,
such as FM 52. The welding recommendations for spray transfer mode from the FM 52
manufacturer have been used to estimate the transition currents [33]. The transition current for
mild steel is around 290 A, so a current of 300 A or greater will lead to spray transfer mode. The
recommended parameters for FM 52 suggest the transition current varies between 150 A and 225
A, depending on the electrode diameter.
Using the experimental welding parameters and material properties, the VHS height and width
can be computed. The height and width are calculated as 3.7 and 2.1 mm, respectively. The VHS
profile has been overlaid on the transverse cross-sections of the 10 mm/s welding speed hybrid
welds in Figure 5. As the power increases, the gap between the bottom of the VHS and the bottom
of the weld increases from 1 mm to more than 5 mm. The impinging droplet velocity, which is
expected to interrupt pore motion through high fluid velocity turbulence, has a value of 1.6 m/s.
The maximum calculated fluid flow velocity in a recent study of hybrid welding of steel was less
than 0.3 m/s [34], so the high velocity of the impinging droplets would have significant impact on
fluid flow in the weld pool and would interrupt the pore motion upwards and out of the pool.

8
The evidence for this low mobility model can be extracted from Figure 4, which shows a shift
to higher pore sizes when going from laser to hybrid welding. This behavior is only seen in the 2
kW welds and suggests that bubbles stay trapped at the bottom of the weld and combine to form
larger bubbles before the solidification front traps them as pores. In addition, the bubbles in the
hybrid welds should be trapped in the bottom part of the weld and not show a great deal of variation
in location distributions if the combination of the filler metal addition and small pool volume are
limiting mobility. Figure 6 shows the pore location distributions as a percentage of the total depth
in the 2 kW, 10 mm/s laser and hybrid welds along with part of the X-ray CT image. In both
welds, more pores are located near the bottom of the weld pool. In the laser weld, the top third of
the weld contains 16% of the total number of the pores, but in the hybrid weld, zero pores are
found in the same third of the weld.
Since the likelihood of low porosity in the hybrid welds can be related to the distance between
the bottom of the VHS and the bottom of the weld, the effects of available welding parameters,
such as arc currents, and FM 52 electrode diameters should be compared to determine if certain
conditions provide benefits compared to other conditions. Figure 7 shows the effect of arc current
(wire feed speed was increased linearly with current for calculation purposes) on VHS height for
different filler metal electrode diameters. The solid lines indicate the hybrid weld depths for given
linear heat inputs on the right y-axis, so the bottom line represents the 2 kW hybrid weld, which
had large amount of porosity. The middle and top line represent the low porosity 4 kW and 6 kW
hybrid welds, respectively. The weld depth-heat input relationship from the experimental welds
is shown in Figure 7b.
There is a linear increase of VHS height with current with each electrode diameter falling along
the same line. According to the graph, the minimum heat input from the laser for low porosity
increases with both arc current and electrode diameter. The minimum heat input for the 1.1 mm
diameter filler metal was found experimentaly to be 400 J/mm. For the 0.9 and 1.6 mm diameter
electrodes, the minimum heat inputs are 240 and 490 J/mm, respectively. For a 10 mm/s welding
speed, reasonable laser powers of 5 kW can be used to fabricate low porosity welds up to 7.5 mm
in depth with any FM 52 electrode diameter. However, if greater productivity is desired in terms
of welding speed or penetration depth, much higher powers will be required. For example, an
increase of the welding speed to 20 mm/s would require 10 kW laser power to make pore free
9
welds with 1.6 mm diameter electrodes. Lasers systems with 10 kW of output power are most
likely less available and more expensive than systems that can output 5 kW power.
IV. Summary and Conclusions
The characteristics of laser and hybrid laser-gas metal arc welded Alloy 690 with a
compositionally identical filler metal have been analyzed for several processing conditions. The
transverse fusion zone geometries and porosity resulting from keyhole collapse have been
compared and found to have significant differences, which affect the choice of welding process.
The following conclusions were drawn from this work.
1. Due to the arc, which acts as a distributed heat source, the fusion zones in the laser and hybrid
welds differ significantly. At the top of the plate, hybrid welds are wider by 8 to 10 mm for
similar laser powers and welding speeds. Laser welds are also shallower by 1 to 2 mm
compared to hybrid welds fabricated with an identical welding speed and laser power.
2. Total porosity amounts were reduced to the lowest levels in the hybrid welds at powers of 4
kW and 6 kW and a welding speed of 10 mm/s. A minimum porosity total of 0.2 mm3 in a
total weld volume of 3000 mm3 was found in a hybrid weld with 4 kW laser power and 10
mm/s welding speed. In contrast a laser weld made at a power of 6 kW and a travel speed of
10 mm/s displayed a porosity volume of 90.5 mm3 in 1600 mm3 of weld metal.
3. A transition from high levels of porosity to virtually no porosity was observed in the hybrid
welds as power increased above 2 kW. Filler metal transfer and low weld pool volume at 2
kW laser power is expected to limit bubble mobility upwards out of the pool. As the power
increases, the size of the filler metal interaction relative to the weld pool decreases, allowing
the bubbles to more easily escape. Evidence of this mechanism was a shift in the pore size
distribution to larger pores when going from hybrid to laser welding and more pores located
at the bottom of the pool in hybrid welding compared to laser welding.
4. Calculations, which account for the current-volumetric heat source dimensions relation, laser
heat input-weld depth relation, and filler metal 52 electrode dimensions, were used to
determine the minimum laser heat input to produce a pore-free hybrid weld for a given
electrode diameter. The minimum heat input varied between 240 and 490 J/mm with greater
heat inputs required for larger electrode diameters. With welding speeds of 10 mm/s or less,
no more than 5 kW laser power would be required to produce pore free welds with every

10
electrode diameter. Increasing welding speed or current to improve productivity or filler
metal deposition would require higher laser powers.
Based on the results of this study, hybrid welding is recommended for welding thick sections of
Alloy 690, especially at laser powers above 2 kW. The large amounts of porosity in the laser welds
are mostly eliminated when the arc is added to the process. With optimized process parameters,
this minimal porosity could be eliminated completely.
Acknowledgments
The authors would like to thank Mr. Jay Tressler for performing the welding experiments and
Mr. Ed Good for preparing the metallographic and X-ray specimens. This research was performed
using funding received from the DOE Office of Nuclear Energy’s Nuclear Energy University
Programs under Grant Number 120327.
References
[1] T. Allen, J. Busby, M. Meyer, and D. Petti, “Material challenges for nuclear systems”, Mater.
Today, 13, 14-23 (2010).
[2] H.T. Lee and T.Y. Kou, “Effects of niobium on microstructure, mechanical properties, and
corrosion behavior in weldments of alloy 690”, Sci. Technol. Weld. Joining, 4, 246-256 (1999).
[3] S.-L. Jeng, H.-T. Lee, J.-Y. Huang, and R.-C. Kou, “Effects of Nb on the microstructure and
elevated-temperature mechanical properties of Alloy 690-SUS 304L dissimilar welds”, Mater.
Trans., 49, 1270-1277 (2008).
[4] H.T. Lee and T.Y. Kou, “Analysis of microstructure and mechanical properties in alloy 690
weldments using filler metals I-82 and I-52”, Sci. Technol. Weld. Joining, 4, 94-103 (1999).
[5] H.T. Lee and S.L. Jeng, “Characteristics of dissimilar welding of alloy 690 to 304L stainless
steel”, Sci. Technol. Weld. Joining, 4, 225-234 (2001).
[6] S.L. Jeng, H.T. Lee, T.E. Weirich, and W.P. Rebach, “Microstructural study of the dissimilar
joints of alloy 690 and SUS 304L stainless steel”, Mater. Trans., 48, 481-489 (2007).
[7] B. Ribic, T.A. Palmer, and T. DebRoy, “Problems and issues in laser-arc hybrid welding”, Int.
Mater. Rev., 54, 223-244 (2009).
[8] J.J. Blecher, C.M. Galbraith, C. Van Vlack, T.A. Palmer, J.M. Fraser, P.J.L. Webster, and T.
DebRoy, “Real time monitoring of laser beam welding keyhole depth by laser interferometry”,
Sci. Technol. Weld. Joining, 19, 560-564 (2014).

11
[9] H.T. Lee, C.T. Chen, and J.L. Wu, “3D numerical study of effects of temperature field on
sensitization of Alloy 690 butt welds fabricated by gas tungsten arc welding and laser beam
welding”, Sci. Technol. Weld. Joining, 15, 605-612 (2010).
[10] J.J. Blecher, T.A. Palmer, and T. DebRoy, “Solidification map of a nickel-base alloy”, Metall.
Mater. Trans. A, 45A, 2143-2151 (2014).
[11] T.-Y. Kuo, “Effect of pulsed and continuous Nd-YAG laser beam waves on welding of
Inconel alloy”, Sci. Technol. Weld. Joining, 10, 557-565, (2005).
[12] T.-Y. Kuo and Y.-D. Lin, “Effects of different shielding gases and power waveforms on
penetration characteristics and porosity formation in laser welding of Inconel 690 alloy”, Mater.
Trans., 48, 219-226 (2007).
[13] J.D. Tucker, T.K. Nolan, A.J. Martin, and G.A. Young, “Effect of travel speed and beam
focus on porosity in alloy 690 laser welds”, JOM, 64, 1409-1417 (2012).
[14] W.J. Suder and S. Williams, “Power factor model for selection of welding parameters in CW
laser welding”, Opt. Laser Technol., 56, 223-229 (2014).
[15] L. Quintino, A. Costa, R. Miranda, D. Yapp, V. Kumar, and C.J. Kong, “Welding with high
power fiber lasers – a preliminary study”, Mater. Des., 28, 1231-237 (2007).
[16] S. Kou, “Welding Metallurgy”, John Wiley & Sons, Inc., Hoboken, NJ (2003).
[17] H. Zhao and T. DebRoy, “Pore formation during laser beam welding of die-cast magnesium
alloy AM60B – mechanism and remedy”, Weld. J., 80, 204s-210s (2001).
[18] A. Matsunawa, J.D. Kim, N. Seto, M. Mizutani, and S. Katayama, “Dynamics of keyhole and
molten pool in laser welding”, J. Laser Appl., 10, 247-254 (1998).
[19] S. Katayama, Y. Kobayashi, M. Mizutani, and A. Matsunawa, “Effect of vacuum on
penetration and defects in laser welding”, J. Laser Appl., 13, 187-192 (2001).
[20] Y. Kawahito, M. Mizutani, and S. Katayama, “Elucidation of high-power fibre laser welding
phenomena of stainless steel and effect of factors on weld geometry”, J. Phys. D: Appl. Phys., 40,
5854-5859 (2007).
[21] M. Pastor, H. Zhao, R.P. Martukanitz, and T. DebRoy, “Porosity, underfill and magnesium
loss during continuous wave Nd:YAG laser welding of thin plates of aluminum alloys 5182 and
5754”, Weld. J., 78, 207s-216s (1999)
[22] H. Zhao and T. DebRoy, “Macroporosity free aluminum alloy weldments through numerical
simulation of keyhole mode laser welding”, J. Appl. Phys., 93, 10089-10096 (2003).

12
[23] W. F. Gale, 2004. Smithells metals reference book, 8th Edn. Burlington, MA, Elsevier
Butterworth-Heinemann.
[24] C.L. Yaws, “The Yaws handbook of vapor pressure: Antoine coefficients”, Houston, TX,
Gulf Publishing Company, 2007.
[25] N.E. Nissley and J.C. Lippold, “Ductility-dip cracking susceptibility of nickel-based weld
metals part 1: strain-to-fracture testing”, Weld. J., 87, 257s-264s (2008).
[26] J.J. Blecher, T.A. Palmer, S.M. Kelly, and R.P. Martukanitz, “Identifying performance
differences in transmissive and reflective laser optics using beam diagnostic tools”, Weld. J., 91,
204s-214s (2012).
[27] Z. Yang and T. DebRoy, “Modeling macro-and microstructures of gas-metal-arc welded
HSLA-100 steel”, Metall. Mater. Trans. B, 30, 483-493 (1999).
[28] Y. Naito, S. Katayama, and A. Matsunawa, “Keyhole behavior and liquid flow in molten pool
during laser-arc hybrid welding”, Proc. SPIE, 4831, 357-362 (2003).
[29] L.A. Jones, T.W. Eagar and J.H. Lang, “A dynamic model of drop detaching from a gas metal
arc welding electrode”, J.Phys.D:Appl.Phys., 31, 107–123 (1998).
[30] C.-H. Kim, W. Zhang and T. DebRoy, “Modeling of temperature field and solidified surface
profile during gas metal arc fillet welding”, J.Phys.D:Appl.Phys.,94, 2667-2679 (2003).
[31] J.F. Lancaster, “The physics of welding”, 2nd Edition, Oxford, Pergamon, 1986.
[32] S. Kumar and S.C. Bhaduri, “Three-dimensional finite element modeling of gas metal-arc
welding”, Metall. Mater. Trans. B, 25B, 435-441 (1994).
[33] Special Metals Corporation, “Joining”, accessed 30 April 2015, pg. 9,
<www.specialmetalswelding.com>.
[34] H.L. Wei, J.J. Blecher, T.A. Palmer, and T. DebRoy, “Fusion Zone Microstructure in Full
Penetration Laser-Arc Hybrid Welding of Low Alloy Steel”, Weld. J., 94, 135s-144s (2015).
[35] S. Rhee and E. Kannatey-Asibu Jr.,”Observation of metal transfer during gas metal arc
welding”, Weld. J., 71, 381s-386s (1992).
Appendix A Calculation of Volumetric Heat Source Dimensions
The volumetric heat source (VHS) calculation assumes a cylindrical shape with dimensions of
diameter and height. The VHS is commonly used to model consumable electrode heat transfer
during gas-metal arc welding [30,32]. In these experiments, spray metal transfer, where small

13
droplets form at the end of the electrode and accelerate into the molten pool, is expected. Several
variables are required for the calculation, including material properties, welding parameters, and
droplet frequency.
The height of the VHS is given as
where hv is height of the cavity formed by the impinging droplets, xv is the distance traveled in the
cavity by each droplet before the arrival of the next impinging droplet, and Dd is the droplet
diameter. The cavity height is
2 26
where γ is surface tension of the liquid metal, ρ is the liquid metal density, g is acceleration due to
gravity, and vd is the droplet impingement velocity. The surface tension and density of FM 52
were taken as 1.1 N/m and 6500 kg/m3, respectively. The distance traveled by each droplet is
defined as
21
/
∆
where Δt is the time interval between the impingement of two droplets and can be defined as Δt =
1/f. The frequency of droplets, f, is
243.44
1 6.06437
323.506 0.874 0.0025
where I (A) is current and It is the transition current from globular to spray transfer. The transition
current for FM 52 has been estimated based on the suggested process parameters by the electrode
manufacturer [33]. The frequency current relations are shown in Figure A1 for three FM 52
electrode diameters and, for reference [29,35], a fitted line to experimental data for mild steel. The
droplet shape is assumed to be spherical, and the radius of the sphere is expressed as
34
/
where rw is the radius of the filler metal wire and wf is the wire feed speed. The VHS diameter is
four times the droplet radius. The droplet velocity is
14
2
where v0 is the initial velocity, a is the droplet acceleration, and La is the arc length. Arc length
was assumed to be 3 mm. Acceleration is taken as
38
where vg is the velocity of the plasma, ρg is the density of the plasma, and Cd is the drag coefficient.
The plasma density was taken as 0.06 kg/m3. The velocity of the plasma is estimated with the
effective velocity (in m/s), which is
where k1 is a constant coefficient of ¼. The drag coefficient is
242.74 59.67 0.44793
where Re is the Reynolds number, which is defined as
The variable νk is kinetic viscosity and is 3.4 x 10⁻³ m2/s. The initial velocity is calculated as
0.33692 0.00854 ⁄

15
Table 1: Composition of the Alloy 690 base metal and filler metal 52.
Ni Cr Fe Mn Si Ti Al Cu C Alloy 690 59.80 29.63 9.65 0.28 0.36 0 0 0.25 0.03
FM 52 60.88 29.22 8.65 0.24 0.14 0.38 0.4 0.01 0.02 Table 2: Summary of weld widths and depths as a function of laser power, welding speed, and welding technique.
Width (mm) Depth (mm) Power (kW) Speed (mm/s) Laser Hybrid Laser Hybrid
2 10 3.7 13.6 3.5 4.7 4 10 4.5 15.1 5.7 7.0 6 10 5.9 15.2 7.6 9.1 2 20 2.7 12.4 2.7 3.5 4 20 3.6 11.2 4.7 5.8 6 20 4.4 11.6 6.2 7.6

16
Figure 1: The vapor pressure-temperature relations may explain why increased porosity is observed in Alloy 690 welds compared to other common engineering alloys.
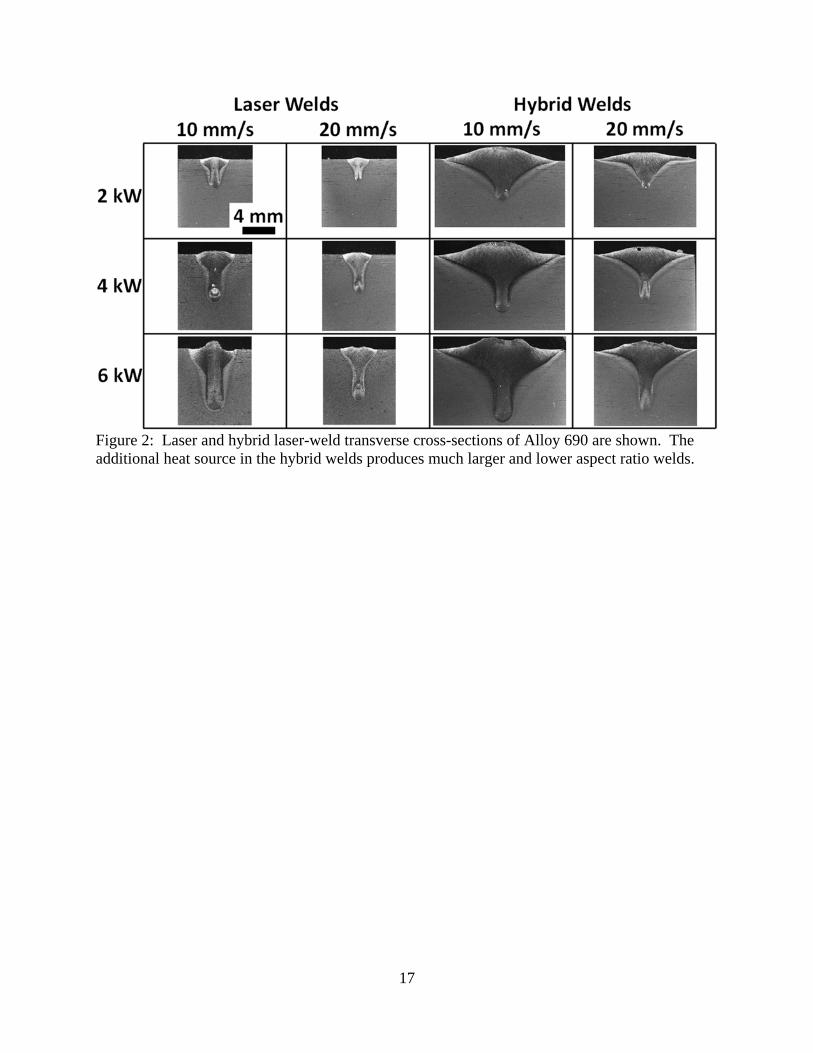
17
Figure 2: Laser and hybrid laser-weld transverse cross-sections of Alloy 690 are shown. The additional heat source in the hybrid welds produces much larger and lower aspect ratio welds.
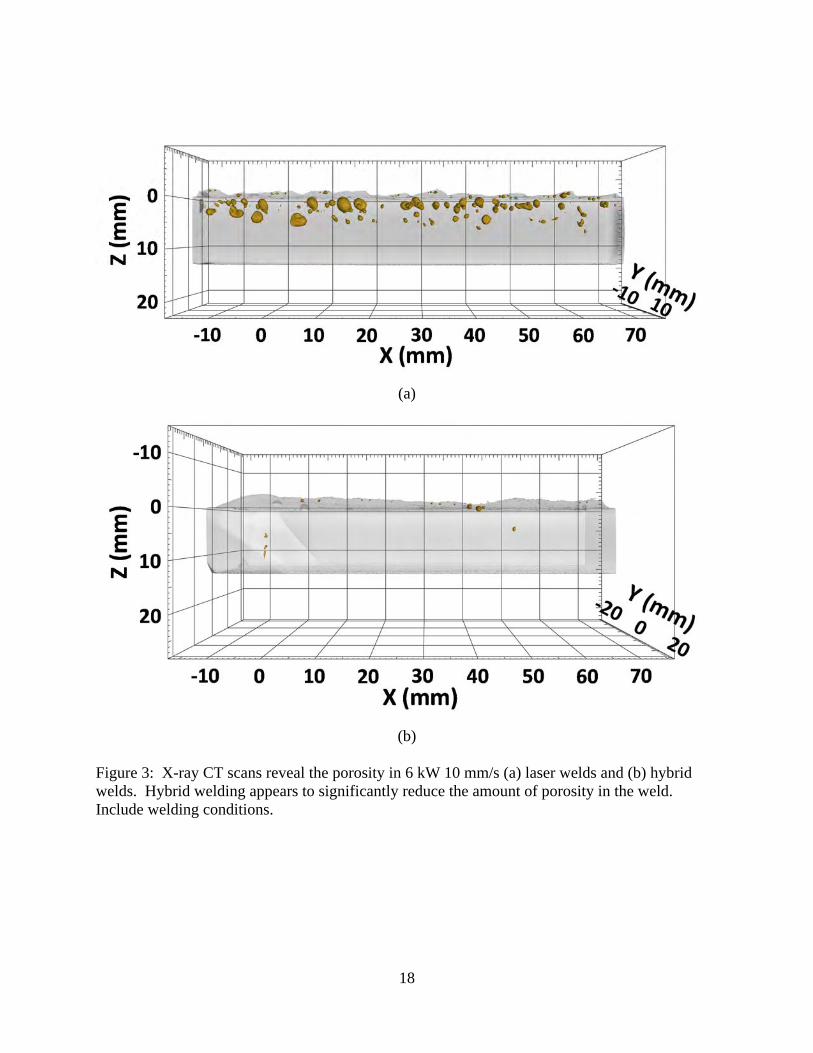
18
(a)
(b)
Figure 3: X-ray CT scans reveal the porosity in 6 kW 10 mm/s (a) laser welds and (b) hybrid welds. Hybrid welding appears to significantly reduce the amount of porosity in the weld. Include welding conditions.

19
Figure 4: The porosity size distributions for (a and c) laser welds and (b and d) hybrid welds and the total porosity volumes in parentheses are shown. The number of pores for almost all sizes decrease when going from laser to hybrid welding at laser powers of 4 and 6 kW.

20
Figure 5: The calculated cylindrical volumetric heat source outline is overlaid on the 10 mm/s hybrid welds. The gap between the bottom of the heat source and weld bottom becomes increasing larger with laser power. The larger gap combined with a larger of weld volume behind the gap led to more pores escaping in the 4 and 6 kW welds.

21
Figure 6: The pore location distributions in laser and hybrid welds for 2 kW of laser power and 10 mm/s welding speed are shown.

22
(a)
(b)
Figure 7: The volumetric heat source height for different arc currents and electrode diameters are
shown in (a). The laser heat inputs to provide different porosity values is also shown in (a). The
relation between weld depth and laser heat input used in (a) is shown in (b).

23
Figure A1: The current-droplet detachment frequencies for filler metal 52 are not experimentally
known. Based on suggested currents, voltages, shielding gases, and wire feed speeds for different
electrode diameters from the manufactures, the relations have been estimated. The fit line for
experimental data [29,35] for steel in Ar-5%CO2 shielding gas is shown for reference.