Larval transport pathways from Cuban snapper (Lutjanidae) spawning
14
MARINE ECOLOGY PROGRESS SERIES Mar Ecol Prog Ser Vol. 296: 93–106, 2005 Published July 12 INTRODUCTION A broad range of marine organisms concentrate the release of eggs and larvae by forming spawning aggregations during limited periods of time (e.g. lob- ster, octopus, horseshoe crab). Several snapper (Perci- formes: Lutjanidae) species have adopted this particu- lar spawning strategy (Carter & Perrine 1994, Domeier & Colin 1997, Domeier et al. 1997, Lindeman et al. 2000, Heyman et al. 2001). Historically, large groups of snappers have converged to spawn at specific sites on the insular shelf of Cuba (Claro & Lindeman 2003). Knowledge of these concentrated spatial and temporal patterns provides an excellent template to examine patterns of egg and larval transport. The snapper fam- ily includes several of the Caribbean’s most economi- cally important reef fishes. With 18 species utilizing a wide array of habitats, snappers are also ecologically important as predators and agents of trophic exchange among differing communities (Parrish 1989). Snappers are the principal finfish fishery in Cuba, with the lane snapper Lutjanus synagris being the © Inter-Research 2005 · www.int-res.com *Email: [email protected] Larval transport pathways from Cuban snapper (Lutjanidae) spawning aggregations based on biophysical modeling Claire B. Paris 1, *, Robert K. Cowen 1 , Rodolfo Claro 2 , Kenyon C. Lindeman 3 1 Rosenstiel School of Marine and Atmospheric Science, University of Miami, Miami, Florida 33149-1098, USA 2 Instituto de Oceanología, Centro de Innovacíon Tecnológica del Medio Ambiente, Ave. 1ra No. 18406, Playa, La Habana, Cuba 3 Environmental Defense, 485 Glenwood Ave., Satellite Beach, Florida 32937, USA ABSTRACT: The potential linkages among Cuba and geographically associated northwestern Caribbean locations were examined through simulated transport of snapper larvae for 5 harvested snapper species. The analyses are based on a coupled biophysical model incorporating realistic, intra-annual varying currents from a single year (1984), a Lagrangian stochastic scheme, and larval behaviors to find settlement habitat. Sequential runs centered on peak spawning months and lunar phases estimated the degree to which each spawning event contributes larvae to distant populations or to neighboring populations on the complex Cuban shelf. Results suggest that considerable levels of self-recruitment (ca. 37 to 80% total recruitment) structure Cuban snapper populations, in partic- ular, those from the southern and north-central regions. The northern snapper populations exported larvae to the southern Bahamas, specifically to Cay Sal Bank (ca. 11 to 28% total recruitment), while, for more distant locations, the import of larvae from Cuba was negligible depending on the species. Regional oceanographic regimes for cubera, dog and gray snappers and site utilization (e.g. shelf geomorphology) for mutton snapper caused most within-species recruitment variability. However, a small lag in peak spawning times contributed significantly to high recruitment variability among species. Active virtual larvae stand a better chance of reaching settlement habitat, whereas spatial distribution of recruitment is similar but less structured (i.e. homogeneous low abundance) for passive larvae. This modeling approach produces spatio-temporal predictions of larval pathways with explicit measures of variance. Further, it allows for the quantification of relative levels of connectivity, a component needed in the design of marine reserve networks. KEY WORDS: Spawning aggregations · Larval transport · Recruitment · Biophysical modeling · Connectivity · Marine reserve network · Lutjanidae · Cuba Resale or republication not permitted without written consent of the publisher
Transcript of Larval transport pathways from Cuban snapper (Lutjanidae) spawning
MARINE ECOLOGY PROGRESS SERIESMar Ecol Prog Ser
Vol. 296: 93–106, 2005 Published July 12
INTRODUCTION
A broad range of marine organisms concentrate therelease of eggs and larvae by forming spawningaggregations during limited periods of time (e.g. lob-ster, octopus, horseshoe crab). Several snapper (Perci-formes: Lutjanidae) species have adopted this particu-lar spawning strategy (Carter & Perrine 1994, Domeier& Colin 1997, Domeier et al. 1997, Lindeman et al.2000, Heyman et al. 2001). Historically, large groups ofsnappers have converged to spawn at specific sites on
the insular shelf of Cuba (Claro & Lindeman 2003).Knowledge of these concentrated spatial and temporalpatterns provides an excellent template to examinepatterns of egg and larval transport. The snapper fam-ily includes several of the Caribbean’s most economi-cally important reef fishes. With 18 species utilizing awide array of habitats, snappers are also ecologicallyimportant as predators and agents of trophic exchangeamong differing communities (Parrish 1989).
Snappers are the principal finfish fishery in Cuba,with the lane snapper Lutjanus synagris being the
© Inter-Research 2005 · www.int-res.com*Email: [email protected]
Larval transport pathways from Cuban snapper(Lutjanidae) spawning aggregations based on
biophysical modeling
Claire B. Paris1,*, Robert K. Cowen1, Rodolfo Claro2, Kenyon C. Lindeman3
1Rosenstiel School of Marine and Atmospheric Science, University of Miami, Miami, Florida 33149-1098, USA2Instituto de Oceanología, Centro de Innovacíon Tecnológica del Medio Ambiente, Ave. 1ra No. 18406, Playa, La Habana, Cuba
3Environmental Defense, 485 Glenwood Ave., Satellite Beach, Florida 32937, USA
ABSTRACT: The potential linkages among Cuba and geographically associated northwesternCaribbean locations were examined through simulated transport of snapper larvae for 5 harvestedsnapper species. The analyses are based on a coupled biophysical model incorporating realistic,intra-annual varying currents from a single year (1984), a Lagrangian stochastic scheme, and larvalbehaviors to find settlement habitat. Sequential runs centered on peak spawning months and lunarphases estimated the degree to which each spawning event contributes larvae to distant populationsor to neighboring populations on the complex Cuban shelf. Results suggest that considerable levelsof self-recruitment (ca. 37 to 80% total recruitment) structure Cuban snapper populations, in partic-ular, those from the southern and north-central regions. The northern snapper populations exportedlarvae to the southern Bahamas, specifically to Cay Sal Bank (ca. 11 to 28% total recruitment), while,for more distant locations, the import of larvae from Cuba was negligible depending on the species.Regional oceanographic regimes for cubera, dog and gray snappers and site utilization (e.g. shelfgeomorphology) for mutton snapper caused most within-species recruitment variability. However, asmall lag in peak spawning times contributed significantly to high recruitment variability amongspecies. Active virtual larvae stand a better chance of reaching settlement habitat, whereas spatialdistribution of recruitment is similar but less structured (i.e. homogeneous low abundance) forpassive larvae. This modeling approach produces spatio-temporal predictions of larval pathwayswith explicit measures of variance. Further, it allows for the quantification of relative levels ofconnectivity, a component needed in the design of marine reserve networks.
KEY WORDS: Spawning aggregations · Larval transport · Recruitment · Biophysical modeling ·Connectivity · Marine reserve network · Lutjanidae · Cuba
Resale or republication not permitted without written consent of the publisher

Mar Ecol Prog Ser 296: 93–106, 2005
primary fishing target and having the highest landingsin the Golfo de Batabanó in the southwest of Cuba(Claro et al. 2001a). Mutton snapper L. analis catchesrank second, with the largest catches on the northeast-ern coast. Both of these areas may have key spawningaggregation sites for these respective species. Largedecreases in catches from as early as 1975 have beenreported and may be attributed to overfishing ofspawning aggregations (Claro & Lindeman 2003).
Reproduction in snappers can vary intra-specificallyacross differing spatial and temporal scales (Grimes1987, García-Cagide et al. 2001). In Cuba, snapperspawning aggregations typically occur at the shelfedge and promontories, but there can be some vari-ability in within-site spawning locations and timingdepending on the species and area of the island (Claro& Lindeman 2003). Single or multiple sites may beused by several species simultaneously or on differingseasonal spawning schedules. Spawning by individualspecies occurs during a narrow window in time (usu-ally 1 to 3 mo) associated with lunar phases that canvary among species. Considerable information onthe larval biology of snappers has also accumulated(Laroche 1977, Borrero et al. 1978, Rabalais et al. 1980,Leis 1987, Potthoff et al. 1988, Clarke et al. 1997, Rileyet al. 1995, Drass et al. 2000, Pauly et al. 2000, Linde-man et al. in press). Planktonic larval durations (PLDs)in snappers range from approximately 20 to 35 d(Lindeman et al. 2000). However, the mean PLD (e.g.ca. 30 d) does not appear to differ widely among thespecies targeted in this study.
A fundamental attribute of informed managementof over-exploited reef fishes is the understanding ofpopulation connectivity (Warner & Cowen 2002). Suchinformation is also significant to the design of marineprotected areas (Palumbi 2003). Snappers may requireparticular protection, since they are highly vulnerableto fishing activities during spawning (Lindeman et al.2000, Luckhurst 2002). Thus, information on the poten-tial larval pathways likely to occur from specificspawning aggregations can serve to guide reservedesign to ensure maximum population replenishment.However, only studies that incorporate accurate infor-mation on spawning locations, currents, physical forc-ing, and larval behaviors can make such predictions(Mora & Sale 2002).
Utilizing a high-resolution ocean circulation model(see Cowen et al. 2000), we modeled larval trajectoriesfor several species of snapper emanating from knownspawning sites on the Cuban shelf. Using differinglarval-behavior scenarios (e.g. passive and active), wedeveloped a range of likely transport outcomes undervarying winds and currents associated with seasonalconditions. We structured these model runs to addressthe following questions: (1) What is the relative level of
larval retention and transport within and off primaryCuban archipelagos? (2) What distant populationsreceive spawning products generated from variousCuban spawning locations and at what relativepercentages? (3) To what degree do variations inmeasures of larval traits influence the prior 2 analyses?
METHODS
Cuban shelf geomorphology and spawning sites.Cuba has the largest insular shelf in the Caribbean.The geomorphology of the Cuban shelf is also distinct,in that it has several large, shallow shelf areas sur-rounded by fringing keys and reefs forming a series oflagoons, while the shelf edge is abrupt and formed bya series of submerged terraces (Claro et al. 2001b). Theshelf contains 4 relatively wide regions separated bylong stretches of narrow shelf areas. The wide shelfareas typically have long lines of keys offshore thatform large leeward lagoons. The wide shelf areas occurin these regions: northwest (NW), north-central (NC),southeast (SE) and southwest (SW) Cuba (Fig. 1).
Twenty-one spawning aggregation sites of snapperand grouper species on the insular shelf of Cuba werereported by Claro & Lindeman (2003). Five commer-cially and ecologically important snapper species wereexamined in this study: mutton Lutjanus analis, lane L.synagris, dog L. jocu, cubera L. cyanopterus, and grayL. griseus snappers. The sites used as particle releasesites are listed in Table 1. Six major spawning aggre-gation sites were selected for the mutton snapper(1 in the NW and the SE, 2 in the SW and the NC) aswell as for the lane snapper (2 each in the SE, SW, andNC). The cubera, dog, and gray snappers were treatedas a species complex, because they often share bothlocations and peak spawning times; for this speciescomplex, 4 major spawning aggregation sites wereselected (1 each in the NW and the SW, and 2 inthe SE).
Transport model and larval trajectories. To com-pute a range of likely larval transport outcomes undervarying winds and currents associated with seasonalconditions, a biophysical transport model was de-veloped using velocity fields of the high-resolution(1/12° grid ~9 km mesh) Miami Isopycnal CoordinateOcean Model (MICOM, http://micom.rsmas.miami.edu/oceanmodeling/) forced by true daily winds of theEuropean Center for Medium-Range Weather Fore-casts (ECMWF). Here, we present results from the year1984, which was the first year available with high tem-poral and spatial resolution. MICOM uses bottomtopography from a digital terrain data set with 5’ lati-tude–longitude resolution (ETOPO5) and a coastalboundary set at the 20 m isobath. To extend the geo-
94

Paris et al.: Modeling larval transport from spawning aggregations
graphical range toward shallow coastal areas, MICOMvelocities were extrapolated from the interior intocoastal regions within a 5 to 35° N and 55 to 90° Wdomain. Individual-based larval trajectories were sim-ulated by coupling the resulting circulation model to aLagrangian stochastic model (LSM, see Paris et al.2002). Species-specific reproductive information, lar-val-behavior estimates, and availability of settlementhabitat were introduced as parameters to produce themost realistic larval-trajectory conditions that currentinformation allows (Cowen et al. 2003, see below).
The model output reflected the nested characteris-tics of the actual particles (or virtual larva) releases. In
particular, spawning production (SP) was simulatedusing sequential runs centered on peak spawningmonths and lunar phases. From each of the releasesites described above, we modeled 6 releases of 1000eggs site–1 species–1. This spawning event of 6000 par-ticles site–1 species–1 was partitioned in 3 releases mo–1
at peak lunar spawning times for 2 mo (see Table 1),with 3 d intervals in between each release sequencewithin each month (see Fig. 2 as an example of a single time release). These fine-scale release patternswere based on available information on the reproduc-tive biology of these species (García-Cagide et al.2001, Claro & Lindeman 2003).
95
Fig. 1. Distribution ofthe snapper (Lutjanusspp.) spawning sitesused to model larvalreleases in the currentstudy. The 4 primaryCuban shelf regionsare delineated by dottedlines: northwest (NW,n), north-central (NC,Q), southeast (SE, h)and southwest (SW, s).Bathymetry contours of200, 500, 1000, and5000 m are represented
by thin lines
25°N
23°N
21°N
19°N
86°W 82°W 78°W 74°W
Longitude
Latit
ude
Table 1. Lutjanus spp. Major spawning aggregation sites by region and timing of spawning for L. synagris (lane), L. analis(mutton), L. cyanopterus (cubera), L. griseus (gray), and L. jocu (dog). *: peak spawning months (adapted from Claro & Lindeman
2003). Shelf region abbreviations are explained in Fig. 1
Shelf region Spawning site Coordinate Species Spawning peak Moon
SE Cabo Cruz 19° 49’ 24’’ N, Lane Jun Before full77° 44’ 36’’ W Mutton May*–Jun Full to 7 d after
Cubera & Gray Jul*–Aug FullCayo Bretón 21° 07’ 36’’ N, Cubera Jul–Aug Full
79° 31’ 24’’ W Dog Jul*–Aug FullLane Jun*–Jul Before full
SW Cayo Diego Pérez 22° 02’ 00’’ N, Lane May* Before full81° 30’ 25’’ W
Cayo San Felipe 21° 55’ 00’’ N, Mutton May* Full to 6 d after83° 36’ 00’’ W Lane May–Jun* Before full
Cabo Corrientes 21° 44’ 43’’ N, Mutton May–Jun* Full to 6 d after84° 32’ 05’’ W Cubera & Dog Jul*–Aug Full
NW Corona de San Carlos 22° 54’ 24’’ N, Mutton May–Jun* Full to 6 d after83° 36’ 12’’ W Cubera & Gray Jul*–Aug Full
NC Punta Hicacos 23° 17’ 00’’ N, Mutton May–Jun* Full to 6 d afterCayo Mono 81° 05’ 00’’ W Lane May–Jun* Before fullCayo Caimán Grande 22° 45’ 12’’ N, Mutton May–Jun* Full to 6 d after
78° 52’ 48’’ W Lane May–Jun* Before full

Mar Ecol Prog Ser 296: 93–106, 2005
Successful larval recruitment was measured by thenumber of larvae reaching a suitable habitat at the endof a 30 d larval period (Lindeman et al. 2000) with aseries of larval-behavior scenarios (see below). Suc-cessful recruitment was calculated as the percentof virtual larvae recruiting from the total numberreleased per spawning event (e.g. 6000 site–1 species–1
post-mortality). Levels of recruitment reported herewere scaled by natural mortality occurring during thelarval pelagic period, which typically ranges between0.1 and 0.5 d–1 (Houde 1989, Paris-Limouzy 2001). Forexample, a spawning event of 6000 individuals (totalnumber of released particles per spawning event) isthe equivalent of an initial SP of ~6 million eggs afterapplying a 0.21 daily natural mortality rate for 30 d.Successful recruitment refers strictly to supply oflarvae to settlement habitat and does not include post-settlement processes. Within-region recruitment (orlocal recruitment) refers to virtual larvae that self-recruited within the same Cuban region; among-region recruitment (or regional recruitment) signifies
virtual larvae that recruited to other regions withinCuba; and export recruitment designates export oflarvae outside Cuba, while total recruitment repre-sents both recruitment within Cuba (i.e. within-regionand among-region recruitment) and outside Cuba(export recruitment).
Larval-behavior components. Larval behavior isbased on probable biophysical retention mechanisms(i.e. ontogenetic vertical migration into low-flow regions;Paris & Cowen 2004) as well as sensory capabilities(Kingsford et al. 2002). These traits served to define a re-tention zone (RZ) for pelagic larvae of which the bound-aries correspond to the probable extent of the biophysi-cal mechanisms experienced by reef fish larvae (seeSponaugle et al. 2002) and were set within 9 to 18 km ofsuitable settlement habitat. Suitable habitat was identi-fied via remote sensing and associated maps (i.e. Reefs atRisk in the Caribbean; http://marine.wri.org), trans-ferred to a Geographic Information System (ArcViewGIS 3.3) and buffered with a sensory zone (e.g. 9 km).Lagrangian trajectories were imported into the resulting
96
24°N
20°N
24°N
20°N
86°W 82°W 78°W 86°W 82°W 78°W
Latit
ude
Longitude
Fig. 2. Lutjanus analis. Spatial distribution of virtual larvae at (a) Day 1, (b) Day 7, (c) Day 14, and (d) Day 30 after the first day ofsimulated spawning events of mutton snapper from the 4 Cuban ecoregions: SW: Cabo Corrientes (blue) and Cayos San Felipe(green); NW: Corona de San Carlos (magenta); NC: Punta Hicacos (cyan) and Cayo Caimán Grande (red); SE: Cabo Cruz(yellow). In these images, larval transport is passive and the retention zone for snapper larvae is set within 9 km of suitable
settlement habitat (delineated in light green)
a
c
b
d

Paris et al.: Modeling larval transport from spawning aggregations
recruitment habitat to count larvae falling within theRZ as a post-process described below.
During ontogeny, flexion of the larval notochordallows for formation of the caudal fin and increasedswimming ability (Fisher et al. 2000). Therefore, thetiming of notochord flexion represented a benchmarkfor the onset of active behavior in the model. Informa-tion on the size and/or age of notochord flexion isavailable for 6 species of lutjanids from 3 genera; theflexion initiates between 3.8 and 4.7 mm (= 9 to 12 dpost hatching) in 4 species of Lutjanus (R. Claro & K. C.Lindeman unpubl. data). Flexion is subsequently com-pleted between 4.8 and 6 mm (= 14 to 18 d post hatch-ing), and therefore the onset of active behavior of thevirtual larvae in the model was set at Day 14. In themodel, an active virtual larva stops as its trajectoryintercepts a RZ and is retained for the remainder of thelarval duration before recruiting successfully. Other-wise, it continues its trajectory until the end of the PLD.Mortality at the end of the transport scenario occurs at100% for simulated larvae that are outside the RZ after30 d. In contrast, passive virtual larvae can only recruitat the end of the PLD. To evaluate the role of the onsetof active behavior on the outcome of larval transport, asensitivity analysis was carried out, whereby simulatedlarvae were subjected to a range of active scenarios.Active behavior was started as early as Day 7 afterinitial particle release and as late as the end of thepelagic duration (i.e. Day 30).
Statistical analysis. A hierarchical analysis of vari-ance or nested ANOVA (Underwood 1981, Sokal &Rohlf 1995) on the number of successful recruits pro-duced by each of the spawning events was used todetect variability contributed by different spatial scales(region, site effects), spawning time (species effect),and larval behavior (onset of active behavior effect)simulated in the model. Analyses were done inde-pendently with 2 data sets (i.e. recruitment withinCuba and export recruitment) at 2 different levels. Forrecruitment within Cuba, nested ANOVA was firstperformed for all recruits then separated by individualspecies. For export recruitment, nested ANOVA wasperformed for all recruits, and then separated byreceiving countries. Analyses were performed usingBIOMstat (version 3.2, Applied Biostatistics, Setauket).
RESULTS
Recruitment patterns within Cuba
Most of the spawning aggregations simulated inCuba supplied larvae to their own region, with among-region recruitment in Cuba being lower than recruit-ment within the source region. The exception was mut-
ton snapper larvae released from NW Cuba, whichwere mostly a source of recruits to the NC region(Fig. 3). Inter-specific differences in spatial recruitmentwere evident, even though there were only small lags
97
24°N
20°N
24°N
20°N
24°N
20°N
–84°W –80°W –76°W
Fig. 3. Lutjanus spp. Composition of recruitment within the4 regions of Cuba from spawning sites utilized by (a) lane,(b) mutton, and (c) cubera–gray–dog complex snappers.Each pie represents a spawning aggregation site and its frac-tion of recruits to each of the four eco-regions; the size of thepie is proportional to its contribution to total recruitmentwithin Cuba (pie size range = 7 to 46%). Recruitment is alsoindicated in parentheses as the fraction of the simulatedspawning production (10–3% SP). Values are from simulationsusing MICOM year 1984 with the onset of larval behavior
set at Day 14

Mar Ecol Prog Ser 296: 93–106, 2005
in spawning schedules. The southern regions (SE andSW) received a large majority of the recruitment ofsnappers within Cuba, which contributed largely tooverall recruitment (e.g. 25 to 60%, Table 2). The NWregion received the least amount of recruits for all spe-cies. However, since suitable recruitment habitat in theNW is approximately 3 to 4 times smaller than that ofthe NC, if recruitment was scaled by area, the levels ofrecruitment in the NW may be similar to those of theNC region.
It was also clear that some regions produced morerecruitment than others (Figs. 3 & 4). For example, theSE sites contributed to most of the recruitment withinCuba of the lane snapper and the cubera–dog–grayspecies complex, mostly via self-recruitment (within-region), while the SW and NC sites were more impor-tant for mutton snapper recruitment over all regions.Compared with the other regions, the NW was consis-tently a poor source of larvae within Cuba for all thespecies. There were also site differences within aregion (Fig. 3), where some sites contributed more tolocal recruitment than others (e.g. SE region: CayoBreton produced more self recruits than Cabo Cruz forboth mutton and 3 cubera–gray–dog snappers).
Small-scale temporal variability represented by dif-fering monthly spawning peaks (see Table 1) signifi-cantly drove large variability in recruitment within
Cuba among species (Table 3a). Recruitment patternsat the species level were mostly attributed to regional(large-scale oceanographic) effects for the cubera–gray–dog snapper complex and to a lesser extent forthe lane snapper, while individual sites (small-scalegeomorphologic effects) were associated with most ofthe variability in recruitment for the mutton snapper(Table 3b).
Recruitment patterns outside of Cuba
Simulations indicated that export to other countriesfrom Cuba typically ranged from 1 to 3 orders of mag-nitude lower than recruitment within Cuba. Theexception was the Bahamas, where total exports repre-sented 20 to 51% of total recruitment (Table 2).Because of their proximity, sites from the NC regionwere nearly 50% connected to the southern Bahamas,and may contribute to an important part of the replen-ishment of mutton and lane snapper populations atCay Sal Bank (Fig. 5). There were significant inter-specific differences in the amounts of export (Table 4a).For the mutton snapper, sites from the SW regionshowed some connectivity to Mexico (6%), CaymanIslands (6.2%), and to a lesser extent to Honduras (2%)and Belize (1.2%), while populations in Hispanola
98
Table 2. Lutjanus spp. Estimated recruitment levels (% simulated spawning production) for all sites combined within Cuba and itsecological provinces and to neighboring countries from the spawning aggregation of snappers in Cuba for the MICOM year 1984.Note that Colombia is represented by islands in the Nicaragua–Jamaica Bridge and that Cay Sal Bank is the major receiving re-gion of the Bahamas. Numbers in parentheses are the proportion of total recruitment (within Cuba + export). The assumption insimulating larval transport here is that the onset of larval behavior is at 14 d after spawning. Shelf region abbreviations as in Fig. 1
Species In Cuba By Cuban region Export By country TotalWithin regions Among regions out of Cuba
Mutton 5.1 × 10⁻³ 1.7 × 10⁻³ NW 0.4 × 10⁻³ 7.1 × 10⁻³ Bahamas 3.94 × 10⁻³ 13.9 × 10⁻³
(36.7%) (12.2%) NC 2.9 × 10⁻³ (51%) Cayman 0.87 × 10⁻³
SE 0.9 × 10⁻³ Mexico 0.85 × 10⁻³
SW 2.6 × 10⁻³ Hispañola 0.51 × 10⁻³
Honduras 0.24 × 10⁻³
Colombia 0.20 × 10⁻³
Florida 0.18 × 10⁻³
Belize 0.16 × 10⁻³
Lane 19.1 × 10⁻³ 0 NW 0 4.8 × 10⁻³ Bahamas 2.75 × 10⁻³ 23.9 × 10⁻³
(79.9%) (0%) NC 5.0 × 10⁻³ (20.1%) Cayman 0.77 × 10⁻³
SE 9.4 × 10⁻³ Hispañola 0.39 × 10⁻³
SW 4.7 × 10⁻³ Jamaica 0.38 × 10⁻³
Mexico 0.24 × 10⁻³
Colombia 0.13 × 10⁻³
Honduras 0.08 × 10⁻³
Belize 0.04 × 10⁻³
Cubera 11.9 × 10⁻³ 7.1 × 10⁻³ NW 2.6 × 10⁻³ 8.4 × 10⁻³ Bahamas 4.94 × 10⁻³ 27.3 × 10⁻³
–gray–dog (43.6%) (26%) NC 0 (30.8%) Cayman 1.26 × 10⁻³
SE 11.9 × 10⁻³ Jamaica 0.79 × 10⁻³
SW 4.4 × 10⁻³ Hispañola 0.60 × 10⁻³
Florida 0.29 × 10⁻³
Colombia 0.25 × 10⁻³
Mexico 0.22 × 10⁻³
Honduras 0.02 × 10⁻³

Paris et al.: Modeling larval transport from spawning aggregations
(3.6%) and in the eastern Bahamas (2%)were more connected via sites in the SEzone. Despite the proximity of the FloridaKeys to the NW sites, none of the spawningaggregations seemed to contribute muchto the Florida Keys snapper populations;the largest level of estimated connectivitywas 1% for the cubera–gray–dog complex(Fig. 5).
Sensitivity analysis of larval-behaviorscenarios
Sensitivity analysis was performed on theonset of active behavior and on the sensingdistance (RZ around settlement habitat).The number of larvae that recruited withintheir source region (i.e. within-region re-cruitment) decreased significantly with thedelay of active behavior, while the width ofthe RZ did not have a significant effect onrecruitment levels (Fig. 6a). Although delayin the onset of behavior and, to a lesserextent, smaller range in sensing capabilitydecreased the levels of recruitment, thesefactors had little effect on the spatial distrib-ution of recruitment and on dispersal dis-tances (Fig. 6b). Similarly, the export levelsdecreased considerably with delay of activebehavior, especially for nearby locations(e.g. Cay Sal Bank, Bahamas; Fig. 6c).When exports were scaled by area ofrecruitment habitat, onset of larval behav-ior was an important factor for Cay Sal Bank
99
Table 3. Lutjanus spp. Nested ANOVA analyses testing the effect of geographical and biological factors on simulated recruitmentlevels within Cuba (a) with ‘region’ as primary factor and (b) with ‘species’ as primary factor, during the MICOM year 1984 for L.synagris (lane; LA), L. analis (mutton; MU), and the L. cyanopterus–L. griseus–L. jocu complex (cubera–gray–dog; CU). ANOVA sig-nificance levels: *p < 0.05. Note that the ‘species’ effect is driven by differences in site selection and timing of spawning in the model
Source df MS Fs p-value % explained
(a) RegionRegion 3 2 123 444.4 4.56 0.088 12.01Site/region 4 465 596.3 0.43 0.787 0Species 16 1 089 481.8 2.13 0.022 24.1*Onset of behavior 48 511 164.2 – – 63.89
(b) SpeciesRegion 3 LA 1 710 828.3 1.39 0.368 8.4
MU 169 505.6 0.55 0.674 0CU 2 918 148.2 4.98 0.078 40.1
Site/region 4 LA 376 334.4 0.94 0.466 0MU 1 225 448.1 1.65 0.210 16.33CU 586 523.6 0.97 0.452 0
Onset of behavior 16 LA 742 248.4 – – 75.27MU 185 283.3 – – 82.03CU 605 961.1 – – 59.9
14
12
10
8
6
4
2
014
12
10
8
6
4
2
014
12
10
8
6
4
2
0Corona deSan Carlos
NW
CaboCaiman
Grande NC
PuntaHicacos
NC
Cabo CruzSE
CayoBreton SE
CaboCorrientes
SW
CayoDiego
Perez SW
Cayo SanFelipe SW
Rec
ruitm
ent
with
in C
uba
(10–3
% S
P)
Lanea
b
c
Mutton
Cubera–Gray–Dog
Fig. 4. Lutjanus spp. Recruitment production from modeled spawning ag-gregation sites utilized by (a) lane, (b) mutton, and (c) cubera–gray–dogcomplex snappers. Changes in recruitment are a function of the onset ofactive behavior simulated in the larval transport model at 7, 14 and 30 d.
SP: spawning production

Mar Ecol Prog Ser 296: 93–106, 2005
only (Fig. 6d). For the Cayman Islands, theexport levels were low but consistent forthe early onset of active behavior (Days 7and 14) and decreased strongly when larvaewere passive until the end of the pelagicphase. For all species, the onset of larvalbehavior notably contributed to variabilityin recruitment within Cuba for the yearexamined (Table 4a). This component wasless important when considering recruit-ment to other countries, except for Cay SalBank (Bahamas), which is in close proximityto the northern regions of Cuba (Table 4b).
DISCUSSION
Larval transport
Modeling approaches that integratehydrodynamic models, biological traits, andsettlement habitats have only recently beenapplied to research on larval dispersal andrecruitment (e.g. Werner et al. 2001, Jameset al. 2002, Cowen et al. 2003). The aboveanalyses are based on a coupled biophysicalmodel integrating simulated currents to abiologically relevant Lagrangian stochasticcomponent. The biological component re-produces turbulence and allows virtuallarvae to have individual paths and larvalsensory capabilities. Fine-scale control oflarval trajectories is further generated byincorporating informed estimates of species-specific life-history traits (i.e. spawningschedules, site selection, and PLDs) andsuitable recruitment habitat into the bio-physical model. This modeling approachestimates the extent to which each spawn-ing event contributes larvae to distant popu-
100
Fig. 5. Lutjanus spp. Total recruitment (TR =within Cuba + export) produced from spawningaggregations of (a) lane, (b) mutton, and (c) cu-bera–gray–dog complex snappers grouped bythe 4 primary shelf regions of Cuba. Each pie rep-resents a region and its fraction of recruits toCuba and receiving countries; the size of the pieis proportional to its contribution to TR. TR is alsoindicated in parentheses as the fraction of thesimulated spawning production (% SP); TR fromall regions for lane, mutton, and cubera–gray–dog complex snappers is 29.3 × 10⁻³, 13.9 × 10⁻³,and 27.3 × 10⁻³%, respectively (Table 2). Onset oflarval behavior is set at Day 14. Shelf region
abbreviations as in Fig. 1
24°N
20°N
24°N
20°N
24°N
20°N
-84°W -80°W -76°W
-84°W -80°W -76°W

Paris et al.: Modeling larval transport from spawning aggregations
lations or to neighboring populations. For the first time,we were able to estimate the relative contribution ofthe different spawning aggregations to local andregional recruitment, and the degree to which theseaggregations export recruits to downstream pop-ulations at variable distances.
These results provide only limited support for sub-stantial long-distance advection from Cuba and rein-force mounting evidence (Jones et al. 1999, Cowen etal. 2000, Swearer et al. 2002) that local retention pro-vides a significant replenishment source. For example,36.5 to 80% of the estimated total recruitment gener-ated by the snapper spawning aggregations of theCuban archipelagos is of local origin (Table 2). Thelevels of self-recruitment for Cuba estimated in thisstudy are of the same order of magnitude of those pre-viously observed in Barbados (Paris & Cowen 2004),which is an area of high retention for locally spawnedcoral reef fish larvae (Cowen & Castro 1994). The con-tribution of snapper recruits exported to other coun-tries was a relatively small fraction of the total spawn-ing production during the model period. These resultsagree with predictions of Lindeman et al. (2001) based
on oceanographic information and bio-logical traits of snappers and grunts. Inthe present study, simulated exportrecruitment was 1 to 3 orders of magni-tude lower than levels of recruitmentobserved in other places in theCaribbean (Cowen et al. 2003; Fig. 6)and than levels of simulated recruit-ment within Cuba, with the exceptionof exports to Cay Sal Bank in theBahamas (Fig. 5).
Distant populations that received asmall fraction of exported spawningproducts included those at the CaymanIslands (e.g. mutton and cubera–dog–gray complex); Mexico, which bene-fited from the mutton snapper spawn-ing aggregations of SW Cuba due tothe presence of an anticyclonic eddyduring MICOM year 1984; Jamaicaand Hispañola, each of which receivedrecruits of the cubera–dog–gray com-plex. Despite its relatively close prox-imity, the Florida Keys did not receive asignificant number of recruits fromthe NW or the SW regions of Cuba. Themost probable cause of such recruit-ment patterns for larvae originatingfrom the NW spawning sites may bedifficulties in crossing the strongFlorida Current front during its periodof maximum transport (Lee & Williams
1999) and an absence of frontal eddies (Limouzy-Pariset al. 1997). Snapper larvae originating from the SWsites would typically sustain high mortality beforereaching the Florida reef track via the Loop Currentpathway when its northward intrusion into the Gulf ofMexico is high.
Model validation
Hierachical ANOVA, which has previously beenused to classify processes that determine the distribu-tion of early life-history stages of marine fishes (e.g.Sullivan et al. 2002), served in this study to emphasizethe importance of species-specific effects in modelinglarval transport (i.e. spawning strategies, onset of lar-val behavior). In particular, the timing of spawninginfluenced spatial recruitment patterns significantly,and early onset of larval behavior increased recruitprobability both within Cuba and to distant popula-tions. The quasi-passive behavior scenario producedsuch low levels of recruitment that detection of anypossible spatial variation in recruitment level is lim-
101
(a) Total export levelsSource df MS Fs p-value % explained
Region 3 109 833.2 0.35 0.790 0.0
Species 8 313 114.8 3.10 0.038 51.2*
Onset of 12 101 092.2 – – 48.8behavior
(b) Partitioned export levelsSource df Country MS Fs p-value % explained
Region 3 BA 15 864.1 0.320 0.811 0.03 FL 3 854.8 6.171 0.018 62.9*3 ME 40 180.2 3.204 0.083 41.83 JA 33 286.7 4.789 0.034 51.6*3 CA 75 415.0 1.903 0.208 20.53 BE 888.2 2.965 0.097 39.0
Species 8 BA 49 609.6 2.733 0.057 46.48 FL 624.6 58.56 0.0001 35.9***8 ME 12 539.0 45.06 0.0001 55.7***8 JA 6 950.7 5.428 0.005 33.3**8 CA 39 631.9 5.859 0.0034 56.4**8 BE 299.5 40.39 0.0001 58.1***
Onset of 12 BA 18 154.5 – – 53.6behavior 12 FL 10.7 – – 1.2
12 ME 278.3 – – 2.512 JA 1 280.6 – – 15.112 CA 6 764.8 – – 23.212 BE 7.4 – – 2.9
Table 4. Lutjanus spp. Nested ANOVA analyses of the effects of geographicaland biological factors on simulated (a) total export levels from Cuba and (b) ex-port levels partitioned by countries during the MICOM year 1984 for L. synagris(lane), L. analis (mutton), and L. cyanopterus–L. griseus–L. jocu (cubera–gray–dog) complex snappers in the Bahamas (BA), Florida (FL), Mexico (ME),Jamaica (JA), Cayman Islands (CA), and Belize (BE). ANOVA significance
levels: *p < 0.05, **p < 0.01, ***p < 0.001

Mar Ecol Prog Ser 296: 93–106, 2005
ited. As one might anticipate, we found that biologicalfactors caused much of the recruitment variabilityamong species, while regional differences in recruit-ment resulted from distinct oceanographic regimesaround insular Cuba. The products of our coupledmodel were validated by (1) comparison of the pre-dicted larval trajectories and their variance with satel-lite-tracked oceanic drifters released in the region
(Fig. 7), and (2) the estimated recruitment levels gen-erated by active larval behavior with those observedat Barbados (see Cowen et al. 2003). However, thereare some limitations in this modeling approach, mostlybecause ocean models typically do not resolve coastalcirculation well, and knowledge of larval behavior forsnappers, as in most marine fishes, is limited to highertaxonomic levels (e.g. family and genus; Powles 1977,
102
Fig. 6. Lutjanus analis. Sensitivity analyses of the effects ofvarious larval behavior modes (i.e. sensory threshold dis-tance, onset of active behavior during ontogeny) on levels andspatial distributions of recruitment in dispersal simulations formutton snapper in Cuba. (a) Levels of local recruitment as afunction of onset of active behavior (onset at 7, 14 and 30 d)and of sensing distances from suitable settlement habitat(retention zones = 9 and 18 km). Dotted lines represent 95%confidence intervals around the mean. (b) Spatial distributionof within-region and among-region recruitment in Cuba as afunction of the onset of active behavior. (c) Proportion of thesimulated spawning production from Cuba exported toneighboring countries as a function of the onset of activebehavior. (d) Exports scaled by suitable settlement habitatin neighboring countries as a function of the onset of active
behavior. Shelf regions abbreviations as in Fig. 1
30
25
20
15
10
5
0
5
4.5
4
3.5
3
2.5
2
1.5
1
0.5
0
0.06
0.05
0.04
0.03
0.02
0.01
07 14 30
20
10
020
10
020
10
020
10
020
10
020
10
0 NW NC SE SW
San Carlos NW
Hic. Monos NC
Caiman Gr. NC
Cabo Cruz SE
Corrientes SW
San Felipe SW
7 d
14 d
30 d
9 km RZ18 km RZ
RZ = 9 km
RZ = 9 kmFloridaBahamasCay SalMexicoCaymanJamaicaBelizeHispaniolaHondurasRoatanNicaragua
FloridaBahamasCay SalMexicoCaymanJamaicaBelizeHispaniolaHondurasRoatanNicaragua
a
c
d
b
Rec
ruitm
ent
(10–3
km–2
)
Day after hatch (d)
Rec
ruitm
ent
(10–3
% S
P)
Loca
l rec
ruitm
ent
(10–3
% S
P)
Loca
l rec
ruitm
ent
(10–3
% S
P)

Paris et al.: Modeling larval transport from spawning aggregations
Leis 1987, Cowen 2002). These factors caused uncer-tainty in the estimated trajectories that we recognizedand minimized in several manners. First, to resolve thecirculation beyond the ocean model limits (i.e. 20 misobath), MICOM velocities were spatially smoothedfrom the interior during the interpolation scheme. Thisscheme provided a first approximation for the coastalcirculation, but the interpolation reduced oceanic eddyvariability. We compensated by adjusting the varianceof the turbulent velocity in the stochastic scheme toreproduce the observed IAS float trajectories (Fig. 7).To approximate the influence of larval behaviors, wedeveloped RZs for virtual larvae which are located inshallow areas (see ‘Methods’) and are based on empir-ically derived proportions of coral reef fish larvaeretained near the coastal environment (e.g. Paris &Cowen 2004). In future work, extrapolating velocitiesfrom the ocean model boundary to the shorelinewithout modifying velocities in the interior, or nestinga diffusive coastal boundary to the existing velocityfield, should enhance accuracy of the transport (C. B.Paris & A. Srinivasan unpubl. data).
In addition, improvements will be achieved by use ofocean models with larger coastal extent and with thedevelopment of mesoscale coastal models that includedetailed topography and tidal forcing. Comparisons of
Atlantic inflow to the Caribbean Sea between observa-tions and MICOM in the Florida Straits (NW region)and the Yucatan Channel (SW region) agree well, butthe mean total transport (from the surface to bottom)from MICOM model years 1979 to 1986 in the OldBahama Channel is slightly towards the east (i.e.–0.7 Sv; Z. Garraffo, RSMAS, pers. commun.), whiletransport derived from observations is towards thewest (i.e. +1.9 Sv; Atkinson et al. 1995). However,observed westward flow was prominent in the deeperlayers (250 to 435 m), while near-surface (50 m), along-channel currents reversed during the 12 mo time series(variance = 1400, mean currents = 2.6 cm s–1, Atkinsonet al. 1995), flowing mostly toward the Straits of Floridafrom November to March and mostly eastward fromApril to October throughout the snapper spawningseason. In addition, when comparing MICOM surfacevelocities (i.e. mixed layer) to in situ drifters, the meansimulated velocity in this region does not statisticallydiffer from the observations (see Garraffo et al. 2001,their Fig. 4d). Discrepancies of transport in the OldBahama Channel could have created inaccuracy in thelevels of exchange between the NC region and Cay SalBank, with the potential to underestimate local recruit-ment from Cayo Caimán Grande. The larval-behaviorcomponent is based on the assumption that competentlarvae can be retained near coastal regions (i.e. re-cruitment zones) and recruit if their trajectory inter-cepts a suitable settlement habitat. Once fully opera-tional in the study region, ocean models of highervertical resolution and shallow extent (e.g. HYCOM;http://hycom.rsmas.miami.edu) will enable the incor-poration of active behavior where vertical migrationinto stratified currents could be directly implementedto simulate observed behavior (see Paris & Cowen2004). These challenges warrant strong consideration,yet the results presented here represent relativelyrobust estimators of sources of variability and propor-tions of recruitment within Cuba and among adjacentcountries.
Spawning aggregations and management
Variation in the timing and location of spawningamong snapper species leads to significant recruitmentvariability in both space and amplitude. For example,the SE region was a source of recruits for lane andcubera–gray–dog complex snappers recruiting withinCuba, while the SW was a larger source for muttonsnappers recruiting within Cuba (Fig. 3). Both ofthe spawning sites utilized by the cubera–gray–dogsnapper complex produced similar recruitment withinCuba, while Cayo Bretón produced significantly morelane snapper recruits within Cuba than Cabo Cruz.
103
26°N
22°N
18°N
Latit
ude
Longitude88°W 84°W 80°W
Fig. 7. Comparison of 2 drifter trajectories (solid lines) fromthe Global Lagrangian Drifter Database (GDL, http://db.aoml.noaa.gov/cgi-bin/db/Bin/init_applet.x?gld+GLDKRIG-GUI.class) south of Cuba with simulated drifters (dashed anddotted lines) using MICOM/ECMWF velocity fields. Note that1 drifter passes through the Yucatan channel into the FloridaStraits, while the other returns to southwest Cuba. The greencircle with a blue cross represents the deployment location ofthe real float (solid blue lines) and the corresponding release
of the virtual floats (dotted blue lines) in the model
Mar Ecol Prog Ser 296: 93–106, 2005
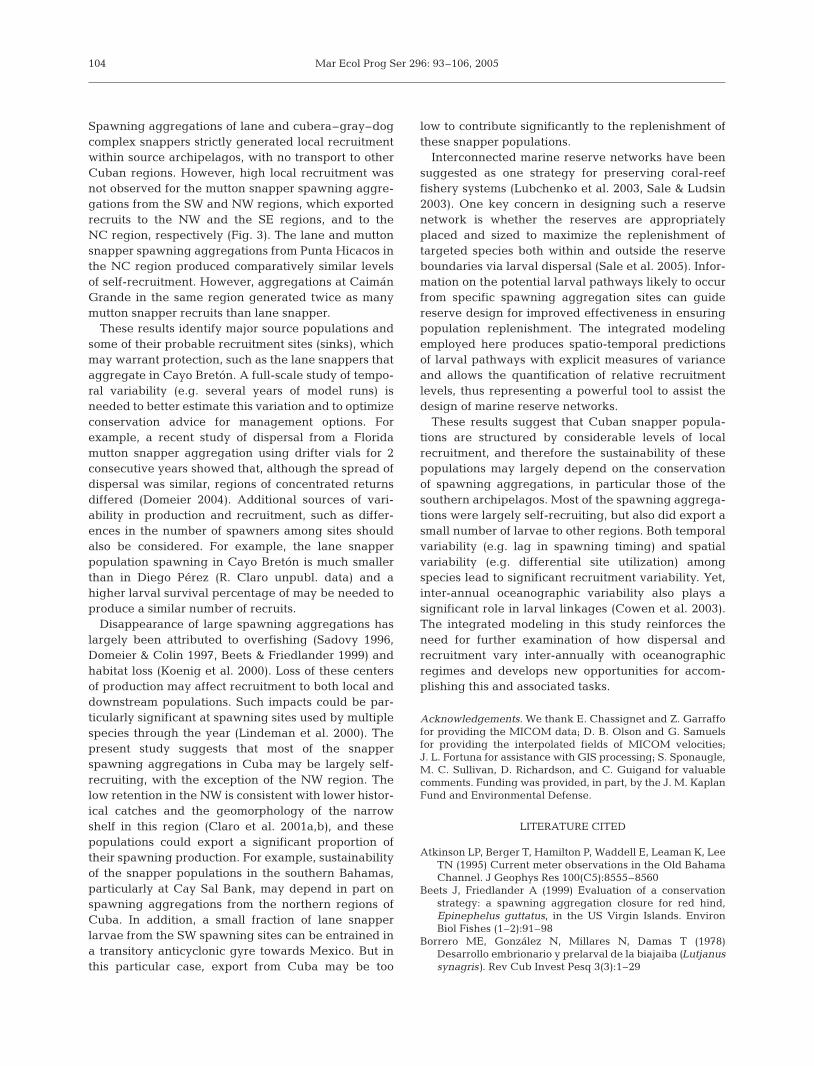
Spawning aggregations of lane and cubera–gray–dogcomplex snappers strictly generated local recruitmentwithin source archipelagos, with no transport to otherCuban regions. However, high local recruitment wasnot observed for the mutton snapper spawning aggre-gations from the SW and NW regions, which exportedrecruits to the NW and the SE regions, and to theNC region, respectively (Fig. 3). The lane and muttonsnapper spawning aggregations from Punta Hicacos inthe NC region produced comparatively similar levelsof self-recruitment. However, aggregations at CaimánGrande in the same region generated twice as manymutton snapper recruits than lane snapper.
These results identify major source populations andsome of their probable recruitment sites (sinks), whichmay warrant protection, such as the lane snappers thataggregate in Cayo Bretón. A full-scale study of tempo-ral variability (e.g. several years of model runs) isneeded to better estimate this variation and to optimizeconservation advice for management options. Forexample, a recent study of dispersal from a Floridamutton snapper aggregation using drifter vials for 2consecutive years showed that, although the spread ofdispersal was similar, regions of concentrated returnsdiffered (Domeier 2004). Additional sources of vari-ability in production and recruitment, such as differ-ences in the number of spawners among sites shouldalso be considered. For example, the lane snapperpopulation spawning in Cayo Bretón is much smallerthan in Diego Pérez (R. Claro unpubl. data) and ahigher larval survival percentage of may be needed toproduce a similar number of recruits.
Disappearance of large spawning aggregations haslargely been attributed to overfishing (Sadovy 1996,Domeier & Colin 1997, Beets & Friedlander 1999) andhabitat loss (Koenig et al. 2000). Loss of these centersof production may affect recruitment to both local anddownstream populations. Such impacts could be par-ticularly significant at spawning sites used by multiplespecies through the year (Lindeman et al. 2000). Thepresent study suggests that most of the snapperspawning aggregations in Cuba may be largely self-recruiting, with the exception of the NW region. Thelow retention in the NW is consistent with lower histor-ical catches and the geomorphology of the narrowshelf in this region (Claro et al. 2001a,b), and thesepopulations could export a significant proportion oftheir spawning production. For example, sustainabilityof the snapper populations in the southern Bahamas,particularly at Cay Sal Bank, may depend in part onspawning aggregations from the northern regions ofCuba. In addition, a small fraction of lane snapperlarvae from the SW spawning sites can be entrained ina transitory anticyclonic gyre towards Mexico. But inthis particular case, export from Cuba may be too
low to contribute significantly to the replenishment ofthese snapper populations.
Interconnected marine reserve networks have beensuggested as one strategy for preserving coral-reeffishery systems (Lubchenko et al. 2003, Sale & Ludsin2003). One key concern in designing such a reservenetwork is whether the reserves are appropriatelyplaced and sized to maximize the replenishment oftargeted species both within and outside the reserveboundaries via larval dispersal (Sale et al. 2005). Infor-mation on the potential larval pathways likely to occurfrom specific spawning aggregation sites can guidereserve design for improved effectiveness in ensuringpopulation replenishment. The integrated modelingemployed here produces spatio-temporal predictionsof larval pathways with explicit measures of varianceand allows the quantification of relative recruitmentlevels, thus representing a powerful tool to assist thedesign of marine reserve networks.
These results suggest that Cuban snapper popula-tions are structured by considerable levels of localrecruitment, and therefore the sustainability of thesepopulations may largely depend on the conservationof spawning aggregations, in particular those of thesouthern archipelagos. Most of the spawning aggrega-tions were largely self-recruiting, but also did export asmall number of larvae to other regions. Both temporalvariability (e.g. lag in spawning timing) and spatialvariability (e.g. differential site utilization) amongspecies lead to significant recruitment variability. Yet,inter-annual oceanographic variability also plays asignificant role in larval linkages (Cowen et al. 2003).The integrated modeling in this study reinforces theneed for further examination of how dispersal andrecruitment vary inter-annually with oceanographicregimes and develops new opportunities for accom-plishing this and associated tasks.
Acknowledgements. We thank E. Chassignet and Z. Garraffofor providing the MICOM data; D. B. Olson and G. Samuelsfor providing the interpolated fields of MICOM velocities;J. L. Fortuna for assistance with GIS processing; S. Sponaugle,M. C. Sullivan, D. Richardson, and C. Guigand for valuablecomments. Funding was provided, in part, by the J. M. KaplanFund and Environmental Defense.
LITERATURE CITED
Atkinson LP, Berger T, Hamilton P, Waddell E, Leaman K, LeeTN (1995) Current meter observations in the Old BahamaChannel. J Geophys Res 100(C5):8555–8560
Beets J, Friedlander A (1999) Evaluation of a conservationstrategy: a spawning aggregation closure for red hind,Epinephelus guttatus, in the US Virgin Islands. EnvironBiol Fishes (1–2):91–98
Borrero ME, González N, Millares N, Damas T (1978)Desarrollo embrionario y prelarval de la biajaiba (Lutjanussynagris). Rev Cub Invest Pesq 3(3):1–29
104

Paris et al.: Modeling larval transport from spawning aggregations
Carter HJ, Perrine D (1994) A spawning aggregation ofdog snapper, Lutjanus jocu (Pisces: Lutjanidae) in Belize,Central America. Bull Mar Sci 55(1):228–234
Clarke ME, Domeier ML, Laroche WA (1997) Developmentof larvae and juveniles of the mutton snapper (Lutjanusanalis), lane snapper (Lutjanus synagris), and yellowtailsnapper (Lutjanus chrysurus). Bull Mar Sci 61(3):511–537
Claro R, Lindeman KC (2003) Spawning aggregation sites ofsnapper and grouper species (Lutjanidae and Serranidae)on the insular shelf of Cuba. Gulf Caribb Res 14(2):91–106
Claro R, Baisre JA, Lindeman KC, García-Ateaga JP (2001a)Cuban fisheries: historical trends and current status. In:Claro R, Lindeman KC, Parenti LR (eds) Ecology of theMarine Fishes of Cuba. Smithsonian Institution Press,Washington, DC, p 194–218
Claro R, Reshetnikov YS, Alcolado PM (2001b) Physicalattributes of coastal Cuba. In: Claro R, Lindeman KC,Parenti LR (eds) Ecology of the marine fishes of Cuba.Smithsonian Institution Press, Washington, DC, p 1–20
Cowen RK (2002) Larval dispersal and retention and conse-quences for population connectivity. In: Sale PF (ed) Coralreef fishes. Elsevier Science, New York, p 149–170
Cowen RK, Castro LR (1994) Relation of coral reef fish larvaldistributions to island scale circulation around Barbados,West Indies. Bull Mar Sci 54:228–244
Cowen RK, Lwiza KMM, Sponaugle S, Paris CB, Olson DB(2000) Connectivity of marine populations: open or closed?Science 287:857–859
Cowen RK, Paris CB, Olson DB, Fortuna JL (2003) The role oflong distance transport in replenishing marine popula-tions. Gulf Caribb Res 14(2):129–137
Domeier ML (2004) A potential larval recruitment pathwayoriginating from a Florida marine protected area. FishOceanogr 13(5):287–294
Domeier ML, Colin PL (1997) Tropical reef fish spawningaggregations: defined and reviewed. Bull Mar Sci 60(3):698–726
Domeier ML, Koenig C, Coleman F (1997) Reproductive bio-logy of the gray snapper (Lutjanidae: Lutjanus griseus)with notes on spawning for other western Atlantic lut-janids. In: Arreguin-Sanchez F, Munro JL, Pauly D (eds)Biology of tropical groupers and snappers. ICLARM Con-ference Proceedings, Vol 48. ICLARM, Manila, p 189–201
Drass DM, Bootes KL, Lyczkowski-Shultz J, Comyns BH, HoltGH, Riley CM, Phelps RP (2000) Larval development ofred snapper, Lutjanus campechanus, and comparisons withco-occurring snapper species. Fish Bull US 98(3):507–527
Fisher R, Bellwood DR, Job SD (2000) The development ofswimming abilities in reef fish larvae. Mar Ecol Prog Ser202:163–173
García-Cagide A, Claro R, Koshelev BV (2001) Reproductivepatterns of fishes of the Cuban shelf. In: Claro R, Linde-man KC, Parenti LR (eds) Ecology of the marine fishesof Cuba. Smithsonian Institution Press, Washington, DC,p 73–114
Garraffo ZD, Griffa A, Mariano AJ, Chassignet EP (2001)Lagrangian data in a high-resolution numerical simula-tion of the North Atlantic. II. On the pseudo-Eularianaveraging of Lagrangian data. J Mar Syst 29:177–200
Grimes CB (1987) Reproductive biology of the Lutjanidae: areview. In: Polovina JJ, Ralston S (eds) Tropical snappersand groupers: biology and fisheries management. West-view Press, Boulder, CO, p 239–294
Heyman WD, Graham RT, Kjerfve B, Johannes RE (2001)Whale sharks Rhincodon typus aggregate to feed on fishspawn in Belize. Mar Ecol Prog Ser 215:275–282
Houde E (1989) Comparative growth, mortality, and ener-
getics of marine fish larvae: temperature and impliedlatitudinal effects. Fish Bull US 87:471–495
James KJ, Armsworth PR, Mason LB, Bode L (2002) The struc-ture of reef fish metapopulations: modeling larval dis-persal and retention patterns. Proc R Soc B 269:2079–2086
Jones GP, Milicich MI, Emslie MJ, Lunow C (1999) Self-recruitment in a coral reef fish population. Nature 402:802–804
Kingsford MJ, Leis JM, Shanks A, Lindeman KC, Morgan SG,Pineda J (2002) Sensory environments, larval abilities andlocal self-recruitment. Bull Mar Sci 70(1):309–340
Koenig CC, Coleman FC, Grimes CB, Fitzhugh GR, ScanlonKM, Gledhill CT, Grace M (2000) Protection of fish spawn-ing habitat for the conservation of warm-temperate reef-fish fisheries of shelf-edge reefs of Florida. Bull Mar Sci66(3):593–616
Laroche WA (1977) Description of larval and early juvenilevermilion snapper, Rhomboplites aurorubens. Fish Bull US75:547–554
Lee TN, Williams E (1999) Mean distribution and seasonalvariability of coastal currents and temperature in theFlorida Keys with implications for larval recruitment. BullMar Sci 64(1):35–56
Leis JM (1987) Review of the early life history of tropicalgroupers (Serranidae) and snappers (Lutjanidae). In:Polovina JJ, Ralston S (eds) Tropical snappers andgroupers: biology and fisheries management. WestviewPress, Boulder, CO, p 189–237
Limouzy-Paris CB, Graber HC, Jones DL, Röpke AW,Richards WJ (1997) Translocation of larval coral reeffishes via sub-mesoscale spin-off eddies from the FloridaCurrent. Bull Mar Sci 60(3):966–983
Lindeman KC, Pugliese R, Waugh GT, Ault JS (2000) Devel-opmental patterns within a multispecies reef fishery:management applications for essential fish habitats andprotected areas. Bull Mar Sci 66(3):929–956
Lindeman KC, Lee TN, Wilson WD, Claro R, Ault JS (2001)Transport of larvae originating in southwest Cuba and theDry Tortugas: evidence for partial retention in grunts andsnappers. Proc Gulf Caribb Fish Inst 52:732–747
Lindeman KC, Richards WJ, Lyczkowski-Shultz J, Drass DM,Paris CB, Leis JM, Lara M, Comyns BH (in press) Lut-janidae: snappers. In: Richards WJ (ed) Early stages ofAtlantic fishes. CRC Press, Boca Raton, FL
Lubchenco J, Palumbi SR, Gaines SD, Andelman S (2003)Plugging a hole in the ocean: the emerging science ofmarine reserves. Ecol Appl 13(1)(Suppl):3S–7S
Luckhurst BE (2002) Recommendations for a Caribbeanregional conservation strategy for reef fish spawning aggre-gations. Executive Summary, The Nature Conservancy,Arlington, VA
Mora C, Sale PF (2002) Are populations of coral reef open orclosed? Trends Ecol Evol 17(9):422–428
Palumbi SR (2003) Population genetics, demographic connec-tivity, and the design of marine reserves. Ecol Appl 13(1)(Suppl):S146–S158
Paris CB, Cowen RK (2004) Direct evidence of a biophysicalretention mechanism for coral reef fish larvae. LimnolOceanogr 49(6):1964–1979
Paris CB, Cowen RK, Lwiza KMM, Wang DP, Olson DB (2002)Multivariate objective analysis of the coastal circulation ofBarbados, West Indies: implication for larval transport.Deep-Sea Res I 49:1363–1386
Paris-Limouzy CB (2001) Transport dynamics and survival ofthe pelagic stages of Stegastes partitus (Poey). PhD thesis,State University of New York at Stony Brook
Parrish JD (1989) Fish communities of interacting shallow-
105
Mar Ecol Prog Ser 296: 93–106, 2005
water habitats in tropical oceanic regions. Mar Ecol ProgSer 58(1-2):143–160
Pauly D, Arregín-Sánchez F, Munro JM, Balgos MC (2000)International workshop on grouper and snapper: a sum-mary of findings. ICLARM Contribution No. 1382,ICLARM, Makati City, Metro Manila
Potthoff T, Kelley S, Collins LA (1988) Osteological de-velopment of the red snapper, Lutjanus campechanus(Lutjanidae). Bull Mar Sci 43:1–40
Powles H (1977) Larval distributions and recruitmenthypotheses for snappers and groupers of the SouthAtlantic Bight. Proc Annu Conf Southeast Assoc Fish WildlAgencies 31:362–371
Rabalais NN, Rabalais SC, Arnold CR (1980) Descriptionof eggs and larvae of laboratory reared red snapper(Lutjanus campechanus). Copeia 4:704–708
Riley CM, Holt GJ, Arnold CR (1995) Growth and morphologyof larval and juvenile captive bred yellowtail snapper,Ocyurus chrysurus. Fish Bull 93(1):179–185
Sadovy Y (1996) Reproduction in reef fishery species. In:Polunin NVC, Roberts CM (eds) Reef fisheries. Chapman& Hall, London, p 15–59
Sale PF, Ludsin SA (2003) The extent and spatial scale ofconnectivity among reef fish populations: implications formarine protected areas designated for fisheries enhance-ment. Gulf Caribb Res 14(2):119–128
Sale PF, Cowen RK, Danilowicz BS, Jones GP and 7 others(2005) Critical science gaps impede use of no-take fisheryreserves. Trends Ecol Evol 20(2):74–80
Sokal RR, Rohlf FJ (1995) Biometry. The principles andpractices of statistics in biological research, 3rd edn. WHFreeman, New York
Sponaugle S, Cowen RK, Shanks A, Morgan SG and 7 others(2002) Predicting self-recruitment in marine populations:biophysical correlates and mechanisms. Bull Mar Sci 70(1):341–375
Sullivan MC, Cowen RK, Able KW, Fahay MP (2002) Spatialscaling of recruitment in four continental shelf fishes. MarEcol Prog Ser 207:141–154
Swearer SE, Shima JS, Hellberg ME, Morgan SG, Selkoe KA,Ruiz GM, Warner R (2002) Evidence of self-recruitment indemersal marine populations. Bull Mar Sci 70(1)(Suppl):251–271
Underwood AJ (1981) Techniques of analysis of variance inexperimental marine biology and ecology. Oceanogr MarBiol Annu Rev 19:513–605
Warner RR, Cowen RK (2002) Local retention of production inmarine populations: evidence, mechanisms and conse-quences. Bull Mar Sci 70(1):245–250
Werner FE, Quinlan JA, Lough RG, Lynch DR (2001) Spatially-explicit individual based modeling of marine populations:a review of the advances in the 1990s. Sarsia 86:411–421
106
Editorial responsibility: Otto Kinne (Editor-in-Chief),Oldendorf/Luhe, Germany
Submitted: May 24, 2004; Accepted: March 8, 2005Proofs received from author(s): June 29, 2005