LARSA 4D Balanced Cantilever Problem · LARSA 4D Balanced Cantilever Problem Note that the final...
63
LARSA 4D Balanced Cantilever Problem
Transcript of LARSA 4D Balanced Cantilever Problem · LARSA 4D Balanced Cantilever Problem Note that the final...

LARSA 4D BalancedCantilever Problem
LARSA 4D Balanced Cantilever Problem
A manual for
LARSA 4DFinite Element Analysis and Design Software
Last Revised October 2016
Copyright (C) 2001-2019 LARSA, Inc. All rights reserved. Information in this document issubject to change without notice and does not represent a commitment on the part of LARSA,Inc. The software described in this document is furnished under a license or nondisclosureagreement. No part of the documentation may be reproduced or transmitted in any form or byany means, electronic or mechanical including photocopying, recording, or information storageor retrieval systems, for any purpose without the express written permission of LARSA, Inc.

LARSA 4D Balanced Cantilever Problem
Table of ContentsIntroduction 5
Cross-Section Properties 7Cross-Section Dimensions 8
Nonprismatic Variation 10
Verification of Properties 14
Properties 17Material Properties 18
Sections 19
Bridge Geometry 21Bridge Alignment 21
Joints 23
Members 26
Integrity Check 31
Staged Construction 33About LARSA 4D’s Staged Construction Analysis 33
Segment Groups 33
Construction Stages 35
Defining Tendons 41Tendon Geometry 41
Tendon Construction Activities 45
Time-Dependent Analysis 51Casting Day 51
Stages 51
Analysis Options 52
Results: Stresses 53Graphics
Spreadsheets
Graphs
Results: Tendons 57
Code Check 61
3

LARSA 4D Balanced Cantilever Problem
4

LARSA 4D Balanced Cantilever Problem
Introduction
This problem is the analysis of a balanced cantilever concrete box girder bridge. The bridge alignment has a circularcurve with superelevation, nonprismatic variation of cross-section properties, and post-tensioned tendons.
The final model is shown below.
Side View
Plan View
This training manual is written for LARSA 4D Version 7.5.
5

LARSA 4D Balanced Cantilever Problem
6

LARSA 4D Balanced Cantilever Problem
Cross-Section Properties
In this section we will set up the non-prismatic cross-section of the girder using:
• An existing shape template
• Parameter formulas
• The member reference line
• Piecewise linear variation of depth along the girder length using the Formula Helper
The cross-section of this model is a box girder 17 meters wide with variable depth from roughly 5 meters at the pierto 3 meters mid-span. Cross-section dimensions have been provided in SI units.
The cross-section will be modeled in LARSA Section Composer. Section Composer provides a number of parametrictemplates of common shapes which can be resized quickly to the design specifications by entering the values ofparameters such as depth, flange thickness, etc. Additionally, these parametric templates allow parameters to bespecified as formulas, which provides the basis of creating nonprismatic variation.
The final section in Section Composer is shown below:
LARSA Section Composer
The design specification provided is given in the next figure.
7
LARSA 4D Balanced Cantilever Problem
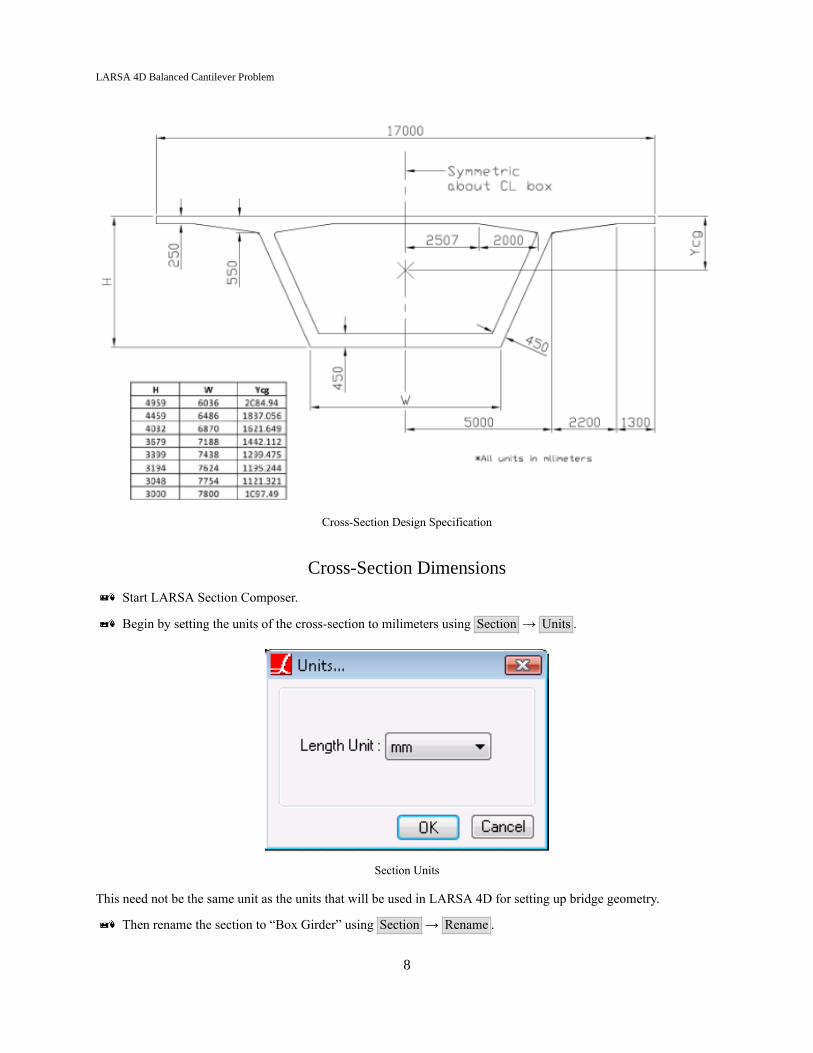
Cross-Section Design Specification
Cross-Section Dimensions
Start LARSA Section Composer.
Begin by setting the units of the cross-section to milimeters using Section → Units .
Section Units
This need not be the same unit as the units that will be used in LARSA 4D for setting up bridge geometry.
Then rename the section to “Box Girder” using Section → Rename .
8
LARSA 4D Balanced Cantilever Problem
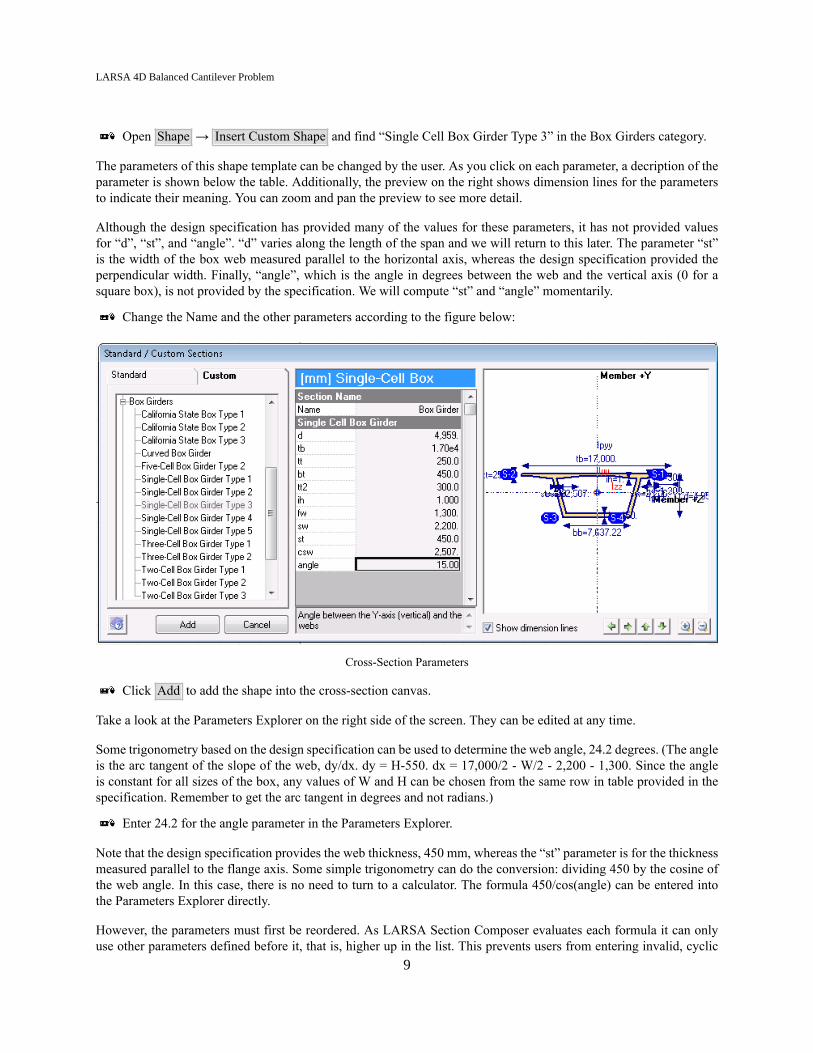
Open Shape → Insert Custom Shape and find “Single Cell Box Girder Type 3” in the Box Girders category.
The parameters of this shape template can be changed by the user. As you click on each parameter, a decription of theparameter is shown below the table. Additionally, the preview on the right shows dimension lines for the parametersto indicate their meaning. You can zoom and pan the preview to see more detail.
Although the design specification has provided many of the values for these parameters, it has not provided valuesfor “d”, “st”, and “angle”. “d” varies along the length of the span and we will return to this later. The parameter “st”is the width of the box web measured parallel to the horizontal axis, whereas the design specification provided theperpendicular width. Finally, “angle”, which is the angle in degrees between the web and the vertical axis (0 for asquare box), is not provided by the specification. We will compute “st” and “angle” momentarily.
Change the Name and the other parameters according to the figure below:
Cross-Section Parameters
Click Add to add the shape into the cross-section canvas.
Take a look at the Parameters Explorer on the right side of the screen. They can be edited at any time.
Some trigonometry based on the design specification can be used to determine the web angle, 24.2 degrees. (The angleis the arc tangent of the slope of the web, dy/dx. dy = H-550. dx = 17,000/2 - W/2 - 2,200 - 1,300. Since the angleis constant for all sizes of the box, any values of W and H can be chosen from the same row in table provided in thespecification. Remember to get the arc tangent in degrees and not radians.)
Enter 24.2 for the angle parameter in the Parameters Explorer.
Note that the design specification provides the web thickness, 450 mm, whereas the “st” parameter is for the thicknessmeasured parallel to the flange axis. Some simple trigonometry can do the conversion: dividing 450 by the cosine ofthe web angle. In this case, there is no need to turn to a calculator. The formula 450/cos(angle) can be entered intothe Parameters Explorer directly.
However, the parameters must first be reordered. As LARSA Section Composer evaluates each formula it can onlyuse other parameters defined before it, that is, higher up in the list. This prevents users from entering invalid, cyclic
9
LARSA 4D Balanced Cantilever Problem
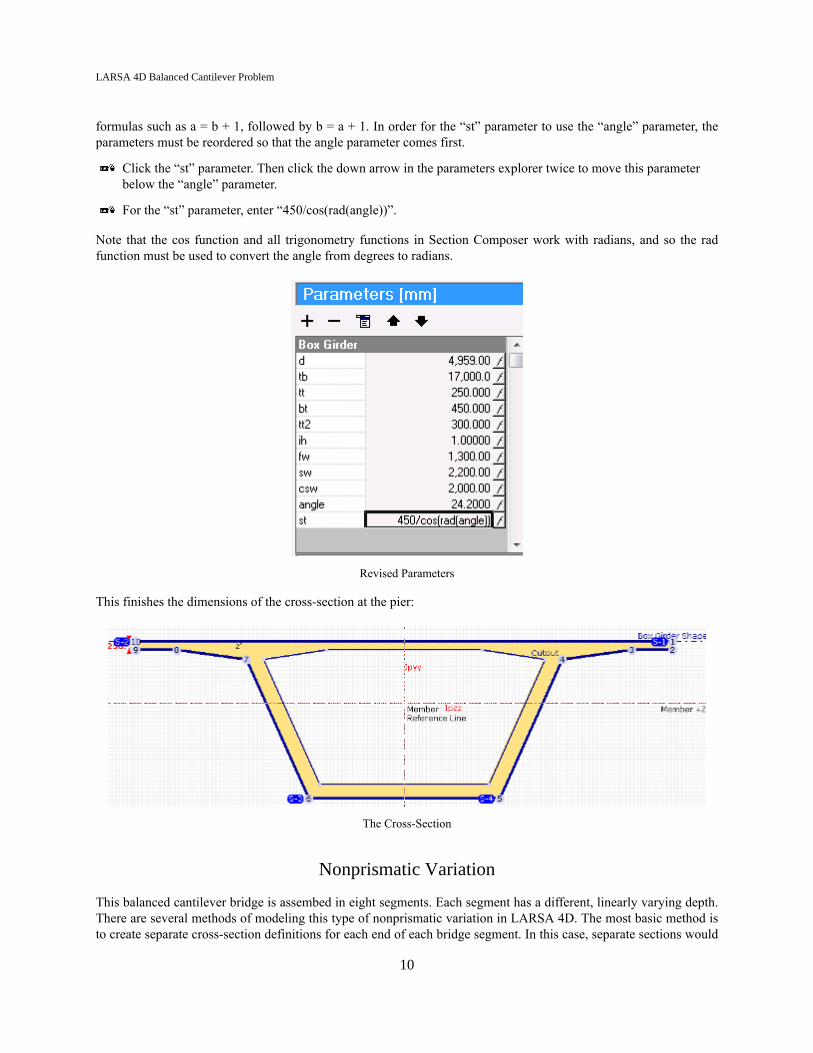
formulas such as a = b + 1, followed by b = a + 1. In order for the “st” parameter to use the “angle” parameter, theparameters must be reordered so that the angle parameter comes first.
Click the “st” parameter. Then click the down arrow in the parameters explorer twice to move this parameterbelow the “angle” parameter.
For the “st” parameter, enter “450/cos(rad(angle))”.
Note that the cos function and all trigonometry functions in Section Composer work with radians, and so the radfunction must be used to convert the angle from degrees to radians.
Revised Parameters
This finishes the dimensions of the cross-section at the pier:
The Cross-Section
Nonprismatic Variation
This balanced cantilever bridge is assembed in eight segments. Each segment has a different, linearly varying depth.There are several methods of modeling this type of nonprismatic variation in LARSA 4D. The most basic method isto create separate cross-section definitions for each end of each bridge segment. In this case, separate sections would
10

LARSA 4D Balanced Cantilever Problem
be assigned to the starts and ends of each member element. While this method is conceptually straight-forward, it istedious and error-prone to create many separate cross-sections.
The second approach is to define the depth of the cross-section as a function of the location on the bridge. SectionComposer provides a special formula variable “x” that represents the position on the bridge (in a manner to be mademore specific later on). This way, the user can vary parameters according to position. A formula for “d” such as “x +10” will vary the depth of a section increasing from 10 units with a constant slope.
Section Composer provides a number of options that makes these definitions easily possible:
Member Reference LineThe member reference line is the origin of a separate coordinate system from the member’s usual localaxes (about its centroid). The availability of a reference line is crucial for nonprismatic variation so thatthere is a fixed reference point on the cross-section while the centroid moves. The fixed reference pointcould be the center of the top surface of the beam, or it could be the bridge layout centerline. In thesecases, the user must position the section’s shapes relative to the reference line on the screen. When itcomes time to position the cross-section in the bridge model in LARSA 4D, the member reference linewill be used. Joints will not have to be placed along a moving target (the centroid). Rather, they will bepositioned along whatever is chosen as the member reference line.
“x” in Absolute or Relative UnitsThe special “x” variable can be used either in relative units from 0 to 1, or in absolute length units from0 to the length of the span. Relative units are especially useful when defining haunches with parabolicvariation where the length of the span does not matter. In this case, we will be defining a piecewisevariation function and the locations of the ends of each segment is easiest to compute in length units.
Before getting to the nonprismatic variation, we will locate the member reference line at the top of the box girder. Bydefault it is at the section centroid.
Actually we like to think of the reference line as fixed, and instead move the section top to line up with the reference line.
If the box girder shape is not already selected (its outline will be thick), click on the box girder shape to selectit. Then click the Align Top button in the Section Composer toolbar and choose Member Reference Z Axis .
Cross-Section with Moved Reference Line
The Member Reference Line text in the section canvas is now partially obscured under the top slab of the box. However,you can still see the Member +Y and Member +Z labels on the top and right of the section indicating the memberreference axes. Their intersection is the member reference line. The section principal axes Ipzz and Ipyy are shown inred, indicating the centroid location and what LARSA 4D considers the member local axes. (You may also see y' andz' labels which are something else outside the scope of this manual.)
11

LARSA 4D Balanced Cantilever Problem
Go to Section → Nonprismatic Variation .
Entering Nonprismatic Variation
Choose the Absolute Length option for the “x” variable.
Note that the length unit is the same as the length unit previously set for the rest of the cross-section properties,milimeters.
Click the f (i.e. “function”) button to the right of the “d” parameter. Then click Piecewise Function .
This window helps us to construct a long formula instead of writing it out by hand (which is also possible).
Knowing what to enter here will require some foresight into the choices that will be made in how to model the bridgegeometry. In particular, there will be 22 segments of roughly 16 ft each (4,878 mm), except for the segment above thepier (segment 15) which will be 14.8 ft (4,511 mm, or 367 mm shorter). The start and end positions of the segmentsmust be calculated in milimeters outside of Section Composer. In fact, it is better to return to this step later once thebridge geometry is complete to be sure that the start and end positions match exactly with the member lengths as givenin the Members spreadsheet. Note that the nonprismatic variation defined in Section Composer is layed out alongthe straight-line member elements. In a curved alignment such as the one we have here, it would not be appropriateto compute the locations of the segments by dividing the span length into equal pieces because the span length ismeasured along the curve.
12
LARSA 4D Balanced Cantilever Problem
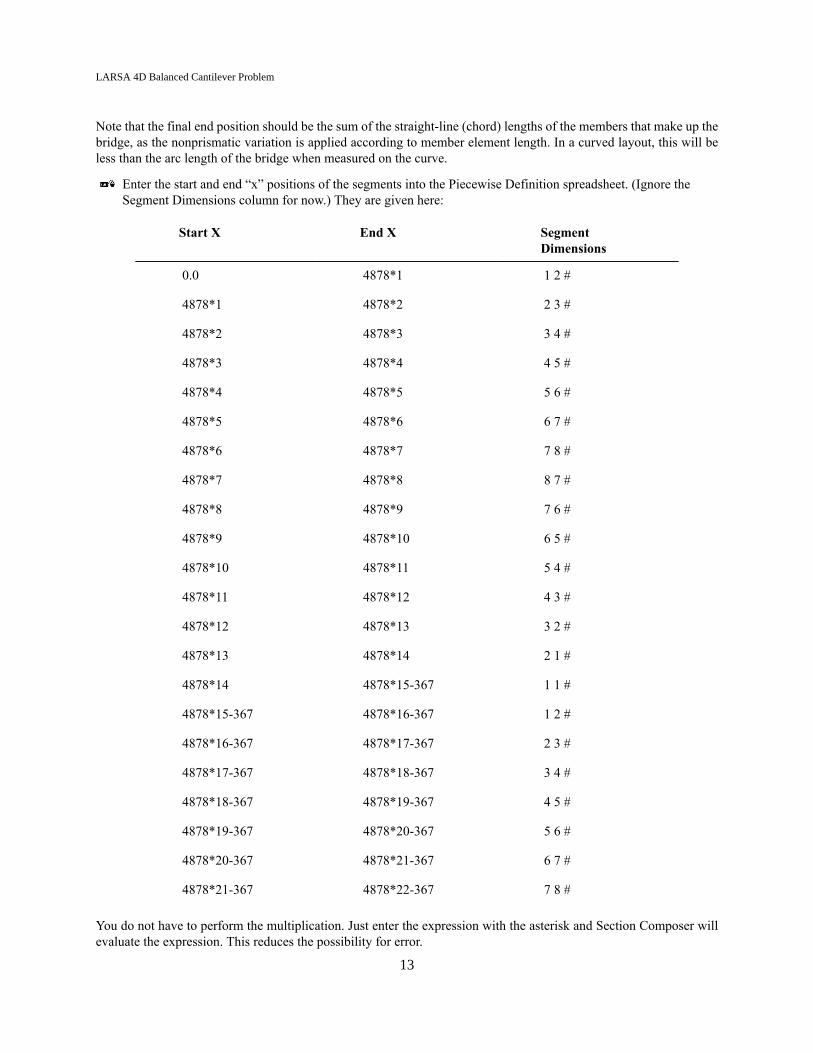
Note that the final end position should be the sum of the straight-line (chord) lengths of the members that make up thebridge, as the nonprismatic variation is applied according to member element length. In a curved layout, this will beless than the arc length of the bridge when measured on the curve.
Enter the start and end “x” positions of the segments into the Piecewise Definition spreadsheet. (Ignore theSegment Dimensions column for now.) They are given here:
Start X End X SegmentDimensions
0.0 4878*1 1 2 #
4878*1 4878*2 2 3 #
4878*2 4878*3 3 4 #
4878*3 4878*4 4 5 #
4878*4 4878*5 5 6 #
4878*5 4878*6 6 7 #
4878*6 4878*7 7 8 #
4878*7 4878*8 8 7 #
4878*8 4878*9 7 6 #
4878*9 4878*10 6 5 #
4878*10 4878*11 5 4 #
4878*11 4878*12 4 3 #
4878*12 4878*13 3 2 #
4878*13 4878*14 2 1 #
4878*14 4878*15-367 1 1 #
4878*15-367 4878*16-367 1 2 #
4878*16-367 4878*17-367 2 3 #
4878*17-367 4878*18-367 3 4 #
4878*18-367 4878*19-367 4 5 #
4878*19-367 4878*20-367 5 6 #
4878*20-367 4878*21-367 6 7 #
4878*21-367 4878*22-367 7 8 #
You do not have to perform the multiplication. Just enter the expression with the asterisk and Section Composer willevaluate the expression. This reduces the possibility for error.
13
LARSA 4D Balanced Cantilever Problem
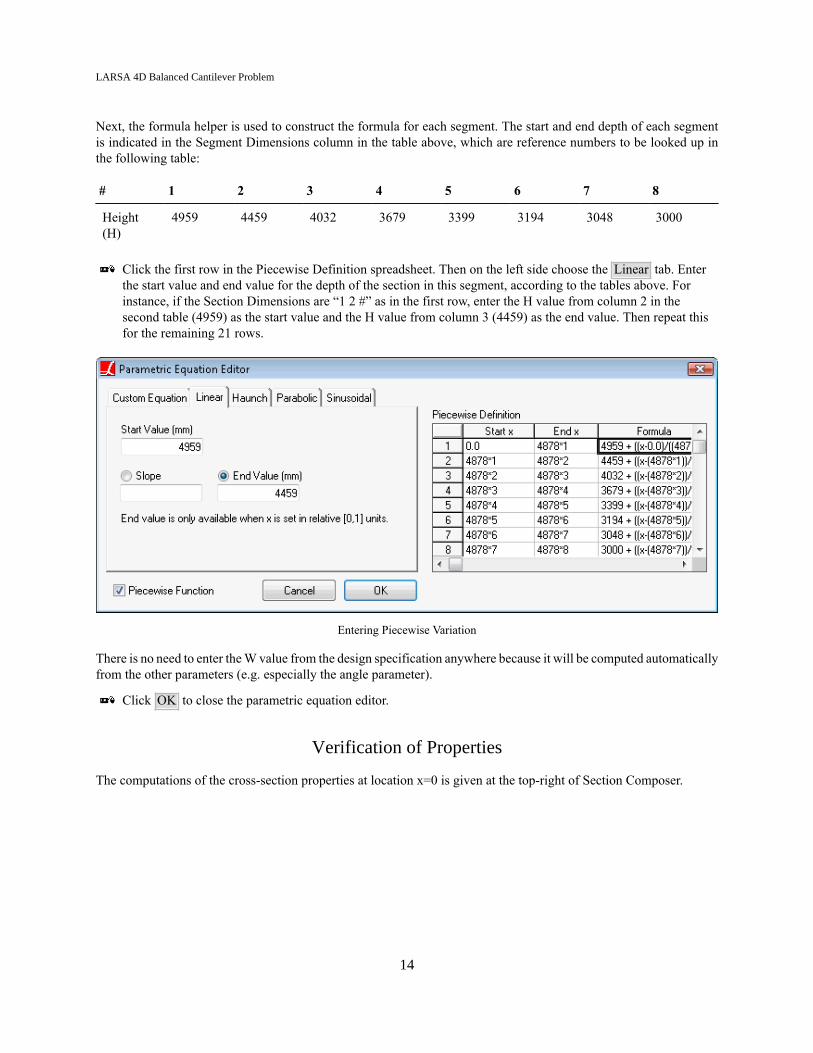
Next, the formula helper is used to construct the formula for each segment. The start and end depth of each segmentis indicated in the Segment Dimensions column in the table above, which are reference numbers to be looked up inthe following table:
# 1 2 3 4 5 6 7 8
Height(H)
4959 4459 4032 3679 3399 3194 3048 3000
Click the first row in the Piecewise Definition spreadsheet. Then on the left side choose the Linear tab. Enterthe start value and end value for the depth of the section in this segment, according to the tables above. Forinstance, if the Section Dimensions are “1 2 #” as in the first row, enter the H value from column 2 in thesecond table (4959) as the start value and the H value from column 3 (4459) as the end value. Then repeat thisfor the remaining 21 rows.
Entering Piecewise Variation
There is no need to enter the W value from the design specification anywhere because it will be computed automaticallyfrom the other parameters (e.g. especially the angle parameter).
Click OK to close the parametric equation editor.
Verification of Properties
The computations of the cross-section properties at location x=0 is given at the top-right of Section Composer.
14

LARSA 4D Balanced Cantilever Problem
Computed Properties
For verification, a comparison of the Section Composer computations converted to inch units and referencespecifications are given in the table below:
Section Composer Design Reference Unit
Area 2.00E+04 1.94E+04 in2
Ycg 7.68E+01 8.21E+01 in
Izz 1.11E+08 1.12E+08 in4
Iyy 5.13E+08 5.08E+08 in4
J 1.95E+08 7.37E+07 in4
Perimeter 2.49E+03 1.58E+03 in
There are two differences between the properties computed by Section Composer and the design reference. SectionComposer includes both the external and internal surface in the computation of perimeter. The notional perimeter fortime-dependent material effects can be adjusted in LARSA 4D. We do not have an explanation for the difference inthe torsion constant at this time.
Save the section database file and then close Section Composer.
15

LARSA 4D Balanced Cantilever Problem
16
LARSA 4D Balanced Cantilever Problem
Properties
In this section we will set up the LARSA 4D project with our chosen units and the material and cross-section propertiesneeded for the model.
Start LARSA 4D and save the project.
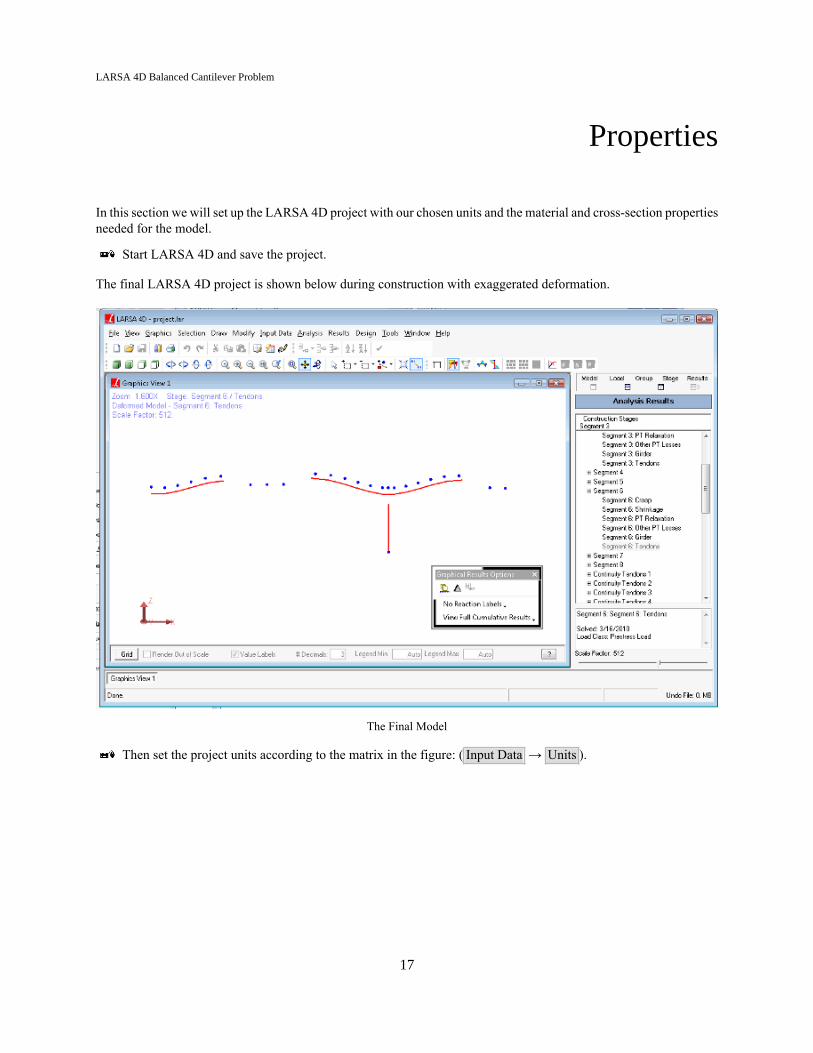
The final LARSA 4D project is shown below during construction with exaggerated deformation.
The Final Model
Then set the project units according to the matrix in the figure: ( Input Data → Units ).
17

LARSA 4D Balanced Cantilever Problem
Project Units
Material Properties
Add the necessary materials to the project ( Input Data → Materials ). We will need a concrete material for thebox girder and a steel material for tendons.
Materials
Although a reinforcement ratio of 2% is given in the design specification for the girder, the contribution ofreinforcement will be ignored. If the location of rebar is known, it can be entered into the Section Composer sectiondefinition and the cross-sectional properties will be factored accordingly. Alternatively, the user may factor the materialproperties.
Materials do not have time-dependent properties by default. To get time-dependent properties, a material must beassigned a Material Time Effect definition. (Additionally, time effect options must be chosen later and a Time-Dependent Staged Construction Analysis must be run.) The Material Time Effect definition contains information usedby the code chosen. For CEB-FIP 90, no additional information is required. Although we will not be providing anytime curves, a Material Time Effect definition must still be created and assigned to the material.
Change to the Material Time Effects tab of the Properties Spreadsheets.
Add a row to the spreadsheet.
18
LARSA 4D Balanced Cantilever Problem
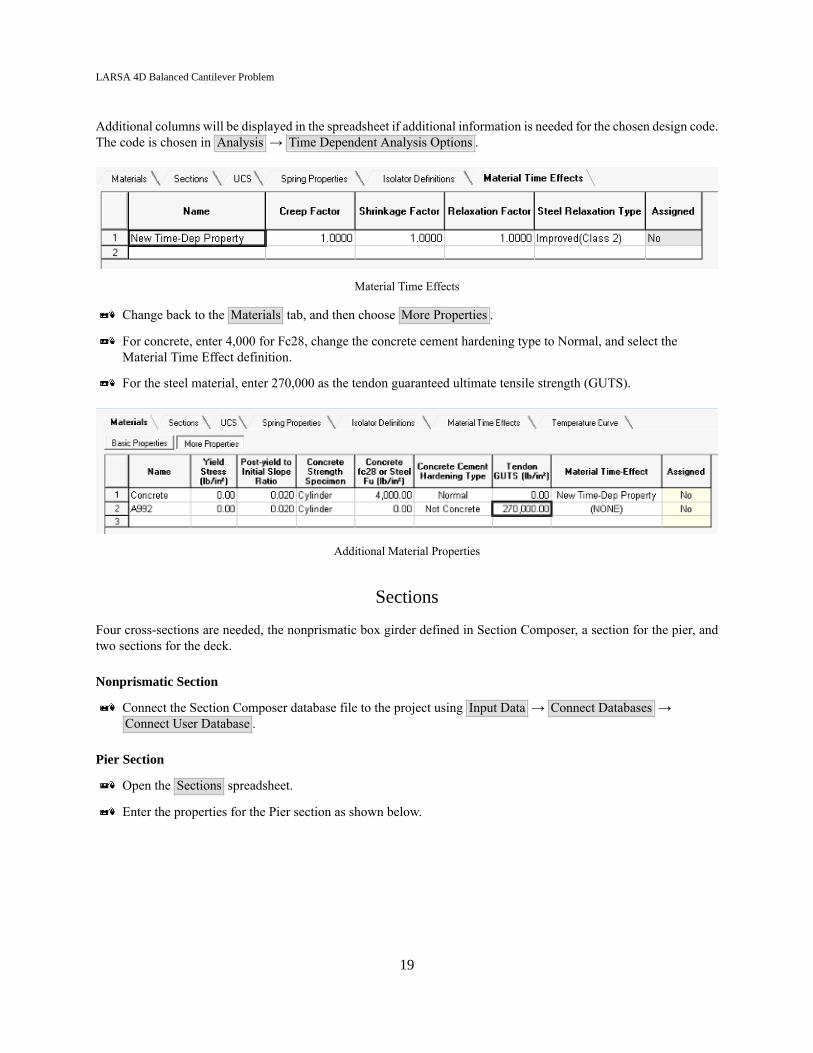
Additional columns will be displayed in the spreadsheet if additional information is needed for the chosen design code.The code is chosen in Analysis → Time Dependent Analysis Options .
Material Time Effects
Change back to the Materials tab, and then choose More Properties .
For concrete, enter 4,000 for Fc28, change the concrete cement hardening type to Normal, and select theMaterial Time Effect definition.
For the steel material, enter 270,000 as the tendon guaranteed ultimate tensile strength (GUTS).
Additional Material Properties
Sections
Four cross-sections are needed, the nonprismatic box girder defined in Section Composer, a section for the pier, andtwo sections for the deck.
Nonprismatic Section
Connect the Section Composer database file to the project using Input Data → Connect Databases →Connect User Database .
Pier Section
Open the Sections spreadsheet.
Enter the properties for the Pier section as shown below.
19
LARSA 4D Balanced Cantilever Problem
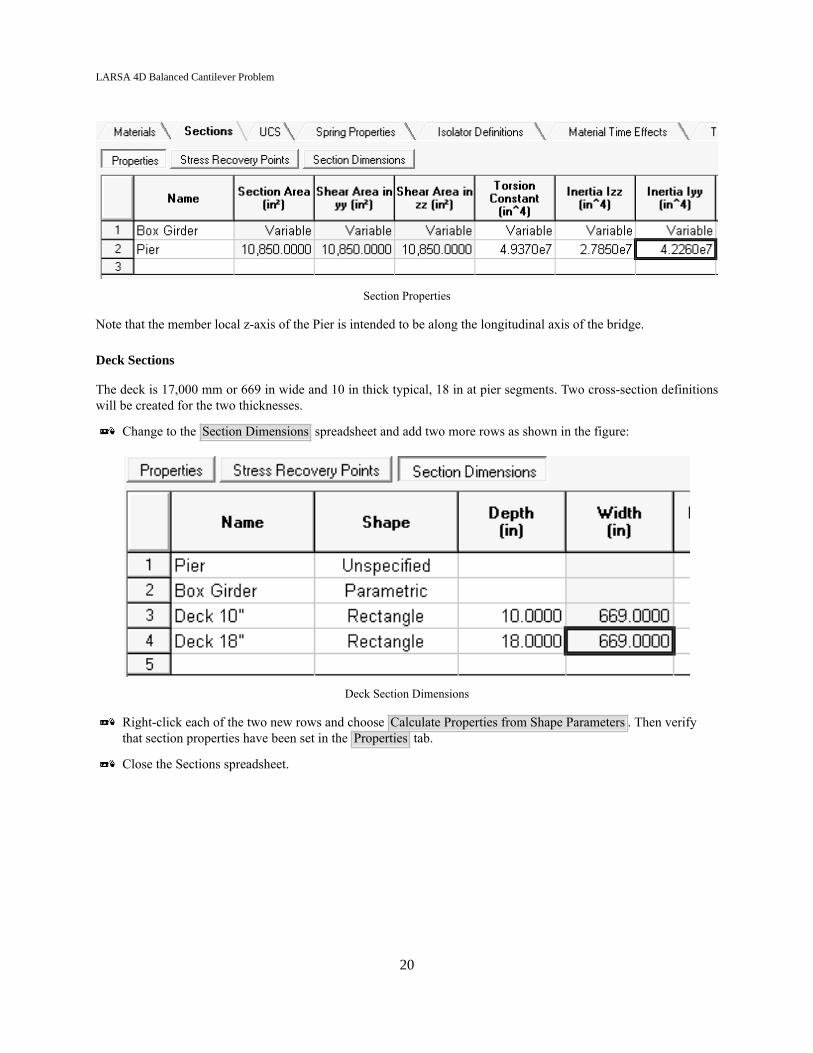
Section Properties
Note that the member local z-axis of the Pier is intended to be along the longitudinal axis of the bridge.
Deck Sections
The deck is 17,000 mm or 669 in wide and 10 in thick typical, 18 in at pier segments. Two cross-section definitionswill be created for the two thicknesses.
Change to the Section Dimensions spreadsheet and add two more rows as shown in the figure:
Deck Section Dimensions
Right-click each of the two new rows and choose Calculate Properties from Shape Parameters . Then verifythat section properties have been set in the Properties tab.
Close the Sections spreadsheet.
20

LARSA 4D Balanced Cantilever Problem
Bridge Geometry
In this section we will set up the geometry of the bridge, including:
• Bridge Path Coordinate Systems for horizontal and vertical alignment
• Spreadsheets to add joints and members
• Apply Formula in the spreadsheets to set joint numbers and coordinates
• Setting member orientation angles for superelevation
• Setting member orientation angles for piers
• Applying nonprismatic variation over a multi-member girder
• Deck as beam elements with member end offsets
Bridge Alignment
The bridge consists of a complete 231’4” span and a 119’4” cantilever. The bridge is aligned on a circular curvewith a 2952.76 ft radius. The vertical profile is a crest curve with a grade of 3.5% at the start and -3.0% at the end.Superelevation varies from 0% at the start to 5% at the end.
This alignment can be entered into a Bridge Path Coordinate System. This type of user coordinate system providesstation-elevation-offset axes within which to create bridge geometry, rather than x/y/z axes.
Open the Model Data Explorer and change to the CoorSystems panel. Then click the plus-sign button to createa new user coordinate system.
Change the name to “Bridge Alignment” and the type of the coordinate system to Bridge Path, and then clickEdit Path .
To create a circular curve, the user must enter the station number at the start and end of the curve, the heading at thestart and end of the curve, and a curve type. In this case, the station number at the start will be zero, but any numbermay be used.
Headings can be directions taken from survey plans (e.g. N 20 30 00 E), or arbitrary angles counterclockwise fromthe global x-axis. Since no surveyor directions are provided in the design specification of this model, we will treat thestart of the bridge as having a heading of zero. We have been given the length of the curve and its radius, from whichthe angle at the end can be computed (350’8” / 2952.76 * 180/pi ~ 6.8 degrees).
Enter the information shown in the top left spreadsheet in the figure:
21

LARSA 4D Balanced Cantilever Problem
Horizontal Profile
The diagram at the bottom will show a preview of the horizontal geometry. It also shows the radius of curvaturecomputed from the stations and headings, which can be used as a check that the computation of the heading was correct.
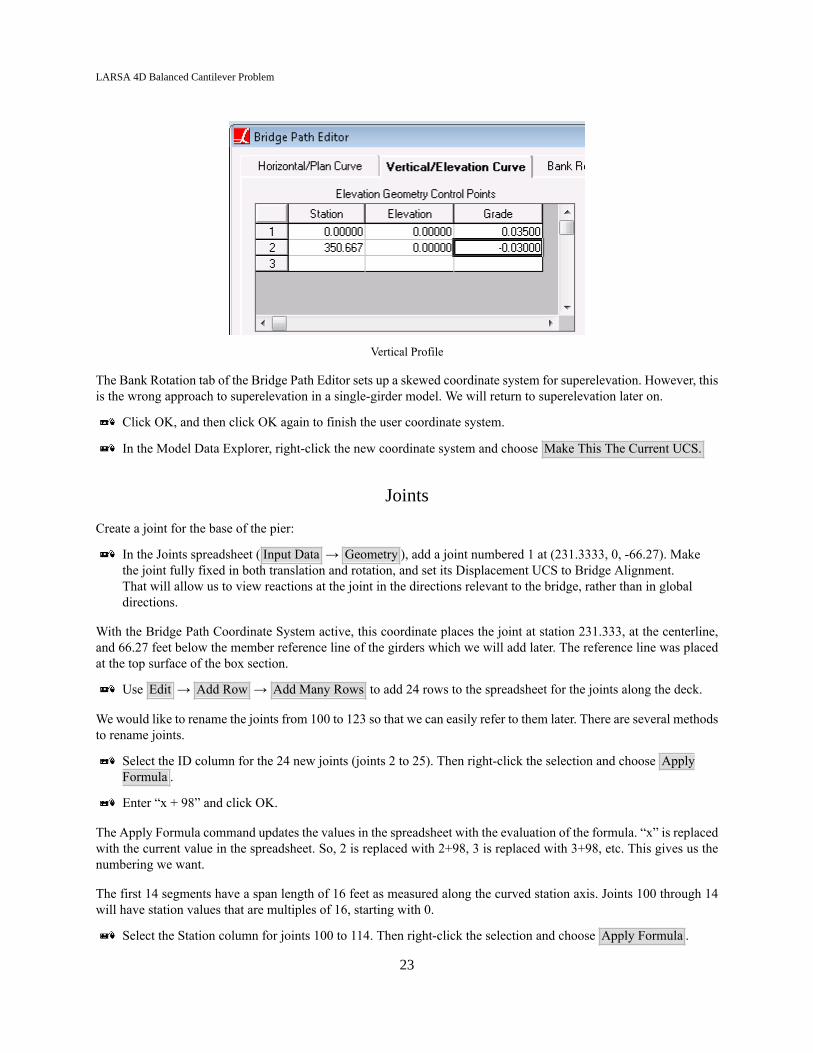
Change to the Vertical/Elevation Curve tab.
To create a parabolic vertical profile, it is only necessary to enter the station, elevation, and grade at the start and endof the profile.
Enter the information shown in the figure:
22
LARSA 4D Balanced Cantilever Problem
Vertical Profile
The Bank Rotation tab of the Bridge Path Editor sets up a skewed coordinate system for superelevation. However, thisis the wrong approach to superelevation in a single-girder model. We will return to superelevation later on.
Click OK, and then click OK again to finish the user coordinate system.
In the Model Data Explorer, right-click the new coordinate system and choose Make This The Current UCS.
Joints
Create a joint for the base of the pier:
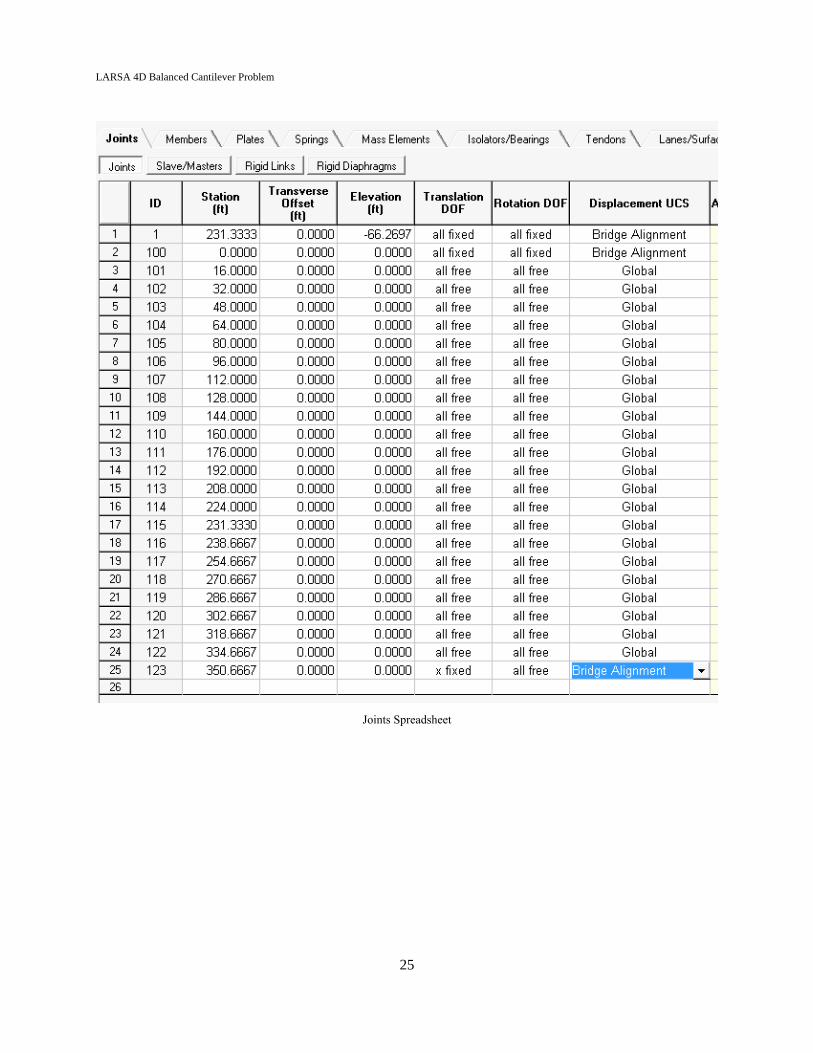
In the Joints spreadsheet ( Input Data → Geometry ), add a joint numbered 1 at (231.3333, 0, -66.27). Makethe joint fully fixed in both translation and rotation, and set its Displacement UCS to Bridge Alignment.That will allow us to view reactions at the joint in the directions relevant to the bridge, rather than in globaldirections.
With the Bridge Path Coordinate System active, this coordinate places the joint at station 231.333, at the centerline,and 66.27 feet below the member reference line of the girders which we will add later. The reference line was placedat the top surface of the box section.
Use Edit → Add Row → Add Many Rows to add 24 rows to the spreadsheet for the joints along the deck.
We would like to rename the joints from 100 to 123 so that we can easily refer to them later. There are several methodsto rename joints.
Select the ID column for the 24 new joints (joints 2 to 25). Then right-click the selection and choose ApplyFormula .
Enter “x + 98” and click OK.
The Apply Formula command updates the values in the spreadsheet with the evaluation of the formula. “x” is replacedwith the current value in the spreadsheet. So, 2 is replaced with 2+98, 3 is replaced with 3+98, etc. This gives us thenumbering we want.
The first 14 segments have a span length of 16 feet as measured along the curved station axis. Joints 100 through 14will have station values that are multiples of 16, starting with 0.
Select the Station column for joints 100 to 114. Then right-click the selection and choose Apply Formula .
23
LARSA 4D Balanced Cantilever Problem
Enter “row * 16” and click OK.
While the “x” variable gives the value currently in the cell, the “row” variable simply gives consecutive numbersstarting at 0. This time, for joint 100 we get 0*16; for joint 101 we get 1*16; and so on.
Joint 115 is above the pier. Set its station to 231.3333.
Joints 116 to 123 are spaced at 16 ft again. Use the Apply Formula tool with “238.6667 + row*16”.
Set joint 100 to be fully fixed in translation and rotation (otherwise the left half of the first span will haverigid body motion before closure), and set the last joint (joint 123) to be fixed in x-translation. Set both joints’Displacement UCS to Bridge Alignment.
The elevation field can be left at zero for all of the joints but the base of the pier. Because they are aligned with respectto the bridge path coordinate system, they will automatically follow the crest curve.
24
LARSA 4D Balanced Cantilever Problem
Joints Spreadsheet
25
LARSA 4D Balanced Cantilever Problem
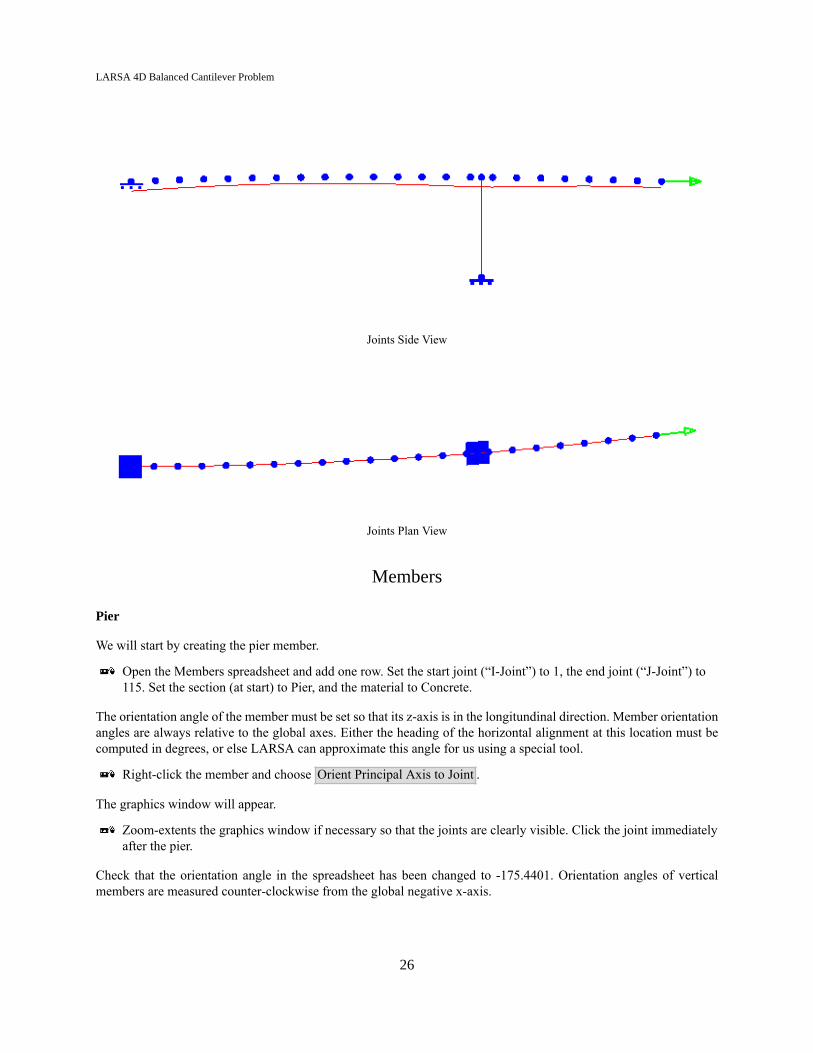
Joints Side View
Joints Plan View
Members
Pier
We will start by creating the pier member.
Open the Members spreadsheet and add one row. Set the start joint (“I-Joint”) to 1, the end joint (“J-Joint”) to115. Set the section (at start) to Pier, and the material to Concrete.
The orientation angle of the member must be set so that its z-axis is in the longitundinal direction. Member orientationangles are always relative to the global axes. Either the heading of the horizontal alignment at this location must becomputed in degrees, or else LARSA can approximate this angle for us using a special tool.
Right-click the member and choose Orient Principal Axis to Joint .
The graphics window will appear.
Zoom-extents the graphics window if necessary so that the joints are clearly visible. Click the joint immediatelyafter the pier.
Check that the orientation angle in the spreadsheet has been changed to -175.4401. Orientation angles of verticalmembers are measured counter-clockwise from the global negative x-axis.
26

LARSA 4D Balanced Cantilever Problem
Pier Orientation Angle
Create a structure group for the pier member. You can use the Structure Group column of the Membersspreadsheet or the Structure Groups Explorer. To use the Structure Groups Explorer: 1) Unselect All ( Selection→ Unselect Objects → Unselect All ), 2) select the pier element, 3) click the Add Group button in theStructure Groups Explorer to create the group, 4) click the group and rename it to “Pier”.
Girder
Create members for the girder numbered 100 to 122. Use the drawing tools or the spreadsheet. Set the sectionto Box Girder and the material to Concrete.
Normally the orientation angle of horizontal members is set to 90. Because the superelevation varies from 0 to 5%,the member orientation angle must be set to vary accordingly. Although we have a Bridge Path Coordinate System, itcannot be used to help set up the member orientation angle necessary for superelevation.
A member cannot twist along its length in its undeformed state, so the orientation angle for each member will be setaccording to the superelevation at the member’s midpoint. The superelevation is given as a grade, but the orientationangle must be given as an angle, so it must be converted using the arc tangent function. Finally, the sign conventionof the orientation angle is such that the angle should be decreasing from 90 degrees at the start to 90 - tan-1(.05) at theend. This computation can be best done in Excel and then copied into the LARSA 4D spreadsheet.
Fill in the member orientation angles.
27

LARSA 4D Balanced Cantilever Problem
Member Orientation Angles
You may notice the uneven drawing of the members in the graphics window:
28

LARSA 4D Balanced Cantilever Problem
Members - Without proper nonprismatic variation
This results from the current state of the nonprismatic variation. What we see is the initial 16 feet of variation repeatedfrom member to member, rather than the entire 351 ft function of variation continuing smoothly across the members.That is because LARSA 4D must be told over what sequence of members the variation runs through. To do this, wecreate a Span definition.
Unselect All. ( Selection → Unselect Objects → Unselect All )
With the Pointer tool, right-click a girder member. Choose Select Chain .
Go to Draw → From Selected Members → Span .
The graphics will update to show the smooth variation of the centroid from the start to the end of the bridge. You cansee it better with complete rendering turned on ( Graphics menu).
Members - Nonprismatic variation fixed
While the girder members are all selected, create a Structure Group for them named “Girder”.
Deck
The deck has exactly the same connectivity as the girder. It differs only in cross-sectional properties and a z-offset toshift the centroid of the deck up so that the bottom surface of the deck is flush with the top surface of the girder.
The easiest way to create the deck is then to duplicate the girder geometry.
In the Members spreadsheet, select the range of cells starting with the I-Joint column in the row for the firstgirder segment (member 100) to the Orientation Angle column of the last girder member. Then copy it to theclipboard.
The ID column is skipped because if we try to paste the same IDs into the spreadsheet in new rows, LARSA 4D willshow an error that two members cannot have the same ID.
29

LARSA 4D Balanced Cantilever Problem
Click the I-Joint column in the last, blank row of the spreadsheet. Then paste the clipboard.
New joints are created with IDs 123 to 145. We will need to change the IDs and the section.
Select the new range of IDs. Use the Apply Formula command again to renumber these from 200 to 222. Theformula is “x+77”.
Select the range of Section at Start for the new members and use the cell range tool in the toolbar to change thesection to Deck 10".
Now revise the section for members 214 and 215 to have the section Deck 18". (These are the members abovethe pier. You can tell from the Length column.)
Scroll over to the right end of the spreadsheet and select the range of Structure Group cells for the newmembers. Use the cell range tool in the toolbar to change the group to New Group. Click the update checkmark.Enter the name “Deck” when asked and then verify that the new members are in the Deck group.
The deck is currently placed so that its centroid is level with the joints, which in turn is level with the girder’s topsurface.
Change to the Member End Offsets tab. For members 200-213 and 216-222, enter a Z Offset at Start and atEnd of 0.4166, which is half the depth of the section converted to feet. For members 214 and 215, use 0.75 ft.
Pier, Girder, and Deck Members
Pier Offset
Note in the figure above that the pier passes straight through the girder centroid. This is adding extra mass to the model.A member end offset must be added to the pier as well so that it ends below the girder. The depth of the girder at thepier is 16.25 ft. The pier was defined from the base to the girder, so its J-end is the end that needs to be updated.
Set the J-Offset for member 1, the pier member, to -16.25.
30

LARSA 4D Balanced Cantilever Problem
Pier member with corrected offset
Integrity Check
At this point it is useful to run an initial integrity check ( Input Data menu) and analysis on the model to make surethat everything entered up to this point makes sense. You can ignore warnings about members spanning the same pairof joints, but verify that the warnings refer to the girder and deck elements and that the design was intentional.
To run an analysis, create a simple self weight static load case.
Open the Load Cases Explorer and add a new load case. Right click the load case and choose Properties .
Set the name, self weight options, and load class as in the figure:
31

LARSA 4D Balanced Cantilever Problem
Self Weight Load Case
The load class option is not needed now but will be necessary for creating code-based load combinations for stagedconstruction results later.
Run a Linear Static Analysis and make sure the results make sense.
32
LARSA 4D Balanced Cantilever Problem
Staged Construction
In this section we will set up the Staged Construction Analysis using:
• Structure Groups for each part of the structure constructed at a different time
• Construction stages for each day of construction
• Construction steps in which each construction or loading activity is placed
About LARSA 4D’s Staged Construction Analysis
Geometric Nonlinearity
LARSA 4D’s Standard and Time-Dependent Staged Construction Analysis is a nonlinear analysis including bothmaterial and geometric nonlinearity from step to step. The analysis has been used for a wide variety of cable-supportedstructures which rely on a robust nonlinear engine.
Load Class Tracking
Although code-based load combinations are straightforward in an analysis where load cases are analyzedindependently, the user must be sensitive to how their software handles load class tracking in a staged constructionanalysis. This is especially true for support, slave/master, and element deconstruction activities which involveredistribution of existing cumulative forces. LARSA 4D’s staged analysis accurately tracks load classes for the resultsof these construction activities using a special balanced removal technique. More information on load class trackingis available in other documentation.
Related Tools
Several other special tools are available for this analysis type. For instance, it is possible to export an animation of theconstruction sequence with the model fully rendered with cross-section shapes. A special General Model Optimizationtool can be used to find starting conditions that produce the desired final model geometry at the end of construction.This can been used to find initial cable jacking forces or initial camber.
Segment Groups
The bridge is constructed in a balanced cantilever fashion radiating from the pier as well as the left abutment. Thedeck will be poured at the end of construction.
In order to create a construction sequence, the elements of the model must be separated into Structure Groupscorresponding to the day of their construction. There are eight steps in the construction of this bridge, which we willcall S1 through S8.
Open the Structure Groups Explorer.
Add a folder and name it “Segments”.
Then add eight groups into the folder named S1, S2, etc.
33
LARSA 4D Balanced Cantilever Problem
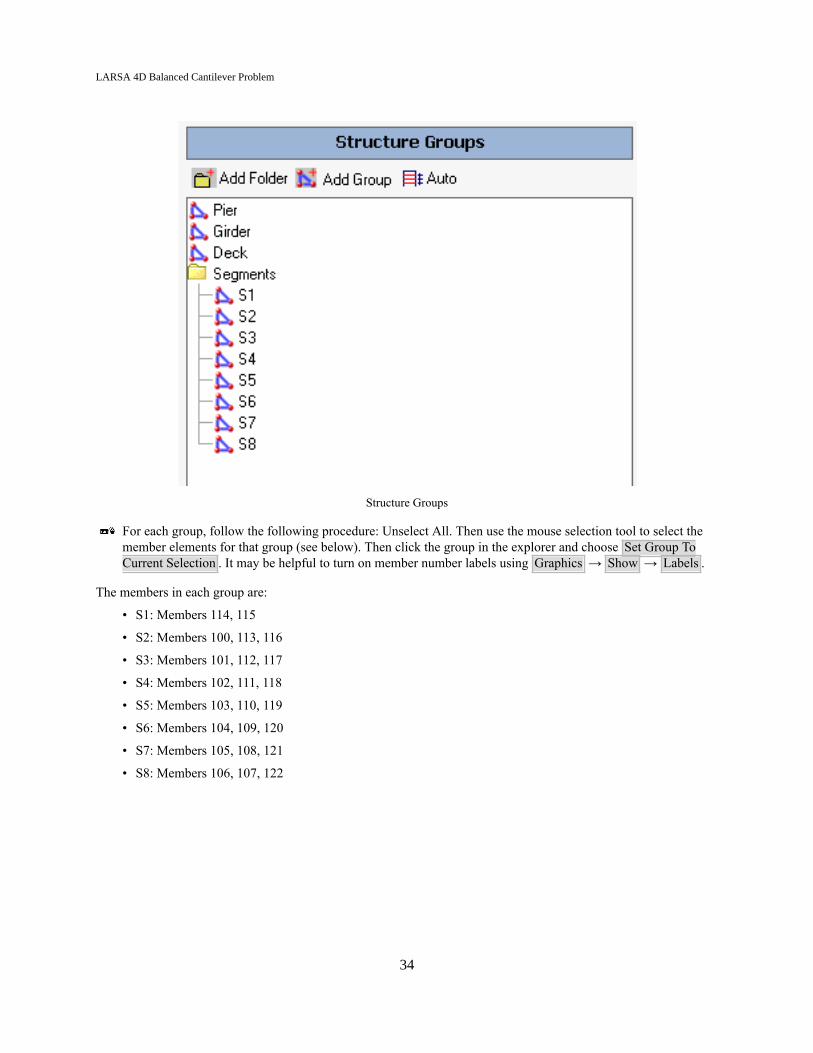
Structure Groups
For each group, follow the following procedure: Unselect All. Then use the mouse selection tool to select themember elements for that group (see below). Then click the group in the explorer and choose Set Group ToCurrent Selection . It may be helpful to turn on member number labels using Graphics → Show → Labels .
The members in each group are:
• S1: Members 114, 115
• S2: Members 100, 113, 116
• S3: Members 101, 112, 117
• S4: Members 102, 111, 118
• S5: Members 103, 110, 119
• S6: Members 104, 109, 120
• S7: Members 105, 108, 121
• S8: Members 106, 107, 122
34

LARSA 4D Balanced Cantilever Problem
Elements for S4
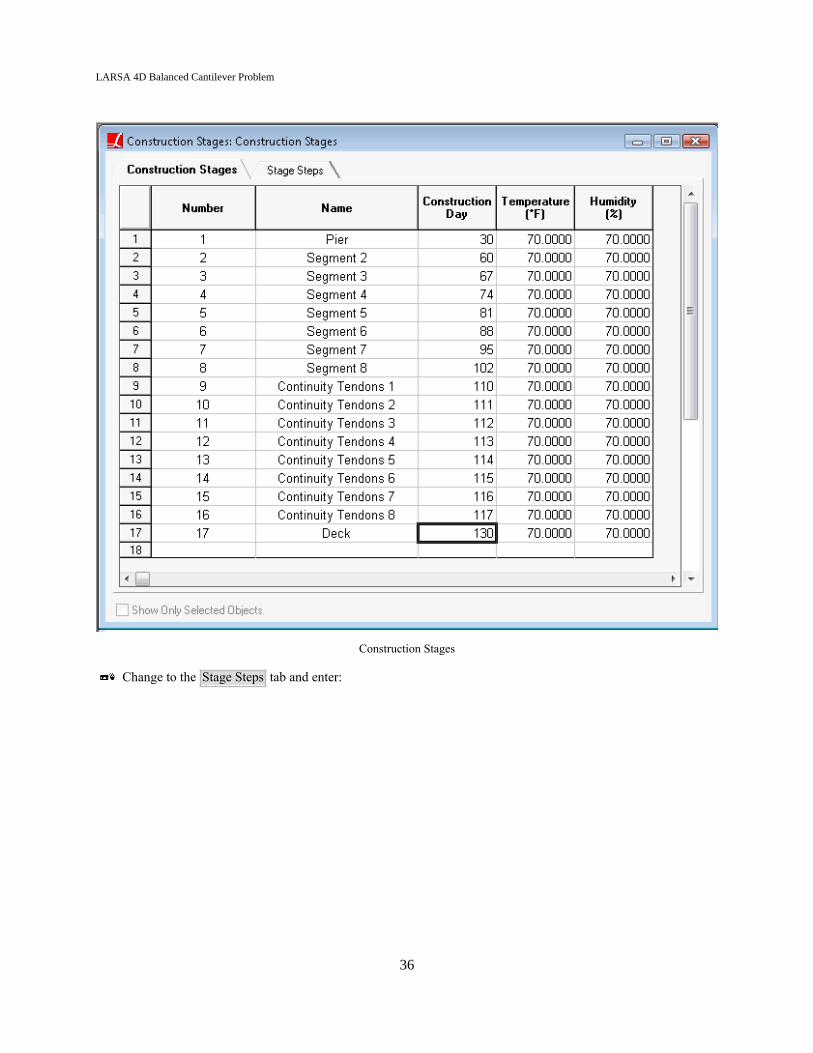
Construction Stages
Each day of construction is represented by a “Construction Stage”. Within each stage there can be multiple separate“Construction Steps” which are analyzed as separate result cases (with the state of the structure kept from one stepto the next).
Open Input Data → Construction Stages .
Enter the information shown in the figure:
35
LARSA 4D Balanced Cantilever Problem
Construction Stages
Change to the Stage Steps tab and enter:
36
LARSA 4D Balanced Cantilever Problem
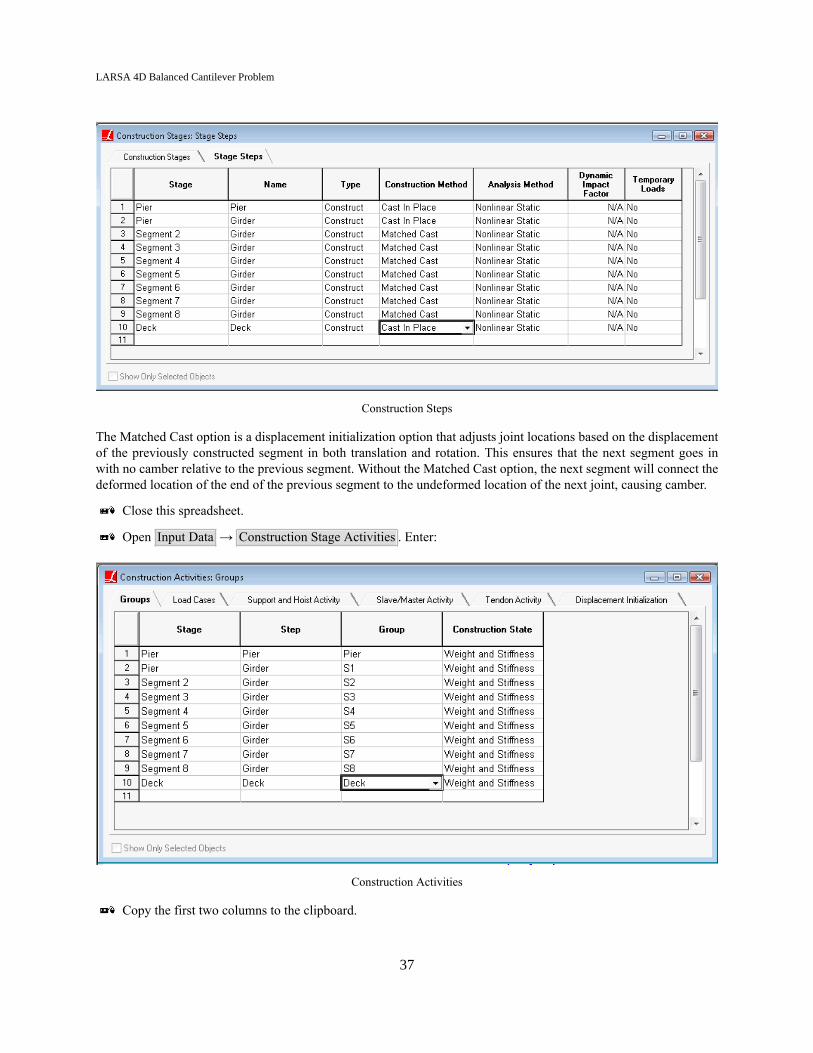
Construction Steps
The Matched Cast option is a displacement initialization option that adjusts joint locations based on the displacementof the previously constructed segment in both translation and rotation. This ensures that the next segment goes inwith no camber relative to the previous segment. Without the Matched Cast option, the next segment will connect thedeformed location of the end of the previous segment to the undeformed location of the next joint, causing camber.
Close this spreadsheet.
Open Input Data → Construction Stage Activities . Enter:
Construction Activities
Copy the first two columns to the clipboard.
37

LARSA 4D Balanced Cantilever Problem
Change to the Load Cases tab and paste in the data on the clipboard. Then change the Load Case column to“SW”, which is the self-weight load case created earlier.
Construction Activities
Self-weight must be applied in every construction step in which new members are constructed if their self-weight isto be included.
At this point it is possible to run a Staged Construction Analysis to verify that the model is being assembled properlyso far. Tendons and time-dependent effects have not yet been included. Additional loading such as for diaphragms canbe included as additional static loading in the same manner as the self weight load case but included just in the stagein which the loading is applied.
Go to Analysis → Staged Construction Analysis .
38

LARSA 4D Balanced Cantilever Problem
Running Staged Construction Analysis
If you do not uncheck Perform Quick Integrity Check , you will be notified of some warnings. The warningsshown below can be ignored. If you encounter other errors or warnings, the model has not been enteredcorrectly.
39

LARSA 4D Balanced Cantilever Problem
Integrity Check Warnings Which Can Be Ignored
Turn off Perform Quick Integrity Check before the next run.
40

LARSA 4D Balanced Cantilever Problem
Defining Tendons
In this section we will set up tendons for post-tensioning. We will cover:
• How to name tendons
• Entering tendon geometry in the spreadsheets, for tendons without smooth curvature
• Jacking tendons in a Staged Construction Analysis construction activity
Tendon Geometry
There are 44 tendons in this model. The tendons are placed symmetrically about the bridge centerline and are locatedwithin either the top or bottom slab of the box, at the slab’s centroid. The layout is given in the figure:
Tendon Layout
The first thing to do when entering tendons is to choose a naming scheme. The sixteen closure tendons will start with“C1” for those in the left closer and “C2” for those in the right closure at the end of the cantilever. They are thennumbered numerically, with an “L” or “R” suffix to indicate whether they are on the left or right side (transversely)of the girder. These tendons are “C1-1-L”, “C1-1-R”, “C1-2-L”, etc.
The remaining tendons are constructed during the segmental construction and are named according to the segmentalstage during which they are stressed (“S2”, “S3”, etc.). They are labeled by whether they are over the abutment (“A”)or pier (“P”), and then whether they are on the left or right transverse side. These tendons are named “S2-A-L”, “S2-A-R”, “S3-A-L”, etc.
To start the first tendon, open the Geometry → Tendons spreadsheet.
Add a row to the spreadsheet. Give the tendon the name “S2-A-L”, set its material to A992, its strand areato 0.2827 (in2, per strand), its number of strands to 27, its jacking force at start to 1,546 kip, its anchor set to0.375, and its wobble friction coefficient to 0.0002.
Tendons can be jacked at the start, the end, or on both ends. We assume that the tendons are all jacked on their left side.41
LARSA 4D Balanced Cantilever Problem
A curvature friction coefficient could be entered but it is not called for in this problem. Additionally, peak stress ratios,specified separately for tendon ends and interior points, can be used to validate that the jacking force is within bounds.
Right-click the tendon and choose Path Spreadsheet .
The path spreadsheet is one way to enter tendon geometry. In this spreadsheet, control points along the tendon’s profileare entered. A minimum of two control points are always used, one for the start and one for the end of the tendon.Control points are given in member reference coordinates, which makes it straightforward to enter a tendon’s locationin a curved system. LARSA 4D also provides the ability to add points relative to points on the section marked as thefirst or third stress recovery point. These points are usually placed at the extreme points on a section and allow tendonsto be placed relative to the top or bottom face of a nonprismatic section using its cover distance.
The tendons in this model do not have any smooth curvature. However, LARSA 4D does support circular and paraboliccurve fitting options.
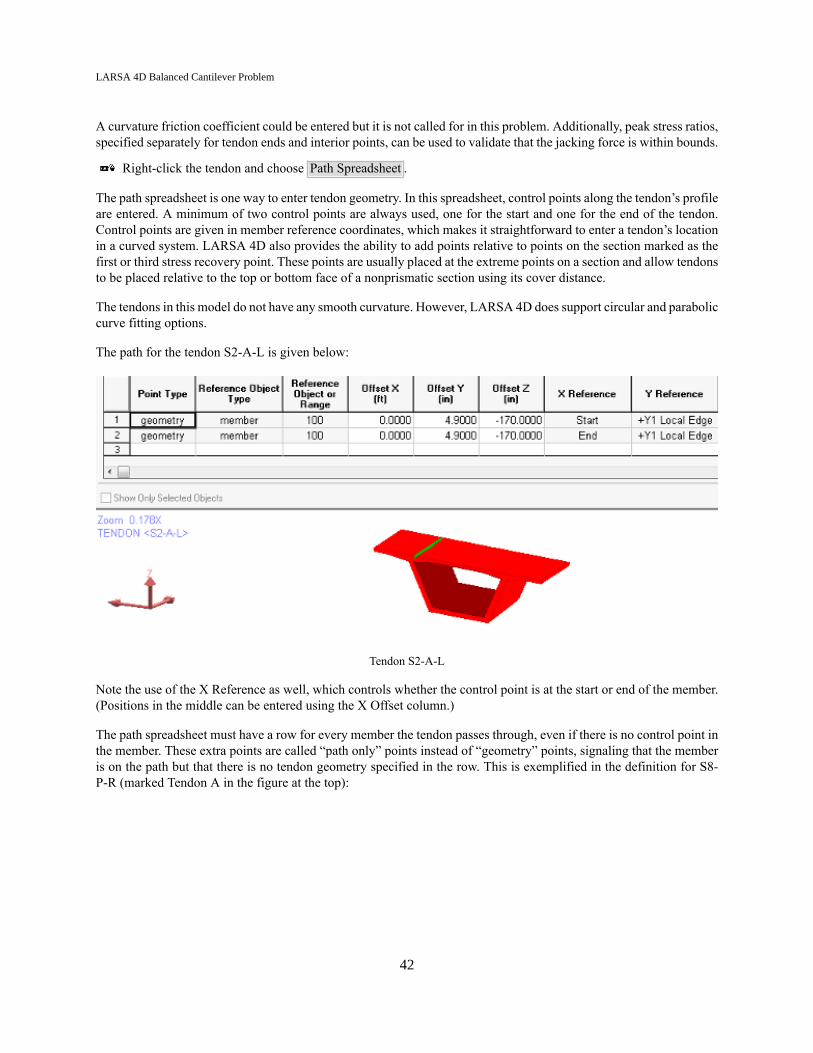
The path for the tendon S2-A-L is given below:
Tendon S2-A-L
Note the use of the X Reference as well, which controls whether the control point is at the start or end of the member.(Positions in the middle can be entered using the X Offset column.)
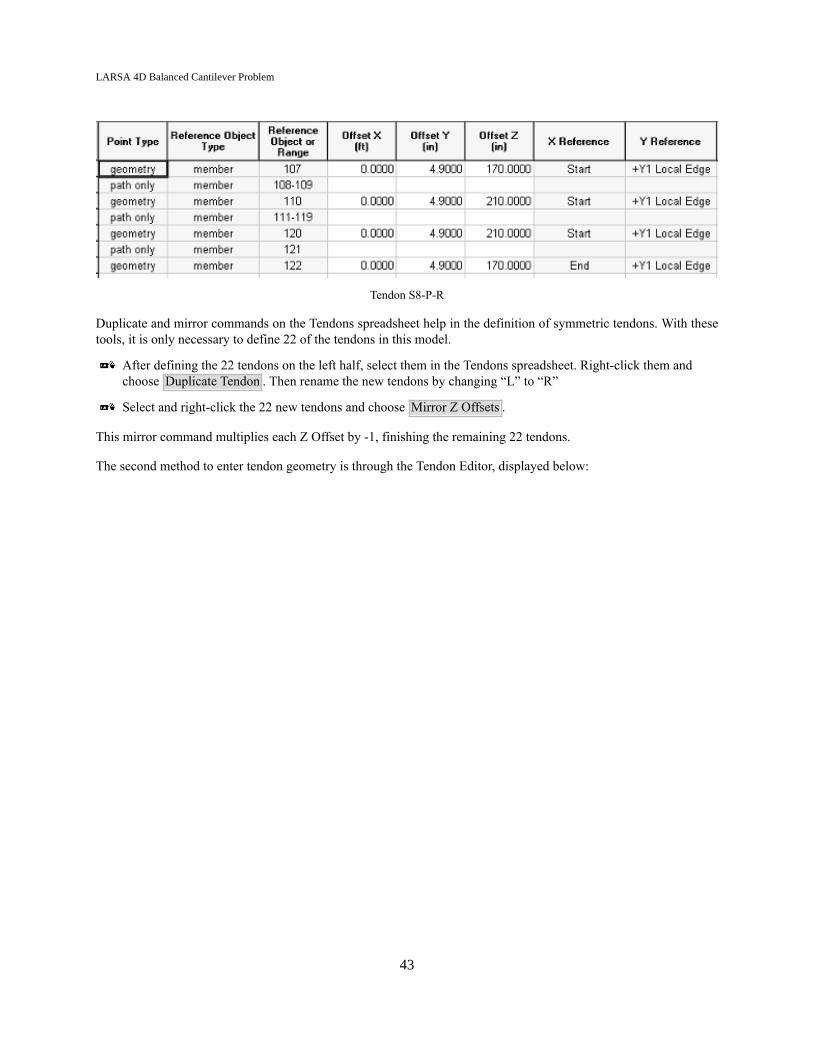
The path spreadsheet must have a row for every member the tendon passes through, even if there is no control point inthe member. These extra points are called “path only” points instead of “geometry” points, signaling that the memberis on the path but that there is no tendon geometry specified in the row. This is exemplified in the definition for S8-P-R (marked Tendon A in the figure at the top):
42
LARSA 4D Balanced Cantilever Problem
Tendon S8-P-R
Duplicate and mirror commands on the Tendons spreadsheet help in the definition of symmetric tendons. With thesetools, it is only necessary to define 22 of the tendons in this model.
After defining the 22 tendons on the left half, select them in the Tendons spreadsheet. Right-click them andchoose Duplicate Tendon . Then rename the new tendons by changing “L” to “R”
Select and right-click the 22 new tendons and choose Mirror Z Offsets .
This mirror command multiplies each Z Offset by -1, finishing the remaining 22 tendons.
The second method to enter tendon geometry is through the Tendon Editor, displayed below:
43

LARSA 4D Balanced Cantilever Problem
Tendon Editor
The Tendon Editor can be started for an existing tendon by right-clicking it and choosing Edit . Alternatively, a newtendon can be created by first selecting (just) the members in which the tendon passes through in the graphics window.Then use Draw → From Selected Members → Tendon .
From both the Tendon Editor and the Path Spreadsheet it is possible to get a graph of the short term forces in thetendon, including before and after anchor set:
44

LARSA 4D Balanced Cantilever Problem
Tendon Short Term Forces
The weight of tendons is not considered.
Close the Tendons spreadsheet.
Tendon Construction Activities
With the geometry of the tendons defined, they must be added to the staged construction analysis with tendon stressingactivities.
Open Input Data → Construction Stages → Stage Steps .
Insert rows into the construction sequence for Segment 2 through Segment 8, after the girder step, for stressingtendons.
Rename the new steps from “New Step” to “Tendons”.
Add eight new steps between “Segment 8 -- Tendons” and “Deck -- Deck” for the continuity tendons. Thereshould be one step for each continuity tendons stage.
Additional Construction Steps for Tendons
45

LARSA 4D Balanced Cantilever Problem
Close the Stage Steps spreadsheet.
Open Input Data → Construction Stage Activities → Tendon Activities .
A row must be added to this spreadsheet for each tendon to be stressed, giving the stage and step in which it is stressed.
Go back to the Tendons spreadsheet. Sort the tendons spreadsheet on the name of the tendon. This will put thetendons in order of their construction. Then select the names of the “S” tendons and copy them to the clipboard.
In the Tendon Activities spreadsheet, click the empty cell below the Tendon column header and then paste fromthe clipboard to fill in the spreadsheet with the names of the tendons in the right order. Afterwards fill in thefirst two columns.
Repeat the procedure to get the “C1” and “C2” tendon names and paste them at the bottom of the TendonActivities spreadsheet.
Assemble them two per day (stage).
46

LARSA 4D Balanced Cantilever Problem
Tendon Stressing Activities
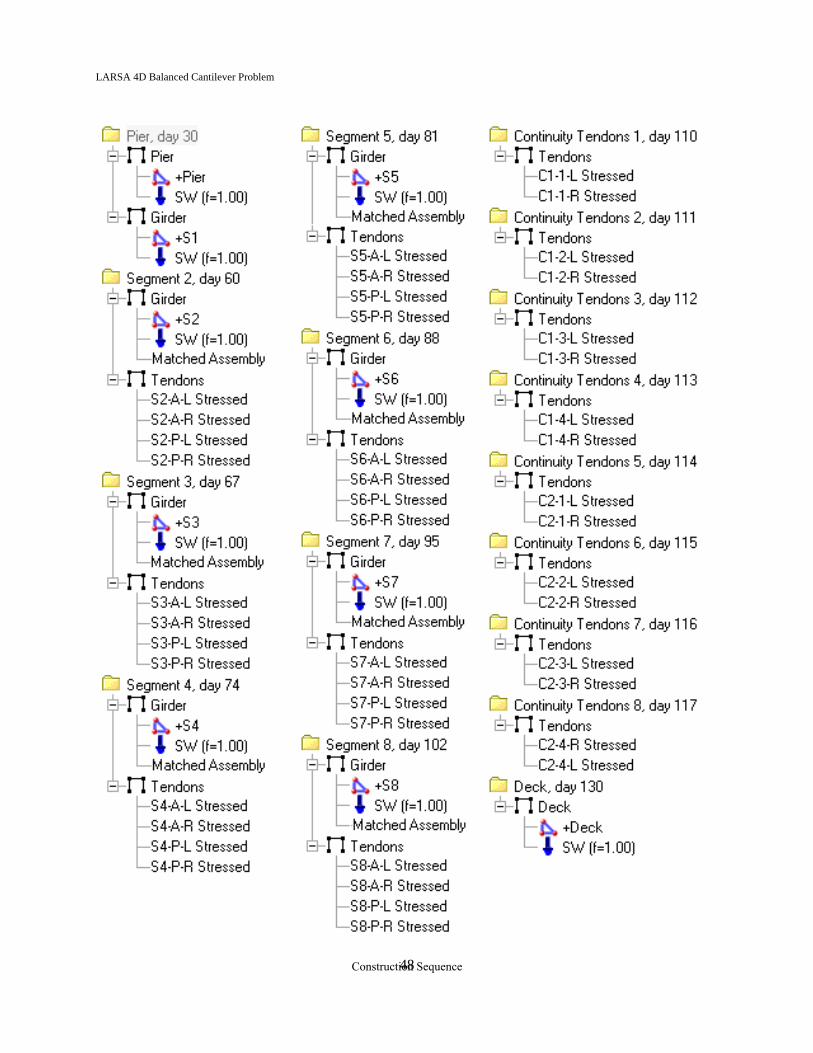
The construction sequence shown in the Construction Stages Explorer is given below:
47
LARSA 4D Balanced Cantilever Problem
Construction Sequence48

LARSA 4D Balanced Cantilever Problem
After another Staged Construction Analysis run, it is possible to step through the results to verify that the model isworking as expected. We will return to tendon results later on.
49

LARSA 4D Balanced Cantilever Problem
50
LARSA 4D Balanced Cantilever Problem
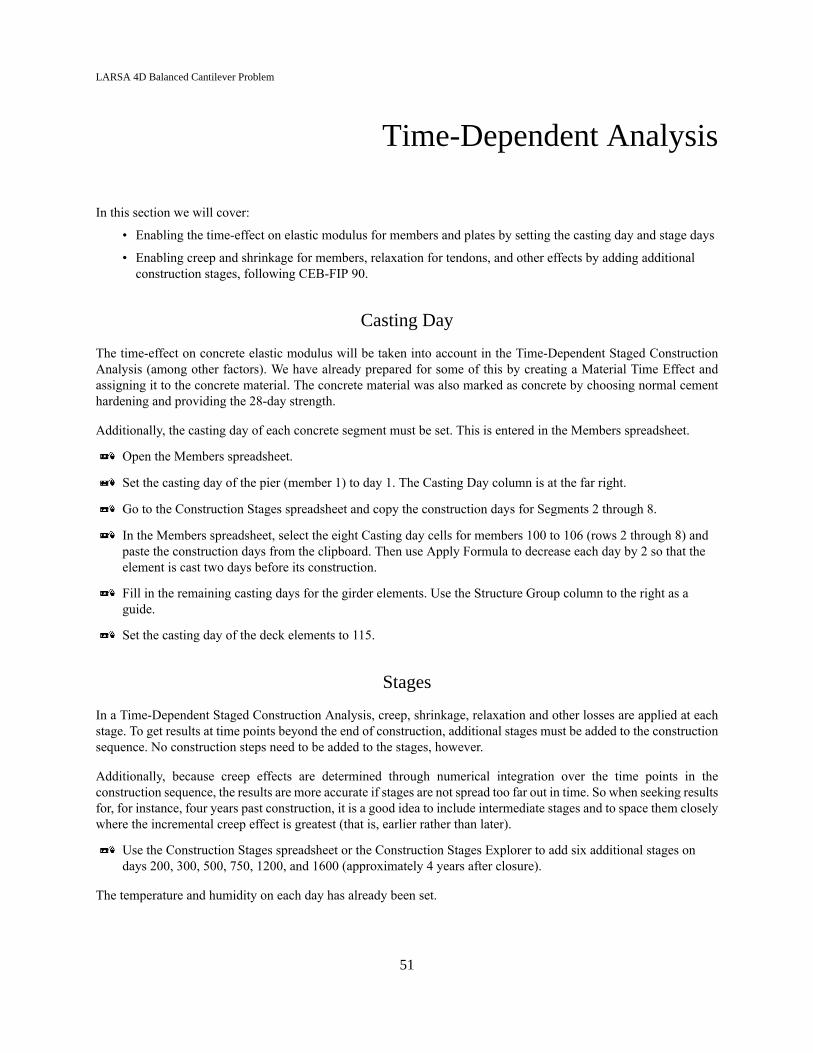
Time-Dependent Analysis
In this section we will cover:
• Enabling the time-effect on elastic modulus for members and plates by setting the casting day and stage days
• Enabling creep and shrinkage for members, relaxation for tendons, and other effects by adding additionalconstruction stages, following CEB-FIP 90.
Casting Day
The time-effect on concrete elastic modulus will be taken into account in the Time-Dependent Staged ConstructionAnalysis (among other factors). We have already prepared for some of this by creating a Material Time Effect andassigning it to the concrete material. The concrete material was also marked as concrete by choosing normal cementhardening and providing the 28-day strength.
Additionally, the casting day of each concrete segment must be set. This is entered in the Members spreadsheet.
Open the Members spreadsheet.
Set the casting day of the pier (member 1) to day 1. The Casting Day column is at the far right.
Go to the Construction Stages spreadsheet and copy the construction days for Segments 2 through 8.
In the Members spreadsheet, select the eight Casting day cells for members 100 to 106 (rows 2 through 8) andpaste the construction days from the clipboard. Then use Apply Formula to decrease each day by 2 so that theelement is cast two days before its construction.
Fill in the remaining casting days for the girder elements. Use the Structure Group column to the right as aguide.
Set the casting day of the deck elements to 115.
Stages
In a Time-Dependent Staged Construction Analysis, creep, shrinkage, relaxation and other losses are applied at eachstage. To get results at time points beyond the end of construction, additional stages must be added to the constructionsequence. No construction steps need to be added to the stages, however.
Additionally, because creep effects are determined through numerical integration over the time points in theconstruction sequence, the results are more accurate if stages are not spread too far out in time. So when seeking resultsfor, for instance, four years past construction, it is a good idea to include intermediate stages and to space them closelywhere the incremental creep effect is greatest (that is, earlier rather than later).
Use the Construction Stages spreadsheet or the Construction Stages Explorer to add six additional stages ondays 200, 300, 500, 750, 1200, and 1600 (approximately 4 years after closure).
The temperature and humidity on each day has already been set.
51
LARSA 4D Balanced Cantilever Problem
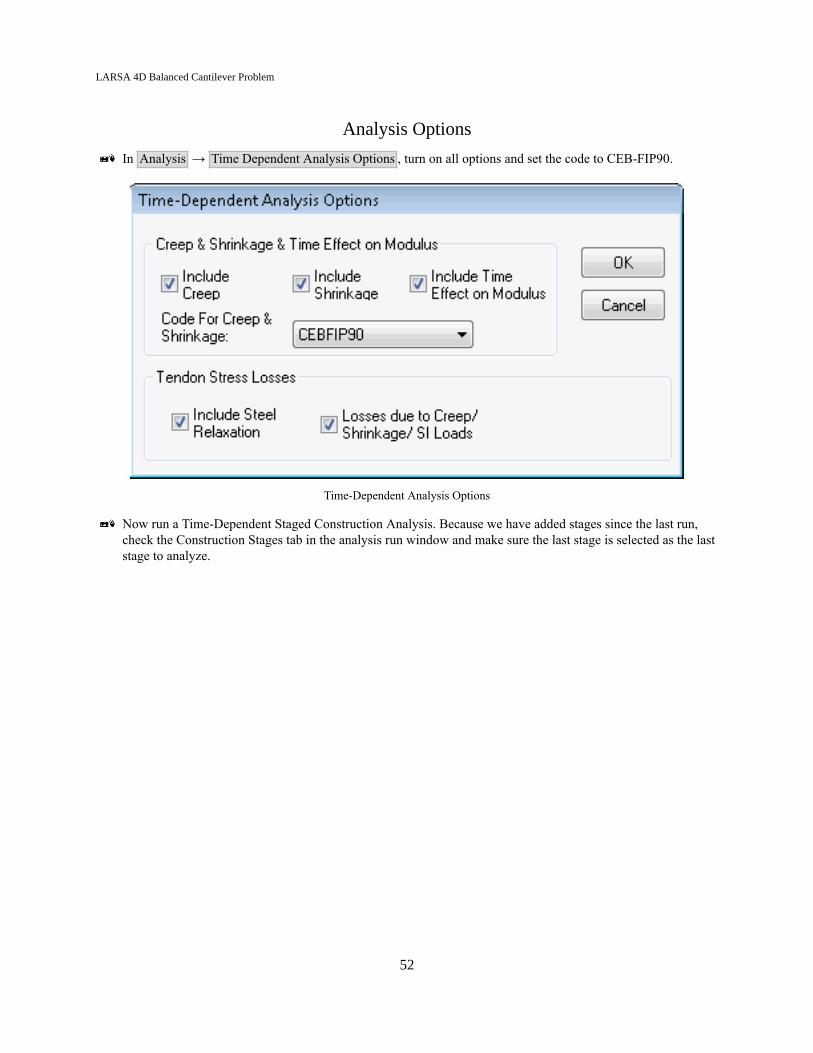
Analysis Options
In Analysis → Time Dependent Analysis Options , turn on all options and set the code to CEB-FIP90.
Time-Dependent Analysis Options
Now run a Time-Dependent Staged Construction Analysis. Because we have added stages since the last run,check the Construction Stages tab in the analysis run window and make sure the last stage is selected as the laststage to analyze.
52
LARSA 4D Balanced Cantilever Problem
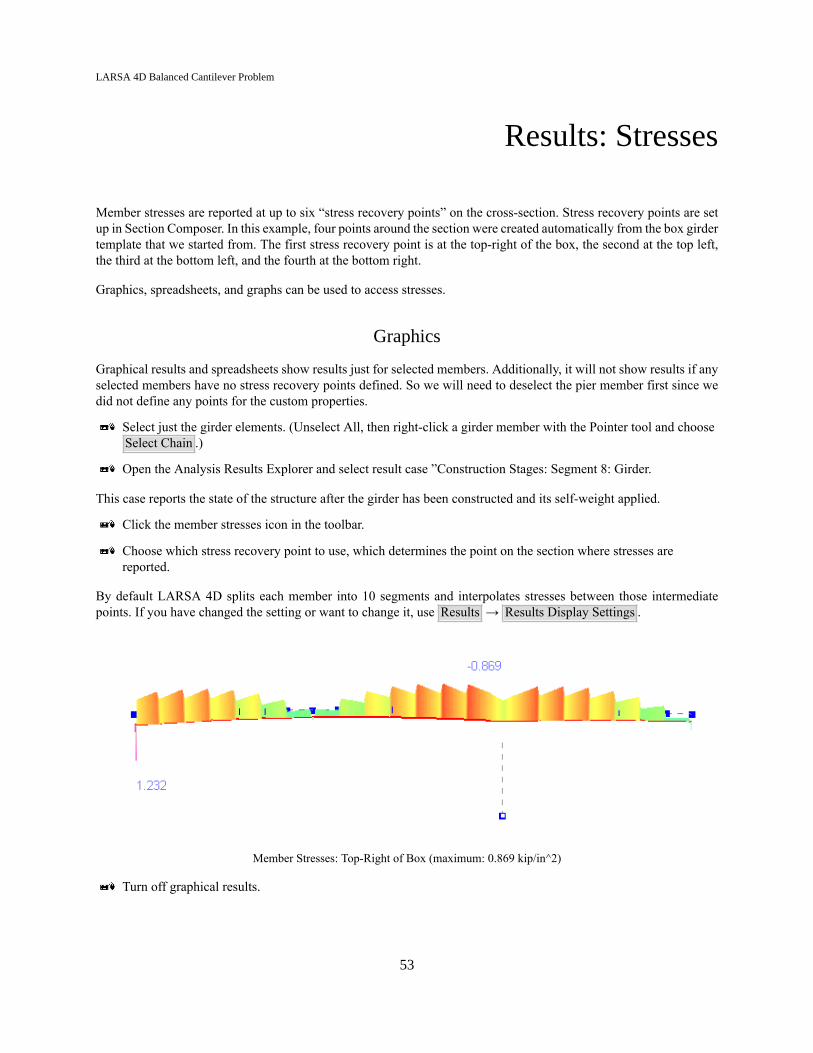
Results: Stresses
Member stresses are reported at up to six “stress recovery points” on the cross-section. Stress recovery points are setup in Section Composer. In this example, four points around the section were created automatically from the box girdertemplate that we started from. The first stress recovery point is at the top-right of the box, the second at the top left,the third at the bottom left, and the fourth at the bottom right.
Graphics, spreadsheets, and graphs can be used to access stresses.
Graphics
Graphical results and spreadsheets show results just for selected members. Additionally, it will not show results if anyselected members have no stress recovery points defined. So we will need to deselect the pier member first since wedid not define any points for the custom properties.
Select just the girder elements. (Unselect All, then right-click a girder member with the Pointer tool and chooseSelect Chain .)
Open the Analysis Results Explorer and select result case ”Construction Stages: Segment 8: Girder.
This case reports the state of the structure after the girder has been constructed and its self-weight applied.
Click the member stresses icon in the toolbar.
Choose which stress recovery point to use, which determines the point on the section where stresses arereported.
By default LARSA 4D splits each member into 10 segments and interpolates stresses between those intermediatepoints. If you have changed the setting or want to change it, use Results → Results Display Settings .
Member Stresses: Top-Right of Box (maximum: 0.869 kip/in^2)
Turn off graphical results.
53
LARSA 4D Balanced Cantilever Problem
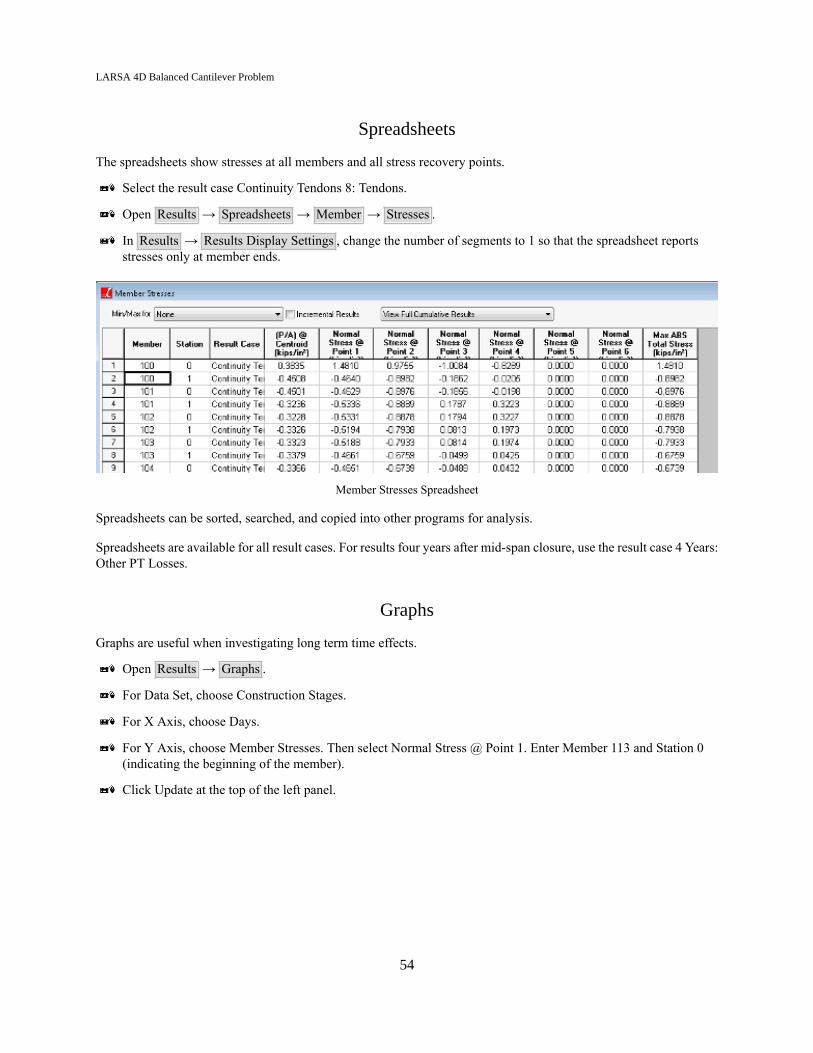
Spreadsheets
The spreadsheets show stresses at all members and all stress recovery points.
Select the result case Continuity Tendons 8: Tendons.
Open Results → Spreadsheets → Member → Stresses .
In Results → Results Display Settings , change the number of segments to 1 so that the spreadsheet reportsstresses only at member ends.
Member Stresses Spreadsheet
Spreadsheets can be sorted, searched, and copied into other programs for analysis.
Spreadsheets are available for all result cases. For results four years after mid-span closure, use the result case 4 Years:Other PT Losses.
Graphs
Graphs are useful when investigating long term time effects.
Open Results → Graphs .
For Data Set, choose Construction Stages.
For X Axis, choose Days.
For Y Axis, choose Member Stresses. Then select Normal Stress @ Point 1. Enter Member 113 and Station 0(indicating the beginning of the member).
Click Update at the top of the left panel.
54

LARSA 4D Balanced Cantilever Problem
Member Stress Over Time
The beginning indicates the increase in compressive (negative signed) stress during construction. Over the long term,the stress becomes tensile. The discontinuities result from the successive application of creep, shrinkage, tendonrelaxation, and other tendon losses all on the same day.
55

LARSA 4D Balanced Cantilever Problem
56
LARSA 4D Balanced Cantilever Problem
Results: Tendons
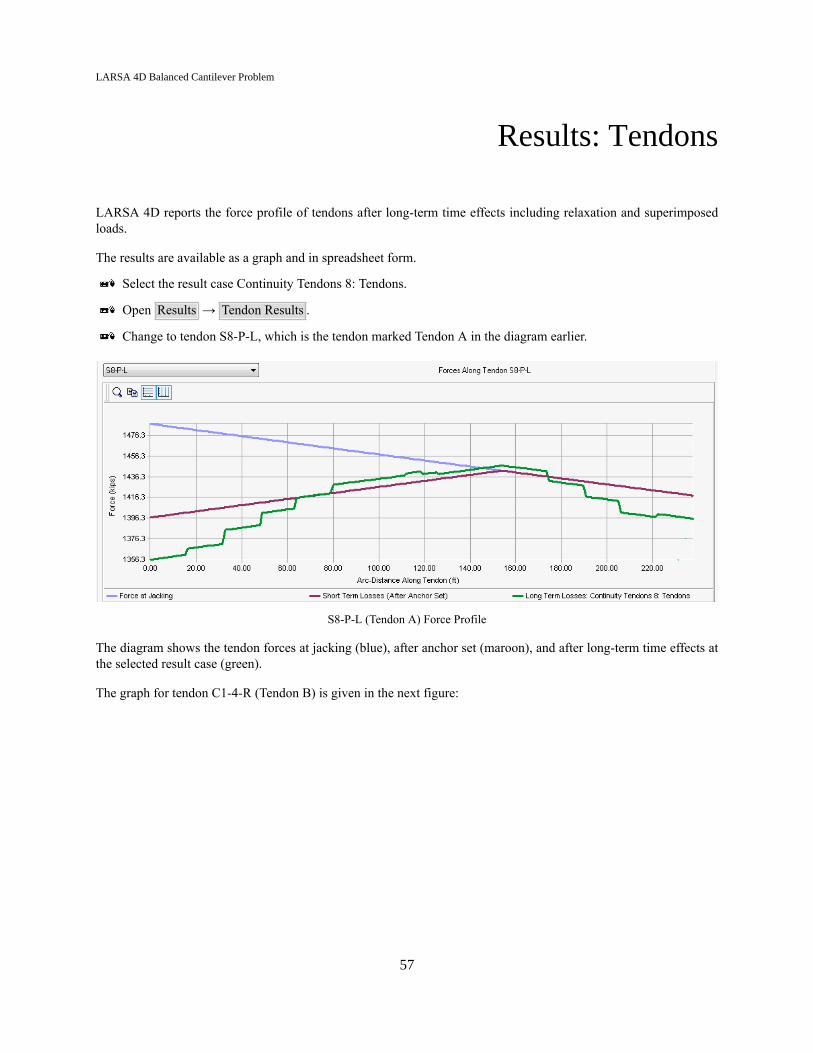
LARSA 4D reports the force profile of tendons after long-term time effects including relaxation and superimposedloads.
The results are available as a graph and in spreadsheet form.
Select the result case Continuity Tendons 8: Tendons.
Open Results → Tendon Results .
Change to tendon S8-P-L, which is the tendon marked Tendon A in the diagram earlier.
S8-P-L (Tendon A) Force Profile
The diagram shows the tendon forces at jacking (blue), after anchor set (maroon), and after long-term time effects atthe selected result case (green).
The graph for tendon C1-4-R (Tendon B) is given in the next figure:
57

LARSA 4D Balanced Cantilever Problem
C1-4-R (Tendon B) Force Profile
The same results after four years:
S8-P-L (Tendon A) Force Profile after Four Years
C1-4-R (Tendon B) Force Profile after Four Years
58

LARSA 4D Balanced Cantilever Problem
Primary and secondary moments are available as well and can be included in factored load combinations.
Primary Moments after Four Years
59

LARSA 4D Balanced Cantilever Problem
60

LARSA 4D Balanced Cantilever Problem
Code Check
LARSA 4D’s Ultimate Strength Check can be used to code-check the cross sections of the model. The UltimateStrength Check can be used for a variety of codes including AASHTO-LRFD 2006, has built-in stress-strain curvessuch as those provided by CEB-FIP 90, Ramberg-Osgood, and supports user-supplied curves, and takes into accountthe locations of post-tensioning and the long-term time effects on post-tensioning.
Spreadsheet reports, a graphical diagram of flexural strength, and a detailed report showing the cross-section strainprofile and neutral axis can be produced by the tool.
Select the girder elements.
In the Analysis Results Explorer, select the result case Deck: Deck, which is the last stage of construction. Toevaluate the structure under long-term effects including long term time effects on tendons, select a later stage.
Open Design → Ultimate Strength Check .
Ultimate Strength Check
61
LARSA 4D Balanced Cantilever Problem
Choose AASHTO-LRFD 2006 for the code.
Click Edit Stress/Strain Models . Choose CEB-FIP90 for the material model of concrete.
Change to the steel material A992 using the drop-down list at the top. Then choose a stress-strain curve for thepost-tensioning, such as the Ramberg-Osgood model. Click Apply and then Close .
The spreadsheet report produces the following output:
Ultimate Strength Spreadsheet Report
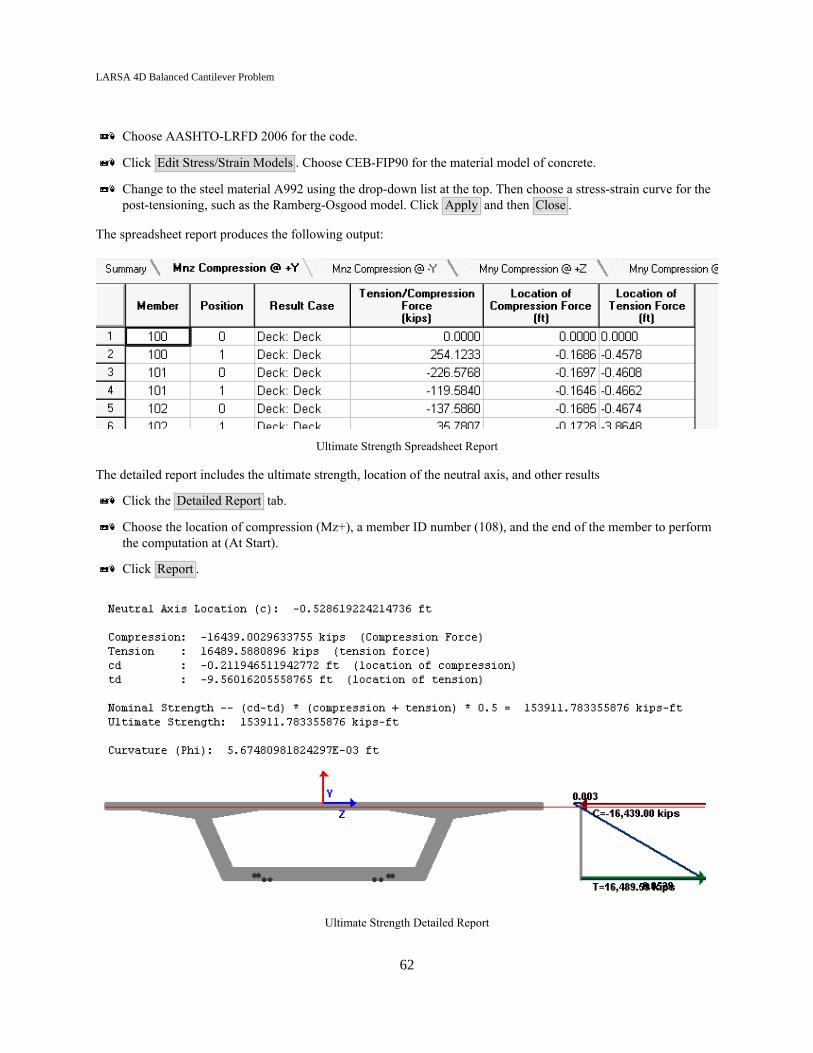
The detailed report includes the ultimate strength, location of the neutral axis, and other results
Click the Detailed Report tab.
Choose the location of compression (Mz+), a member ID number (108), and the end of the member to performthe computation at (At Start).
Click Report .
Ultimate Strength Detailed Report
62

LARSA 4D Balanced Cantilever Problem
Index
adding geometry with spreadsheets, 21balanced cantilever, 33box girder template, 7bridge path coordinate systems, 21casting day, 51CEB-FIP 90, 51code check of concrete sections, 61construction sequence, 33construction stages, 33day, 51formula helper, 7graphical results, 53graphs of results, 53horizontal alignment, 21jacking tendons, 41linear nonprismatic variation, 7material time effects, 51member end offsets, 21member orientation for superelevation, piers, 21member reference line, 7nonprismatic variation, spans, 21numerical results, 53parameters, 7piecewise nonprismatic variation, 7renumbering using Apply Formula, 21results, 53shape templates, 7stage day, 51stresses, 53stressing tendons, 41structure groups, 33templates, 7tendon results, 57tendons, 41time-dependent material properties, 51ultimate strength check, 61vertical alignment, 21
63