Lars Lindholt and Solveig Glomsrød - Forside - SSB Lindholt and Solveig Glomsrød The role of the...
35
Discussion Papers No. 645, February 2011 Statistics Norway, Research Department Lars Lindholt and Solveig Glomsrød The role of the Arctic in future global petroleum supply Abstract: The Arctic has a substantial share of global petroleum resources, but at higher costs than in most other petroleum provinces. Arctic states and petroleum companies are carefully considering the potential for future extraction in the Arctic. This paper studies the oil and gas supply from 6 arctic regions during 2010-2050 along with global economic growth and different assumptions regarding petroleum prices and resource endowments. Supply is calculated based on a global model of oil and gas markets. The data on undiscovered resources for the Arctic is based on the estimates by USGS. Sensitivity studies are carried out for two alternative price scenarios and for a 50 per cent reduction of arctic undiscovered resources compared with the USGS 2008 resource estimate. Although a major part of the undiscovered arctic petroleum resources is natural gas, our results show that the relative importance of the Arctic as a world gas supplier will decline, while its importance as a global oil producer may be maintained. We also show that less than full access to undiscovered oil resources will have minor effect on total arctic oil production and a marginal effect on arctic gas extraction. The reason is that Arctic Russia is an important petroleum producer with a sufficiently large stock of already discovered resources to support their petroleum production before 2050. Keywords: Arctic, oil market, gas market, equilibrium model JEL classification: Q31, Q41, R10 Acknowledgements: This study has been carried out as part of the ECONOR project, funded by the Norwegian Ministry of Foreign affairs, Nordic Council of Ministers and Statistics Norway. Useful comments from Knut Einar Rosendahl and Ådne Cappelen are highly appreciated. Address: Lars Lindholt, Statistics Norway, Research Department. E-mail: [email protected] , Solveig Glomsrød, Statistics Norway, Research Department. E-mail: [email protected] , CICERO Center for International Climate and Environmental Research - Oslo, [email protected]
-
Upload
truongkien -
Category
Documents
-
view
218 -
download
0
Transcript of Lars Lindholt and Solveig Glomsrød - Forside - SSB Lindholt and Solveig Glomsrød The role of the...

Discussion Papers No. 645, February 2011 Statistics Norway, Research Department
Lars Lindholt and Solveig Glomsrød
The role of the Arctic in future global petroleum supply
Abstract: The Arctic has a substantial share of global petroleum resources, but at higher costs than in most other petroleum provinces. Arctic states and petroleum companies are carefully considering the potential for future extraction in the Arctic. This paper studies the oil and gas supply from 6 arctic regions during 2010-2050 along with global economic growth and different assumptions regarding petroleum prices and resource endowments. Supply is calculated based on a global model of oil and gas markets. The data on undiscovered resources for the Arctic is based on the estimates by USGS. Sensitivity studies are carried out for two alternative price scenarios and for a 50 per cent reduction of arctic undiscovered resources compared with the USGS 2008 resource estimate. Although a major part of the undiscovered arctic petroleum resources is natural gas, our results show that the relative importance of the Arctic as a world gas supplier will decline, while its importance as a global oil producer may be maintained. We also show that less than full access to undiscovered oil resources will have minor effect on total arctic oil production and a marginal effect on arctic gas extraction. The reason is that Arctic Russia is an important petroleum producer with a sufficiently large stock of already discovered resources to support their petroleum production before 2050.
Keywords: Arctic, oil market, gas market, equilibrium model
JEL classification: Q31, Q41, R10
Acknowledgements: This study has been carried out as part of the ECONOR project, funded by the Norwegian Ministry of Foreign affairs, Nordic Council of Ministers and Statistics Norway. Useful comments from Knut Einar Rosendahl and Ådne Cappelen are highly appreciated.
Address: Lars Lindholt, Statistics Norway, Research Department. E-mail: [email protected],
Solveig Glomsrød, Statistics Norway, Research Department. E-mail: [email protected], CICERO Center for International Climate and Environmental Research - Oslo, [email protected]

Discussion Papers comprise research papers intended for international journals or books. A preprint of a Discussion Paper may be longer and more elaborate than a standard journal article, as it may include intermediate calculations and background material etc.
© Statistics Norway Abstracts with downloadable Discussion Papers in PDF are available on: http://www.ssb.no http://ideas.repec.org/s/ssb/dispap.html

3
Sammendrag
Vi har gjort en modellbasert analyse av hvordan ulike petroleumspriser og ressursmengder kan
kommet til å påvirke framtidige investeringer og produksjon i arktiske regioner fram til 2050. I vår
referansebane vil oljeproduksjonen i Arktis dobles over de neste 40 årene. Årsaken er først og fremst
økt produksjon på Grønland og i Alaska, og til en viss grad i Arktisk Russland. I vår referansebane vil
arktisk gassproduksjon falle fram til 2035, før den tar seg opp til et nivå i 2050 som er marginalt lavere
enn dagens. Nedgangen i gasstilbudet de første to tiårene har sammenheng med lavere produksjon i
Arktisk Russland, mens den senere økningen skyldes økt produksjon i alle arktiske regioner, først og
fremst Arktisk Russland og Grønland, og til en viss grad Arktisk Canada. Våre resultater er basert på
lønnsomhetskrqav og at olje- og gasselskapene har full tilgang til alle arktiske områder med
petroleumsressurser, dvs. det forutsettes ingen politiske eller miljømessige barrierer.
Ved en lavere oljepris får vi den samme relative nedgangen i produksjonen i alle områder, bortsett fra
Grønland og østlige deler av Arktisk Russland som påvirkes relativt mer, fordi størstedelen av deres
produksjon skjer i perioden 2030-50, når oljeprisen er på sitt høysete nivå i referansebanen. I tillegg
har Øst Arktisk Russland og Grønland de høyeste kostnadene og blir mest rammet av lavere oljepris.
Ved en økning i oljeprisen fra referansebanen får vi de samme resultatene, men med motsatt fortegn.
Dersom olje- og gasselskapene bare får tilgang til halvparten av de uoppdagede ressursene, vil den
fremtidige produksjonen i alle Arktiske regioner reduseres relativt mye, bortsett fra Russland der en
stor del av olje- og gassproduksjonen før 2050 vil komme fra allerede påviste reserver. Fordi Arktisk
Russland er en betydelig petroleumsprodusent, vil effekten på total arktisk oljeproduksjon være
moderat og for gass vil den være marginal. Det må likevel påpekes at for den enkelte olje- og
gassprodusent utenfor Russland kan begrenset tilgang til ressursene føre til relativt store tap i
fremtidige inntekter.
Mens om lag 10 prosent av den globale oljeproduksjonen i 2010 kommer fra Arktis er andelen for gass
22 prosent. Selv om rundt 70 prosent av de uoppdagede petroleumsressursene er gass, viser våre
resultater at den arktiske andelen av verdens gassproduksjon vil falle fram mot 2050. Årsaken er at det
finnes rimelige og store reserver i andre regioner, spesielt i Qatar og Iran. Våre resultater viser at
Arktis vil øke sin relative betydning som oljeprodusent utenfor OPEC. Den relative betydningen til
Arktis som global oljeprodusent kan vedvare dersom oljeprisen holder seg noenlunde høy og
produsentene får tilgang til en relativt stor del av ressursene, først og fremst i Alaska og på Grønland.

4
1. Introduction The Arctic is one of the world’s most important petroleum provinces. Obviously, the petroleum
resources are important to the arctic countries and regions as sources of income and resource rent
(Glomsrød and Aslaksen ed., 2009). But the importance of arctic petroleum goes beyond the regional
and national economies. Large net-importers of petroleum like the US and the EU look to the Arctic
for petroleum supply to reduce dependence on a limited number of large suppliers. Many consider the
Arctic to be the last large petroleum frontier outside the OPEC cartel (UNEP/GRID, 2006) and some
even question OPEC’s ability to increase the oil and gas production as the cartel claims it is capable of
(Salameh, 2004). Increased problems for operation by international private oil companies in some
regions due to the recent resurge of resource nationalism might intensify their search for new oil and
gas frontiers like the Arctic (Kretzschmar et al, 2010). However, petroleum production in the Arctic is
facing harsh weather conditions and high costs compared with other producing petroleum provinces.
The challenges will be even higher in the future, as production increasingly is expected to take place in
offshore and more remote areas lacking infrastructure for transportation. Hence, the arctic supply can
be highly sensitive to future development in petroleum prices.
Arctic resources have been assessed by USGS (USGS, 2000; USGS, 2008) and Wood Mackenzie
(2006). USGS (2000) outlined considerable prospects for supply of arctic oil and gas, whereas Wood
Mackenzie questioned the perception of the Arctic as one of the last oil and gas frontiers. In 2008 the
USGS carried out a Circumpolar Assessment of undiscovered Resources in the Arctic - CARA
(USGS, 2008) - restating that the Arctic has resources to remain a major petroleum province in the
future. The two studies differ somewhat in their approach, and neither study provides explicit
assessments of economic viability associated with the estimated resource potential.
This paper analyzes how future arctic oil and gas production might develop. Our study assumes a
resource situation as depicted by USGS 2008 and seeks to answer the following questions:
• How robust is arctic supply to future oil price development? • How will less than full access to arctic resources affect the supply of arctic oil and gas?
To answer these questions we apply a comprehensive and transparent global oil and gas model with
prices, costs and reserves. In our model oil and gas producers outside the OPEC cartel base their
investment and production decisions on profit maximization and detailed information about the access
to fields worldwide. The assumption that investments first target the most profitable reserves leads to a
geographical spread of oil extraction worldwide.

5
The global demand for oil and gas increased considerably during the last decade as a response to rapid
economic growth in population rich countries like China and India, raising the oil price considerably.
Supply seemed to be unable to meet demand, facing capacity constraints in oil producing countries
outside OPEC. As a result of the financial and economic crisis in 2008, the yearly average IEA crude
import price (in USD, 2008-prices) fell from 97 USD per barrel in 2008 to 60 USD per barrel in 2009,
before it increased to 77 USD in 2010. For the years to come, the International Energy Agency (IEA,
2009) expects the real oil price to recover and rise to 100 USD by 2020 and 115 USD by 2030. This
price forecast is slightly lower than in the reference scenario of EIA (2010a), but higher than the
estimate made by OPEC. The OPEC World Oil Outlook (OPEC, 2009) sticks to previous assumptions
that the nominal oil price will be in the range from 70 USD to 90 USD over the decade 2010-2020.
These price expectations are the results of different assumptions regarding fundamental economic and
political drivers of the demand and supply. It might be optimal for OPEC to keep the production level
high to prevent the oil price from rising too fast either to discourage the more costly reserves outside
OPEC from being developed or to prevent the oil industry from introducing new technologies. A low
price scenario might also evolve if climate policies effectively reduce demand. The pledges made in
the wake of the 15th Conference of the Parties (COP15) of the Kyoto Protocol in Copenhagen in 2009
to cut emissions made by large economies and emitters including emerging economies give some
support to this view (UNFCCC, 2010). Irrespective of policy measures used, and degree of
international cooperation, the user cost of consuming fossil energy is likely to increase and cause a
decline in demand relative to a business as usual scenario. “Peak demand” and low producer prices
might particularly affect high cost regions like the Arctic. In addition to the reference scenario, IEA
therefore considers a moderate oil price scenario, complying with the policy of limiting the
concentration of CO2 in the atmosphere to 450 ppm and thus ensure that the increase in global mean
temperature is limited to 2 °C (IEA, 2009). However, low ambitions in climate policy and continued
high economic growth in large developing economies might sustain a high oil price. A constrained
supply due to stricter regulation of offshore drilling to limit environmental hazards may also contribute
to high petroleum prices. In addition, OPEC might find it optimal to limit production and let the oil
price increase somewhat over time. As the IEA (2009) presents no high price scenario, we define our
high price scenario by letting the oil price reach 140 USD (2008 prices) per boe in 20301.
A recent development bringing price uncertainty into the petroleum market is the effect of rapidly
growing supply of unconventional reserves like oil sands in Canada and shale gas in the US. These
reserves are significant in the global context and are being developed with political support as a mean
1 The recently published World Energy Outlook (IEA, 2010) has a high oil price scenario marginally lower than ours. Their new reference and low price scenarios are similar to the scenarios in the 2009 report.

6
to reduce dependence on a limited number of large suppliers. Our model analyzes include both
conventional and unconventional oil and gas reserves.
2. Arctic petroleum resources How much of the world’s oil and gas resources has already been discovered and what is the potential
for future discoveries? Proven reserves are defined as fully identified and economically viable
resources. The USGS 2000 estimate of global undiscovered oil and gas resources is based on
geological information and makes up around 90 per cent of what is defined as global proven reserves
in BP (2010) 2. There is large uncertainty associated with resource estimates in the Arctic, where a
substantial share of the resources are under the sea bed, and exploration drilling is costly.
Over the last decade a few comprehensive assessments of undiscovered petroleum resources in the
Arctic have been carried out with somewhat different results. Wood Mackenzie (2006) assessed the
undiscovered reserves in the arctic regions and questioned the perception of the Arctic as one of the
last great oil and gas frontiers (Oil & Gas Journal, 2006). The study concluded that total arctic
undiscovered petroleum resources were only around 43 per cent of the estimates in USGS (2000). For
oil, the study concluded that estimated undiscovered resources for North American Arctic and
Greenland were only a quarter of earlier estimates made by USGS in 2000. On the other hand, Wood
Mackenzie raised the estimates for natural gas in the Arctic West Russia compared with the USGS
2000 assessment. The petroleum supply from the arctic region as a whole would, according to Wood
Mackenzie, peak around 2030 at 8 million barrels of oil equivalents per day (boe/d) with 40 per cent
oil and 60 per cent gas in the most likely scenarios, as a higher share of gas would mainly involve
remote gas too expensive to transport to markets according to the Wood Mackenzie assessment. Wood
Mackenzie concluded that the undiscovered resources are mainly located in either ice-free or seasonal
ice-free areas, which require modifications of technology only – not new solutions. Subsea drilling is
likely to be used for the greater share of the offshore resources.
In 2008, the USGS completed their Circum-Arctic Resource Appraisal (CARA), assessing the
undiscovered petroleum resources north of the Arctic Circle in more detail (USGS, 2008). The study
used a probability-geology based methodology covering sediments expected to have more than 10 per
cent probability of having one or more significant oil or gas resources, i. e. fields containing more than
50 mill boe. These resources were assumed to be recoverable without explicit economic
considerations, however, implicitly the size of fields accounted for indicates economic viability. The

7
study did not consider the specific challenges associated with the ice cover and excluded resources
where production would have to rely on technology that was not yet available. Around 80 per cent of
the resources were found offshore, but relatively shallow under less than 500 meters of water (Gautier
et al, 2009). Undiscovered petroleum resources were estimated by USGS (2008) to be 8.5 per cent
higher than their 2000 estimate, leaving the Wood Mackenzie (2006) estimate at only around 40 per
cent of the new USGS resource estimate. The 2008 assessment reduced oil resource estimates and
increased gas resource estimates compared with the USGS 2000 assessment. Estimates of oil resources
in Norway, Greenland and Russia were lowered and raised in Alaska and Canada. Gas resource
estimates were lowered in Norway and increased in all the other regions. Still, after a 50 per cent
downward adjustment, Greenland oil resources were estimated to 18 per cent of total arctic oil
resources. Note, however, that the methods used in the USGS (2000) and USGS (2008) assessments
differ, hence the results are not directly comparable.
According to USGS (2008), the total amount of undiscovered petroleum resources in the Arctic is 413
bboe, about 22 per cent of the global undiscovered conventional oil and gas resources. Further, they
find that the Arctic contains 134 bboe of oil (incl. natural gas liquids, NGL) or about 15 per cent of
total global oil resources. Hence 279 bboe or close to 70 per cent of the arctic petroleum is gas.
Figure 1 shows that Arctic Russia dominates with 41 per cent of total arctic oil resources3. Second is
Alaska with a lower share of 28 per cent. Greenland has 18 per cent, Arctic Canada 9 per cent and
Arctic Norway 4 per cent. While somewhat more than 80 per cent of the undiscovered oil resources in
Arctic Canada are found offshore, a smaller share of 70 per cent of Arctic Russian resources is found
off the coast. The figure for Alaska is around 50 per cent. Greenland and Arctic Norway have
practically all of their undiscovered oil resources offshore and for the Arctic as a whole, as much as
about 80 per cent of oil is located beneath the sea.
For gas, Arctic Russia dominates even more with about 70 per cent of total arctic resources, whereas
Alaska is second with 14 per cent (Figure 2). Notice that behind these numbers lies the assumption
that Arctic Russia and Alaska are sharing equally the resources in the Chukchi Sea. This assumption
does not affect the distribution much as the resources in the Chukchi Sea are not particularly large. For
gas as for oil, Greenland has larger resources than Arctic Canada and Arctic Norway combined. The
2 BP defines proven (or proved) reserves ”to be those quantities that geological and engineering information indicates with reasonable certainty can be recovered in the future from known reservoirs under existing economic and operating conditions”. 3 The different countries´ share of the arctic oil and gas resources is approximate, as certain resource basins belong to two, sometimes three, arctic states, without any clear distrinbution of the resources.

8
distribution between onshore and offshore resources in the Arctic is almost the same for gas as for oil,
except that Arctic Russia stands out with as much as 90 per cent of the gas resources in offshore areas.
Figure 1 Regional distribution of arctic undiscovered oil resources (including NGL)
Total Arctic oil: 134 bboe (15 percent of global conventional resources)
41 %
28 %
4 %
18 %
9 %
Arctic Russia
Alaska
Arctic Norw ay
Greenland
Arctic Canada
Figure 2 Regional distribution of arctic undiscovered natural gas resources (incl. NGL)
Total Arctic gas: 279 bboe (30 percent of global conventional resources)
70 %
14 %
4 %
8 %4 %
Arctic Russia
Alaska
Arctic Norw ay
Greenland
Arctic Canada
The presence of large resources does not by itself tell us when the oil or gas will be discovered and
come on stream, and to what extent. An example of time consuming arctic offshore development is the
history of the giant Shtokman gas field in the Russian sector of the Barents Sea. The Shtokman
reserves were registered in the late 1980s, but are still not developed. Recently, the announced
investment start up in 2013 was further delayed until 2016 (Rigzone, 2010).

9
3. The global petroleum model FRISBEE Below we describe the FRISBEE model of the global energy markets (Aune et al, 2005) used for this
study of arctic petroleum supply. The model is previously used for studies of impacts of petroleum
industry restructuring (Aune et al, 2010) and globalization of natural gas markets and trade (Aune et
al, 2009).
For this modelling work we have benefited from access to the comprehensive IHS Energy field
database4. The FRISBEE-model describes future supply and demand of oil and gas through elaborate
modelling of oil and gas investments and production. The base year is 2000. It is a recursively
dynamic partial equilibrium model accounting explicitly for discoveries, reserves, field development
and production of oil and gas. The model is updated to harmonize the regional production profiles up
to 2010. The emphasis is on petroleum markets, however, the global market for coal and regional
markets for electricity are also modelled, although in less detail. Production generally takes place in 15
regions and 4 field categories depending on location onshore/offshore, depth of offshore fields and
size of resources. We focus on six arctic regions; Alaska, Arctic Canada, Arctic Norway, Greenland,
East Arctic Russia and West Arctic Russia. For each arctic region, the model depicts only one field
category. We do not distinguish between single fields within the field categories.
For both oil and gas FRISBEE distinguishes between three field stages within each field category, i.e.
fields in production, undeveloped fields and undiscovered fields. Supply from developed fields in the
model is determined so that marginal operating costs equal producer prices net of gross taxes.
Operating costs are increasing functions of production, but are generally low unless production is
close to the fields’ production capacity; then they increase rapidly. The cost functions are calibrated
based on data on production costs in different locations.
Oil and gas companies may invest in new fields and in reserve extensions of developed fields.
Investments decisions are driven by expected net present values (NPV), which are calculated for four
field categories in each of the 13 Non-OPEC regions, and for the single field category in the 6 arctic
regions (see Appendix 1). Expected NPV depends on expected prices (adaptive), a pre-specified
required rate of return (set to 10 per cent in real terms), unit operating and capital costs, and net and
gross tax rates. Unit capital costs are convex in the short term, and increase when the pool of
undeveloped reserves declines (for new fields), and when the recovery rate rises (for reserve
extension). The assumption that investments first target the most profitable reserves leads to a
geographical spread of oil extraction worldwide. Reserve extensions through improved oil and gas
4 www.ihs.com

10
recovery (IOR) will modify the rate of decline in production after the peak level. In the future, a
growing share of petroleum production will come from smaller and offshore fields, likely to have
higher decline rates (IEA 2008). Hence, steadily increasing investments in IOR are needed to keep up
production recovery rates. A typical production profile is illustrated in Figure 3.
Figure 3 Typical production profile
P1 P2 P3 P4 t
Production
IOR
New oil and gas discoveries are modelled in a simpler way than investment in already discovered
fields. The amount of discoveries generally depends on expected prices and expected undiscovered
resources in each region available in USGS (2000), which for some non-arctic regions is updated to
cover data unto 20065. The undiscovered oil and gas reserves for the Arctic are from USGS (2008).
The expected unconventional oil and gas resources are updated with data from 2006 (NPC, 2007).
For arctic regions there is one field category only, and the time lag from investment decision to
maximum plateau production is generally 50-100 per cent longer than in comparable fields within the
non-arctic regions of the corresponding arctic state. The initial operational and capital costs are based
on the IHS database. Future costs are uncertain, but costs will probably increase as production moves
from onshore to offshore areas, which also often contain smaller fields. As we cannot distinguish
between onshore/offshore or field size for arctic regions, we assume increasing future costs. Capital
and operational costs beyond 2010 in new Alaskan fields are assumed to be 50 per cent higher than
average costs of existing fields in the database. For Norway, the cost of new arctic fields is set to 50
per cent above the cost level of the most expensive Norwegian non-arctic field category. It is assumed
that Arctic Canada has the same cost level as Arctic Norway. The cost level in West Arctic Russia is
set to 50 per cent above existing average cost level for this region, whereas costs in East Arctic Russia
5 energy.cr.usgs.gov/oilgas/wep/assessment_updates.html

11
are doubled. Capital and operational costs in Greenland are set equal to that of East Arctic Russia.
Investment costs are assumed to increase over time as the reserves are depleted. However, additional
discoveries and technological change reduce the cost of developing new fields.
The world market price of oil is exogenous in the model. OPEC satisfies the residual demand at the
prevailing oil price, determined as the difference between world demand and Non-OPEC supply. The
fixed oil price assumption implies that total demand and Non-OPEC supply including arctic regions
are determined independently of each other. Non-OPEC supply is responding to the oil price level. If
demand rises due to income growth, OPEC will increase supply to cover additional demand and keep
the oil price at the preferred level of the cartel. In the gas markets, however, the price is endogenous
because the markets are competitive. Below we describe the demand side for gas, and demand for oil
is modelled similarly.
Demand of gas is modelled in each region for the three industries manufacturing, electricity
production and other sectors (including households and services). Demand is driven by growth in
GDP and population. Gas demand is a function of the end-user prices of all energy goods, with own
price-elasticities for manufacturing and other sectors at an average of -0.3 for the long run and -0.1 in
the short run (one year), and with low cross-price elasticities. In the long run, gas demand is
particularly dependent on population and income growth with income elasticity of 0.6. Autonomous
energy efficiency improvement in gas consumption is set to 0.25 per cent per year in OECD countries
and 0.50 per cent for the rest of the world.
The model output covers regional supply, demand and trade flows. The version adopted here is
specially designed to look at the role of arctic petroleum supply, which is represented by the six
regions Alaska, Northern Canada, Greenland, Arctic Norway and Arctic Russia, with Arctic Russia
further divided into West and East Russia. The East Russia region covers the petroleum provinces
from the Sakha region and eastwards, i.e. from the Laptev Sea to the Russian part of the Chukchi Sea.
The arctic regional petroleum activity is defined based on AMAP data (AMAP, 2007). Arctic regions
are only modelled as producers of petroleum, whereas the demand generated by the small arctic
population of 10 millions is counted together with demand from non-arctic regions of their
corresponding arctic states. The regions and field categories are listed in the Appendix.
The global oil and gas industry outside OPEC is modelled as separate investors allocating up to 50
percent of the annual cash flow to field investments by maximizing net present value of returns, based
on adaptive expectations of the future oil and gas price. The cash flow constraint is generally not

12
binding in our scenarios, i.e. the petroleum companies invest in all projects that give at least the
required rate of return of 10 per cent.
The gas price is endogenously determined in regional markets. The model depicts the gas market as
global and integrated, as liberalization processes are taking place both in OECD and non-OECD
regions, gradually reducing the market power of large, downstream companies. In addition, the extent
of spot trade is growing fast, and gas price indexation is partially replacing the oil price link in long-
term contracts. One factor behind this development is the decline in costs of transportation, in
particular for LNG.
4. Oil price scenarios The supply of oil and gas from arctic regions is calculated for three price trajectories and in addition in
a scenario where political, technical or environmental aspects limit the access to resources to 50 per
cent below the USGS 2008 estimate.
Figure 4 shows the chosen oil price scenarios. In our reference scenario (middle) we assume that the
oil price will follow the trajectory of the IEA reference scenario presented in IEA (2009). It assumes
that the price (in USD, 2008 prices) increases to 100 USD/boe by 2020, and further to 115 USD/boe in
2030. We let the oil price stay constant at that level for the period after 2030 as shown in Figure 4. A
low price scenario has the oil price reaching 90 USD by 2016 staying constant thereafter. This price
development corresponds to the price path of the IEA 2 °C scenario, which we extend to 2050, by
keeping the oil price constant at the 2030 level until 2050. Note, however, that our low price scenario
is no climate policy scenario and involves no taxes or regulations limiting production. We also depict
a high price scenario with the oil price rising to 140 USD by 2030 and staying constant at that level
until 2050.
In the FRISBEE model, oil and gas investors respond with adaptive price expectations, assuming that
the future petroleum price will settle at the average of the prices the 6 previous years. When the real
price of oil is increasing, the adaptive expectations will lead investors into a rising expected price path
that is lagging somewhat behind the real price development. This will also be true for gas, if the
endogenous gas price is increasing.

13
Fig. 4 Oil price scenarios. USD (2008 prices)/boe
0
20
40
60
80
100
120
140
160
2009 2013 2017 2021 2025 2029 2033 2037 2041 2045 2049
US
D/b
oe
High oil price
Reference scenario
Low oil price
5. Results Before presenting the results, we emphasize that our production profiles are based on the assumption
of profitability and of oil and gas companies having full access to all areas that contain petroleum, i.e.
there are no political or environmental restrictions.
5.1 Reference scenario
Figure 5 shows that arctic oil production really took off in the mid-sixties and continued to increase
up to around 1988. The break-up of the Soviet Union led to a decline in oil production from then on,
before it started to increase again in the late 1990s. Due to Russia’s dominant share in total arctic oil
production, this was also reflected in aggregate production at circumpolar level. Our model
simulations show that the IEA reference oil price trajectory will lead to a considerable rise in total
arctic oil production from 2020 to 2050. After a stagnant period up to 2020 the supply will increase
from around 400 mtoe to above 800 mtoe. It is above all the two regions Alaska and Greenland that
generate the rising oil volumes towards the end of the period (Figure 6), and to a some extent Arctic
Russia. Alaska’s oil supply takes off from around 2015 after 20 years of decline as the giant field of
Prudhoe Bay is being emptied. Greenland’s resources come on stream from 2025, but do not take off
before around 2030, rising to a level of production twice the level of Alaska when Prudhoe Bay
peaked in the 1990s. Canada remains a minor producer of oil, showing a steeply rising but rapidly
peaking production around 2025. From around 2030, Arctic Russia increases the volumes
considerably, but reaches a new turning point towards the end of the time horizon.

14
Figure 5 Arctic oil production. Reference scenario. Mtoe.
0
100
200
300
400
500
600
700
800
900
1950 1960 1970 1980 1990 2000 2010 2020 2030 2040 2050
Mto
e
Total Arctic
Arctic Russia
Alaska
Greenland
Arctic Norw ay
Arctic Canada
||
Figure 6 Regional distribution of West Arctic oil production. Reference scenario. Mtoe.
0
50
100
150
200
250
1950 1960 1970 1980 1990 2000 2010 2020 2030 2040 2050
Mto
e
Alaska
Greenland
Arctic Norw ay
Arctic Canada
It is important to notice that behind these production profiles many fields are emptied and new already
proven fields are developed. As will be shown later, resources in currently undiscovered fields are
only to a minor extent developed before 2030, partly due to long lead times. For Russia, practically all
production before 2030 comes from their large proven reserves, both developed and undeveloped.
Arctic Russian oil production today is situated onshore in the West Arctic regions of Yamal-Nenets,
Khanty-Mansi and Komi. A large part of the proven oil reserves is also found in these onshore
regions, although some are situated offshore, e.g. the Prirazlomnoye oil field at only 20 meters depth
in the Pechora Sea. Even if the launch of this oil field has been postponed several times, Gazprom

15
states that production will start in 2011-12 (Barents Observer, 2010). Production from their large but
currently undiscovered oil resources (cf. Figure 1) are gradually phased in, leading to an increase in oil
production after 2030. The higher cost reserves in East Arctic Russia are gradually becoming
profitable to extract, and this region’s share of oil production in total Arctic Russia increases from 3
percent today to 11 per cent in 2050.
It is however, important to be aware of the simplification we make in assuming that national oil and
gas companies like the Russian apply the same investment rule of profit-maximization as private
international petroleum companies. In general, social and political priorities are perceived to have a
stronger hand on the national oil and gas companies, although national companies over time have
approached commercial behaviour. Russia (and other circumpolar nations) might find it convenient to
collaborate with international petroleum companies with the necessary technological expertise and
experience regarding offshore extraction. However, Russian engineers are world leaders in inland
arctic pipeline technology as in the West Siberia and Yamal Peninsula (Stern, 2009).
Alaskan oil production today is mainly taking place on the North Slope, which covers the Central
Arctic state lands and adjacent waters of the Beaufort Sea. Production peaked in 1988, producing around
25 per cent of US domestic supply. Production later declined and represents today around 12 per cent of
the US domestic production level. Notice that as much as 28 per cent of the total arctic undiscovered oil
resources are found in Alaska (cf. Figure 1). Substantial future increase in Alaskan oil production
depends on the opening of all offshore areas from the Chukchi Sea Outer Continental Shelf in the west to
the Canadian border in the east. Further, it requires that all onshore areas including the area of the Arctic
National Wildlife Refuge (ANWR) and the National Petroleum Reserve Alaska are accessible. Over
time, investment in new discoveries contributes to the rapidly rising production. Some may question this
rise, however, EIA (2008) estimates a high-resource case production level only for the ANWR in 2028,
which is 10 per cent lower than our production level. Some of the difference may be because our study
covers all Alaskan areas and because we also assume full access to these areas at all points in time.
Even if Canada is a large petroleum producer, only a small share of their activities has been located in
the Arctic (AMAP, 2007). Oil and gas production has taken place in the Mackenzie Delta/Beafort Sea
Basin and on the Arctic Archipelago. Relatively large oil resources are expected to be found in the
western areas towards Alaska as well as the eastern waters towards Greenland. The steep increase in
production depicted by our reference scenario is dependent on shorter approval times than Canada often
experience today and better infrastructure in terms of roads, ports and tanker facilities (see EIA, 2010b).
As a relatively small share of the undiscovered oil resources are situated in Arctic Canada, production
from new discoveries starts to decline in the late 2020s until it levels out from around 2040.

16
Arctic Norwegian oil production includes the fields in the Norwegian Sea, where production on the
Draugen field started as early as in 1993. There has been no oil production further north, but
production from the Goliat field in the Barents Sea is expected to start in 2013 (Reuters, 2010). New
discoveries are expected in Lofoten/Vesterålen, which is yet closed to oil and gas production, and in
the Barents Sea. The latter area recently increased its importance for the petroleum companies as the
dispute over the dividing line between Russia and Norway was resolved. Like Canada, Norway has a
relatively small share of the undiscovered oil resources in the Arctic. Production from these new
discoveries is gradually phased in, keeping the total Arctic Norwegian oil production level more or
less constant around the 2010 level.
So far there has been no petroleum production in Greenland, but in 2010 both oil and gas were found
in the waters between Canada and Greenland (Guardian, 2010). No reserves have yet been proven,
however, as much as 18 per cent of the total arctic oil resources are expected to be found in Greenland
according to USGS (2008). Greenland has the highest capital and operational costs in the Arctic
(similar to East Arctic Russia). It seems reasonable that it might take a couple of decades before the
production in this challenging region can start. Production from their large amount of currently
undiscovered oil resources (cf. Figure 1) are gradually phased in, leading to a rapid increase in oil
production after 2030. However, one might question if the steep rise in volume according to our
results is really feasible. Considering the historic development in arctic oil production (Figure 5),
Arctic Russia managed to increase onshore output with almost 400 mtoe over a similar time frame at
the very beginning of the Arctic Russian oil era. The capacity of the petroleum industry to overcome
the offshore and ice challenges might modify the rapid entry of Greenland reserves, though.
From Table 1 we see that the arctic share of Non-OPEC supply of conventional oil is clearly increasing,
and so is the arctic share of total Non-OPEC supply when including unconventional oil, but less
markedly. Hence, in our reference scenario the Arctic clearly increases its importance as oil supplier
outside OPEC. In relation to world oil supply the Arctic slightly reduces its share from 10 per cent to 8
per cent in 2050. The reason for this is that OPEC is a residual supplier and increases production to make
the oil price follow the given path of the reference scenario presumingly reflecting the preferences of the
cartel. The high share of arctic supply in conventional oil represents an advantage as unconventional
reserves are considerably more vulnerable to climate and environmental policies.
Table 1. Arctic oil production in relation to Non-OPEC and global supply. Reference scenario. Per cent
2010 2050Arctic share of Non-OPEC conventional oil 16 31Arctic share of total Non-OPEC 16 22Arctic share of world oil production 10 8

17
Figure 7 Arctic oil production in relation to Non-OPEC and global supply. Reference scenario. Mtoe
0
2000
4000
6000
8000
10000
12000
2010 2015 2020 2025 2030 2035 2040 2045 2050
Mto
e
Total World Oil Production
Total Non-OPEC oil production
Total Non-OPEC conv.
Total Arctic
From Figure 7 we see that total Non-OPEC conventional oil is rising initially but peaks around 2025,
entering a somewhat lower and slowly declining level. Non-OPEC unconventional oil is filling in,
ensuring a continued growth in Non-OPEC total oil supply until around 2045. However, the increase
in unconventional oil supply is far from enough to keep up with the steeply rising trend in global oil
demand, and the world will have to rely even more on OPEC in the future along the reference
scenario. The arctic oil supply continues to increase towards the end of the period due to production
increase in Alaska and Greenland.
The IEA reference scenario covers the period 2008-2030. As our reference price scenario and the IEA
2 °C price path are equal until 2030, it is possible to compare the results for oil production in this
period. Our world oil output is around 20 per cent higher than IEA in 2030. The main reason is higher
Non-OPEC supply (incl. unconventional) but also higher OPEC output.
The model results show that the future gas price differs somewhat between the regions, albeit less than
today. The world average natural gas price is around 0.23 USD (2008 prices)/Sm3 in 2050, around 35
per cent higher than in 2010. Figure 8 shows total arctic natural gas production. Similar to oil, gas
production increased from the mid-sixties to around 1990. Production in the beginning of the 2000s is
marginally higher than the record levels reached during 1990-1992. As much as 70 per cent of the total
arctic undiscovered gas reserves are found in Arctic Russia. The total arctic supply of gas will decline
until about 2035-2040, due to a marked reduction in Russian volumes. When production rises again
after 2040 it is partly due to a Russian comeback, but primarily a result of marked increases in gas
supply from the other arctic regions, although from generally low levels (see Figure 9).

18
Figure 8 Arctic gas production. Reference scenario. Mtoe.
0
100
200
300
400
500
600
1950 1960 1970 1980 1990 2000 2010 2020 2030 2040 2050
Mto
e
Total Arctic
Arctic Russia
Arctic Canada
Alaska
Arctic Norw ay
Greenland
Almost all of the Arctic Russian gas production currently takes place onshore in the region of Yamal-
Nenets. Our model projections show that Arctic Russian production in 2020 will be around 85 per cent
of the level in 2004. Such a decline may seem dramatic. Stern (2005) finds that total Russian output6
from existing fields in operation in 2020 will be 63 per cent of the level in 2004. However, Stern does
not take into account production from proven, but undeveloped reserves and consequently he projects
a steeper decline than found in our projection. Stern (2009) points out that the Russian gas industry for
the past several decades has been sustained by three supergiant fields, all of which were in decline by
the early 2000s. During the period 2001-2008 Gazprom developed one supergiant field and a number
of smaller satellite fields, which enabled the production to stabilize during 2000-2010. In addition, due
to the financial crisis and reduced demand for Russian gas the last couple of years, the development
e.g. of the new giant Bovanenko gas field on the Yamal Peninsula has been postponed to start up in
2012, at the earliest. Our results show that Russia increases its investments in new reserves, sufficient
to increase gas volumes from the late 2030s. Increased gas production takes place almost only in West
Arctic Russia as this region has the major part of the undiscovered reserves as well as lower capital
and operational costs than East Arctic Russia7.
In Alaska, a large part of the gas supply is not delivered to customers, but is used for e.g.
repressurization in the oil production. Even if Alaska has around 14 per cent of total arctic
undiscovered gas resources (Figure 2), these resources will only gradually be developed, leading to
6 In 2004 the Arctic share of total Russian gas output was around 90 per cent. 7 The eastern part increases its share of Arctic Russian gas production from 0.4 to 1.2 per cent.

19
stagnant production until gas supply increases from around 2035 (Figure 9). This is likely to be
conditioned by the construction of an Alaskan North Slope natural gas pipeline, similar to the existing
pipeline pumping oil to the southern warm-water Alaskan port of Valdez. Likewise, the surge in
Canadian Arctic gas production is clearly dependent on the building of the Mackenzie Valley gas
pipeline, bringing arctic gas from the Mackenzie delta to the markets in Alberta and beyond. This
project has been postponed several times, partly due to falling demand and gas prices in the US, but
also due to aboriginal land claims and land access issues (Parliamentary Infoseries, 2008). The latter
issue was recently accentuated as the aboriginals managed to stop seismic operations in the Baffin
Bay, as the self-government agreement demands that the aboriginals are consulted prior to these kind
of activities (Winnipeg Free Press, 2010).
Figure 9 Regional distribution of West Arctic gas production. Reference scenario. Mtoe
0
5
10
15
20
25
30
35
40
2000 2005 2010 2015 2020 2025 2030 2035 2040 2045 2050
Mto
e
Arctic Canada
Alaska
Arctic Norw ay
Greenland
In Arctic Norway, there is currently gas production in the Norwegian Sea, and in one field in the
Barents Sea (Snøhvit). The Snøhvit gas field was proven in the late 1980s, and started producing in
2007. Production from the currently undiscovered gas resources (cf. Figure 2) are gradually phased in,
leading to somewhat more than a doubling of the Arctic Norwegian production level over the 40 year
period. No Greenland gas reserves have yet been proven, however, as much as 8 per cent of the total
Arctic gas resources are expected to be found there. With relatively high capital and operational costs,
it seems reasonable with a lag of two decades before the production in this challenging region can
start. Production increases as from around 2035, reaching about the same level of the other West
Arctic regions in 2050.
20
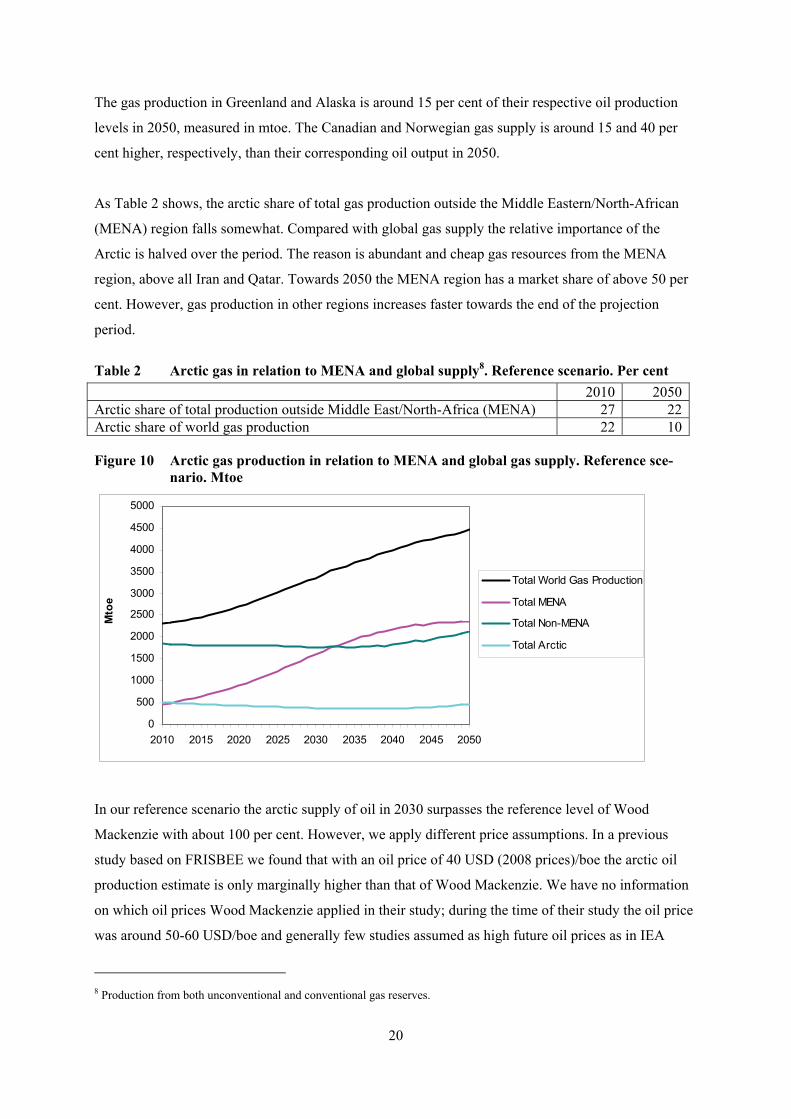
The gas production in Greenland and Alaska is around 15 per cent of their respective oil production
levels in 2050, measured in mtoe. The Canadian and Norwegian gas supply is around 15 and 40 per
cent higher, respectively, than their corresponding oil output in 2050.
As Table 2 shows, the arctic share of total gas production outside the Middle Eastern/North-African
(MENA) region falls somewhat. Compared with global gas supply the relative importance of the
Arctic is halved over the period. The reason is abundant and cheap gas resources from the MENA
region, above all Iran and Qatar. Towards 2050 the MENA region has a market share of above 50 per
cent. However, gas production in other regions increases faster towards the end of the projection
period.
Table 2 Arctic gas in relation to MENA and global supply8. Reference scenario. Per cent
2010 2050Arctic share of total production outside Middle East/North-Africa (MENA) 27 22Arctic share of world gas production 22 10
Figure 10 Arctic gas production in relation to MENA and global gas supply. Reference sce-nario. Mtoe
0
500
1000
1500
2000
2500
3000
3500
4000
4500
5000
2010 2015 2020 2025 2030 2035 2040 2045 2050
Mto
e
Total World Gas Production
Total MENA
Total Non-MENA
Total Arctic
In our reference scenario the arctic supply of oil in 2030 surpasses the reference level of Wood
Mackenzie with about 100 per cent. However, we apply different price assumptions. In a previous
study based on FRISBEE we found that with an oil price of 40 USD (2008 prices)/boe the arctic oil
production estimate is only marginally higher than that of Wood Mackenzie. We have no information
on which oil prices Wood Mackenzie applied in their study; during the time of their study the oil price
was around 50-60 USD/boe and generally few studies assumed as high future oil prices as in IEA
8 Production from both unconventional and conventional gas reserves.

21
(2009). Hence, our model results may actually not deviate much from the Wood Mackenzie study if
we adjust for different oil price assumptions. In addition, we apply larger undiscovered resources in
line with the USGS estimate from 2008, but only a relatively small amount of these resources
materialize into production before 2030 and cannot explain the difference.
Our estimate of arctic production level of gas in 2030 is around 50 per cent higher than Wood
Mackenzie. However, Wood Mackenzie also depicts a more optimistic scenario for future production
where gas supply will peak at almost 10 mboe/day in 2030. This is actually 20 per cent higher than our
gas supply level for this year.
5.2 Low price scenario
Figures 11-12 show the development of arctic oil supply if the oil price follows the 2 °C price scenario
of IEA. Total arctic oil production in 2050 turns out to be 20 per cent lower than in the reference
scenario. In relative terms Russia is cutting production the most (24 per cent), followed by Greenland
(21 per cent) and Alaska (17 per cent). Russia will not contribute to a rise in arctic oil production after
2030 and ends up below today’s level in 2050. Arctic Norway reduces production until 2030-35, but
achieves a higher output in 2050 in the low price scenario than in the reference scenario. The reason is
that with a lower future oil price the extraction is lower from around 2020 to 2045. This leaves more
oil in the reservoirs and thus delays the increase in cost of developing new reserves towards the end of
the time horizon.
Figure 11 Arctic oil production. Reference and low oil price scenarios. Mtoe.
0
100
200
300
400
500
600
700
800
900
1950 1960 1970 1980 1990 2000 2010 2020 2030 2040 2050
Mto
e
Total Arctic
Total Arctic - Low oil price
Arctic Russia
Arctic Russia - Low oil price
Alaska
Alaska - Low oil price
Greenland
Greenland - Low oil price
Arctic Norw ay
Arctic Norw ay - Low oil price
Arctic Canada
Arctic Canada - Low oil price
22
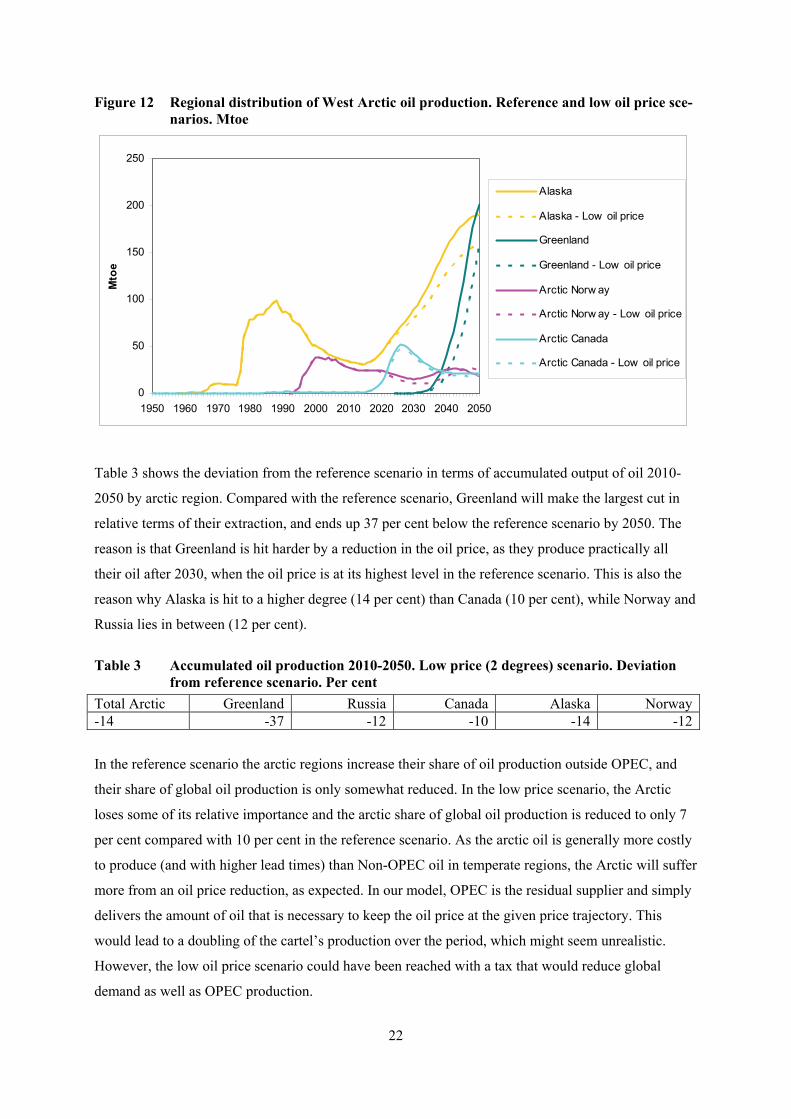
Figure 12 Regional distribution of West Arctic oil production. Reference and low oil price sce-narios. Mtoe
0
50
100
150
200
250
1950 1960 1970 1980 1990 2000 2010 2020 2030 2040 2050
Mto
e
Alaska
Alaska - Low oil price
Greenland
Greenland - Low oil price
Arctic Norw ay
Arctic Norw ay - Low oil price
Arctic Canada
Arctic Canada - Low oil price
Table 3 shows the deviation from the reference scenario in terms of accumulated output of oil 2010-
2050 by arctic region. Compared with the reference scenario, Greenland will make the largest cut in
relative terms of their extraction, and ends up 37 per cent below the reference scenario by 2050. The
reason is that Greenland is hit harder by a reduction in the oil price, as they produce practically all
their oil after 2030, when the oil price is at its highest level in the reference scenario. This is also the
reason why Alaska is hit to a higher degree (14 per cent) than Canada (10 per cent), while Norway and
Russia lies in between (12 per cent).
Table 3 Accumulated oil production 2010-2050. Low price (2 degrees) scenario. Deviation from reference scenario. Per cent
Total Arctic Greenland Russia Canada Alaska Norway-14 -37 -12 -10 -14 -12
In the reference scenario the arctic regions increase their share of oil production outside OPEC, and
their share of global oil production is only somewhat reduced. In the low price scenario, the Arctic
loses some of its relative importance and the arctic share of global oil production is reduced to only 7
per cent compared with 10 per cent in the reference scenario. As the arctic oil is generally more costly
to produce (and with higher lead times) than Non-OPEC oil in temperate regions, the Arctic will suffer
more from an oil price reduction, as expected. In our model, OPEC is the residual supplier and simply
delivers the amount of oil that is necessary to keep the oil price at the given price trajectory. This
would lead to a doubling of the cartel’s production over the period, which might seem unrealistic.
However, the low oil price scenario could have been reached with a tax that would reduce global
demand as well as OPEC production.

23
Table 4. Arctic oil production in relation to Non-OPEC and global supply. Reference and low price scenarios. Per cent
2010 Reference scenario 2050
Low oil price scenario 2050
Arctic share of Non-OPEC conventional oil 16 32 28Arctic share of total Non-OPEC 16 22 20Arctic share of world oil production 10 8 7
Figure 13 Arctic oil production in relation to Non-OPEC and global supply. Low oil price sce-nario. Mtoe
0
2000
4000
6000
8000
10000
12000
2010 2015 2020 2025 2030 2035 2040 2045 2050
Mto
e
Total World Oil Production
Total Non-OPEC oil production
Total Non-OPEC conv.
Total Arctic
We also see from Figure 13 that while total Non-OPEC output peaks towards the end of the period,
arctic oil production is still on an increasing trend due to Greenland and Alaska.
Arctic oil production in FRISBEE reaches a level of 8.4 mboe/day in 2030 in the low oil price
scenario of 90 USD/boe. In addition to their reference level of 3.2 mboe/day, Wood Mackenzie depicts
what they call a more optimistic scenario for future production where oil supply will peak at 4.6
mboe/day in 2030. To match this level of oil production, FRISBEE would have to assume a constant
low oil price of about 50 USD (2008 prices)/boe.
In our model oil and gas companies operate as separate industries and investment decisions are not
influenced by each other. Hence, less profitable investment opportunities in the gas market will not
affect the oil market and vice versa. Due to relatively small substitution possibilities on the demand
side between oil and gas, the arctic gas production scenario with a lower oil price is practically
identical to the reference oil price scenario.

24
5.3 High price scenario
In this scenario the oil price reaches 140 USD by 2030 and stays at this level to 2050. Total arctic oil
production reaches a level in 2050 which is 12 per cent above the reference scenario (Figure 14). Russian
deliveries are 18 per cent above reference level by the end of the period, but show a more marked
tendency to peak before 2050 than in the reference scenario. As the oil price is higher in this scenario,
production is also higher from around 2025 as expected, but the development costs rise faster as reserves
are being depleted and creates the more distinct peak formation. Alaska produces 13 per cent more at the
end of the horizon, Canada 11 per cent and Greenland only 3 per cent above the reference level in 2050.
Figure 14. Arctic oil production. Reference and high oil price scenarios. Mtoe
0
100
200
300
400
500
600
700
800
900
1000
1950 1960 1970 1980 1990 2000 2010 2020 2030 2040 2050
Mto
e
Total Arctic - High oil price
Total Arctic
Arctic Russia - High oil price
Arctic Russia
Alaska - High oil price
Alaska
Greenland - High oil price
Greenland
Arctic Norw ay - High oil price
Arctic Norw ay
Arctic Canada - High oil price
Arctic Canada
Figure 15. Regional distribution of West Arctic oil production. Reference and high oil price scenarios. Mtoe
0
50
100
150
200
250
1950 1960 1970 1980 1990 2000 2010 2020 2030 2040 2050
Mto
e
Alaska - High oil price
Alaska
Greenland - High oil price
Greenland
Arctic Norw ay - High oil price
Arctic Norw ay
Arctic Canada - High oil price
Arctic Canada

25
Table 5 shows the impact of the higher price in terms of accumulated oil production by region. In
total, arctic regions will produce 11 per cent more in the high price scenario than in the reference
scenario. Greenland responds strongly to the high price by increasing accumulated production by as
much as 26 per cent, whereas the other regions increase oil production in the range of 7-11 per cent.
East Arctic Russia extracts 15 per cent more. Greenland and East Arctic Russia responds more
strongly in cumulative terms because all their production takes place at the end of the period when the
price difference to the reference scenario is largest. In addition, these two regions have the highest
costs and benefit relatively more from an increase in the oil price. Note, however, that such a
development requires that the oil and gas companies will get full access to the reserves in the Arctic
and that no environmental and political constraints are binding.
Table 5 Accumulated oil production 2010-2050. High price scenario. Deviation from refer-ence scenario. Per cent
Total Arctic Greenland Russia Canada Alaska Norway11 26 10 7 11 9
Table 6 Arctic oil in relation to Non-OPEC, and global supply. Reference and high oil price scenarios. Per cent
2010 Reference scenario 2050
High oil price scenario 2050
Arctic share of Non-OPEC conventional oil 16 32 31Arctic share of total Non-OPEC 16 22 23Arctic share of world oil production 10 8 16
Figure 16 Arctic oil production in relation to Non-OPEC and global supply. High oil price scenario. Mtoe
0
1000
2000
3000
4000
5000
6000
7000
8000
2010 2015 2020 2025 2030 2035 2040 2045 2050
Mto
e
Total World Oil Production
Total Non-OPEC oil production
Total Non-OPEC conv.
Total Arctic
In the high price scenario the Arctic roughly maintains the position it had in the reference scenario in
relation to other Non-OPEC producers of conventional oil and also among all Non-OPEC producers

26
including unconventional oil. The Arctic clearly takes a higher share in global oil markets by 2050,
increasing from 8 to 16 per cent of global output. This is a result of OPEC behaving like a cartel by
regulating the production to sustain the price level in line with IEA assumptions. We can conclude that
the potential for increasing output with a higher oil price is as high in the Arctic as in more temperate
Non-OPEC regions. Figure 16 illustrates the path of oil supply from the different producer groups. We
also see that arctic oil supply peaks some years later than total Non-OPEC. The gas market is again
relatively little affected by an oil price increase, as was discussed earlier.
5.4 A 50 per cent reduction in undiscovered resources
The estimate of undiscovered resources in the Arctic is uncertain, but the West Arctic regions have
some institutional benefits that are important to the private international oil companies. In these
regions the oil companies can buy licenses and get access to the petroleum reserves and associated
petroleum rent. Globally, this opportunity has diminished as the state owned national oil companies
(NOC) now control the majority of the petroleum reserves. There is, however, uncertainty to what
extent future production in Russia will be based on profitability and international access to reserves.
Figure 17 Arctic oil production. Reference and low resource scenarios. Mto
0
100
200
300
400
500
600
700
800
900
1950 1960 1970 1980 1990 2000 2010 2020 2030 2040 2050
Mto
e
Total Arctic
Total Arctic - Low R
Arctic Russia
Arctic Russia - Low R
Alaska
Alaska - Low R
Greenland
Greenland - Low R
Arctic Norw ay
Arctic Norw ay - Low R
Arctic Canada
Arctic Canada - Low R
In addition, many regions experience concerns about possible environmental hazards with petroleum
drilling and transportation in arctic cold waters. To simulate such a possible scenario with
environmental or political constraints, we reduce the amount of arctic undiscovered resources that the
petroleum companies get access to by 50 per cent.
If undiscovered resources are expected to be only half of the USGS 2008 estimate, the Arctic will
practically not provide rising oil volumes before 2030, when production climbs until it peaks around

27
2045 at a level somewhat above the peak level of the late 1980s. In 2050 the output is 33 per cent
below the reference scenario. Only about 25 per cent of the reduction can be traced to Arctic Russia,
with peaking supply around 2040 at about the 2010 output level. Even if these low resource estimates
are more in line with Wood Mackenzie, our production level in 2030 is still much higher. The reason
is that our production projection has hardly changed prior to 2030 due to lower undiscovered
resources. Table 7 shows the reduction in accumulated supply by region over the whole time horizon.
Figure 18 Regional distribution of West Arctic oil production. Reference and low resource scenarios. Mtoe
0
50
100
150
200
250
1950 1960 1970 1980 1990 2000 2010 2020 2030 2040 2050
Mto
e
Alaska
Alaska - Low R
Greenland
Greenland - Low R
Arctic Norw ay
Arctic Norw ay - Low R
Arctic Canada
Arctic Canada - Low R
Table 7 Accumulated oil production 2010-2050. Low resource scenario. Deviation from ref-erence scenario. Per cent
Total Arctic Greenland Russia Canada Alaska Norway-15 -33 -6 -38 -33 -33
The reduction in Arctic Russia is moderate because the region has considerable discovered reserves
that support production for most of the time horizon and the effects on production of reduced
undiscovered resources would largely come beyond 2050. This is the reason why West Arctic Russia
loses only 5 per cent of their accumulated oil production. However, we emphasize that East Arctic
Russia is hit more as they lose around 20 per cent of their production, because a larger share of their
production is dependent on undiscovered resources. The cut in production is generally around 33-37
per cent in the other regions than Arctic Russia as more of their oil come from the undiscovered
resources before 2050.
To indicate the importance of new discoveries for the West Arctic regions, we have done a simulation
of future supply for Alaska including only already discovered reserves, i.e. we assume that no new oil
resources will be found and developed. Then Alaskan production will reach 17 mtoe in 2050, less than

28
10 per cent of the level in our reference scenario with full access to new discoveries. DOE/NETL
(2009) projects the Alaskan production from already discovered fields in 2050 to be only around half
of our no discovery level. However, contrary to our simulation DOE/NETL does not take into account
reserve extensions through increased oil recovery from discovered fields over the period.
Figure 19 shows the effects of reduced arctic gas reserves on supply. Towards the end of the time
period and after a long and steep decline, arctic gas supply is on the rise showing no sign of immediate
peak, even though the undiscovered resources have been reduced considerably. We see that Arctic
Russia and, hence, total Arctic is only to a small extent affected by a reduction in undiscovered
resources. The reason is the same as for oil, but now even more important, that the vast majority of gas
production in Russia before 2050 is from proven and already discovered reserves. As opposed to oil,
the effect now holds for both the East and the West Arctic Russian regions. Even though gas
production of the West Arctic regions is hit more, the effect is much lower than for oil. We see from
Table 9 that the share of arctic gas in a global context is practically unchanged.
Figure 19 Arctic gas production. Reference and low resource scenarios. Mtoe
0
100
200
300
400
500
600
1950 1960 1970 1980 1990 2000 2010 2020 2030 2040 2050
Mto
e
Total Arctic
Total Arctic - Low R
Arctic Russia
Arctic Russia - Low R
Alaska
Alaska - Low R
Greenland
Greenland - Low R
Arctic Norw ay
Arctic Norw ay - Low R
Arctic Canada
Arctic Canada - Low R
Even if the production level is lower in 2050 than today, one might wonder if the size of future Arctic
Russian oil and gas output from proven, but undeveloped reserves is really feasible. The Arctic
Russian oil and gas production currently takes place onshore and the Russians have long experience
with this type of activities (Stern, 2009). We emphasize that significant discoveries of oil and gas have
also been made offshore in the Barents and the Kara Seas, like the Shtokman deepwater gas and
condensate field and the shallow water Prirazlomnoye oil field (Yenikeyeff and Krysiek, 2007).
However, when it comes to proven reserves, Stern (2009) points out that even if the Shtokman gas
29
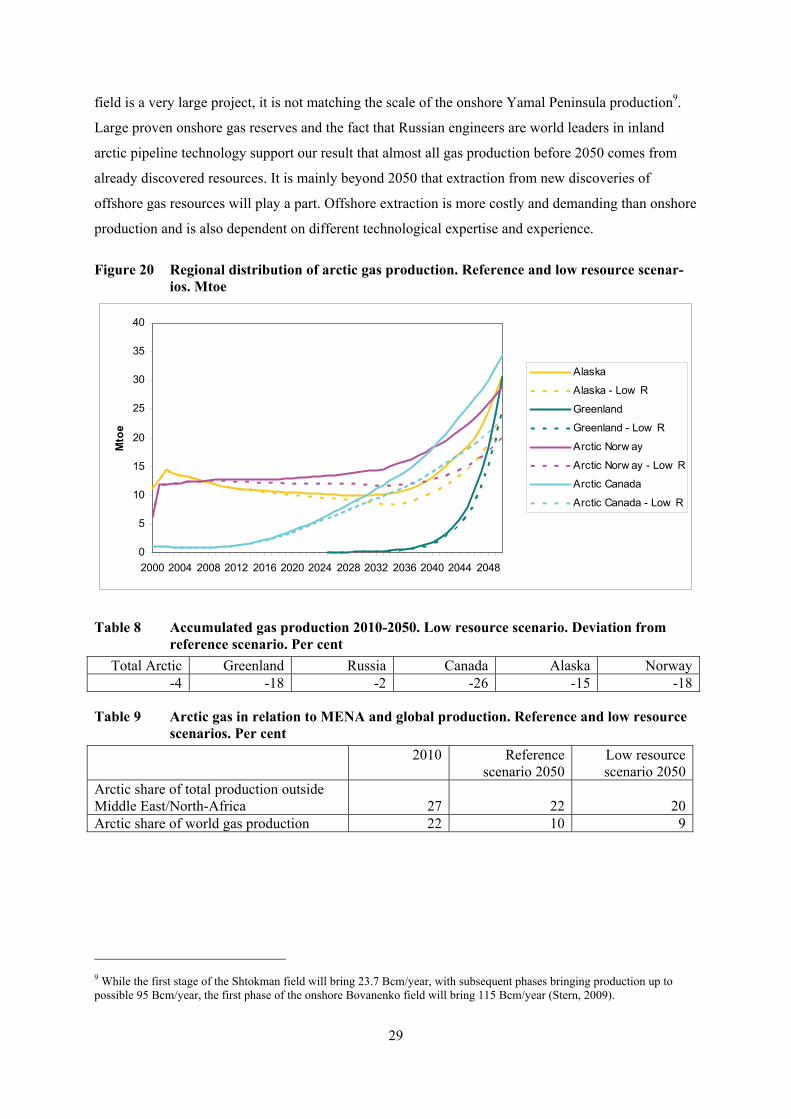
field is a very large project, it is not matching the scale of the onshore Yamal Peninsula production9.
Large proven onshore gas reserves and the fact that Russian engineers are world leaders in inland
arctic pipeline technology support our result that almost all gas production before 2050 comes from
already discovered resources. It is mainly beyond 2050 that extraction from new discoveries of
offshore gas resources will play a part. Offshore extraction is more costly and demanding than onshore
production and is also dependent on different technological expertise and experience.
Figure 20 Regional distribution of arctic gas production. Reference and low resource scenar-ios. Mtoe
0
5
10
15
20
25
30
35
40
2000 2004 2008 2012 2016 2020 2024 2028 2032 2036 2040 2044 2048
Mto
e
Alaska
Alaska - Low R
Greenland
Greenland - Low R
Arctic Norw ay
Arctic Norw ay - Low R
Arctic Canada
Arctic Canada - Low R
Table 8 Accumulated gas production 2010-2050. Low resource scenario. Deviation from reference scenario. Per cent
Total Arctic Greenland Russia Canada Alaska Norway-4 -18 -2 -26 -15 -18
Table 9 Arctic gas in relation to MENA and global production. Reference and low resource scenarios. Per cent
2010 Reference scenario 2050
Low resource scenario 2050
Arctic share of total production outside Middle East/North-Africa 27 22 20Arctic share of world gas production 22 10 9
9 While the first stage of the Shtokman field will bring 23.7 Bcm/year, with subsequent phases bringing production up to possible 95 Bcm/year, the first phase of the onshore Bovanenko field will bring 115 Bcm/year (Stern, 2009).

30
Concluding remarks We have examined how different petroleum prices and petroleum resource endowments influence
future investment and production in the arctic regions up to 2050. In our reference scenario the arctic
oil production doubles over the next 40 years. The reason is above all increased production in
Greenland and Alaska, and to some extent Arctic Russia. In our reference scenario arctic gas
production declines towards 2030 before it recovers to a level marginally lower than the present one
by 2050. The decline in arctic gas supply during the first two decades is mainly related to lower gas
production in Arctic Russia, whereas the later increase is due to higher production in all arctic regions,
primarily in Arctic Russia and Greenland and to some extent in Arctic Canada. These results are based
on assumption of profitability and of oil and gas companies having full access to all arctic areas that
contain petroleum, i.e. there are no political or environmental restrictions.
In our low oil price scenario the production in arctic regions is reduced to the same extent in relative
terms, except for Greenland (and East Arctic Russia) that is hit more because the major part of their
production takes place from 2030 to 2050, when the oil price of the reference scenario is at its highest
level. In addition, East Arctic Russia and Greenland have the highest costs and lose relatively more
than other arctic regions from a decline in the oil price. The same mechanism works with an oil price
increase as in the high price scenarios, but in the opposite direction.
When the oil and gas companies only get access to half of the undiscovered resources compared to the
reference scenario, all arctic regions except Russia are hit relatively hard within our time frame. The
reason is that a major part of Russian oil and gas production before 2050 comes from proven reserves
and not from undiscovered resources. Because Arctic Russia is a dominant petroleum producer in the
Arctic, access to less undiscovered oil resources will only have limited effect on total arctic oil
production and only a marginal effect on arctic gas extraction. However, for the individual arctic
region other than Russia, limited access to resources will clearly affect future income from oil and gas
before 2050.
Today, the Arctic is much more important as a gas supplier than as an oil producer for the global
energy demand. However, even though 70 per cent of the undiscovered arctic petroleum resources are
natural gas, the arctic share of world production declines to 2050, even with full access to
undiscovered resources. The reason is cheap and abundant reserves in other regions, above all Qatar
and Iran. Arctic oil will increase its importance as a Non-OPEC supplier to 2050. Its importance as a
global oil producer may be maintained, if the oil price stays relatively high and the producers get
access to a major part of the undiscovered arctic oil resources, above all in Alaska and Greenland.
31
References
AMAP (2007): Arctic Oil and Gas 2007, Arctic Monitoring and Assessment Programme.
Aune, F.R., S. Glomsrød, L. Lindholt and K.E. Rosendahl (2005): Are high oil prices profitable for
OPEC in the long run? Discussion Papers No. 416, Statistics Norway.
Aune, F.R. Rosendahl, K.E. and E.L. Sagen (2009): Globalization of Natural Gas Markets - Effects on
Prices and Trade patterns. Energy Journal 30, Special Issue: World Natural Gas Markets and Trade: A
Multi-Modelling Perspective, 39-53.
Aune, F.A. Mohn, K., Osmundsen, P. and K.E. Rosendahl (2010): Industry restructuring, OPEC
response - and oil price formation. Energy Economics 32 (2), 389-398.
Barents Observer (2010): Prirazlomnoye drilling in 2011?, 15. October,
http://www.barentsobserver.com/prirazlomnoye-drilling-in-2011.4830939.html.
BP (2010): Statistical Review of World Energy, see historical data: www.bp.com.
DOE/NETL (2009): Alaska North Slope Oil and Gas: A Promising Future or an Area in Decline?,
1385 Addendum Report, April 8.
EIA (2008): Analysis of Crude Oil Production in the Arctic National Wildlife Refuge, Energy Information Administration, SR/OIAF/2008-03.
EIA (2010a): International Energy Outlook 2010, US Energy Information Administration,
http://www.eia.doe.gov/oiaf/ieo/index.html.
EIA (2010b): Country Analysis Brief – Canada,
http://www.eia.doe.gov/cabs/Canada/Background.html
Gautier, D.L., Bird, K.J., Charpentier, R.R., Grantz, A., Houseknecht, D.W., Klett, T.R., Moore, T.E.,
Pitman, J.K., Schenk, C.J., Schuenemeyer, J.H., Sørensen, K., Tennyson, M.E., Valin, Z.C., and C. J.
Wandrey (2009): Assessment of Undiscovered Oil and Gas in the Arctic, Science 324, no. 5931,
May, 1175-1179.

32
Glomsrød, S. and I. Aslaksen, eds. (2009): The Economy of the North 2008, Statistical Analysis 112,
Statistics Norway.
Guardian (2010): Cairn Energy Announces Greenland Oil Find, 21. September.
IEA (2008): World Energy Outlook 2009, OECD/IEA Paris
IEA (2009): World Energy Outlook 2009, OECD/IEA Paris
IEA (2010): World Energy Outlook 2010, OECD/IEA Paris
Kretzschmar, G.L., Kirchner, A. and L. Sharifzyanova (2010): Resource Nationalism-Limits to
Foreign Direct Investment, Energy Journal 31 (2), 27-52.
NPC (2007): Hard Truths. Facing the Hard Truths about Energy, Report from The National Petroleum
Council, July.
Oil & Gas Journal (2006): WoodMac: Arctic Has Less Oil Than Earlier Estimated, Nov 13, p. 18-30.
OPEC (2009): World Oil Outlook, OPEC, Vienna
Parliamentary Infoseries (2008): The Arctic: Hydrocarbon reserves, Parliamentary Infoseries and
Research Service, PRB 08-07E, 24. October.
Reuters (2010): Eni Sees Goliat Oil Field on Stream in November 2013, Reuters 27. January.
Rigzone (2010): Gazprom Delays Start-up of Shtokman to 2016, 5. February.
Salameh, MR. (2004): How Realistic are OPEC´s Oil Reserves?, Petroleum Review, October.
Stern, J.P. (2005): The Future of Russian Gas and Gazprom, Oxford: OUP, p.32.
Stern, J.P. (2009): Future Gas production in Russia: Is the Concern about Lack of Investment
Justified?, Oxford: NG 35.
UNEP/GRID (2006): Arctic Oil and Gas Issues: Statoil and Training Awareness, Report.

33
UNFCCC 2010: http://unfccc.int/home/items/5262.php
USGS (U.S. Geological Survey) (2000): World Petroleum Assessment 2000
(http://greenwood.cr.usgs.gov/energy/WorldEnergy/DDS-60).
USGS (2008): Fact Sheet 2008- 3049, http://energy.usgs.gov/Arctic/
Winnipeg Free Press (2010); Stop seismic Testing in Lancaster Sound, 30. July.
Wood Mackenzie (2006): Future of the Arctic - A new dawn for exploration.
Yenikeyeff, S.M. and T.F. Krysiek (2007): The Battle for the Next Energy Frontier, Oxford Energy
Comment. August.

34
Appendix: List of region and field categories in the FRISBEE model Table A1. List of oil regions and field categories in the FRISBEE model
Oil field category
1 2 3 4
Africa Onshore
Offshore deep < 400 Mboe
Offshore deep > 400 Mboe
Offshore shallow
Canada Arctic
Non-Arctic conv.
Unconventional
Open Pit Unconventional In
Situ
Caspian region Onshore
< 400 Mboe Onshore
> 400 Mboe Offshore
< 400 Mboe Offshore
> 400 Mboe
China Onshore
< 100 Mboe Onshore
>100; < 1000 MboeOnshore
> 1000 Mboe Offshore
Eastern Europe Onshore
< 100 Mboe Onshore
> 100 Mboe Offshore
< 100 Mboe Offshore
> 100 Mboe
Greenland All
Latin America Onshore
Offshore deep < 1000 Mboe
Offshore deep > 1000 Mboe
Offshore shallow
Norway Arctic Non-Arctic Offshore
deep Non-Arctic Offshore
shallow < 100 Mboe
Non-Arctic Offshore shallow
> 100 Mboe
OECD Pacific Onshore
Offshore deep Offshore shallow
< 100 Mboe Offshore shallow
> 100 Mboe
OPEC Core Onshore
< 400 Mboe Onshore
> 400; < 1000 MboeOnshore
> 1000 Mboe Offshore
Rest of Asia Onshore
< 400 Mboe Onshore
> 400 Mboe Offshore
< 400 Mboe Offshore
> 400 Mboe
OPEC Rest Onshore
< 400 Mboe Onshore
> 400 Mboe Offshore deep
Offshore shallow
Russia/Ukraine/Belarus
Non-Arctic Onshore
Non-Arctic Offshore East Arctic West Arctic
USA Non-Arctic
Onshore Alaska
Non-Arctic Offshore
deep Non-Arctic
Offshore shallow
Western Europe Offshore deep < 400 Mboe
Offshore deep > 400 Mboe
Offshore shallow + Onshore
< 100 Mboe
Offshore shallow > 100 Mboe
United Kingdom Offshore deep < 400 Mboe
Offshore deep > 400 Mboe
Offshore shallow < 100 Mboe
Offshore shallow > 100 Mboe

35
Table A2. List of gas regions and field categories in the FRISBEE model
Gas10 field category
1 2 3 4
Africa Onshore
< 100 Mboe Onshore
> 100 Mboe Offshore shallow Offshore deep
Canada Arctic Non-Arctic Onshore Non-Arctic Offshore
shallow Non-Arctic
Offshore deep
Caspian region Onshore
< 100 Mboe Onshore
> 100 Mboe Offshore shallow Offshore deep
China Onshore
< 100 Mboe Onshore
> 100 Mboe Offshore shallow Offshore deep
Eastern Europe Onshore
< 100 Mboe Onshore
> 100 Mboe Offshore shallow Offshore deep
Greenland All
Latin America Onshore
< 100 Mboe Onshore
> 100 Mboe Offshore shallow Offshore deep
Norway Arctic Non-Arctic Onshore Non-Arctic Offshore
shallow Non-Arctic
Offshore deep
OECD Pacific Onshore
< 100 Mboe Onshore
> 100 Mboe Offshore shallow Offshore deep
OPEC Core Onshore
< 100 Mboe Onshore
> 100 Mboe Offshore Venezuela
Rest of Asia Onshore
< 100 Mboe Onshore
> 100 Mboe Offshore shallow Offshore deep
OPEC Rest Nigeria
Onshore Offshore Angola
Russia/Ukraine/Belarus
Non-Arctic Onshore
Non-Arctic Offshore East Arctic Russia West Arctic Russia
USA Non-Arctic
Onshore Alaska Non-Arctic Offshore
shallow Non-Arctic
Offshore deep
Western Europe Onshore
< 100 Mboe Onshore
> 100 Mboe Offshore shallow Offshore deep
United Kingdom Onshore
< 100 Mboe Onshore
> 100 Mboe Offshore shallow Offshore deep
10 Conventional and unconventional.