Larry Dribin, Ph - CQAA 2009/CQAA Metric… · ITMPI005 Larry Dribin, Ph.D . Pearl Street Group,...
61
ITMPI005 Larry Dribin, Ph.D. Pearl Street Group, Inc. [email protected] Cell: 847-807-7390 Metrics for Testing Excellence! V1-0 November 18, 2009
Transcript of Larry Dribin, Ph - CQAA 2009/CQAA Metric… · ITMPI005 Larry Dribin, Ph.D . Pearl Street Group,...
ITMPI005
Larry Dribin, Ph.D.
Pearl Street Group, [email protected]
Cell: 847-807-7390
Metrics for Testing Excellence!V1-0
November 18, 2009

11-18-2009Metrics Testing Excellence v1-0 - Pearl Street Group © 2009 2
Larry’s Background
♦ Process Improvement & Metrics Consultant
♦ Adjunct Professor, Software Engineering, DePaul University
♦ ABN Amro ♦ Advocate Medical
Group♦ Alltel Information
Systems♦ Allstate♦ American Electric
Power♦ American Red Cross♦ Assurant Health♦ AT & T♦ Baan♦ Bear Stearns
Partial Client List
♦ Eli Lilly♦ GEICO♦ Great West Healthcare♦ Highmark Blue Cross♦ JP Morgan Chase ♦ Procter & Gamble♦ QuadTech♦ Teleflex Medical♦ Tribune Corporation♦ United Plastics Group♦ US Bank♦ Walgreens♦ Western Digital
Business & IT Process &
Measurement Improvement
Services:
♦ Process Development
♦ Measurement Development
Project Management
Services:
♦ Critical Project Recovery
♦ PMO Implementation
♦ Portfolio Alignment
PSG Services

11-18-2009Metrics Testing Excellence v1-0 - Pearl Street Group © 2009 3
♦ Testing Process Improvement
♦ Linking Process Improvement and Measurement
♦ Testing Process and Metrics
♦ Testing Measurement Program Design
♦ Summary
The goal for this workshop is to discuss how measurement and process improvement can be used to improve a testing organizations performance.
The goal for this workshop is to discuss how measurement and process improvement can be used to improve a testing organizations performance.
Agenda

11-18-2009Metrics Testing Excellence v1-0 - Pearl Street Group © 2009 4
Our World – Volatile Global Competition
TimeTime
CostsCosts
BarriersBarriers
QualityQuality
Features/ Features/ Services Services To survive,
organizations must constantly improve by:
– Creating new products & services
– Improving existing products and services
– Improving quality
– Reducing cycle time and costs
– Innovation
The volatile economic environment makes it important to constantly improve!
The volatile economic environment makes it important to constantly improve!

11-18-2009Metrics Testing Excellence v1-0 - Pearl Street Group © 2009 5
IT is Constantly Striving to Improve
IT Organizations use Best Practice Process Improvement Frameworks to improve:
– Agile and/or CMMI for Development
– ITIL for Operations
What about Testing?
Agile provides some focus on testing,
but neither CMMI or ITIL focus on Testing!
What about Testing?
Agile provides some focus on testing,
but neither CMMI or ITIL focus on Testing!
=+
CMMI or Agile ITIL

11-18-2009Metrics Testing Excellence v1-0 - Pearl Street Group © 2009 6
What is a “Best Practices” Frameworks?
♦ “Best Practices” in general are statements of common sense
♦ Frameworks overlap in some areas
♦ Some areas are not covered by major frameworks
♦ May use different language to describe the same processes
PMI / CobiT / SOX
CMMI & Agile TestingCMMI
Overlap ITIL
Typical Application Development Life Cycle
DesignPlan Analysis Construct TestInitiate & Prioritize
OperateDeploy
CMMI – Capability Maturity Model IntegratedCoBit – Control Objects for Information Technology ITIL – IT Infrastructure LibraryPMI – Project Management Institute (PMBOK) SOX – Sarbanes-OxleyTesting – CSTE CBOK (not a full Process Framework)

11-18-2009Metrics Testing Excellence v1-0 - Pearl Street Group © 2009 7
Capability Maturity Model Integrated (CMMI)
The CMMI Model uses a five level process maturity rating system similar to a five start hotel rating system to assess
an IT organizations capability to develop software.
The CMMI Model uses a five level process maturity rating system similar to a five start hotel rating system to assess
an IT organizations capability to develop software.
• The CMMI model is a “Best Practice Framework” focused on improving the software development capabilities of an organization.
• Supports• Waterfall• Agile
Excellence in Software Engineering
L2 – Managed
L4 – QuantitativelyManaged
L5Optimizing
L1 – Initial
L3 – Defined

11-18-2009Metrics Testing Excellence v1-0 - Pearl Street Group © 2009 8
CMMI for Development v1.2 Process Areas
Level 3 – Repeatable♦ Requirements Definition♦ Technical Solutions♦ Product Integration♦ Verification♦ Validation♦ Organizational Process Focus♦ Organizational Process Definition + IPPD♦ Organizational Training♦ Integrated Project Management + IPPD♦ Risk Management♦ Decision Analysis & Resolution
Level 4 - Quantitatively Managed♦ Organizational Process Performance♦ Quantitative Project Management
Level 5 - Optimizing♦ Organizational Innovation and
Deployment♦ Causal Analysis & Resolution
Level 1 – Initial♦ Ad Hoc
Level 2 – Managed♦ Requirements Management♦ Project Planning♦ Project Monitoring &
Control♦ Supplier Agreement
Management♦ Measurement & Analysis♦ Process and Product
Quality Assurance♦ Configuration Management
CMMI says little about Testing – focus is on Peer Reviews. CMMI says little about Testing – focus is on Peer Reviews.
11-18-2009Metrics Testing Excellence v1-0 - Pearl Street Group © 2009 9
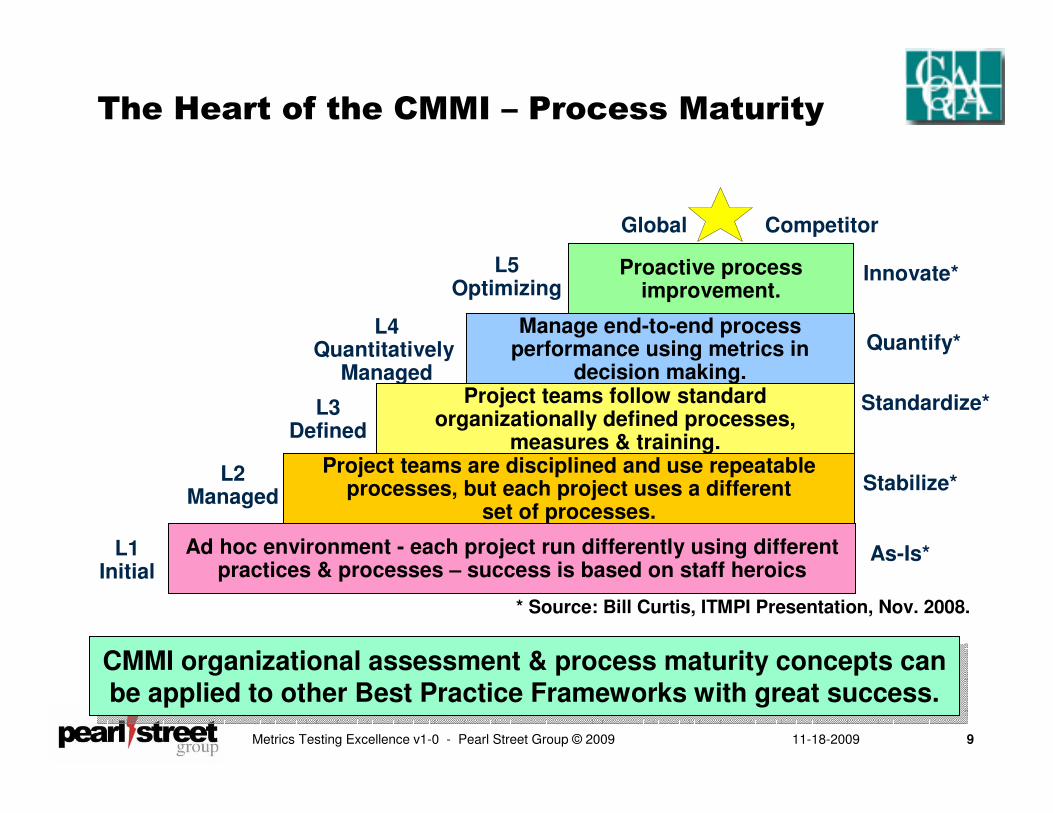
The Heart of the CMMI – Process Maturity
L2Managed
L3Defined
L4Quantitatively
Managed
L5Optimizing
Global Competitor
L1Initial
Ad hoc environment - each project run differently using different practices & processes – success is based on staff heroics
Project teams are disciplined and use repeatable processes, but each project uses a different
set of processes.
Project teams follow standard organizationally defined processes,
measures & training.
Manage end-to-end process performance using metrics in
decision making.
Proactive process improvement.
As-Is*
Stabilize*
Standardize*
Quantify*
Innovate*
* Source: Bill Curtis, ITMPI Presentation, Nov. 2008.
CMMI organizational assessment & process maturity concepts can be applied to other Best Practice Frameworks with great success.
CMMI organizational assessment & process maturity concepts can be applied to other Best Practice Frameworks with great success.
11-18-2009Metrics Testing Excellence v1-0 - Pearl Street Group © 2009 10
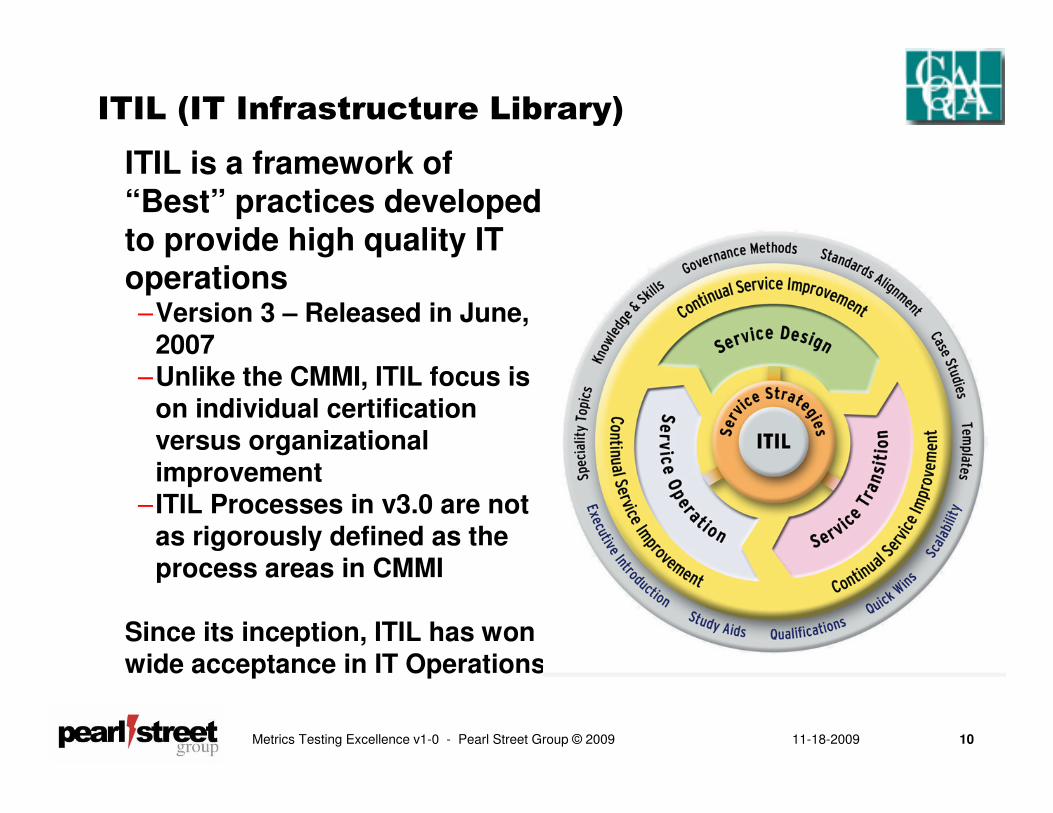
ITIL (IT Infrastructure Library)
ITIL is a framework of “Best” practices developed to provide high quality IT operations–Version 3 – Released in June,
2007–Unlike the CMMI, ITIL focus is
on individual certification versus organizational improvement
– ITIL Processes in v3.0 are not as rigorously defined as the process areas in CMMI
Since its inception, ITIL has won wide acceptance in IT Operations

11-18-2009Metrics Testing Excellence v1-0 - Pearl Street Group © 2009 11
ITIL v3.0 Process Areas
Service Transition♦ Asset and Configuration
Management♦ Release and Deployment
Management♦ Service Validation and Testing
Releases
Service Operation♦ Event Management♦ Incident Management♦ Request Fulfillment♦ Problem Management♦ Access Management♦ IT Operations Management♦ Application Management♦ Service Operation and Project
Management
Continuous Service Improvement
Service Strategy♦ Strategic Assessment♦ Service Portfolios♦ Return on Investment♦ Financial Management♦ Organizational Development
Service Design♦ Service Catalogue
Management♦ Service Level Management♦ Capacity Management♦ Availability Management♦ IT Service Continuity
Management♦ Information Security
Management♦ Supplier Management
ITIL talks about service validation, but says little about how to do this. ITIL talks about service validation, but says little about how to do this.

11-18-2009Metrics Testing Excellence v1-0 - Pearl Street Group © 2009 12
Testing Process Frameworks
♦ TMM – Testing Maturity Model (I. Burnstein – IIT)
– Multi-Level Model, but not well integrated into CMMI Architecture
– Recent new focus by TMMI Foundation
♦ TPI – TMap – Test Process Improvement and Test Management Approach (T. Koomen, M. Pol, Sogeti)
– Robust and well documented
– Multi-Level Model, but not well integrated into CMMI Architecture
♦ TPAM – Test Process Assessment Model (Y. Chernak, Valley Forge Consulting)
– Not well documented, but provides the best integration with the CMMI through Key Practices
1. Test Strategy Planning
2. Test ware Design and Maintenance
3. Test Execution and Reporting
Individual certifications like the CSTE are not full organizational process frameworks. None of these
frameworks has won the acceptance of the CMMI or ITIL.
Individual certifications like the CSTE are not full organizational process frameworks. None of these
frameworks has won the acceptance of the CMMI or ITIL.

11-18-2009Metrics Testing Excellence v1-0 - Pearl Street Group © 2009 13
Suggestion – Tailor your Own
♦ “Best Practice” Process Frameworks
Provide guidelines, but do not provide enough details to develop deployable processes
♦ Commercial Process Models such as RUP or Microsoft Solution Framework need to be tailored
♦ So, develop your own Process Model
– Based on “Best Practices”
– CMMI & Agile for Development
– ITIL for Operations
– TPAM, TMAP – TPI and TMM for testing
♦ Define enough detail so that processes provide useful guidance and can be deployed
Use the “Best Practice” frameworks and “Body’s of Knowledge” as a guide to developing your own detailed, deployable process models.
Use the “Best Practice” frameworks and “Body’s of Knowledge” as a guide to developing your own detailed, deployable process models.
11-18-2009Metrics Testing Excellence v1-0 - Pearl Street Group © 2009 14
♦ Testing Process Improvement
♦ Linking Process Improvement and Measurement
♦ Testing Process and Metrics
♦ Testing Measurement Program Design
♦ Summary
Agenda

11-18-2009Metrics Testing Excellence v1-0 - Pearl Street Group © 2009 15
Processes and Measurement
♦ Processes are organized sequences of activities and practices that transform inputs into outputs
♦ Processes are the foundation for the organization’s work♦ Processes can be improved once they become repeatable♦ Measurement is essential for process improvement
Roles & RACI
Roles & RACI
Tools & Job Aids
Tools & Job Aids
“Best Practice” frameworks require repeatable processes and measurement!“Best Practice” frameworks require repeatable processes and measurement!
ProcessMeasurement & Control
ProcessMeasurement & Control Output Defects & Process
Metrics Feedback Loop
CustomerCustomerInputsInputsSupplierSupplier OutputsOutputsEntryCriteria
EntryCriteria Process StepsProcess Steps
Output Validation & Exit Criteria
Output Validation & Exit Criteria

11-18-2009Metrics Testing Excellence v1-0 - Pearl Street Group © 2009 16
How Process Improvement Works
1. Eliminate White Space Wait Time between processes2. Reduce Process Execution Time for Requirements3. Overlap the Develop Process with Design & Testing Processes4. Reduce defects & rework with better QA Reviews
DeployTestPlan DevelopDesignRequirements MaintainAs-IsProcess
Defect Repair & Rework
White Space Wait
White Space Wait
Deploy
Test
Plan Develop
Design
Reqm’nts MaintainTo-BeProcess
Defect Repair & Rework
Result: Less rework, shorter cycle time, higher productivity, lower costs and a foundation for innovation!
Result: Less rework, shorter cycle time, higher productivity, lower costs and a foundation for innovation!

11-18-2009Metrics Testing Excellence v1-0 - Pearl Street Group © 2009 17
Program & Release Management
Configuration Management
IT Strategy, Architecture & Planning
Administrative & Resource Management
Quality Assurance & Testing Support
Process Management & Measurement
External & Regulatory Auditing & Control
Develop, Operate & Maintain Solutions
Core Processes Cross Organizational Functions
Solution Retirement
CustomerNeeds
Architecture & Planning
Application Development
QA, Process Support &
Measurement
Application Support
Infrastructure
Customer Support &
Operations
Customers / U
sers
IT & Business Functions
Functional organizations need to support the core processes by implementing them in their functional areas.
Functional organizations need to support the core processes by implementing them in their functional areas.

11-18-2009Metrics Testing Excellence v1-0 - Pearl Street Group © 2009 18
Process Decomposition
CustomerIdeas
Solution Retirement
Core Development Process
Develop, Operate & Maintain Solutions - Core Process
Major Processes within Develop, Operate & Maintain SolutionsMajor
ProcessEnvision DesignPlan Requirements Construct Test
Initiate & Prioritize
OperateDeploy
Sub-Processes
Construct - Sub-Processes
DetailDesign
Unit Test
Code &Inspect
QATest
UATTest
UAT Testing - Process
Process & Procedures
Process Flows Output (s) & Exit Criteria
from Process
MeasuresRoles & Responsibilities
FormForm
Procedures------------------------------------------------------
Procedures------------------------------------------------------
Procedures------------------------------------
Input (s) & Entry
CriteriaTo Process
Tools
Supporting processes control changes, manage configurations, provide measures, monitor, manage corrective actions and assure quality.
Track, Monitor & Control
Supporting Processes
This is the level needed for
deployment!

11-18-2009Metrics Testing Excellence v1-0 - Pearl Street Group © 2009 19
What Get’s Measured, Get’s Done!
Decisions
ActionsFeedback
What Doesn’t Get Measured, Doesn’t Get Done!What Doesn’t Get Measured, Doesn’t Get Done!
We measure:
♦ To Communicate– With Management
– With Peers
– With Subordinates
♦ To Manage– Make Decisions
– Estimate• How much we will need
• What will it cost
♦ To Improve Performance– Quality
– Cycle Time
– Productivity
– Risk
Results
Facts
Metrics
A measure or …”metric is the number you attach to
an idea.”Tom DeMarco
Opinions

11-18-2009Metrics Testing Excellence v1-0 - Pearl Street Group © 2009 20
Measurement is Hard to Do
♦ Difficult to design good measures
♦ Inadequate measurement infrastructure
♦ Lack of adequate measurement expertise
– Good measurement takes time and expertise
♦ Staff often does not want to be measured and has a a Love – Hate Relationship with Measurement
– Love it for other folks – i.e.. Sports Statistics
– Love it when are doing well – Low golf handicap
– Hate it when we are not doing well – Forget golf handicap
The root cause of these issues is often due to inadequate measurement resources, knowledge and expertise in the organization!
The root cause of these issues is often due to inadequate measurement resources, knowledge and expertise in the organization!

11-18-2009Metrics Testing Excellence v1-0 - Pearl Street Group © 2009 21
♦ Testing Process Improvement
♦ Linking Process Improvement and Measurement
♦ Testing Process and Metrics
♦ Testing Measurement Program Design
♦ Summary
Agenda

11-18-2009Metrics Testing Excellence v1-0 - Pearl Street Group © 2009 22
0
50
100
150
200
250
300
350
400
450
500
Defects are Expensive
DesignDeploy & OperateAnalysis Develop
Integration & System
TestPlanning UATUnit Test
Rework costs rise dramatically when defects are found late in the SDLC! Rework cost depend on where defect was Inserted and where it was found.

11-18-2009Metrics Testing Excellence v1-0 - Pearl Street Group © 2009 23
Testing Terms
Mistake (Bug)
A error or flaw in requirements, design, or coding that can cause an information system from behaving as intended. Mistakes occur before the application has been inspection, tested and gone into production. People are human and make mistakes . Thus some small number of mistakes are inevitable. Testing is a key way of preventing mistakes from becoming defects.
Defect
A error or flaw in requirements, design or coding that causes an information system from behaving as intended after it has been tested and is gone in production. Defects result when a mistake is allowed to reach a customer and can be prevented by through inspection and testing.
Our job as testers is to prevent Mistakes from becoming Defects!

11-18-2009Metrics Testing Excellence v1-0 - Pearl Street Group © 2009 24
Software Development Life Cycles
♦ Software development follows an set of steps with feedback from each step to one of the prior steps if defects, inconsistencies, or missed requirements are found
♦ In practice, there are two main variations of these general steps:
– Waterfall
– Agile
Design
(Test first
Design?)
Deploy &Operate
Analysis
(Requirements or Stories)
DevelopIntegration & System
TestPlanning UAT
Unit Test
(Test first design?)
Similar steps occur for a Waterfall project or within an Agile Iteration
Design
(Test first
Design?)
Deploy &Operate
Analysis
(Requirements or Stories)
DevelopIntegration & System
TestPlanning UAT
Unit Test
(Test first design?)
Design
(Test first
Design?)
Deploy &Operate
Analysis
(Requirements or Stories)
DevelopIntegration & System
TestPlanning UAT
Unit Test
(Test first design?)
Design
(Test first
Design?)
Deploy &Operate
Analysis
(Requirements or Stories)
DevelopIntegration & System
TestPlanning UAT
Unit Test
(Test first design?)
Design
(Test first
Design?)
Deploy &Operate
Analysis
(Requirements or Stories)
DevelopIntegration & System
TestPlanning UAT
Unit Test
(Test first design?)
Design
(Test first
Design?)
Deploy &Operate
Analysis
(Requirements or Stories)
DevelopIntegration & System
TestPlanning UAT
Unit Test
(Test first design?)
Design
(Test first
Design?)
Deploy &Operate
Analysis
(Requirements or Stories)
DevelopIntegration & System
TestPlanning UAT
Unit Test
(Test first design?)
Design
(Test first
Design?)
Deploy &Operate
Analysis
(Requirements or Stories)
DevelopIntegration & System
TestPlanning UAT
Unit Test
(Test first design?)
Design
(Test first
Design?)
Deploy &Operate
Analysis
(Requirements or Stories)
DevelopIntegration & System
TestPlanning UAT
Unit Test
(Test first design?)
Arch Iteration Iteration 2 Iteration 3 Iteration N
. . .

11-18-2009Metrics Testing Excellence v1-0 - Pearl Street Group © 2009 25
Structured Testing
♦ Structured testing is a process for organizing the testing activities in a fashion that can lead to continuous improvement
♦ Structured testing mirrors the Software Development Life Cycle and is made up: – Test Planning
– Test Preparation – Test Case Development / Specification
– Test Execution
– Test Completion
♦ Structured testing covers all testing activities– Unit
– Integration & System (QA)
– Performance and stress
– User Acceptance Testing

11-18-2009Metrics Testing Excellence v1-0 - Pearl Street Group © 2009 26
V-Model of Testing with key Test Documents
Project Request
Business Analysis
Sys Analysis / Functional
Design
Construction Unit Test-IT
IntegrationTest-IT/BU*
User Acceptance
Test-BU
ImplementProject-IT/BU
DesignSystem Test-IT
Code & Unit Test Plans
Design Doc &System
Test Plans
Requirements, System & Stress
Test Plans
Test Strategy & User Acceptance
Test Plans
*IT=IT Department BU-Business Units
Planning Test Preparation Test Execution Close

11-18-2009Metrics Testing Excellence v1-0 - Pearl Street Group © 2009 27
Test Planning – Rule of Thumb ~ 20%
♦ Test Planning begins by understanding project goals
♦ Review all available documents and participate in as many planning and requirements meetings as possible
♦ Typically 20% to 30% of key information is not documented and is coved in people to people interactions
♦ Develop Test Strategy and begin Test Plan
– Determine Test Objectives
– Identify the areas / functions to be tested
– Identify needed resources
– Develop a strategy for testing:
• The functions
• The information system as a whole
– Determine who will test what
♦ During this phase an early estimate of the testing effort and resources required to complete testing per the Test Strategy should be developed
11-18-2009Metrics Testing Excellence v1-0 - Pearl Street Group © 2009 28
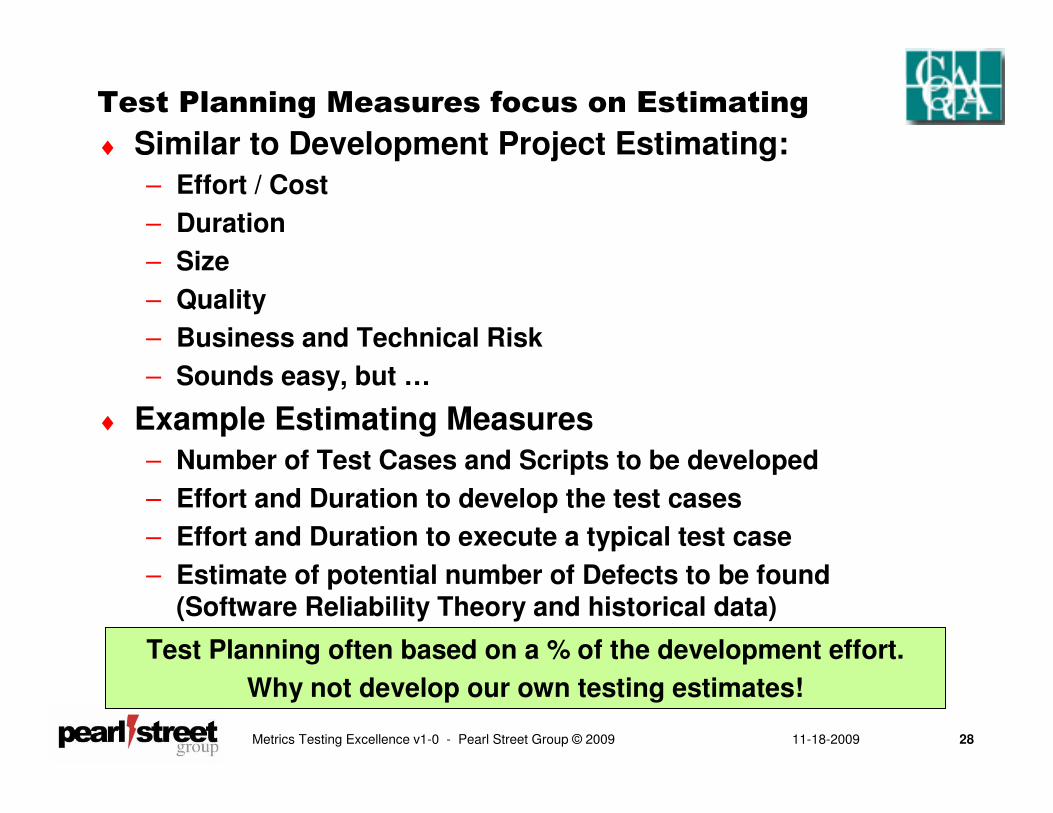
Test Planning Measures focus on Estimating
♦ Similar to Development Project Estimating:
– Effort / Cost
– Duration
– Size
– Quality
– Business and Technical Risk
– Sounds easy, but …
♦ Example Estimating Measures
– Number of Test Cases and Scripts to be developed
– Effort and Duration to develop the test cases
– Effort and Duration to execute a typical test case
– Estimate of potential number of Defects to be found (Software Reliability Theory and historical data)
Test Planning often based on a % of the development effort.
Why not develop our own testing estimates!

11-18-2009Metrics Testing Excellence v1-0 - Pearl Street Group © 2009 29
Testing Estimating – Similar to Development
♦ Estimation Techniques:– Expert Judgment
– Historical Data – Past Projects
– Empirical and Theoretical Models (Formulas)• Number of Requirements or Story Points
• Function Point
• Test Points
– Size vs. Effort based Estimation• Often need to do both
• Size is better for process improvement
♦ Estimation Rules of Thumb:– Have people responsible for the work estimate the work
– Obtain multiple estimates when possible for critical techniques
– A good estimating technique is to develop Optimistic, Most Likely and Pessimistic estimates
– Never force an estimate on project team
11-18-2009Metrics Testing Excellence v1-0 - Pearl Street Group © 2009 30
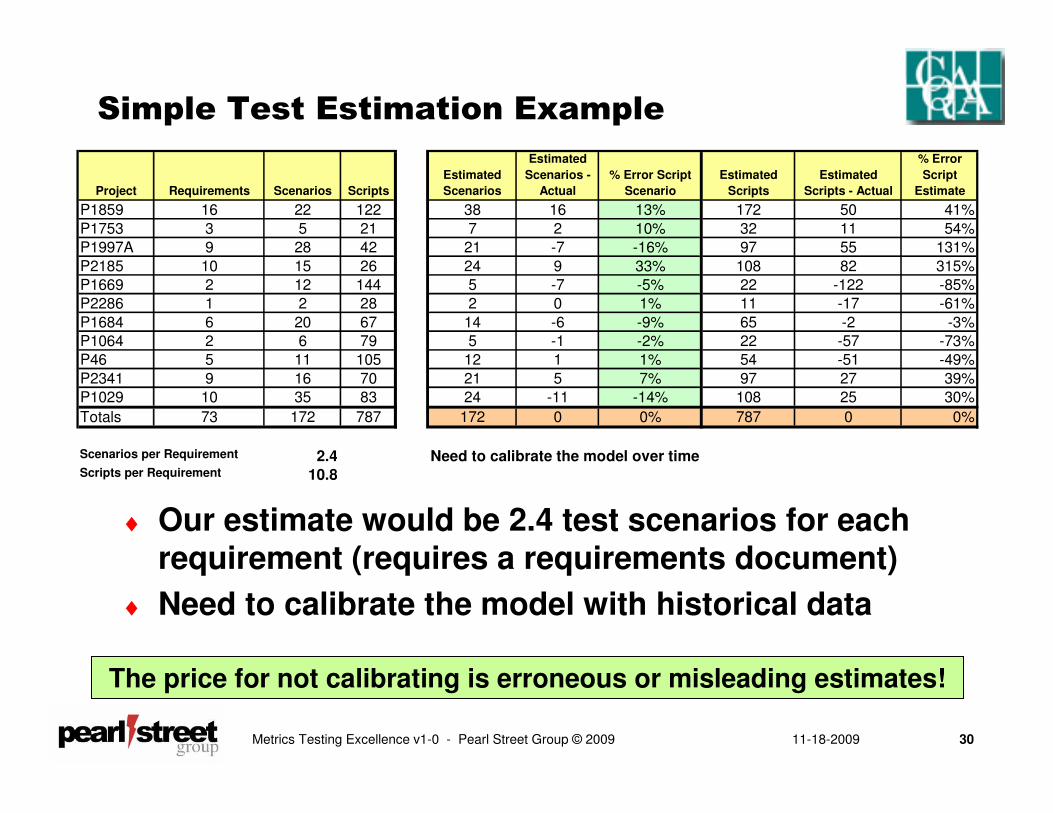
Simple Test Estimation Example
♦ Our estimate would be 2.4 test scenarios for each requirement (requires a requirements document)
♦ Need to calibrate the model with historical data
Project Requirements Scenarios Scripts
Estimated
Scenarios
Estimated
Scenarios -
Actual
% Error Script
Scenario
Estimated
Scripts
Estimated
Scripts - Actual
% Error
Script
Estimate
P1859 16 22 122 38 16 13% 172 50 41%
P1753 3 5 21 7 2 10% 32 11 54%
P1997A 9 28 42 21 -7 -16% 97 55 131%
P2185 10 15 26 24 9 33% 108 82 315%
P1669 2 12 144 5 -7 -5% 22 -122 -85%
P2286 1 2 28 2 0 1% 11 -17 -61%
P1684 6 20 67 14 -6 -9% 65 -2 -3%
P1064 2 6 79 5 -1 -2% 22 -57 -73%
P46 5 11 105 12 1 1% 54 -51 -49%
P2341 9 16 70 21 5 7% 97 27 39%
P1029 10 35 83 24 -11 -14% 108 25 30%
Totals 73 172 787 172 0 0% 787 0 0%
Scenarios per Requirement 2.4 Need to calibrate the model over timeScripts per Requirement 10.8
The price for not calibrating is erroneous or misleading estimates!
11-18-2009Metrics Testing Excellence v1-0 - Pearl Street Group © 2009 31
Test Preparation – Rule of Thumb ~ 40%
♦ During this phase the test case and related documents are developed and documented:
– Use Cases
– Test Scenarios, Test Cases and Test Scripts
– Test Data and Test Data Bases
– A special test environment may be required
♦ The Test Team participates in key meetings and review key documents to understand the business requirements and information system in general
♦ When completed, all key Test Documents should be validated ideally with an Inspection by key stakeholders

11-18-2009Metrics Testing Excellence v1-0 - Pearl Street Group © 2009 32
Test Preparation Measures focus on Progress
♦ Basic Project Management Monitoring and Control
♦ Focus on test plan and test case development
♦ Must align with the development schedule
♦ Example Measures:
– Status of the Test Plan
– Number of Test Cases developed
– Test Case Churn (related to Requirements Churn)
– Test Estimating Accuracy
– Application Complexity
– Test Coverage - Static
– Use of Risk Based Testing
– Defect Containment
– Estimated of Number of Defects

11-18-2009Metrics Testing Excellence v1-0 - Pearl Street Group © 2009 33
Use Estimates and Actuals to Measure Progress
Test Progress
0
5
10
15
20
25
30
35
40
1 2 3 4 5 6 7 8 9 10 11 12
Hours of Testing
Cum
ula
tive T
ests
Cm
pl
Estimated Scenarios Cmpl
Actual Scenarios Cmpl
Hours of
Testing
Planed Scenarios
Completed
Actual Scenarios
Completed
Actual
Scenarios
Completed per
Hour
1 3 1 1
2 6 3 2
3 9 4 1
4 12 6 2
5 15 9 3
6 18 11 2
7 21 14 3
8 24 17 3
9 27 21 4
10 30 26 5
11 33 31 512 36 35 4
Estimate 3 scenarios per hour

11-18-2009Metrics Testing Excellence v1-0 - Pearl Street Group © 2009 34
Risk Based Testing Analysis
Risk = Likelihood * Impact
Hig
h
Lik
elih
oo
d
Potential
Partial Testing
Thorough
Testing
Lo
w
Lik
elih
oo
d
Potential
Minimal Testing
Potential
Partial Testing
Low Impact High Impact
Even though the likelihood of a risk event is small, risk events can and often do happen.

11-18-2009Metrics Testing Excellence v1-0 - Pearl Street Group © 2009 35
Test Execution – Rule of Thumb ~ 40%
♦ Execute the Test Scenarios and Test Scripts and compare actual results to expected results
♦ Track Test Progress, Defects, monitor fixes and retest
♦ Check results of earlier testing to ensure that it was completed per the Test Plan – if not, log a Process Deviation
♦ Constantly check the test results to see if any aspects of the testing were overlooked or came to light based on the test execution
♦ Revise the Test Scenarios, Test Cases and Test Scripts as needed and as defects are identified
Approximately 15% of defects found in test are in the test cases or test data.

11-18-2009Metrics Testing Excellence v1-0 - Pearl Street Group © 2009 36
Test Execution Measures focus Test
Execution and Defect Tracking
♦ As tests are executed, defects are found, repaired and retested
♦ Example Measures:– Test Cases Executed vs. Planned– Test Case Success Rate– Defect Run Rate
• New Defects Discovered• Defects Closed• Defects Open
– Defect Classification (Including bad fixes)• Category• Priority
– Time to Fix a Defect– Test Coverage – Dynamic (Bill Curtis, CAST – Sept. 2009)– Application Complexity– Risk Based Testing Results
Key testing challenge during test execution is lack of time!

11-18-2009Metrics Testing Excellence v1-0 - Pearl Street Group © 2009 37
Example Test Cases Executed
100% 100% 100%
Date: 07/08/05 07/15/05 07/22/05 07/29/05 08/05/05 08/12/05 08/19/05 08/26/05
Total: 7672 7672 7672 7672 7672 7672 7672 7672
Planned: 575 1644 2668 3805 4973 6234 7584 7672
Planned % 7% 21% 34% 49% 64% 81% 98% 100%
Executed % 10% 29% 49% 62% 69% 76% 88%
Success Rate % 99.2% 99.0% 99.3% 99.3% 99.3% 99.4% 99.3%
0%
10%
20%
30%
40%
50%
60%
70%
80%
90%
100%
7/8/2005 7/15/2005 7/22/2005 7/29/2005 8/5/2005 8/12/2005 8/19/2005 8/26/2005
Planned % Executed % Success Rate %
11-18-2009Metrics Testing Excellence v1-0 - Pearl Street Group © 2009 38
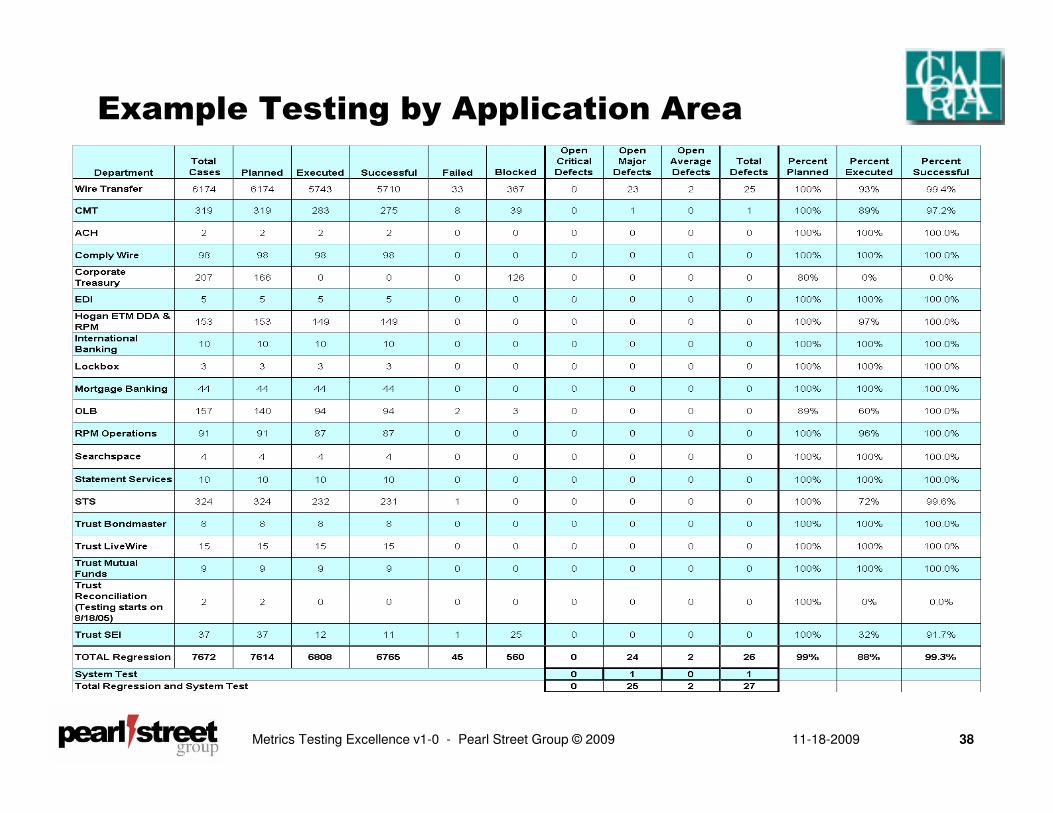
Example Testing by Application Area

11-18-2009Metrics Testing Excellence v1-0 - Pearl Street Group © 2009 39
Example Weekly Defect Run Rate
Defect Rate
Week Ending 7/8 7/15 7/22 7/29 8/5 8/12 8/19 8/26
New 6 14 11 12 5 5 17
Closed 0 10 13 3 9 5 22
Total Open 27 31 29 38 34 34 29
Forecasted Total 30 35 40 42 40 35 27 19
NSP Regression and residual System Test Defects Run Rate
0
5
10
15
20
25
30
35
40
45
7/8 7/15 7/22 7/29 8/5 8/12 8/19 8/26
No
of
Defe
cts
New Closed Total Open Forecasted Total

11-18-2009Metrics Testing Excellence v1-0 - Pearl Street Group © 2009 40
Example Daily Defects - Regression & System Test
( 8-day moving window )
8/11 8/12 8/15 8/16 8/17 8/18 8/19 8/22
Total Open 33 34 26 25 25 22 29 27
COPE/STAR 26 26 16 18 16 16 19 18
CIR 2 2 2 2 2 2 2 2
STS 1 1 1 1 1 0 0 0
USB Internal 2 4 3 3 1 0 2 5
Submitted 2 1 4 1 5 4 6 2
Total In Re-test 11 18 8 6 6 4 7 6
8/11 8/12 8/15 8/16 8/17 8/18 8/19 8/22
Total Open 33 34 26 25 25 22 29 27
Regression 27 28 24 23 23 21 28 26
System Test 6 6 2 2 2 1 1 1
8/11 8/12 8/15 8/16 8/17 8/18 8/19 8/22
Critical 3 3 3 4 1 1 1 0 0%
Major 26 27 21 19 22 20 27 25 93%
Average 4 4 2 2 2 1 1 2 7%
Total OPEN 33 34 26 25 25 22 29 27
8/11 8/12 8/15 8/16 8/17 8/18 8/19 8/22 Total
New 2 1 4 0 4 2 7 1 21
Closed 3 0 12 1 4 5 0 3 28
* Two defects moved to A.04a on 8/1
Defects - A.04
Validation
Defects by Severity Daily Results - Regression and System
Defects by
Development TeamDaily Results - Regression and System
Daily Results - Regression and System
Defects by
Environment
Daily Results - Regression and System
New, Closed and Total Open Defects
0
10
20
30
40
8/11 8/12 8/15 8/16 8/17 8/18 8/19 8/22
Total Open New Closed
0%
93%
7%
Critical Major Average
Defects by Environment
0
10
20
30
8/11 8/12 8/15 8/16 8/17 8/18 8/19 8/22
Regression System Test
Defects by Severity
0
10
20
30
8/11 8/12 8/15 8/16 8/17 8/18 8/19 8/22
Critical Major Average
11-18-2009Metrics Testing Excellence v1-0 - Pearl Street Group © 2009 41
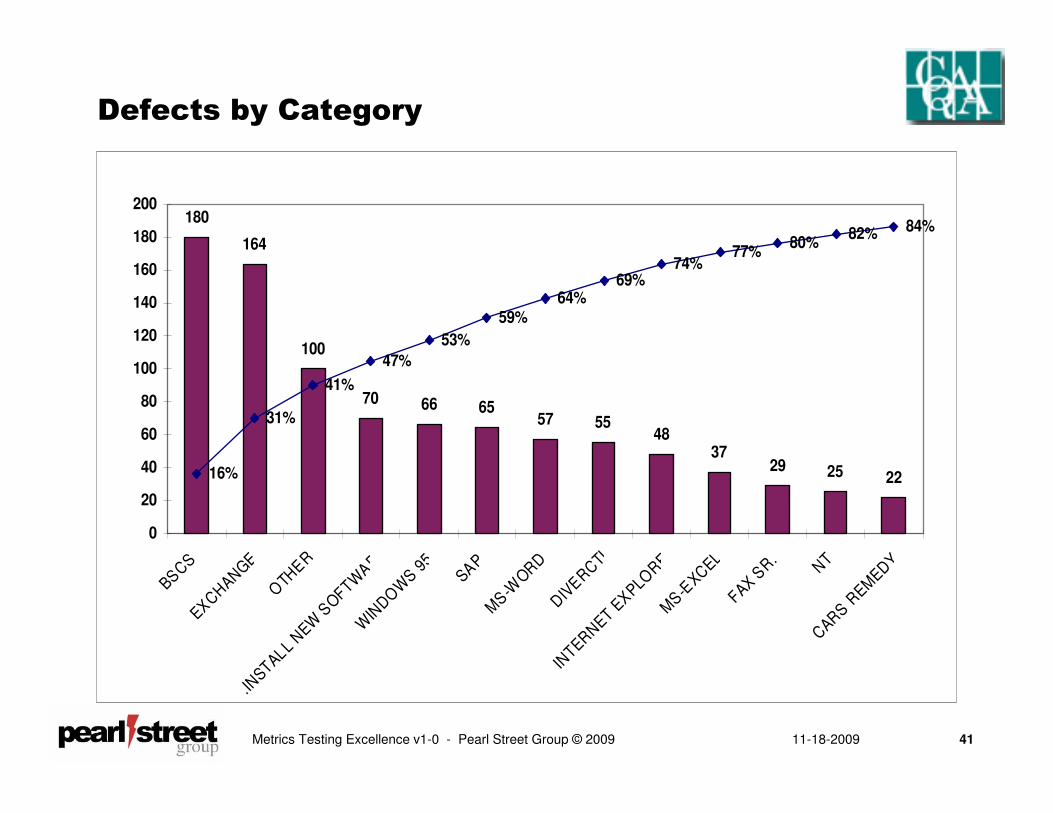
Defects by Category
180
164
100
70 66 6557 55
4837
29 25 2216%
31%
41%
47%
53%
59%64%
69%74%
77%80%
82% 84%
0
20
40
60
80
100
120
140
160
180
200
BSCSEXCHANGE
OTH
ER
.INSTALL
NEW S
OFTWAR
WIN
DOW
S 95
SAPM
S-WORD
DIVERCTI
INTERNET E
XPLORER
MS-E
XCELFAX S
R.
NTCARS R
EMEDY

11-18-2009Metrics Testing Excellence v1-0 - Pearl Street Group © 2009 42
Defects by Priority
1327
1060
288
131
22 11
46.7%
84.1%
94.2%98.8% 99.6% 100.0%
-
300
600
900
1,200
1,500
1,800
Med Low High Urgent Critical Customer
Defined
0.0%
10.0%
20.0%
30.0%
40.0%
50.0%
60.0%
70.0%
80.0%
90.0%
100.0%

11-18-2009Metrics Testing Excellence v1-0 - Pearl Street Group © 2009 43
♦ Testing Process Improvement
♦ Linking Process Improvement and Measurement
♦ Testing Process and Metrics
♦ Testing Measurement Program Design
♦ Summary
Agenda
11-18-2009Metrics Testing Excellence v1-0 - Pearl Street Group © 2009 44
Quick View
Quick View
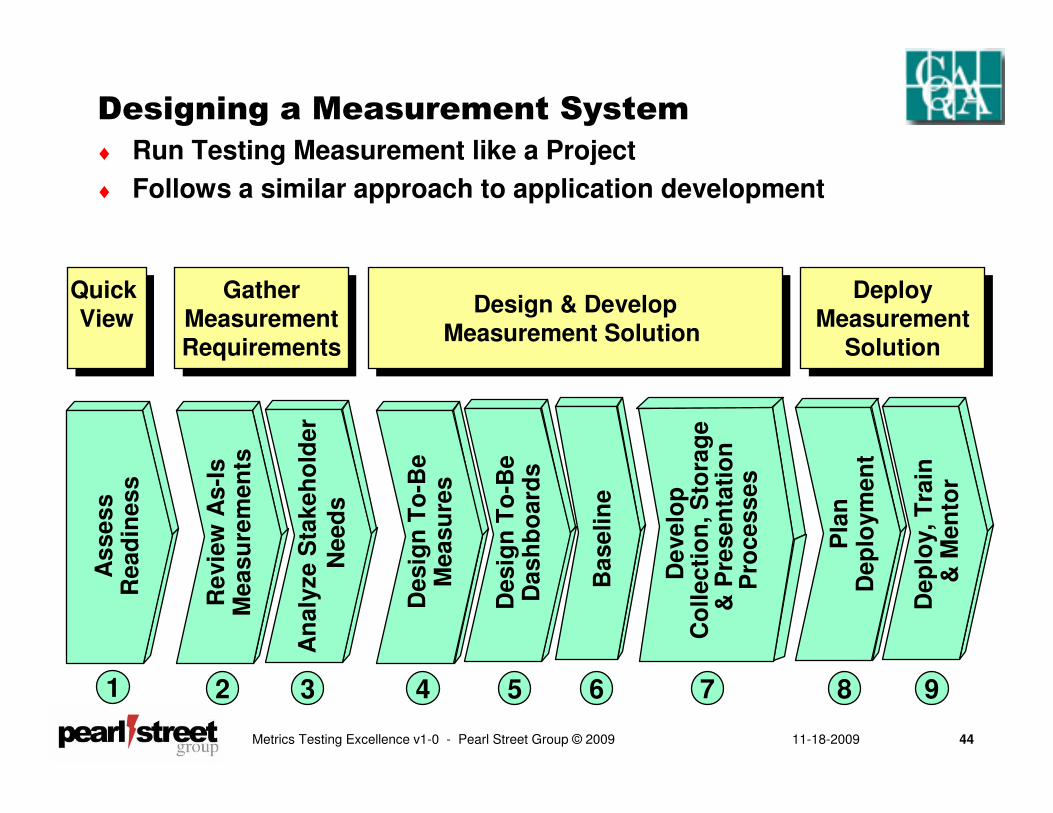
Designing a Measurement System
♦ Run Testing Measurement like a Project
♦ Follows a similar approach to application development
As
se
ss
Read
iness
Desig
n T
o-B
eD
ash
bo
ard
s
Baseli
ne
Dep
loy,
Tra
in
& M
en
tor
GatherMeasurementRequirements
GatherMeasurementRequirements
Design & DevelopMeasurement Solution
Design & DevelopMeasurement Solution
Deploy Measurement
Solution
Deploy Measurement
Solution
4 5 621 3 7 9
An
aly
ze S
take
ho
lder
Need
s
Desig
n T
o-B
eM
easu
res
De
velo
p
Co
llecti
on
, S
tora
ge
& P
resen
tati
on
Pro
cess
es
Pla
nD
ep
loym
en
t
8
Re
vie
w A
s-I
sM
easu
rem
en
ts

11-18-2009Metrics Testing Excellence v1-0 - Pearl Street Group © 2009 45
Assess whether Organization is Ready for Measurement and Process ImprovementA Readiness Survey can be used to gather of information about the organization’s readiness.
1
0
1
2
3
4
5Sponsorship
Investment
Skills
Process
Orientation
Infrastructure
Design
Value
Culture

11-18-2009Metrics Testing Excellence v1-0 - Pearl Street Group © 2009 46
Review As-Is Measures
Identify measures that are being collected today
♦ How are they being collected
♦ How are they defined
♦ How are they reported
♦ How are they organized into Dashboards, Reports, etc
♦ Who is receiving measures
♦ What do they use them for
♦ Ask about past efforts at introducing measurement
♦ Look at measures from other groups within organization
2
11-18-2009Metrics Testing Excellence v1-0 - Pearl Street Group © 2009 47
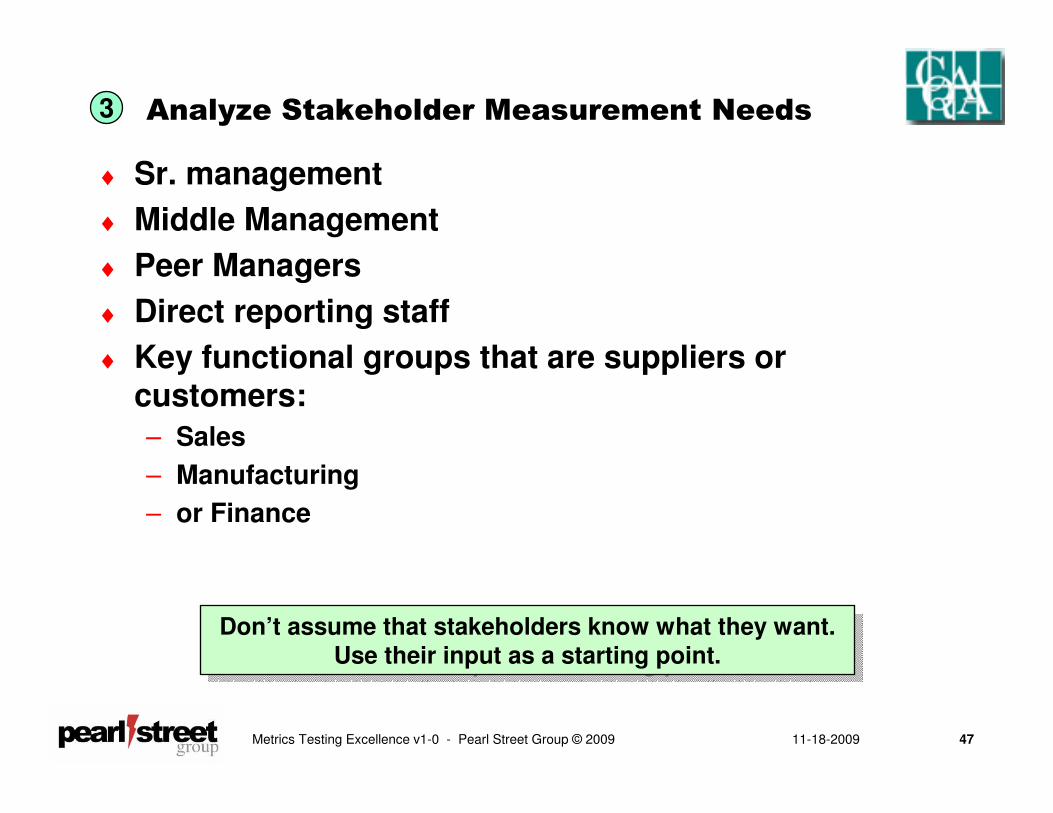
Analyze Stakeholder Measurement Needs
♦ Sr. management
♦ Middle Management
♦ Peer Managers
♦ Direct reporting staff
♦ Key functional groups that are suppliers or customers:
– Sales
– Manufacturing
– or Finance
3
Don’t assume that stakeholders know what they want.Use their input as a starting point.
Don’t assume that stakeholders know what they want.Use their input as a starting point.

11-18-2009Metrics Testing Excellence v1-0 - Pearl Street Group © 2009 48
Design the To-Be Measures
♦ Start with As-Is measures & stakeholder needs
♦ Use Reference measures:
– Benchmark Studies
– Other business groups, agencies, user group, societies and consulting companies
– Books on measurement such as: Practical Software Measurement
♦ Use proven techniques to develop measures:
– Balanced Score Card
– Goal->Question->Metric
We covered a number of testing measures earlier.Although some measures are better than others, there is no
single “right” answer – Just Do It! And continuously improve!
We covered a number of testing measures earlier.Although some measures are better than others, there is no
single “right” answer – Just Do It! And continuously improve!
4

11-18-2009Metrics Testing Excellence v1-0 - Pearl Street Group © 2009 49
Document Measures in a Measurement Catalog
Think of a Metric as a Gauge
TargetLevel
Current Level
LowCriticalLevel
Name
MeasuringDevice
Think of a Metric as a Gauge
TargetLevel
Current Level
LowCriticalLevel
Name
MeasuringDevice
TargetLevel
Current Level
LowCriticalLevel
Name
MeasuringDevice
4
Who should see & use measureAudience
Simple definition of what a High, Low or Tend may mean.
Meaning
Current level of measureCurrent Level
Unit of MeasureScale
Comments, references, examples, etc.Comments
Target improvement level & time frameTarget Goal
Anything worse (High, Low or Both) indicates failure
Critical Level
Mechanism used to collect dataMeasuring Device
Frequency of data collection and reportingFrequency
Graph of MeasureGraph
Measurement NameName
DefinitionTerm
100% 100% 100%
0%
10%
20%
30%
40%
50%
60%
70%
80%
90%
100%
7/8/2005 7/15/2005 7/22/2005 7/29/2005 8/5/2005 8/12/2005 8/19/2005 8/26/2005
Planned % Executed % Success Rate %

11-18-2009Metrics Testing Excellence v1-0 - Pearl Street Group © 2009 50
Set SMART Measurement Goals
♦ Specific – valid measures for the thing that is being measured
♦ Measurable – measurement data must be collected:
– Accurately
– Precisely
– In a way that is repeatable
– In a way that can be reproduced
♦ Actionable –metrics must be easy-to-understand and easy to use when making decisions
♦ Relevant – measure things that are important
♦ Timely – provide data when it is needed
4

11-18-2009Metrics Testing Excellence v1-0 - Pearl Street Group © 2009 51
Design Dashboards & Score Cards
♦ Organize metrics into graphical views of related measures to
enable stakeholders to see interdependencies
♦ Different views may be required for different stakeholders
– Directors of Development
– Test Managers
– Project Managers
♦ The same measure may occur
on multiple dashboards
Test Management Dashboard
ProjectCost
% Test Completed
# of Defects
5
Score Cards tend to be linked to organizational goals. Dashboards tend to be focused on operational controls. In general the terms can be used interchangeably
Score Cards tend to be linked to organizational goals. Dashboards tend to be focused on operational controls. In general the terms can be used interchangeably
% TestCompleted
Project Management Dashboard
ProjectCost
Work Completed
% Test Completed
Director Management Dashboard
ProjectCost
Work Completed
# of Defects
% Test Completed
11-18-2009Metrics Testing Excellence v1-0 - Pearl Street Group © 2009 52
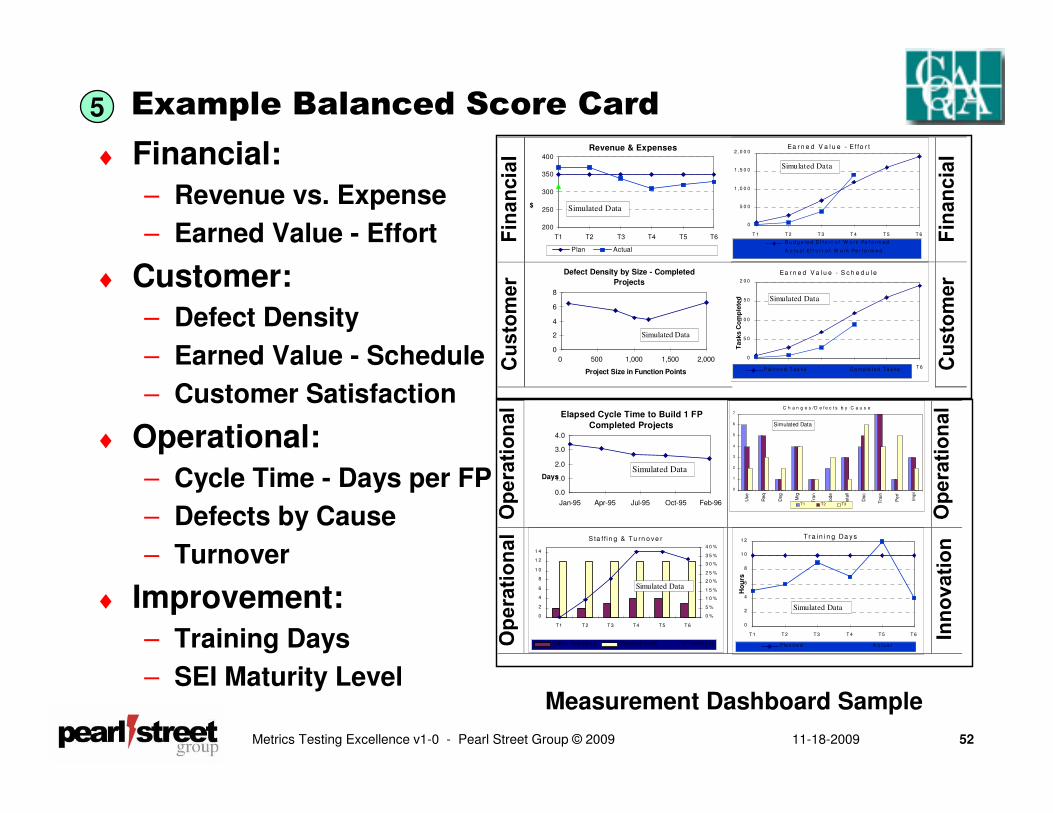
Example Balanced Score Card
♦ Financial:
– Revenue vs. Expense
– Earned Value - Effort
♦ Customer:
– Defect Density
– Earned Value - Schedule
– Customer Satisfaction
♦ Operational:
– Cycle Time - Days per FP
– Defects by Cause
– Turnover
♦ Improvement:
– Training Days
– SEI Maturity LevelMeasurement Dashboard Sample
Revenue & Expenses
200
250
300
350
400
T1 T2 T3 T4 T5 T6
$
Plan Actual
Simulated Data
Defect Density by Size - Completed
Projects
0
2
4
6
8
0 500 1,000 1,500 2,000
Project Size in Function Points
Simulated Data
Ea r n e d V a l u e - E f fo r t
0
5 0 0
1 ,0 0 0
1 ,5 0 0
2 ,0 0 0
T 1 T 2 T 3 T 4 T 5 T 6
B u d g e te d E f f o r t o f W o r k Pe f o r m e d
A c tu a l E f f o r t o f W o r k Pe r f o r m e d
Simulated Data
Ea r n e d V a l u e - S c h e d u l e
0
5 0
1 0 0
1 5 0
2 0 0
T 1 T 2 T 3 T 4 T 5 T 6
Tasks C
om
ple
ted
Pla n n e d T a s ks C o m p le te d T a s ks
Simulated Data
Elapsed Cycle Time to Build 1 FP
Completed Projects
0.0
1.0
2.0
3.0
4.0
Jan-95 Apr-95 Jul-95 Oct-95 Feb-96
DaysSimulated Data
C h a n g e s /D e f e c t s b y C a u s e
0
1
2
3
4
5
6
7
Use
Req
Dsg
Mig
Tra
n
Code
Insta
ll
Doc
Tra
in
Perf
Impl
T1 T2 T3
Simulated Data
S ta f f in g & Tu rn o ve r
0
2
4
6
8
1 0
1 2
1 4
T1 T 2 T 3 T4 T 5 T 6
0 %
5 %
1 0 %
1 5 %
2 0 %
2 5 %
3 0 %
3 5 %
4 0 %
O p e n Po s it io n s Pla n n e d S ta f f % T u r n o v e r
Simulated Data
Tr a in i n g Da ys
0
2
4
6
8
1 0
1 2
T 1 T 2 T 3 T 4 T 5 T 6
Ho
urs
Pla n n e d A c t u a l
Simulated Data
5
11-18-2009Metrics Testing Excellence v1-0 - Pearl Street Group © 2009 53
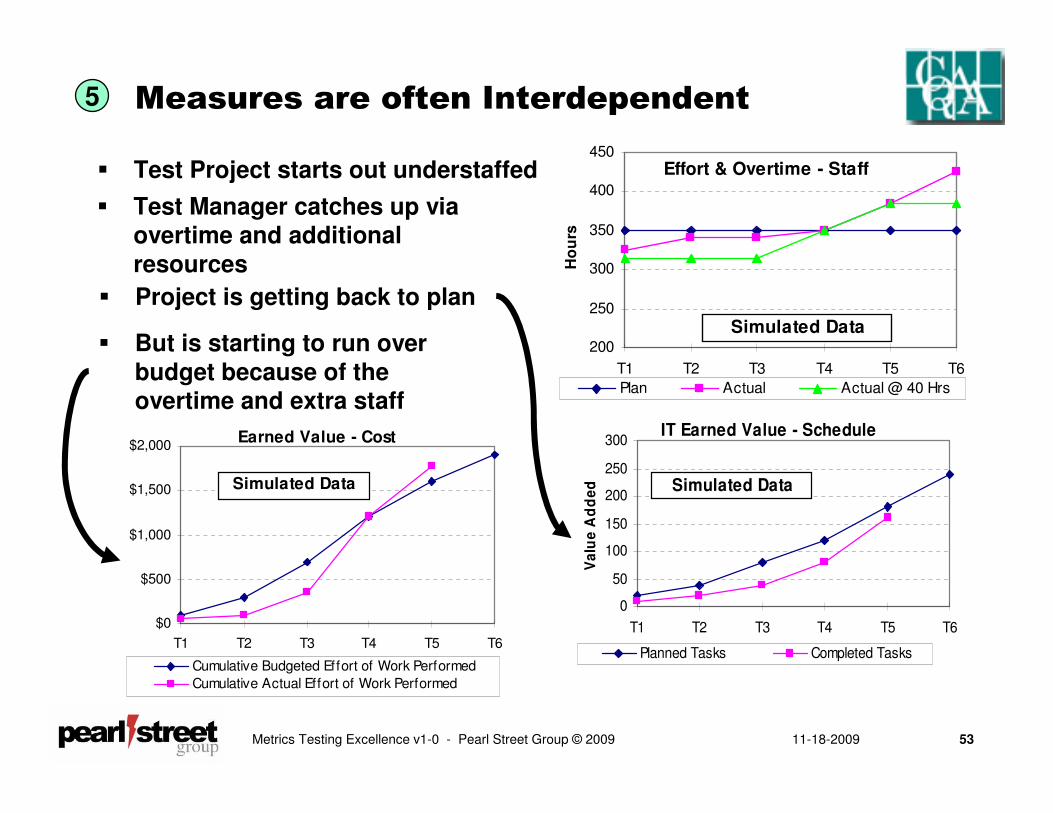
Measures are often Interdependent
� Test Project starts out understaffed Effort & Overtime - Staff
200
250
300
350
400
450
T1 T2 T3 T4 T5 T6
Ho
urs
Plan Actual Actual @ 40 Hrs
Simulated Data
Earned Value - Cost
$0
$500
$1,000
$1,500
$2,000
T1 T2 T3 T4 T5 T6
Cumulative Budgeted Effort of Work Performed
Cumulative Actual Effort of Work Performed
Simulated Data
IT Earned Value - Schedule
0
50
100
150
200
250
300
T1 T2 T3 T4 T5 T6
Va
lue
Ad
de
d
Planned Tasks Completed Tasks
Simulated Data
� Test Manager catches up via overtime and additional resources
� Project is getting back to plan
� But is starting to run over budget because of the overtime and extra staff
5

11-18-2009Metrics Testing Excellence v1-0 - Pearl Street Group © 2009 54
Baseline – Required for Process Improvement
♦ Differences between Baselines show progress
♦ Perform a Measurement Baselines before a process improvement
♦ Perform additional Measurement Baselines during and after process improvement
♦ Use historical data coupled with new measurement collection processes to gather baseline data
6
A Measurement Baseline involves measuring the values for measures at a specific point in time.

11-18-2009Metrics Testing Excellence v1-0 - Pearl Street Group © 2009 55
Develop a Solid Measurement Infrastructure
Analysis &Decision Making
Processes
MeasurementStorage Process
MeasurementCollectionProcesses
DashboardProduction Process
And Reporting
Get Value!
Make
Decisions
Analysis &Decision Making
Processes
MeasurementStorage Process
MeasurementCollectionProcesses
DashboardProduction Process
And Reporting
Get Value!
Make
Decisions
Make
Decisions
Original
Process
Improved
Process
Design
Measurement
Process
Goals
The Measurement Infrastructure includes all components necessary to consistently collect, store, analyze and present
metrics to stakeholders on a regular basis.
7

11-18-2009Metrics Testing Excellence v1-0 - Pearl Street Group © 2009 56
Plan Measurement Deployment
♦ Which measures to develop?
♦ How they will be collected, stored and analyzed?
♦ What Dashboards & Score Cards are needed?
♦ Who will develop the operational reports, Dashboards & Score Cards?
♦ How will the Dashboards and Score Cards be distributed?
♦ Who needs to be Educated?
– Which stakeholders?
– What to educate them on?
– Do not assume that stakeholders will know what to do with the measures once they get them
8
In order to use measures to manage their business, Stakeholders must be mentored over time in the use of the measures

11-18-2009Metrics Testing Excellence v1-0 - Pearl Street Group © 2009 57
Deploy, Educate, Mentor & Refine
♦ Deploy - Collect, store and produce dashboards on a periodic basis (set realistic targets)
♦ Educate stakeholders on the measures
♦ Provide a help desk to answer metrics questions
♦ Mentor stakeholders in the use of measures to solve problems
♦ Continuously improve
9
Use Them or Lose Them!
Use measurement to answer questions and to solve problems or the measurement program will be cancelled!
11-18-2009Metrics Testing Excellence v1-0 - Pearl Street Group © 2009 58
♦ Testing Process Improvement
♦ Linking Process Improvement and Measurement
♦ Testing Process and Metrics
♦ Testing Measurement Program Design
♦ Summary
Agenda

11-18-2009Metrics Testing Excellence v1-0 - Pearl Street Group © 2009 59
Summary – Metrics for Testing Excellence!
♦ Measurement goals must support organization processes & goals
♦ The organization must be ready for measurement
♦ Select the right things to measure
– Use the Balanced Score Cards to link measures to your goals
– Use Goal->Question->Metric to identify key metrics
♦ Organize measures into dashboards
♦ Develop a solid Measurement Infrastructure
♦ Measure processes not individuals
♦ Start small and stick with it
♦ Mentor stakeholders – they must use the measures for the program to be successful
Build an excellent Testing Organization by developing an excellent measurement program!
Build an excellent Testing Organization by developing an excellent measurement program!

11-18-2009Metrics Testing Excellence v1-0 - Pearl Street Group © 2009 60
BenefitBenefitLevel 1Level 1BaselineBaseline
Level 2Level 2 Level 3Level 3 Level 4Level 4 Level 5Level 5
Rework 40% 20% 10% 6% 3%
Estimating accuracy
20% to >100%
+10% to +20%
+5% +3% +1%
Delivered defects
X ½ X 1/4 X 1/10 X 1/100 X
Productivity X 1.5X 2X 3-4X >4X
Source: Data extrapolated from published case studies of benefits from CMM/CMMI improvement programs – Presented by Bill Curtis Presentation at the ITMPI Conference in Chicago, Nov. 13, 2008
Bill Curtis © 2008
The Benefits are Worth It

11-18-2009Metrics Testing Excellence v1-0 - Pearl Street Group © 2009 61
Questions and Discussion
Larry Dribin, Ph.D.♦
847-807-7390