Largemouth Bass in Michigan's Upper Peninsula Lakes · michigan department of natural resources...
24
1 9 4 5 Largemouth Bass in Michigan's Upper Peninsula Lakes Wilbert C. Wagner Fisheries Research Report No. 1945 March 28, 1988
Transcript of Largemouth Bass in Michigan's Upper Peninsula Lakes · michigan department of natural resources...

1 9 4 5
Largemouth Bass in
Michigan's Upper Peninsula Lakes
Wilbert C. Wagner
Fisheries Research Report No. 1945 March 28, 1988

MICHIGAN DEPARTMENT OF NATURAL RESOURCES FISHERIES DIVISION
Fisheries Research Report No. 1945
March 28, 1988
LARGEMOUTH BASS
IN
MICHIGAN'S UPPER PENINSULA LAKES1
Wilbert C. Wagner
1A contribution from Dingell-Johnson Project F-35-R, Michigan

2
ABSTRACT
Data on the largemouth bass and associated sport fish populations and fisheries were
collected from six small Upper Peninsula lakes that were judged to have fair-to-good
largemouth bass fisheries. Population estimates of the largemouth bass (2'.226 mm long) were
made with electrofishing gear prior to the opening of the fishing season. The sport fishery on
each lake was censused from the opening of the bass season through Labor Day. Population
estimates of all major fish species were made with fyke nets in September.
The number of legal-size (2'.12 inches or 305 mm) largemouth bass in the six lakes prior
to the opening of the fishing season ranged from 0.6 to 2.7 (mean = 1.6) per ha and the
standing crop ranged from 0.47 to 1.99 (mean = 0.97) kg per ha. The bass in this study were
3 to 6 cm shorter than the state average for ages IV through X. Reproduction was not
successful every year as some age groups were missing or poorly represented in all study lakes.
The estimated catch of largemouth bass per ha ranged from O to 3.8 and averaged 1.5. The
lake for which the estimated catch was O had the highest number and biomass of legal-sized
largemouth bass per ha. The correlation between the number of largemouth bass caught and
the number of legal-size bass present was not significant but the correlation between number of
bass caught and number of pan fish caught was significant. This suggests that many
largemouth bass were caught incidentally by anglers that were fishing for pan fish rather than
by anglers that sought the bass. Sublegal largemouth bass accounted for 22% of those seen
during the creel censuses.
Annual fishing mortality rates (u) were: 0.3972 for legal-size bass; 0.0950 for bass 254
to 304 mm long, and 0.0177 for bass 226 to 253 mm long. Predicted yield in numbers and in
weight from 1,000 226-mm bass with three different size limits were calculated. With a 10-inch
(254-mm) size limit, 732 bass would be harvested, but more than 50% of the fish would be
harvested at age III and age IV when they would average 273 mm and 0.26 kg. With a 14-inch
(356-mm) size limit, 586 bass with an average weight of 0.73 kg would be harvested, however,
anglers most likely would keep a higher proportion of sublegal fish in the 305- to 355-mm
range so much of the effect of a larger size limit would be lost. Thus, the present 305-mm size
limit seems best unless there is a great increase in angler acceptance to quality fishing
regulations and/or law enforcement.
3
INTRODUCTION
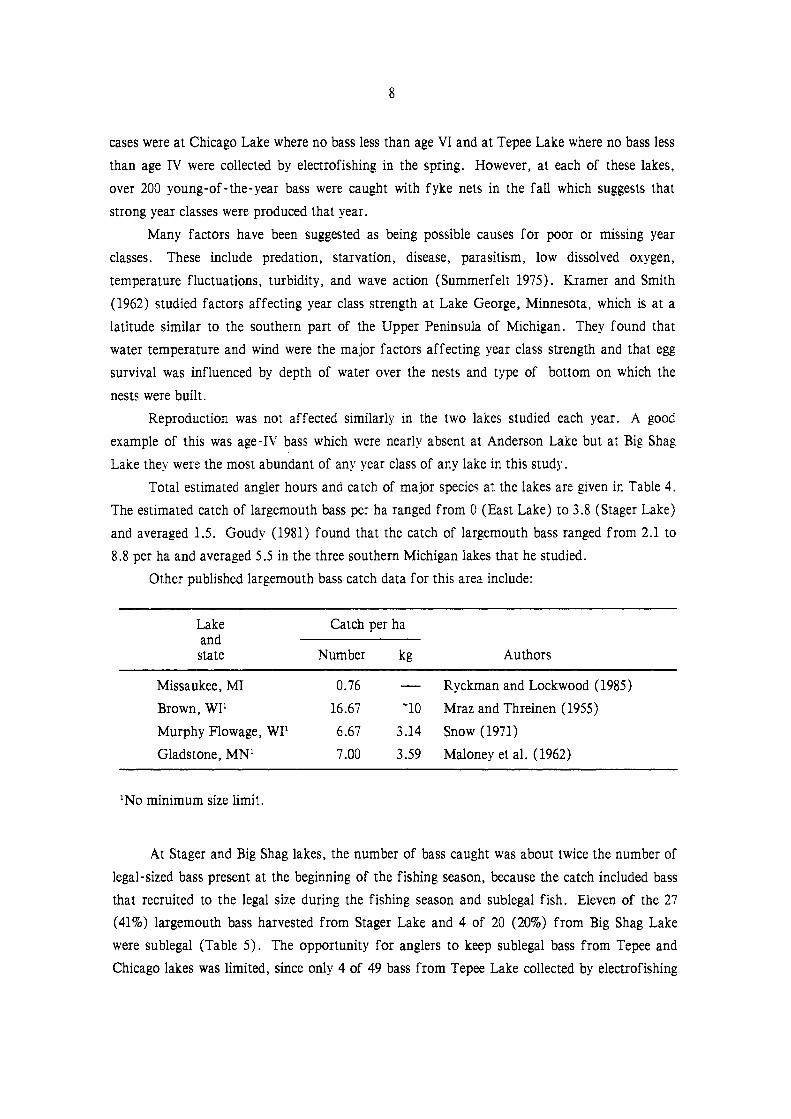
Largemouth bass (scientific names shown in Table 1) have been assumed to be an
important component of the predator fish populations in Michigan's Upper Peninsula
warm water lakes. The northern limits of the range of largemouth bass is a line running east
and west just to the north of Lake Superior (Scott and Crossman 1973), thus, the Upper
Peninsula is close to the northern limit. The largemouth bass attain their greatest abundance in
shallow weedy warmwater lakes and are seldom found more than 6 m deep (Mraz et al. 1961).
Little information is available on the fishing pressure for, or the harvest of, largemouth
bass from Upper Peninsula lakes. Creel censuses were conducted during 1976-78 on eight
warmwater lakes that had largemouth bass (Ryckman and Lockwood 1985). The catch per
hour of largemouth bass ranged from 0.0001 (Big Manistique Lake, 4,099 ha) to 0.0165
(Straits Lake, 76 ha). These fisheries were targeted at predators other than largemouth bass.
Jamsen (1979) estimated 366,000 largemouth and smallmouth bass, combined, were caught
from all inland waters of the Upper Peninsula, but the proportion of largemouth bass caught is
unknown.
Basic data on standing crop, age structure, growth rates, mortality rates, and exploitation
rates are lacking for largemouth bass and associated sport fishes in Michigan's Upper Peninsula
lakes. These data are needed to determine appropriate management strategies and to evaluate
the effectiveness of management practices. These types of information have been obtained for
lower Michigan. but conditions are different in the Upper Peninsula where largemouth bass
may be overexploited and special regulations may be needed.
This study was made in the Upper Peninsula on six small (less than 80 ha) inland lakes
that were judged to have fair-to-good largemouth bass fisheries in comparison to other lakes in
the Upper Peninsula. In this report, I quantitatively describe the largemouth bass and
associated sport fish populations and their fisheries.
STUDY AREAS
This study was conducted on two different lakes each year during 1983-85. The locations
of the study lakes are shown in Figure 1. Characteristics of the lakes were as follows:

4
Year Surface area (ha) Maximum Shoreline of depth residential
study Lake County Total ~3m (m) development
1983 Stager Iron 45 34 17 Moderate
1983 Tepee Iron 46 34 12 Sparse
1984 Chicago Delta 64 21 5 None
1984 East Schoolcraft 22 9 9 Sparse
1985 Anderson* Marquette 20 Sparse Main basin 11 7 9 Small basin 9 <l 3
1985 Big Shag• Marquette 78 Moderate Main basin 55 44 9 Small basin 23 7 6
• Anderson and Big Shag lakes each consist of two basins connected by a narrow channel.
METHODS
The numbers of largemouth bass ~226 mm long present in the study lakes were estimated
by electrofishing at night along the shoreline with a boomshocker during the 2-week period
prior to the opening of the bass fishing season. Bass were marked with serial-numbered Floy
anchor tags, fin clipped ( to estimate tag loss), measured ( total length), scale sampled ( 10 per
cm group from Stager Lake, all from the other lakes), and released. A few bass <226 mm
were collected for age data. Most bass from Stager, Tepee, Anderson, and Big Shag lakes were
weighed. Although the number of legal-size (~305 mm long) bass was the main interest, bass
226 to 304 mm were also tagged because some would grow to legal size during the summer.
Separate population estimates and their variances were calculated by the adjusted
Petersen method (formulas 3.9 and 3.8, Ricker 1975) for the 226- to 304-mm group and the
legal-size group. The catch from days at the beginning of the electrofishing were assigned to
the marking sample and those from the latter days were assigned to the recapture sample. The
division of the days was made so the number of fish in each group was as equal as possible.
Tagged fish recaptured during the marking sample days were excluded from the calculations.
The biomass of largemouth bass ~226 mm in each lake was estimated. First, a length
weight relationship was calculated from the combined data from the four lakes where the bass
were weighed. The biomass was the sum of the calculated weights of the estimated number of
bass in each 1-cm group.

5
Age determinations were made from plastic scale impressions that were examined at a
magnification of 34 times. The estimated number of largemouth bass in each lake, by age
group, was found by expanding the number of bass of each age by· a factor derived from the
population estimates. Separate expansion factors were used for bass 226 to 304 mm and ~305
mm long. An additional expansion factor was used for the Stager Lake estimates to correct for
limiting the number of scale samples to 10 per cm group.
Fishing pressure (angler hours) and harvest of fish (number) were determined for the
study lakes by a stratified random creel census from the opening of the bass fishing season (the
Saturday before Memorial Day) through Labor Day. This period was divided into three strata
that were 31 to 35 days long, because fishing pressure was expected to change during the
season. These three strata were further divided into weekend and weekday strata because of the
anticipated greater fishing activity on weekends. Holidays were included with the weekend
strata.
The amount of census effort and procedures varied from year to year depending on
available help and hours needed for travel. In 1983, one clerk censused Stager and Tepee lakes
by alternating between lakes. Each lake was censused on one weekend day and on one or two
weekdays each week. The census day was divided into three 5.5-hour time periods; one period
was randomly selected for censusing. Chicago and East lakes were similarly censused in 1984
except that each census day was either an 8-hour long morning or afternoon period. One
weekend day and one weekday were censused each week. Procedures at Anderson and Big Shag
lakes in 1985 were similar to those in 1984, except that two clerks were employed, thus a census
was made at each lake on both weekend days and on two weekdays. The percentages of the
total daylight hours during which the censuses were taken were: Stager and Tepee lakes-12%,
Chicago and East lakes-14%, and Anderson and Big Shag lakes-28%.
Fishing pressure was determined from boat and shore angler counts. Counts were made
every half hour in 1983 and 1984. Only four counts per day were made on Anderson and Big
Shag lakes because the clerk needed a boat to observe anglers in the many bays. The time of
the first count was randomly selected within a 2-hour period; the remaining three counts were
then made every 2 hours.
Anglers were interviewed either at the end of their fishing trips (complete fishing trips}
or near the end of the clerk's work day (partial fishing trips). Normally, the two types of
interviews would be treated separately but data were so scant they were combined to give larger
sample sizes. Information recorded during the interviews included: name and address of
anglers, hours fished, species, number and length of fish caught.
Estimated fishing pressure and catch were calculated according to. methods given by
Ryckman (1981). Separate estimates were made for the three 31- to 35-day periods, the

6
weekend and weekday strata, and for shore and boat strata; then all estimates were combined to
make a single estimate.
Largemouth bass data from the six lakes were combined to determine average parameters
representative of the Upper Peninsula. Combining also overcame some of the obvious year
class strength variation in individual lakes. Total instantaneous mortality rate (Z) was
determined from the age-frequency catch curve for largemouth bass age IV and older calculated
by the least squares method. Annual total mortality (A) equals l-e-2 . Annual fishing
mortality (u equals the estimated number of legal-size (305-mm) angler-caught bass divided by
the estimated population of legal-size bass plus the number of bass growing to legal size during
the study period. Annual fishing mortality (u) equals the estimated number of legal-size
( 2'.:305-mm) angler-caught bass divided by the estimated population of legal-size bass plus the
number of bass growing to legal size during the study period. Annual natural mortality ( v)
equals annual total mortality minus fishing mortality. Annual fishing mortality was also
calculated for the sublegal (226 to 304 mm) catch. Fishing mortality calculations for the legal
size catch included the bass growing to legal size, but I assumed that for the sublegal groups the
number growing into the group was balanced by the number growing out of the group. A
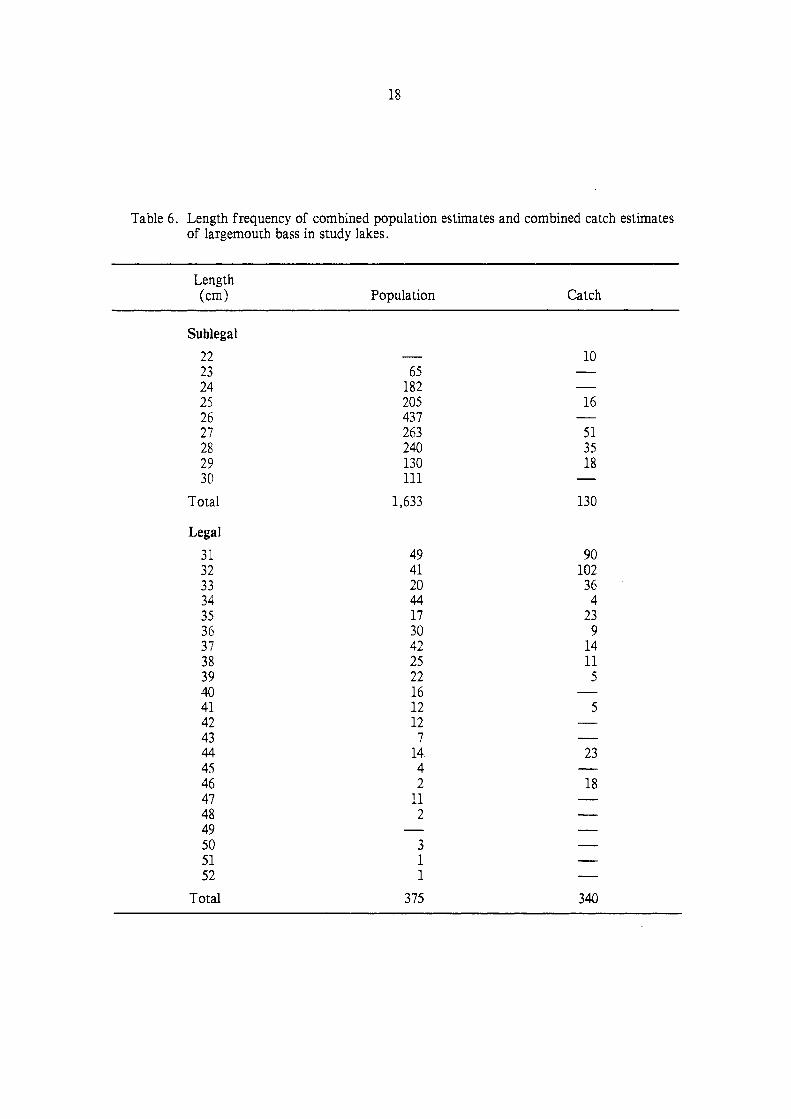
length-frequency table of the combined population estimates and combined catch estimates was
made to aid in the calculations of annual fishing mortality by size groups. Natural mortality
was assumed to be the same for sublegal bass as for the legal-size bass.
I predicted the yield with various minimum size limits per 1,000 226-mrn bass, the
minimum length for which population data were available. I used annual natural and fishing
mortality rates to calculate the reduction in number of bass for each year of life until none
remained (Ricker 1975, page 237). The yield in kg was found from the predicted number
harvested from each age group, the mean length of each group, and the length-weight
regression. Multiple census population estimates of the fish in two study lakes were made each
year during a 24-day period in September. In each lake, eight small-mesh (13- to 19-mm) fyke
nets were fished at random locations and were lifted and moved every other day. All fish in the
nets were measured (total length to cm), fin clipped, and released. The Schumacher and
Eschmeyer formulas were used to calculate the population estimates and their variances.
RESULTS AND DISCUSSION
The number of largemouth bass (number of recaptures in parentheses) collected for the
population estimates are shown below:

7
Length group
226-304 mm >305 mm
Sample Sample
Lake Marking Recapture Marking Recapture
Stager 64 28 (4) 17 5 (1)
Tepee 4 0 38 11 (4)
Chicago 0 0 14 17 (6)
East 11 13 (2) 18 19 (5)
Anderson 10 28 (6) 7 12 (2)
Big Shag 152 205 (26) 24 22 (4)
The estimated number of largemouth bass 226 to 304 mm and ;?:305 mm long and the
number per ha in each lake at the beginning of the fishing season are shown in Table 2. The
number of bass 226 to 304 mm long ranged from Oto 14.9 per ha and the number of legal-size
fish ranged from 0.6 to 2.7 per ha. There was no relationship between the number of smaller
bass and legal bass (r = -0.15).
The largemouth bass length (mm) ·weight (g) relationship for Stager, Tepee, Anderson,
and Big Shag lakes combined was log10 W = -5.5952 + 3.2860 log10L. The calculated weights
per ha are show in Table 2. The standing crop of legal-size bass in kg per ha ranged from 0.47
to 1.99 and averaged 0.97. In three southern Michigan lakes the number of legal bass per ha
ranged from 2.5 to 10.1 with a mean of 6.7 and the biomass in kg per ha ranged from 2.4 to 8.7
with a mean of 5.2 (Goudy 1981). Overall, the abundance of largemouth bass was about four
times greater in southern Michigan lakes and the biomass was about five times greater than in
Upper Peninsula lakes.
The estimated number of bass longer than 225 mm in each lake by age group and the
mean length at age are shown in Table 3. Some fish of the youngest age shown in the table for
·Stager, Anderson, and Big Shag lakes were less than 226 mm long so are not included. Thus,
the mean length for bass in those age groups is unknown. The bass in this study were 3 to 6 cm
shorter than the state average for ages IV through X (Table 3). Clady (1975) reported that
growth of largemouth bass in Cub Lake in the western Upper Peninsula also was less than the
state average. He theorized that the slow growth was due to the low nutrient content of the
water and the short growing season for bass in Upper Peninsula latitudes.
Largemouth bass reproduction apparently was not successful every year as some age
groups were missing or poorly represented in all study lakes (Table 3). The most prominent
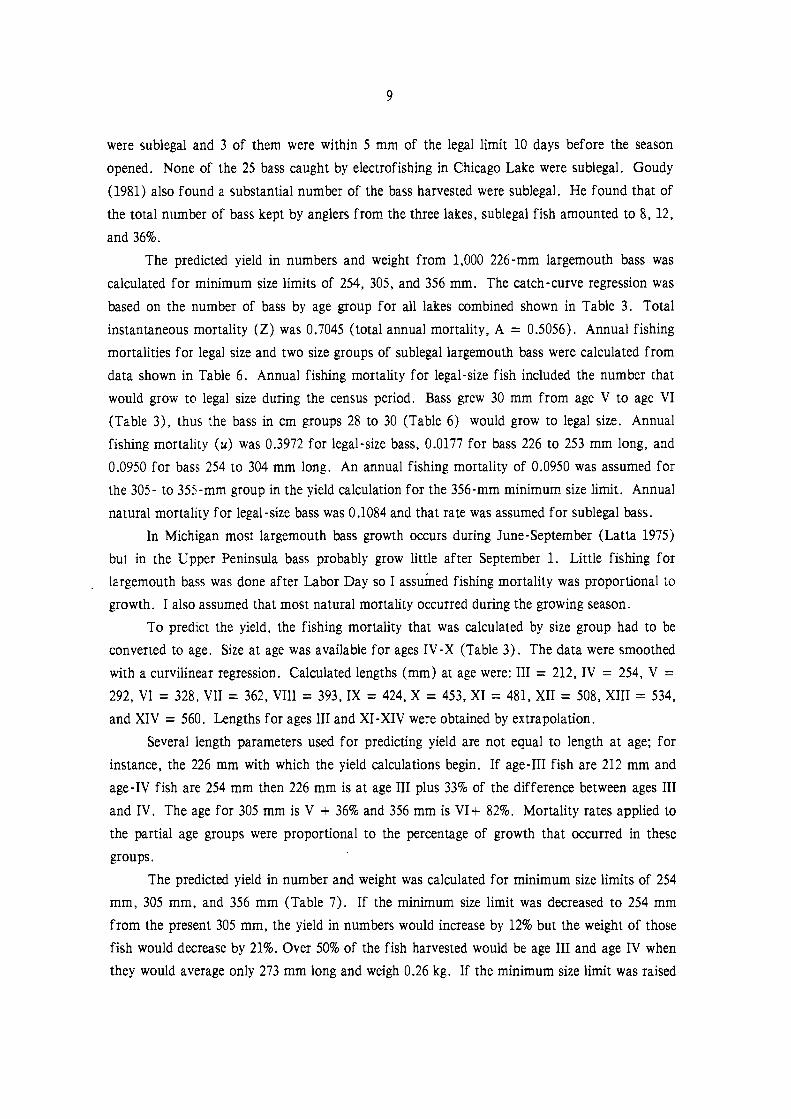
8
cases were at Chicago Lake where no bass less than age VI and at Tepee Lake where no bass less
than age IV were collected by electrofishing in the spring. However, at each of these lakes,
over 200 young-of -the-year bass were caught with fyke nets in the fall which suggests that
strong year classes were produced that year.
Many factors have been suggested as being possible causes for poor or missing year
classes. These include predation, starvation, disease, parasitism, low dissolved oxygen,
temperature fluctuations, turbidity, and wave action (Summerfelt 1975). Kramer and Smith
(1962) studied factors affecting year class strength at Lake George, Minnesota, which is at a
latitude similar to the southern part of the Upper Peninsula of Michigan. They found that
water temperature and wind were the major factors affecting year class strength and that egg
survival was influenced by depth of water over the nests and type of bottom on which the
nests were built.
Reproduction was not affected similarly in the two lakes studied each year. A good
example of this was age-IV bass which were nearly absent at Anderson Lake but at Big Shag
Lake they were the most abundant of any year class of any lake in this study.
Total estimated angler hours and catch of major species at the lakes are given in Table 4.
The estimated catch of largemouth bass per ha ranged from O (East Lake) to 3.8 (Stager Lake)
and averaged 1.5. Goudy (1981) found that the catch of largemouth bass ranged from 2.1 to
8.8 per ha and averaged 5.5 in the three southern Michigan lakes that he studied.
Other published largemouth bass catch data for this area include:
Lake and state
Missaukee, MI
Brown, WP
Murphy Flowage, WP
Gladstone, MN1
1No minimum size limit.
Catch per ha
Number kg
0.76
16.67 ~10
6.67 3.14
7.00 3.59
Authors
Ryckman and Lockwood (1985)
Mraz and Threinen (1955)
Snow (1971)
Maloney et al. (1962)
At Stager and Big Shag lakes, the number of bass caught was about twice the number of
legal-sized bass present at the beginning of the fishing season, because the catch included bass
that recruited to the legal size during the fishing season and sublegal fish. Eleven of the 27
(41%) largemouth bass harvested from Stager Lake and 4 of 20 (20%) from Big Shag Lake
were sublegal (Table 5). The opportunity for anglers to keep sublegal bass f ram Tepee and
Chicago lakes was limited, since only 4 of 49 bass from Tepee Lake collected by electrofishing
9
were sublegal and 3 of them were within 5 mm of the legal limit 10 days before the season
opened. None of the 25 bass caught by electrofishing in Chicago Lake were sublegal. Goudy
(1981) also found a substantial number of the bass harvested were sublegal. He found that of
the total number of bass kept by anglers from the three lakes, sublegal fish amounted to 8, 12,
and 36%.
The predicted yield in numbers and weight from 1,000 226-mm largemouth bass was
calculated for minimum size limits of 254, 305, and 356 mm. The catch-curve regression was
based on the number of bass by age group for all lakes combined shown in Table 3. Total
instantaneous mortality (Z) was 0.7045 (total annual mortality, A= 0.5056). Annual fishing
mortalities for legal size and two size groups of sublegal largemouth bass were calculated from
data shown in Table 6. Annual fishing mortality for legal-size fish included the number that
would grow to legal size during the census period. Bass grew 30 mm from age V to age VI
(Table 3), thus the bass in cm groups 28 to 30 (Table 6) would grow to legal size. Annual
fishing mortality (u) was 0.3972 for legal-size bass, 0.0177 for bass 226 to 253 mm long, and
0.0950 for bass 254 to 304 mm long. An annual fishing mortality of 0.0950 was assumed for
the 305- to 355-mm group in the yield calculation for the 356-mm minimum size limit. Annual
natural mortality for legal-size bass was 0.1084 and that rate was assumed for sublegal bass.
In Michigan most largemouth bass growth occurs during June-September (Latta 1975)
but in the Upper Peninsula bass probably grow little after September 1. Little fishing for
largemouth bass was done after Labor Day so I assumed fishing mortality was proportional to
growth. I also assumed that most natural mortality occurred during the growing season.
To predict the yield, the fishing mortality that was calculated by size group had to be
converted to age. Size at age was available for ages IV-X (Table 3). The data were smoothed
with a curvilinear regression. Calculated lengths (mm) at age were: III = 212, IV = 254, V =
292, VI = 328, VII = 362, VIII = 393, IX = 424, X = 453, XI = 481, XII = 508, XIII = 534,
and XIV = 560. Lengths for ages III and XI-XIV were obtained by extrapolation.
Several length parameters used for predicting yield are not equal to length at age; for
instance, the 226 mm with which the yield calculations begin. If age-III fish are 212 mm and
age-IV fish are 254 mm then 226 mm is at age III plus 33% of the difference between ages III
and IV. The age for 305 mm is V + 36% and 356 mm is VI+ 82%. Mortality rates applied to
the partial age groups were proportional to the percentage of growth that occurred in these
groups.
The predicted yield in number and weight was calculated for minimum size limits of 254
mm, 305 mm, and 356 mm (Table 7). If the minimum size limit was decreased to 254 mm
from the present 305 mm, the yield in numbers would increase by 12% but the weight of those
fish would decrease by 21 % . Over 50% of the fish harvested would be age III and age IV when
they would average only 273 mm long and weigh 0.26 kg. If the minimum size limit was raised

10
to 356 mm, the yield in numbers would decrease by 9% but the yield in weight would increase
by 13%. However. this yield is based on the fishing mortality remaining the same for the
subiegal fish in the 305-to 356-mm group as it was for the 254- to 304-mm group. Most likely
anglers would keep a higher proportion of the sublegal fish in the larger group so much of the
effect of the larger size limit might be lost. An effective 356-mm minimum size limit would
only be possible with much more law enforcement and/or angler acceptance of quality fishing
regulations.
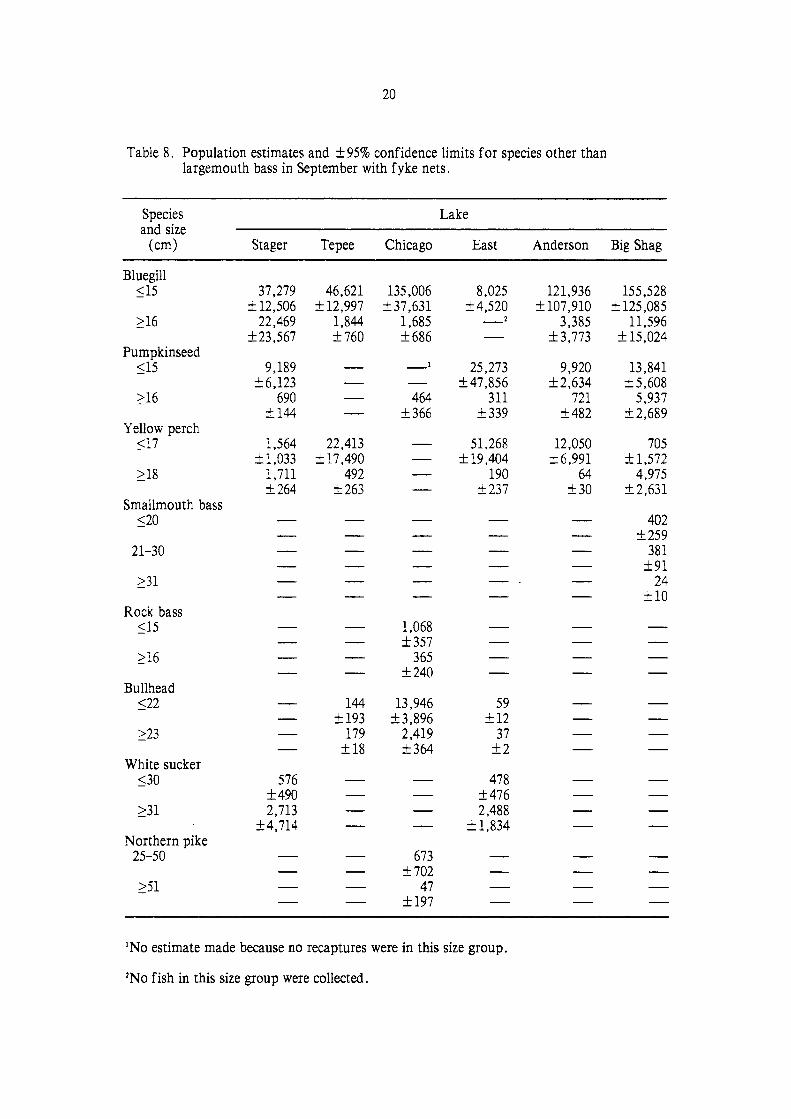
Populations estimates that were made in September with f yke nets are shown in Table 8.
Estimates could not be made for some species because no marked fish were recaptured. The
number of fish of those species were probably few judging from the number caught (Table 9).
Small ( <15 cm) bluegills were present in large numbers (more than 800/ha) in all lakes except
East Lake. Although 365 small bluegills per ha were in East Lake, no larger bluegills ( ~16 cm)
were caught with the fyke nets. Pumpkinseeds were present in five of the lakes, but only at
East Lake were small ( <15 cm) pumpkinseeds numerous (1,149/ha) and only at Big Shag Lake
were the larger (~16 cm) ones important (76/ha). Yellow perch less than 18 cm long were
very abundant (2,330/ha) in East Lake but only 9 larger perch per ha were present. At Big
Shag Lake there were 64 larger perch per ha but only 9 smaller perch per ha. Smallmouth bass
were present only in Big Shag Lake and they were about one-fourth as abundant as largemouth
bass. Northern pike were present in all lakes except Big Shag Lake. However, population
estimates for northern pike could be calculated only for Chicago Lake. A few muskellunge
were in Big Shag Lake.
The estimated number of other fish caught by anglers during this study are shown in
Table 4. There was a significant correlation (4 df; r = 0.86) between the number of pan fish
caught and largemouth bass caught. The correlation between the number of legal-size
largemouth bass present and number of bass caught was not significant (4 df; r = 0.59). East
Lake had the most legal-size bass per ha (Table 2) but by far the fewest larger size pan fish
(Table 8) and number of angler hours per ha (Table 4). At East Lake a large standing crop of
legal-size bass did not attract anglers.
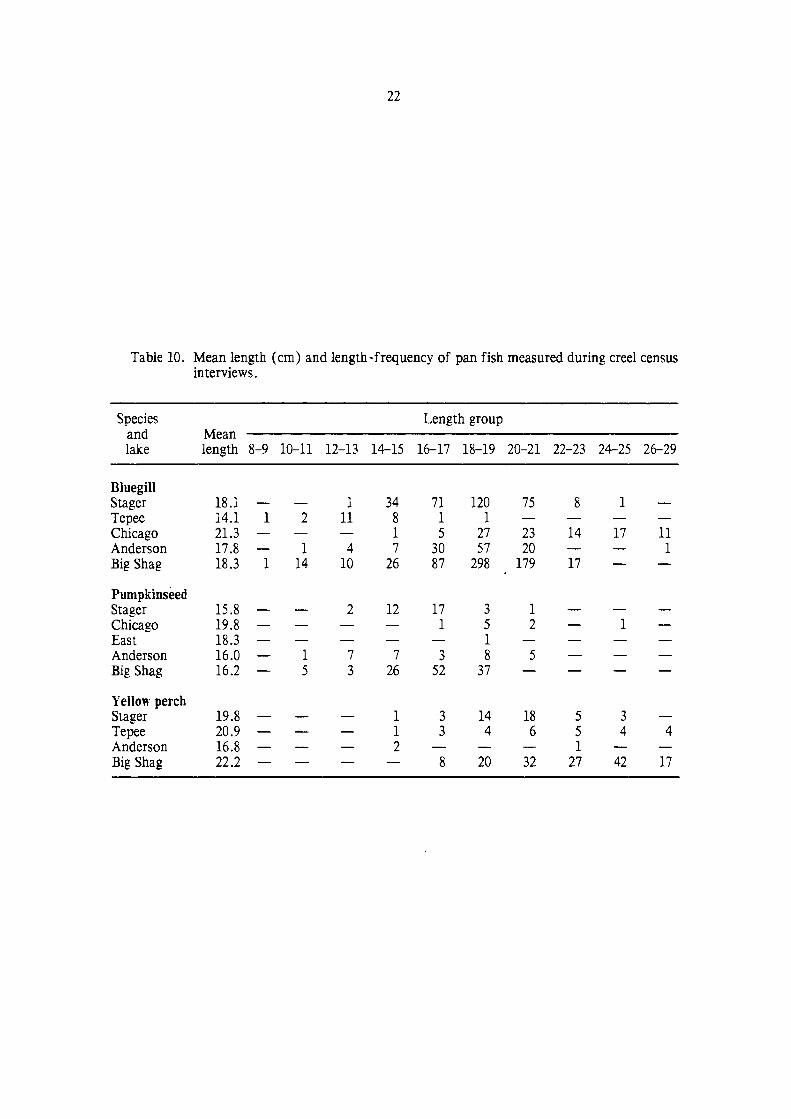
The mean length and length frequency of bluegill, pumpkinseed, and yellow perch that
were measured by the creel census clerks are shown in Table 10. There are no legal size limits
on pan fish in Michigan but the "acceptable size" is considered to be 6 inches (152 mm) for
bluegill and pumpkinseed and 7 inches (178 mm) for yellow perch. Some pan fish less than the
acceptable size were kept by anglers from nearly all of the lakes, but the highest percentages
were: 92% of the bluegill from Tepee Lake, 48% of the pumpkinseed from Anderson Lake, and
40% of the pumpkinseed from Stager Lake.
The percentage of small fish kept by anglers was not always related to the scarcity of
acceptable sized fish. For instance, the population estimates showed that the percentage of

11
acceptable sized bluegill in Chicago Lake was the lowest (1.2%) of any lakes, yet the percentage
of acceptable bluegill in the catch was the highest (90%) of any lake. Most anglers at Chicago
Lake had fished there previously and knew where to fish to catch the larger bluegill.
SUMMARY
The six lakes in this study had the "better" largemouth bass fisheries in the Upper
Peninsula. But, compared to three lakes in the Lower Peninsula, both the bass populations and
the fisheries were "poor". The number of largemouth bass, per ha, and their biomass, was
four and five times greater, respectively, while number caught per ha was three and a half
times greater in the Lower Peninsula lakes. Upper Peninsula largemouth bass grew about 90%
as fast as the state average. Reproduction was not successful every year, resulting in some age
groups missing or poorly represented in every lake. The correlation between the number of
largemouth bass caught and the number of legal-size bass present was not significant, but the
correlation between number of bass caught and number of pan fish caught was significant,
suggesting that many, perhaps most, largemouth bass were caught incidentally by anglers that
were fishing for pan fish rather than by anglers who sought the bass. The predicted yield with
minimum size limits of 254, 305, and 356 mm showed that as the size limit increased the
expected number caught decreased but the total weight of those caught increased. The present
305-mm minimum size limit seems to be the most suitable in the Upper Peninsula because at
the 254-mm limit a majority of the harvest would occur before the bass reached a size that
could be considered a sport fish and at the 356-mm limit, the keeping of sublegal fish might
increase to the point that the limit would be ineffective.
Predicted yields for the different minimum size limits were based on the average data
that were obtained by combining the data from the six study lakes. Wide confidence limits on
the population and catch estimates, plus the assumptions that were made due to insufficient
data, may have caused considerable error in the predictions.
ACKNOWLEDGMENTS
Much of the fish collecting for population estimates was done by Paul R. Hannuksela,
Richard T. Jamsen, and Michigan Civilian Conservation Corps enrollees. James R. Ryckman
and Richard D. Clark, Jr. provided statistical advice. The manuscript was reviewed by James
W. Peck, Richard G. Schorfhaar, Philip J. Schneeberger, and W. Carl Latta; their criticisms
and comments are especially appreciated. Sandra K. DuVall prepared the manuscript.

12
__ /,( ONTONAGON < : __ ~ : BARAGA ... .
"\ '----------, \ : . . . I GOGEBIC : c-------• -------------j
·------------, . . 1- l---------: @ ALGFR
IRON ; _____________ ® :-SCHOOLCRAFT :
-- ---J,, Ii"\ ,:DICKINSON,,: @ :j ___ i_ __________ _Li,@ \ "'-v-'- '1, , :------ __ , DELTA @
CD s TAG E R LA K E - .... _\ '
@ T E P E E LA K E (.., ,
@ C H I C A G O L A K E -\s-~ @) EAST LAKE '< @ ANDERSON LAKE I
fMENOMIN~ @ B I G S HA G L A K E -")
( (
'-,
Figure 1. Map of Upper Peninsula of Michigan showing location of largemouth bass study lakes.

13
Table 1. Names of fishes ref erred to in this report. 1
Common name
Brook trout
Northern pike
Muskellunge
White sucker
Bullhead
Rock bass
Pumpkinseed
Bluegill
Smallmouth bass
Largemouth bass
Yellow perch
Walleye
Scientific name
Salvelinus f ontinalis
Esox Lucius
Esox masquinongy
Catostomus commersoni
I ctalurus spp.
Ambloplites rupestris
Lepomis gibbosus
Lepomis macrochirus
Micropterus dolomieui
Micropterus salmoides
Perea flavescens
Stizostedion vitreum
1 From the American Fisheries Society Special Publication No. 12, "A list of common and scientific names of fishes from the United States and Canada", fourth edition (1980).

14
Table 2. Largemouth bass population estimates and ±2 standard errors, calculated total weight (kg) and kilograms per ha in study lakes when the bass season opened.
Lake Size group and
parameter 226-304 mm ~305 mm Total
Stager Population 371±276 48±45 419±279 Number/ha 8.2 1.1 9.3 Weight 64.06 21.12 85.18 Kg/ha 1.42 0.47 1.89
Tepee Population _1 91±57 101±63 Number/ha 2.0 2.6 Weight 56.55 60.49 Kg/ha 1.23 1.32
Chicago Population 0 36±20 36±20 Number/ha 0.6 0.6 Weight 36.58 36.58 Kg/ha 0.57 0.57
East Population 51±46 60±38 111±59 Number/ha 2.3 2.7 5.0 Weight 15.08 43.75 58.83 Kg/ha 0.69 1.99 2.68
Anderson Population 41±26 30±27 71±37 Number/ha 2.0 1.5 3.5 Weight 7.67 19.54 27.21 Kg/ha 0.26 0.65 0.91
Big Shag Population 1,160±408 110±80 1,270±416 Number/ha 14.9 1.4 16.3 Weight 269.58 70.11 339.69 Kg/ha 3.46 0.90 4.36
1Estimate not made because no marked bass were caught.

. 15
Tabie 3. Number and size (cm}, by age group, of largemouth bass ~23 cm long in study lakes prior to the fishing season, calculated from population estimates and scale samples.
Lake Age and
parameters II III IV V VI VII VIII IX X XI XII
Stager Number 6 25 218 133 26 2 2 5 Mean length _1 24 27 29 33 38 44 48 Range 23-26 23-26 24-31 26-33 29-37 38 44 47-48
Tepee Number 2 25 35 36 2 Mean length 33 32 35 37 42 Range 33 29-36 30-38 34-40 42
Chicago Number 2 4 12 16 2 Mean length 39 44 45 45 45 Range 39 42-46 41-52 4D-51 45
East Number 53 2 24 20 10 2 Mean length 29 35 36 38 40 38 Range 26-31 35 34-40 34-41 38-42 38
Anderson Number 40 5 3 12 7 3 2 Mean length _I 31 33 34 37 38 47 Range 23-28 30-32 33-34 32-36 34-39 37-40 47
Big Shag Number 49 1,086 70 36 3 3 16 5 3 Mean length _I 27 31 35 44 38 42 43 44 Range 23-24 23-32 30-34 30-38 44 38 39-47 40-47 44
All lakes2
Number 1,118 325 237 89 30 36 11 Mean length 26.3 28.3 31.3 36.5 41.4 43.0 44.0 State mean
length 29.5 33.5 37.3 41.4 44.1 46.6 49.1
1 Only the larger individuals in this age group were ~23 cm.
2 Data given only for age groups that were present in four or more lakes.

16
Table 4. Estimated fishing pressure and catch ( ±2 standard errors).
Fish caught
Hours Largemouth Yellow Northern Lake fished bass Bluegill Pumpkinseed perch pike.
Stager 3,396 171 2,485 198 268 ±390 ±103 ±906 ±123 ±168
Tepee 1,571 59 216 225 ±259 ±55 ±198 ±221
Chicago 2,225 8 1,213 98 29 ±299 ±16 ±711 ±118 ±25
East 240 7 5 ±98 ±14 ±10
Anderson 2,752 28 776 118 15 78 ±233 ±29 ±428 ±92 ±19 ±70
Big Shag 10,726 204 6,809 762 1,086 ±857 ±158 ±2.706 ±311 ±595

17
Table 5. Length-frequency and mean total length of largemouth bass caught by anglers.
Lake Length (cm) Stager Tepee Chicago East Anderson Big Shag
Sub legal
22 1 25 2 27 5 1 28 3 1 29 1 1
Legal
31 6 4 32 2 1 8 33 1 4 1 34 1 35 5 36 1 1 37 1 2 38 1 39 1 41 1 44 1 1 1 46 1 1
Not measured 6
Total 27 13 1 0 6 20
Mean length 29.6 35.3 44.4 36.9 32.3 ±95%C.L. 1.8 1.8 3.1 2.5
18
Table 6. Length frequency of combined population estimates and combined catch estimates of largemouth bass in study lakes.
Length (cm) Population Catch
Sublegal
22 10 23 65 24 182 25 205 16 26 437 27 263 51 28 240 35 29 130 18 30 111
Total 1,633 130
Legal
31 49 90 32 41 102 33 20 36 34 44 4 35 17 23 36 30 9 37 42 14 38 25 11 39 22 5 40 16 41 12 5 42 12 43 7 44 14 23 45 4 46 2 18 47 11 48 2 49 50 3 51 1 52 1
Total 375 340

19
Table 7. Predicted yield of largemouth bass in number and weight (kg) at three minimum size limits.
254-mm limit 305-mm limit 356-mm limit
Age Number Weight Number Weight Number Weight
III 12 2.0 12 2.0 12 2.0
IV 364 93.5 87 22.4 87 22.4
V 180 70.2 197 80.0 69 27.0
VI 89 49.4 182 100.8 88 50.7
VII 44 32.9 90 67.2 167 125.2
VIII 22 20.9 44 42.6 83 79.6
IX 11 13.l 22 26.6 41 49.7
X 5 8.0 11 16.2 20 30.3
XI 3 4.7 5 9.6 10 18.0
XII 1 2.6 3 5.8 5 10.8
XIII <l 1.5 1 4.3 2 6.0
XIV <l 1.8 1 3.5
<l 2.0
Total 732 298.8 655 379.3 586 427.2
20
Table 8. Population estimates and ±95% confidence limits for species other than largemouth bass in September with fyke nets.
Species Lake and size
(cm) Stager Tepee Chicago East Anderson Big Shag
Bluegill ~15 37,279 46,621 135,006 8,025 121,936 155,528
±12,506 ±12,997 ±37,631 ±4,520 ±107,910 ±125,085 2::16 22,469 1,844 1,685 _2 3,385 11,596
±23,567 ±760 ±686 ±3,773 ±15,024 Pumpkinseed
~15 9,189 _1 25,273 9,920 13,841 ±6,123 ±47,856 ±2,634 ±5,608
2::16 690 464 311 721 5,937 ±144 ±366 ±339 ±482 ±2,689
Yellow perch ~17 1,564 22,413 51,268 12,050 705
±1,033 ±17,490 ±19,404 ±6,991 ±1,572 2::18 1,711 492 190 64 4,975
±264 ±263 ±237 ±30 ±2,631 Smallmouth bass
~20 402 ±259
21-30 381 ±91
2::31 24 ±10
Rock bass ~15 1,068
±357 2::16 365
±240 Bullhead
~22 144 13,946 59 ±193 ±3,896 ±12
2::23 179 2,419 37 ±18 ±364 ±2
White sucker ~30 576 478
±490 ±476 2::31 2,713 2,488
±4,714 ±1.834 Northern pike
25-50 673 ±702
2::51 47 ±197
1No estimate made because no recaptures were in this size group.
2No fish in this size group were collected.

21
Table 9. Number of fish caught with fyke nets in September for which population estimates could not be made because no marked fish were recaptured.
Size Number range of
Lake Species (cm) fish
Stager Largemouth bass ::;121 78 13-22 45
2:23 5 Northern pike 23-75 8 Brook trout 18 J
Tepee Largemouth bass ::;121 233 13-22 2
Northern pike 66-98 8 Walleye 37-45 9
Chicago Largemouth bass ::;121 207 Northern pike :S:24 10
East Largemouth bass ::;121 4 13-22 3
Northern pike 45-75 15
Anderson Largemouth bass ::;121 10 Northern pike 32-97 16 White sucker 42-57 34
Big Shag Largemouth bass ::;121 1 13-22 6
:S:23 1 Muskellunge 30-47 6 Walleye 38-41 5 White sucker 35-55 14
1 Young-of-the-year.
22
Table 10. Mean length (cm) and length-frequency of pan fish measured during creel census interviews.
Species Length group and Mean lake length 8-9 10-11 12-13 14-15 16-17 18-19 20-21 22-23 24-25 26-29
Bluegill Stager 18.1 1 34 71 120 75 8 1 Tepee 14.1 1 2 11 8 1 1 Chicago 21.3 1 5 27 23 14 17 11 Anderson 17 .8 1 4 7 30 57 20 1 Big Shag 18.3 1 14 10 26 87 298 179 17
Pumpkinseed Stager 15.8 2 12 17 3 1 Chicago 19.8 1 5 2 1 East 18.3 1 Anderson 16.0 1 7 7 3 8 5 Big Shag 16.2 5 3 26 52 37
Yellow perch Stager 19.8 1 3 14 18 5 3 Tepee 20.9 1 3 4 6 5 4 4 Anderson 16.8 2 1 Big Shag 22.2 8 20 32 27 42 17
23
LITERATURE CITED
Bennett, G. W., H. W. Adkins, and W. F. Childers. 1969. Largemouth bass and other fishes in Ridge Lake, Illinois, 1941-1963. Illinois Natural History Survey Bulletin 30.
Clady, M. C. 1975. The effects of a simulated angler harvest on biomass and production in lightly exploited populations of smallmouth and largemouth bass. Transactions of the American Fisheries Society 104:270-276.
Goudy, G. W. 1981. The exploitation, harvest, and abundance of largemouth bass populations in three southeastern Michigan lakes. Michigan Department of Natural Resources, Fisheries Research Report 1896, Ann Arbor.
Jamsen, G. C. 1979. Michigan's 1978 sport fishing. Michigan Department of Natural Resources, Surveys and Statistical Services Report 183, Lansing.
Kramer, R. H., and L. L. Smith. 1962. Formation of year classes in largemouth bass. Transactions of the American Fisheries Society 91:29-41.
Latta, W. C. 1974. Fishing regulations for largemouth bass in Michigan. Michigan Department of Natural Resources, Fisheries Research Report 1818, Ann Arbor.
Maloney, J. E., ff R. Schupp, and W. J. Scidmore. 1962. Largemouth bass population and harvest, Gladstone Lake, Crow Wing County, Minnesota. Transactions of the American Fisheries Society 91:42-52.
Mraz, D., and C. W. Threinen. 1955. Anglers harvest, growth rate and population estimate of the largemouth bass of Brown's Lake, Wisconsin. Transactions of the American Fisheries Society 85:241-256.
Mraz, D., S. Kmiotek, and L. Frankenberger. 1961. The largemouth bass its life history, ecology and management. Wisconsin Conservation Department Publication 232.
Ricker, W. E. 1975. Computation and interpretation of biological statistics of fish populations. Fisheries Research Board of Canada Bulletin 191.
Ryckman, J. R. 1981. Creel census methods in general. Appendix VI-A-9 in Manual of Fisheries Survey Methods, J. W. Merna et al., Michigan Department of Natural Resources, Fisheries Management Report 9, Ann Arbor.
Ryckman, J. R., and R. N. Lockwood. 1985. On-site creel surveys in Michigan, 1975-82. Michigan Department of Natural Resources, Fisheries Research Report 1922, Ann Arbor.
Scott, W. B., and E. J. Crossman. 1973. Freshwater fishes of Canada. Fisheries Research Board of Canada Bulletin 184.
Snow, H. E. 1971. Harvest and feeding habits of largemouth bass in Murphy Flowage, Wisconsin. Wisconsin Department of Natural Resources, Technical Bulletin 50.
Summerfelt, R. C. 1975. Relationship between weather and year-class strength of largemouth bass. Pages 166-174 in R. H. Stroud and H. Clepper, editors. Black bass biology and management. Sport Fishing Institute, Washington, District of Columbia.