Large Scale Modeling and Simulation in Geotechnical...
38
1 Assistant Project Scientist, Department of Structural Engineering, University of California, San Diego, La Jolla, CA 92093-0085, USA, Email: [email protected] 2* Professor, Department of Structural Engineering, University of California, San Diego, La Jolla, CA 92093-0085, USA, Email: [email protected] , Tel: (858) 822-1075. 3 Senior Engineer, Tobolski-Watkins Engineering, Inc., 3710 Ruffin Road, San Diego, CA 92123, Email: [email protected] 4 Professor, Department of Civil & Environmental Engineering, Stanford University, Stanford, CA 94305-4020, Email: [email protected] 5 Professor, Department of Structural Engineering, University of California, San Diego, La Jolla, CA 92093-0085, USA, Email: [email protected] Large Scale Numerical Modeling in Geotechnical Earthquake Engineering Jinchi Lu, M.ASCE 1 ; Ahmed Elgamal, M.ASCE 2* ; Linjun Yan 3 , M.ASCE; Kincho H. Law, M.ASCE 4 ; and Joel P. Conte, M.ASCE 5 Abstract Calibration, based on data from centrifuge and shake-table experiments continues to promote the development of more accurate computational models. Capabilities such as coupled solid-fluid formulations, and nonlinear incremental-plasticity approaches, allow for more realistic representations of the involved static and dynamic/seismic responses. In addition, contemporary high-performance parallel computing environments are permitting new insights, gained from analyses of entire ground-foundation-structural systems. On this basis, the horizon is expanding for large-scale numerical simulations to further contribute towards the evolution of more accurate analysis and design strategies. The studies presented herein address this issue through recently conducted three-dimensional (3D) representative research efforts that simulate the seismic response of: i) a shallow-foundation liquefaction countermeasure, ii) a pile-supported wharf, and iii) a full bridge-ground system. A discussion of enabling tools for routine usage of such 3D simulation environments is also presented, as an important element in support of wider adoption and practical applications. In this regard, graphical user interfaces and visualization approaches can play a critical role. Keywords: numerical simulation; geotechnical; earthquake; parallel computing; liquefaction; seismic response; soil dynamics
Transcript of Large Scale Modeling and Simulation in Geotechnical...

1 Assistant Project Scientist, Department of Structural Engineering, University of California, San Diego, La Jolla, CA 92093-0085, USA, Email: [email protected] 2* Professor, Department of Structural Engineering, University of California, San Diego, La Jolla, CA 92093-0085, USA, Email: [email protected], Tel: (858) 822-1075. 3 Senior Engineer, Tobolski-Watkins Engineering, Inc., 3710 Ruffin Road, San Diego, CA 92123, Email: [email protected] 4 Professor, Department of Civil & Environmental Engineering, Stanford University, Stanford, CA 94305-4020, Email: [email protected] 5 Professor, Department of Structural Engineering, University of California, San Diego, La Jolla, CA 92093-0085, USA, Email: [email protected]
Large Scale Numerical Modeling in Geotechnical Earthquake Engineering
Jinchi Lu, M.ASCE1; Ahmed Elgamal, M.ASCE2*; Linjun Yan3, M.ASCE; Kincho H. Law,
M.ASCE4; and Joel P. Conte, M.ASCE5
Abstract
Calibration, based on data from centrifuge and shake-table experiments continues to promote the
development of more accurate computational models. Capabilities such as coupled solid-fluid
formulations, and nonlinear incremental-plasticity approaches, allow for more realistic
representations of the involved static and dynamic/seismic responses. In addition, contemporary
high-performance parallel computing environments are permitting new insights, gained from
analyses of entire ground-foundation-structural systems. On this basis, the horizon is expanding
for large-scale numerical simulations to further contribute towards the evolution of more accurate
analysis and design strategies. The studies presented herein address this issue through recently
conducted three-dimensional (3D) representative research efforts that simulate the seismic
response of: i) a shallow-foundation liquefaction countermeasure, ii) a pile-supported wharf, and
iii) a full bridge-ground system. A discussion of enabling tools for routine usage of such 3D
simulation environments is also presented, as an important element in support of wider adoption
and practical applications. In this regard, graphical user interfaces and visualization approaches
can play a critical role.
Keywords: numerical simulation; geotechnical; earthquake; parallel computing; liquefaction;
seismic response; soil dynamics

2
Introduction
High performance parallel computing is gradually becoming a main-stream tool in
geotechnical simulations (e.g., Bielak et al. 2000; Yang 2002; Lu et al. 2004; Peng et al. 2004;
Lu 2006). The need for high fidelity and for modelling of large three-dimensional (3D) spatial
configurations is motivating this direction of research. Meanwhile, new large 1-g shake table and
centrifuge testing facilities worldwide are generating valuable datasets and insights for
geotechnical earthquake engineering applications (e.g., Abdoun et al. 2003; Kagawa et al. 2004;
Brandenberg et al. 2005, 2007). In each experiment, hundreds of sensors may be available to
record salient features of the involved response, providing new horizons for development and
calibration of appropriate high fidelity computational simulation tools. Such data sets along with
high performance parallel computing environments are increasingly permitting the evolution of
insights gained from analyses of entire ground-foundation-structural systems.
Recently, a new parallel nonlinear finite element (FE) formulation (ParCYCLIC) with an
implicit time integration scheme has been developed (Lu et al. 2004; Peng et al. 2004; Lu 2006).
Details of the parallel strategies and implementation for ParCYCLIC can be found in Lu (2006).
This parallel-computing approach extends the scope of applications of the original serial code
(CYCLIC), a nonlinear FE code for analysis of liquefaction-induced seismic response (Parra
1996; Yang 2000; Yang and Elgamal 2002).
In CYCLIC, dry and saturated coupled solid-fluid 2D plane-strain (Yang et al. 2004a), and
3D Brick (Yang 2000, Yang and Elgamal 2002) soil elements are available following the Chan
(1988) original u-p formulation (in which displacement of the soil skeleton u, and pore pressure
p, are the primary unknowns). In addition, incremental-plasticity multi-yield surface (Mroz 1967,
Prevost 1985) soil models have been developed (Fig. 1) and employed for conducting seismic
3
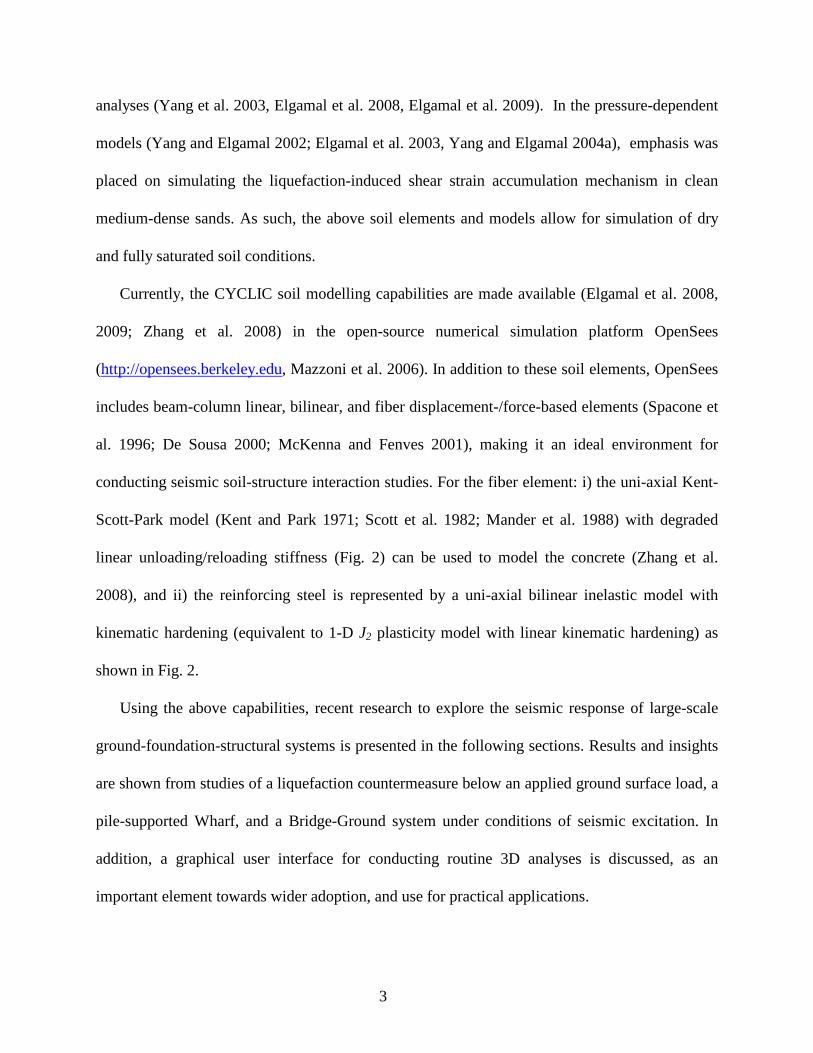
analyses (Yang et al. 2003, Elgamal et al. 2008, Elgamal et al. 2009). In the pressure-dependent
models (Yang and Elgamal 2002; Elgamal et al. 2003, Yang and Elgamal 2004a), emphasis was
placed on simulating the liquefaction-induced shear strain accumulation mechanism in clean
medium-dense sands. As such, the above soil elements and models allow for simulation of dry
and fully saturated soil conditions.
Currently, the CYCLIC soil modelling capabilities are made available (Elgamal et al. 2008,
2009; Zhang et al. 2008) in the open-source numerical simulation platform OpenSees
(http://opensees.berkeley.edu, Mazzoni et al. 2006). In addition to these soil elements, OpenSees
includes beam-column linear, bilinear, and fiber displacement-/force-based elements (Spacone et
al. 1996; De Sousa 2000; McKenna and Fenves 2001), making it an ideal environment for
conducting seismic soil-structure interaction studies. For the fiber element: i) the uni-axial Kent-
Scott-Park model (Kent and Park 1971; Scott et al. 1982; Mander et al. 1988) with degraded
linear unloading/reloading stiffness (Fig. 2) can be used to model the concrete (Zhang et al.
2008), and ii) the reinforcing steel is represented by a uni-axial bilinear inelastic model with
kinematic hardening (equivalent to 1-D J2 plasticity model with linear kinematic hardening) as
shown in Fig. 2.
Using the above capabilities, recent research to explore the seismic response of large-scale
ground-foundation-structural systems is presented in the following sections. Results and insights
are shown from studies of a liquefaction countermeasure below an applied ground surface load, a
pile-supported Wharf, and a Bridge-Ground system under conditions of seismic excitation. In
addition, a graphical user interface for conducting routine 3D analyses is discussed, as an
important element towards wider adoption, and use for practical applications.

4
Liquefaction-Induced Settlement of a Shallow Foundation and Remediation
Liquefaction-induced tilting and settlement of buildings on shallow foundations results in
disruption of function and considerable replacement expense. This type of response was
commonplace during the much documented 1964 Niigata (Japan), 1990 Dagupan city
(Philipines), 1999 Chi-Chi (Taiwan), and 1999 Koaleci (Turkey) earthquakes (Kishida 1966;
Ohsaki 1966; Seed and Idriss 1967; Yoshimi and Tokimatsu 1977; Tokimatsu et al. 1991;
Adachi et al. 1992; Ishihara et al. 1993; Tokimatsu et al. 1994; EERI 2000, 2001). To mitigate
the detrimental liquefaction effects, ground modification approaches may be implemented
(Mitchell and Wentz 1991; Mitchell et al. 1995, 1998; Adalier and Elgamal 2004). In this regard,
numerical modeling can play a significant role towards the development of economical effective
solutions.
With the aid of numerical simulation, this section addresses the efficacy of a liquefaction-
induced countermeasure below an applied surface load (Lu 2006). Within this relatively simple
context, the main aim is to highlight the role of parallel computing in conducting ground
modification studies (Lu 2006).
Shallow Foundation Model
A 10 m deep saturated medium sand soil stratum was studied. The surface load (40 kPa, or
about 2 m of an equivalent soil overburden) was simply applied in the form of a distributed
vertical stress over a 2 m x 2 m area (Fig. 3). More accurate loading patterns may be explored in
future studies with no added complexity (e.g., imposing load that represents an actual building
geometry by using additional super-structure elements, modeling of potential embedment of the

5
foundation below ground surface, and/or locating water table at some depth below ground
surface). Below the foundation, compacted dense gravel is placed to a depth of 2 m (Fig. 3) as a
measure to mitigate the effects of liquefaction.
In this study, behavior of the cohesionless soils was represented by the Lade-Duncan yield
function (Fig. 1c). The stratum properties (friction angle φ = 31.4 degrees, and permeability k =
6.6 × 10⁻⁵ m/s) were calibrated by data from centrifuge testing using Nevada Sand at Dr of about
40%, with the gravel represented by a friction angle φ = 40 degrees and a permeability k = 1.0 ×
10-2 m/s. The full set of model parameters is reported in Elgamal et al. (2005).
In view of symmetry, a half-mesh was employed as shown in Fig. 3. Length in the
longitudinal and transverse directions is 26 m and 13 m respectively (in this half-mesh
configuration). In this model, the following (solid and fluid) boundary conditions were
implemented: (i) lateral excitation was defined along the base in the longitudinal direction, (ii) at
any given depth, displacement degrees of freedom along the left and right boundaries were tied
together (both horizontally and vertically using the penalty method) to mimic a 1D shear wave
propagation effect, (iii) the soil surface was traction free, with zero prescribed pore pressure, and
(iv) the base and lateral boundaries were impervious.
The 7.5 m depth (NS direction) downhole acceleration record (Fig. 4) from the Wildlife site
during the 1987 Superstition Hills earthquake was employed as longitudinal base excitation.
After the earthquake, much evidence of liquefaction and lateral spreading was observed at this
location (Holzer et al. 1989; Youd and Holzer 1994; Zeghal and Elgamal 1994).
In order to adequately reproduce the mechanisms of ground settlement and associated
remediation effects, a high level of spatial resolution is necessary. To illustrate this effect, 4
different meshes (75, 500, 960, and 4480 elements) were utilized in this study (Fig. 3). Fo these

6
meshes, the number of degrees of freedom (DOF) were 1620, 8679, 15868 and 67716,
respectively. Finally, the ParCYCLIC computer code (Lu et al. 2004; Peng et al. 2004; Lu 2006)
simulations were conducted on the parallel machine Datastar at the San Diego Supercomputer
Center (SDSC 2008).
Simulation Results
Fig. 3 shows the final deformed mesh for the four cases. As expected, the deformed shape
becomes smoother with model refinement. Minimal influence of the lateral mesh boundaries may
be also noted (particularly for the high-fidelity 4480 element case).
Fig. 5 displays the foundation settlement time histories computed by the 4 employed meshes.
The crude 75 element mesh predicts only half of the final settlement as compared to the finer
meshes. With mesh refinement, the settlement appears to become gradually stable at about 0.23
m (Fig. 5).
The parallel-computing speedup factors for the above 4 cases are shown in Fig. 6. As the
number of employed processors increased, the execution time was reduced by as much as a factor
of 5. For the two small meshes, speedup was significant when using up to 8 processors. Beyond,
the additional overhead in processor communications starts to significantly compromise the
overall performance. For the finest mesh, use of as many as 32 processors was found to be quite
effective (Fig. 6b).
Simulation of a Pile-Supported Wharf System
Wharfs supported on piles are commonplace Port structures in the United States (Lim et al.
2010). The seismic response involves significant pile-slope interaction that is best simulated by

7
modelling the actual 3D configuration. To address this geometric scenario, a 3D model of a pile-
supported wharf system was studied (Lu 2006). The idealized model configuration is based on
typical geometries (Lim et al. 2010) of pile-supported wharf structures (Berth 100 Container
Wharf at the Port of Los Angeles). In Fig. 7, a 3D slice in this wharf system (central section) is
shown, that exploits symmetry of the supporting pile-system configuration (Lu 2006).
In this idealized model (Fig. 7), there are 16 piles in 6 rows. Each pile is 0.6 m in diameter,
and 43 m in length (reinforced concrete). The cracked flexural rigidity (EI) of the pile is 159
MN-m2, with a moment of inertia (I) of 7.09 x 10⁻³ m4. Relative to the piles, the wharf deck is
modelled to be an essentially rigid monolith (with a thickness of 0.8 m).
Two soil layers were represented in this idealized model using the multi-yield surface
pressure-independent (Von-Mises) idealization (Fig. 1a), with a hyperbolic backbone curve (peak
shear strength su reached at 3% octahedral shear strain). The lower layer (25 m in height) was
modelled as stiff clay (low strain shear modulus G = 486 MPa, Poisson’s ratio ν = 0.46, and su of
255 kPa) with the upper layer being a weaker medium-strength clay (G = 80 MPa, ν = 0.46, and
su of 44 kPa). The water table level was located at 16.6 m above the mud-line, and the slope
inclination angle was 39 degrees.
The base of the FE model was assumed to be rigid (the actual bedrock level is much deeper at
this site). A scaled Rinaldi Receiving Station record from the 1994 Northridge Earthquake was
employed as the base input motion (Fig. 8). On the waterside and landside of the FE model,
motion was specified as the computed accelerations from a one-dimensional (1D) shear beam
simulation (Yang et al. 2004b) of the left and right soil columns. Symmetry along the front and
back side boundaries was represented by prescribing a roller support boundary condition.
Modelling of the above pile-supported wharf system was conducted on the machine Datastar

8
at SDSC (using ParCYCLIC). A total of 64 processors were employed in computing the results
shown below and the total execution time was about 12 hours.
Simulation Results
The computed wharf deck longitudinal displacement time history is shown in Fig. 8, with a
permanent downslope displacement of about 0.3 m. The major pulse of permanent displacement
(Fig. 8) corresponds to the large acceleration phase (the near-fault “fling motion”) in the base
input record.
Fig. 7 shows the final deformed mesh of the pile-supported wharf system. As can be seen,
most deformation occurs within the upper layer with the stiff lower soil stratum showing minimal
lateral displacement. In addition, the resulting slope deformation pattern is seen to be clearly
dictated by the lateral bending flexibility of the embedded pile foundation system. As such, the
results highlight the critical importance of studying the combined wharf-pile-slope configuration
as a single integral system.
Modeling of a Bridge-Foundation-Ground System
Soil-structure interaction (SSI) may play a major role in dictating the seismic response of a
bridge structure. Specifically, the resulting overall ground deformation may lead to permanent
displacement of the abutments (Fig. 9) and foundations. A study of such mechanisms was
undertaken based on the geometric configuration of the Humboldt Bay Middle Channel Bridge
(HBMCB), a Testbed initiated by the Pacific Earthquake Engineering Research (PEER) center. A
bridge-foundation-ground FE model was developed based on the Testbed configuration (Fig. 10),
near Eureka in northern California (Yan 2006, Elgamal et al. 2008).
9
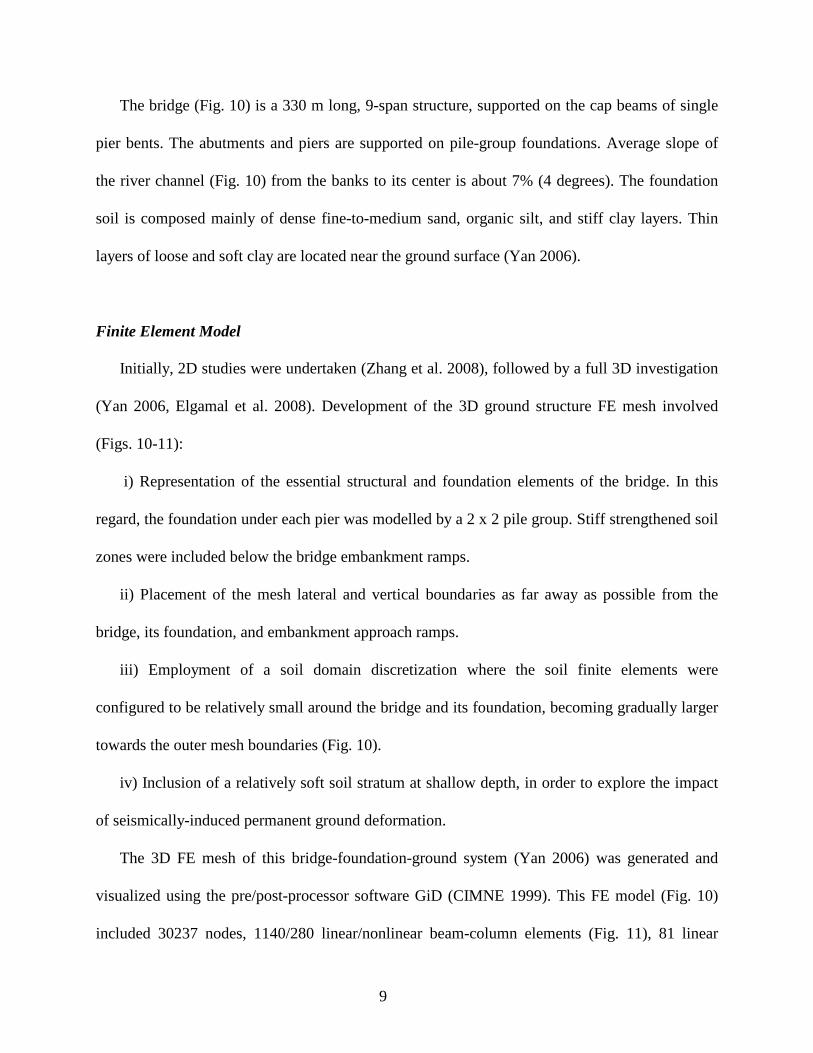
The bridge (Fig. 10) is a 330 m long, 9-span structure, supported on the cap beams of single
pier bents. The abutments and piers are supported on pile-group foundations. Average slope of
the river channel (Fig. 10) from the banks to its center is about 7% (4 degrees). The foundation
soil is composed mainly of dense fine-to-medium sand, organic silt, and stiff clay layers. Thin
layers of loose and soft clay are located near the ground surface (Yan 2006).
Finite Element Model
Initially, 2D studies were undertaken (Zhang et al. 2008), followed by a full 3D investigation
(Yan 2006, Elgamal et al. 2008). Development of the 3D ground structure FE mesh involved
(Figs. 10-11):
i) Representation of the essential structural and foundation elements of the bridge. In this
regard, the foundation under each pier was modelled by a 2 x 2 pile group. Stiff strengthened soil
zones were included below the bridge embankment ramps.
ii) Placement of the mesh lateral and vertical boundaries as far away as possible from the
bridge, its foundation, and embankment approach ramps.
iii) Employment of a soil domain discretization where the soil finite elements were
configured to be relatively small around the bridge and its foundation, becoming gradually larger
towards the outer mesh boundaries (Fig. 10).
iv) Inclusion of a relatively soft soil stratum at shallow depth, in order to explore the impact
of seismically-induced permanent ground deformation.
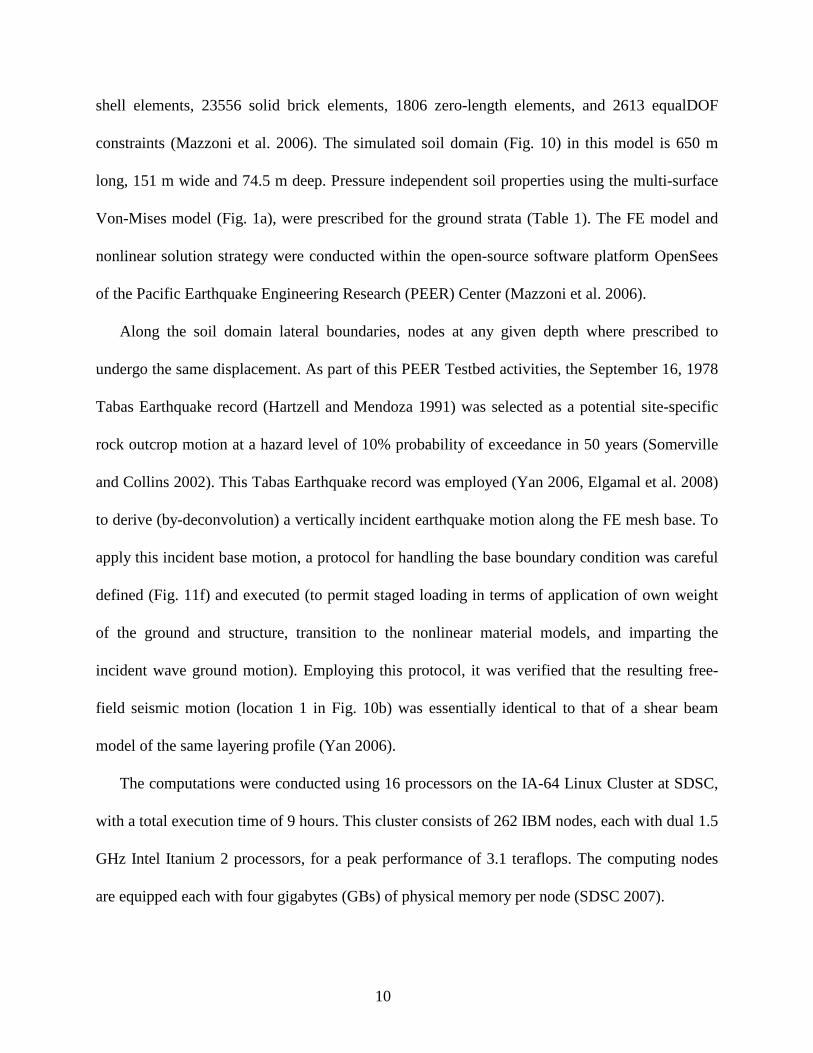
The 3D FE mesh of this bridge-foundation-ground system (Yan 2006) was generated and
visualized using the pre/post-processor software GiD (CIMNE 1999). This FE model (Fig. 10)
included 30237 nodes, 1140/280 linear/nonlinear beam-column elements (Fig. 11), 81 linear
10
shell elements, 23556 solid brick elements, 1806 zero-length elements, and 2613 equalDOF
constraints (Mazzoni et al. 2006). The simulated soil domain (Fig. 10) in this model is 650 m
long, 151 m wide and 74.5 m deep. Pressure independent soil properties using the multi-surface
Von-Mises model (Fig. 1a), were prescribed for the ground strata (Table 1). The FE model and
nonlinear solution strategy were conducted within the open-source software platform OpenSees
of the Pacific Earthquake Engineering Research (PEER) Center (Mazzoni et al. 2006).
Along the soil domain lateral boundaries, nodes at any given depth where prescribed to
undergo the same displacement. As part of this PEER Testbed activities, the September 16, 1978
Tabas Earthquake record (Hartzell and Mendoza 1991) was selected as a potential site-specific
rock outcrop motion at a hazard level of 10% probability of exceedance in 50 years (Somerville
and Collins 2002). This Tabas Earthquake record was employed (Yan 2006, Elgamal et al. 2008)
to derive (by-deconvolution) a vertically incident earthquake motion along the FE mesh base. To
apply this incident base motion, a protocol for handling the base boundary condition was careful
defined (Fig. 11f) and executed (to permit staged loading in terms of application of own weight
of the ground and structure, transition to the nonlinear material models, and imparting the
incident wave ground motion). Employing this protocol, it was verified that the resulting free-
field seismic motion (location 1 in Fig. 10b) was essentially identical to that of a shear beam
model of the same layering profile (Yan 2006).
The computations were conducted using 16 processors on the IA-64 Linux Cluster at SDSC,
with a total execution time of 9 hours. This cluster consists of 262 IBM nodes, each with dual 1.5
GHz Intel Itanium 2 processors, for a peak performance of 3.1 teraflops. The computing nodes
are equipped each with four gigabytes (GBs) of physical memory per node (SDSC 2007).

11
Simulation Results
Figs. 10 and 12 show the residual deformation of the entire bridge-foundation-ground system
after the earthquake. As observed in historical earthquake events (Yan 2006), these figures
display typical damage scenarios such as settlement of the embankment ramps, soil lateral
spreading along the river bank, and the resulting permanent deformation of the bridge foundation
system and superstructure.
Along the river banks, the yielded soil flowed down-slope towards the center of the river
channel, and the maximum soil lateral movement at both river banks reached approximately 0.28
m. The mass of the embankment ramps resulted in ground settlement of about 0.3 m near the left
abutment and 0.4 m near the right abutment. Such large settlement of embankment ramps would
impede traffic and result in malfunction after the earthquake.
Fig. 13 shows that the permanent longitudinal displacement ( xd ) of the abutment top finally
reached 0.15/0.10 m at the left/right embankments, respectively (Yan 2006). Thus, the
embankments moved towards each other producing a compressive axial force ( P ) along the
bridge superstructure (Fig. 13). This figure also shows that the settlement ( yd ) at the end of the
earthquake reached as much as 0.15/0.21 m at the left/right, respectively, which is significantly
larger than settlement of the bridge piers (Fig. 12). The above observed displacement (both
vertical and longitudinal) is seen to increase the vertical shear force ( V ) and longitudinal
bending moment ( zM ) in the bridge girders (Fig. 13).
As such, among the main observations from this study are:
1) Permanent ground deformation had a major impact on the overall bridge deformation
pattern (Figs. 10 and 12). Translation of the pile groups towards the center of the underlying

12
waterway (Fig. 12) induces significant moments and shear forces in the bridge piers.
2) Settlement and lateral translation of the bridge approach embankments induced very large
forces into the bridge super-structure (Fig. 13). In the employed fixed bridge-embankment
connection, very high permanent shear forces and bending moments were observed as a
consequence of this mechanism (Fig. 13).
3) A noticeable difference in seismic motion along the ground surface was observed (Fig.
14). This difference was mainly due to the presence of the upper crust layer above the specified
soft and relatively low strength shallow stratum (Layer 1 in Table 1). Essentially, a form of base
isolation emanates from such a stratification profile.
Visualization
Efficient visualization of the massive amounts of data from large-scale 3D simulations (Yan
2006) is increasingly becoming an important element of the overall analysis framework. Among
the advanced approaches, 3D graphical models may be now constructed using the SGI Open
Inventor toolkit (http://www.sgi.com/products/software/inventor/). Stereoscopic visualization is
facilitated by Geowall (http://www.geowall.org, and http://siogeowall.ucsd.edu), an efficient and
low-cost system that exploits the power of PC-based commodity graphics hardware and passive
polarization techniques. Fig. 15 shows a 3D stereoscopic model of the bridge system, and the pile
foundations below the ground. This environment provides advanced interactive options such as
immersive viewing (full-view close-ups within the model’s spatial domain), which can
significantly help in understanding the data from a new perspective.
13
Graphical User Interfaces
A pre- and post-processor graphical interface OpenSeesPL has been developed (Lu 2006, Lu
et al. 2006) in order to facilitate the efficient execution of 3D ground-foundation computational
simulations. Currently, this interface permits the analysis of footings, piles (Fig. 16a) and pile
groups (Fig. 16b) under static and seismic loading conditions. Various ground modification
scenarios may be also studied by appropriate specification of the material within the pile zone.
The FE analysis engine for this interface is the OpenSees computational platform (Mazzoni et al.
2006).
OpenSeesPL includes a pre-processor for: 1) definition of the pile geometry (circular or
square pile) and material properties (linear or nonlinear), 2) definition of the 3D spatial soil
domain, 3) definition of the boundary conditions and input excitation or push-over analysis
parameters, and 4) selection of soil materials from an available menu of cohesionless and
cohesive soil materials. The menu of soil materials includes a complementary set of soil
modelling parameters representing loose, medium and dense cohesionless soils (with silt, sand or
gravel permeability), and undrained soft, medium and stiff clay (J2 plasticity cyclic model).
OpenSeesPL allows convenient pre-processing and graphical visualization of the analysis
results including the deformed mesh (Fig. 17), ground response time histories and pile responses.
This user interface makes it possible for geotechnical and structural engineers/researchers to
rapidly build a model, run the FE analysis, and evaluate performance of the pile-ground system
(Lu et al. 2006). Recent studies using this interface include:
1. Pile-Group Push-Over Analysis
Elgamal and Lu (2009) conducted a pilot study to illustrate salient pile-group interaction
mechanisms (Fig. 18) under lateral loading conditions. Initially, calibration was undertaken for

14
the scenario of a single pile in a homogenous half-space, dictating the use of an appropriate large
soil mesh (in terms of element size and location of mesh boundaries). The nonlinear J2 plasticity
model (Fig. 1a) was then employed for the soil domain, and the impact of pile spacing was
systematically studied (free head piles in all cases).
Fig. 19 depicts the displacement fields (plan view) for pile spacing configurations (where d
stands for pile diameter). At close pile spacing (e.g., 3d), it is evident that the entire soil mass
between the piles is translating. Thus, the piles end up sharing the available lateral resistance of
the surrounding soil. As the spacing increases, each pile is surrounded by an adequate soil
domain (independent of the other piles), thus allowing the single pile resistance to be gradually
achieved by each pile at a spacing of about 8d (Fig. 19).
2. Ground Modification
For scenarios of ground modification, a representative cell (within a large remediated area)
may be studied using the periodic boundary concept (Law and Lam 2001) along the mesh lateral
sides (Fig. 20). Following this logic, OpenSeesPL was employed recently to study liquefaction-
induced lateral ground displacement mitigation, by the stone column and pile-pinning approaches
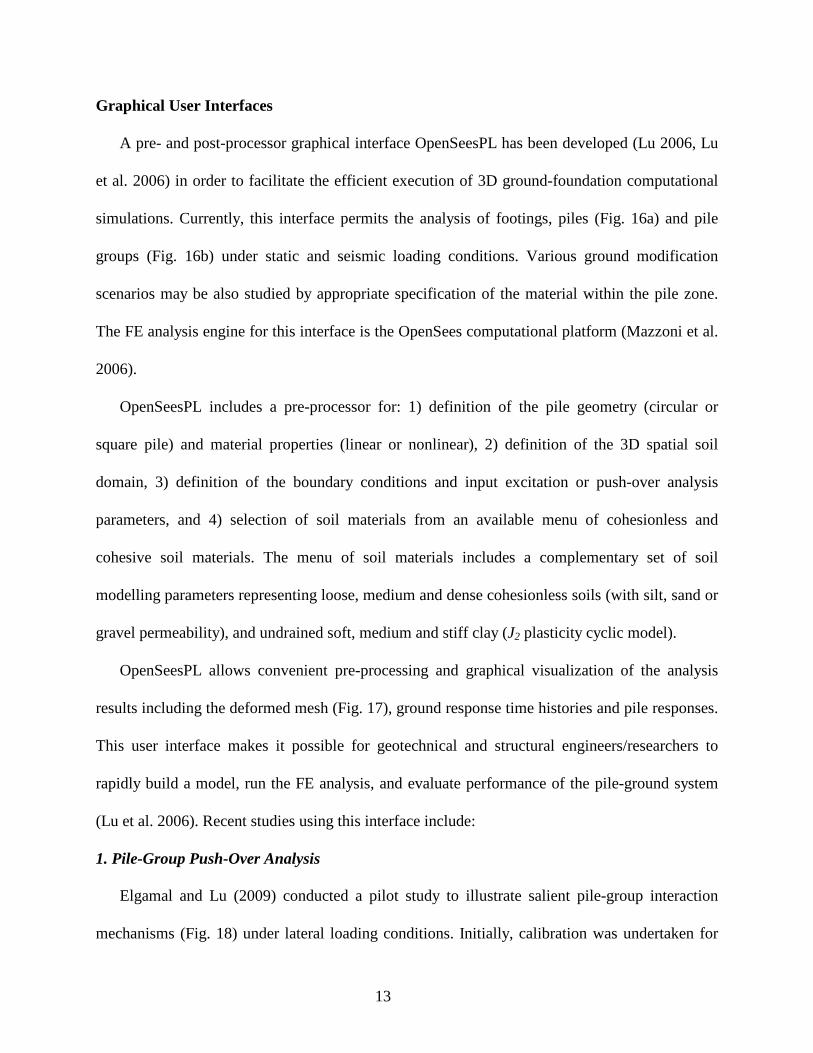
(Elgamal et al. 2009). Fig. 21 shows the results for a 10 m thick mildly-inclined (4 degrees)
saturated non-plastic silt layer (permeability k = 1 x 10⁻⁷ m/sec). The soil stress strain properties
were represented by the Drucker-Prager relationship (Fig. 1b), calibrated based on Nevada Sand
properties at a medium relative density Dr of about 40 % (Elgamal et al. 2003, 2009; Yang et al.
2003).
As shown in Fig. 21, 3 simulations were performed. Case MS represents the original
benchmark Medium Dr Silt un-remediated situation (essentially a 1D shear wave propagation
15
situation). In order to reduce the extent of liquefaction-induced lateral deformation, remediation
by Stone Columns (Case SC) and by the pile-pinning effect were investigated with an area
replacement ratio Arr = 20 % (Figs. 20 and 21). Diameter of the stone column or pile was set at
0.6 m and the surrounding area was adjusted accordingly. The stone column properties were
represented by dense sand properties (Lu et al. 2006) and a representative gravel permeability of
k = 1 × 10⁻² m/s. The pile bending stiffness was specified by EI = 1.27 × 10⁵ kN-m2.
Fig. 21 shows the lateral displacement time histories at the model surface center for the 3
cases. The mild 4 degrees inclination imposes a static driving shear stress component (due to
gravity), causing the accumulated longitudinal downslope deformation (Fig. 21). For Case SC,
the final lateral displacement was reduced to 0.5 m, compared to 1.7 m in Case MS (the free-field
response). There is essentially no lateral displacement in the pile-pinning case, showing this
approach to be highly viable for cellular remediation.
Summary and Conclusions
This paper presents recent research that addressed the seismic response of large-scale ground-
foundation-structural systems using high performance computing techniques. Representative
numerical results were shown for the seismic response of a ground modification liquefaction
countermeasure, a pile-supported wharf, and a bridge-foundation-ground system. To facilitate 3D
computations, a graphical user-interface (OpenSeesPL) was shown to be a useful tool for
conducting simulations of idealized ground and ground-pile configurations.
Overall, the presented studies aim to illustrate the potential for further reliance on computer
simulation in assessment of nonlinear seismic ground response. Challenges in calibration, and in
high fidelity modeling are being gradually overcome. With careful attention to the involved

16
modeling details, effective insights may be gleaned for a wide-range of practical applications.
Acknowledgements
This research was supported by the Pacific Earthquake Engineering Research (PEER) Center,
under the National Science Foundation Award Number EEC-9701568, and by the National
Science Foundation (Grants No. CMS-0200510, and OCI-0749227). Additional funding was also
provided by NSF through computing resources provided by the San Diego Supercomputer Center
(SDSC). The Wharf geometric layout information provided by Dr. (Arul) K. Arulmoli, Principal,
Earth Mechanics, Inc. is gratefully appreciated. Finally, Mr. Atul Nayak of SDSC played a
leadership role in developing the presented Immersaview visualizations.

17
References
Abdoun, T., Dobry, R., O'Rourke, T. D., and Goh, S. H. (2003). "Pile response to lateral spreads: Centrifuge modeling." Journal of Geotechnical and Geoenvironmental Engineering, 129(10), 869-878.
Adachi, T., Iwai, S., Yasui, M., and Sato, Y. (1992). "Settlement of inclination of reinforced concrete buildings in Dagupan city due to liquefaction during 1990 Philippine earthquake." Proceedings of the 10th World Conference on Earthquake Engineering, A. A. Balkema,(ed.), Madrid, Spain, July 19-25, 2, 147-152.
Adalier, K., and Elgamal, A. (2004). “Mitigation of liquefaction and associated ground deformations by stone columns,” Journal of Engineering Geology, Volume 72, Issues 3-4, Elsevier, April, 275-291.
Bielak, J., Hisada, Y., Bao, H., Xu, J., and Ghattas, O. (2000). "One- vs two- or three- dimensional effects in sedimentary valleys." Proceedings of 12th World Conference on Earthquake Engineering, New Zealand, February.
Brandenberg, S. J., Boulanger, R. W., Kutter, B. L., and Chang, D. (2005). "Behavior of pile foundations in laterally spreading ground in centrifuge tests." Journal of Geotechnical and Geoenvironmental Engineering, 131(11), 1378-1391.
Brandenberg, S. J., Boulanger, R. W., Kutter, B. L., and Chang, D. (2007). "Static pushover analyses of pile groups in liquefied and laterally spreading ground in centrifuge tests." Journal of Geotechnical and Geoenvironmental Engineering, 133(9), 1055-1066.
Chan, A. H. C. (1988). "A unified finite element solution to static and dynamic problems in geomechanics," PhD Thesis, University College of Swansea, U. K.
CIMNE. (1999). Gid reference manual, http://gid.cimne.upc.es, International Center for Numerical Methods in Engineering, Barcelona, Spain.
De Sousa, R. M. (2000). "Force-based finite element for large displacement inelastic analysis of frames", PhD Thesis, University of California, Berkeley.
EERI. (2000). "Kocaeli. Turkey, earthquake of August 17, 1999 reconnaissance report." Earthquake Spectra 16, Supplement A, Earthquake Engineering Research Institute (EERI).
EERI. (2001). "Chi-Chi, Taiwan, earthquake of September 21, 1999, reconnaissance report." Earthquake Spectra 17, Supplement A, Earthquake Engineering Research Institute (EERI).
Elgamal, A., Yang, Z., Parra, E., and Ragheb, A. (2003). "Modeling of cyclic mobility in saturated cohesionless soils." International Journal of Plasticity, 19(6), 883-905.
Elgamal, A., Lu, J. and Yang, Z. (2005). “Liquefaction-induced settlement of shallow foundations, and remediation: 3D numerical stimulation", Journal of Earthquake Engineering,

18
Vol. 9, Special Issue 1, 17-45, Imperial College Press.
Elgamal, A., Yan, L., Yang, Z., and Conte, J. P. (2008). “Three-dimensional seismic response of bridge foundation-ground system,” Journal of Structural Engineering, ASCE, 134(7), 1165-1176, July.
Elgamal, A. and Lu, J. (2009). "A framework for 3D finite element analysis of lateral pile system response", ASCE GSP 186, M Iskander, D F. Laefer, and M H. Hussein, Eds, 616-623.
Elgamal, A., Lu, J. and Forcellini, D. (2009). "Mitigation of liquefaction-induced lateral deformation in a sloping stratum: three-dimensional numerical simulation," Journal of Geotechnical and Geoenvironmental Engineering, ASCE, 135(11), 1672-1682.
Hartzell, S. H., and Mendoza, C. (1991). "Application of an iterative least-squares waveform inversion of strong-motion and teleseismic records to the 1978 Tabas, Iran earthquake." Bulletin of the Seismological Society of America, 81, 3-5-331.
Holzer, T. L., Youd, T. L., and Hanks, T. C. (1989). "Dynamics of liquefaction during the 1987 Superstition Hills, California, earthquake." Science, 244, 56-59.
Ishihara, K., Alex, A., Acacio, and Towhata, I. (1993). "Liquefaction-induced ground damage in Dagupan in the July 16, 1990 Luzon earthquake." Soils and Foundations, 33(1), 133-154.
Kagawa, T., Sato, M., Minowa, C., Abe, A., and Tazoh, T. (2004). "Centrifuge simulations of large-scale shaking table tests: case studies." Journal of Geotechnical and Geoenvironmental Engineering, 130(7), 663-672.
Kent, D. C., and Park, R. (1971). "Flexural members with confined concrete." J. Structural Engineering Division., ASCE, 97(7), 1969–1990 Kishida, H. (1966). "Damage to reinforced concrete buildings in Niigata city with special
reference to foundation engineering." Soils and Foundations, 6(1), 71-88.
Law, H. K. and Lam, I. P. (2001). "Application of periodic boundary for large pile group." J. Geotech. Geoenviron. Eng., ASCE, 127, 10, 889–892.
Lim, A., Aliviado, R., Jaradat, O.A., and Arulmoli, K. (2010). "Berths 145-147 container terminal wharf upgrade design and construction at the port of Los Angeles", ASCE, Ports 2010: Building on the Past, Respecting the Future , Proceedings of the twelfth triannual International Conference, April 25-28, Jacksonville, Florida, 414-423.
Lu, J., Peng, J., Elgamal, A., Yang, Z., and Law, K. H. (2004). "Parallel finite element modeling of earthquake liquefaction response." International Journal of Earthquake Engineering and Engineering Vibration, 3(1), 23-37.
Lu, J. (2006). "Parallel finite element modeling of earthquake site response and liquefaction," PhD Thesis, Department of Structural Engineering, University of California, San Diego, La
19
Jolla, CA.
Lu, J., Yang, Z., and Elgamal, A. (2006). "OpenSeesPL three-dimensional lateral pile-ground interaction version 1.00 user's manual." Report No. SSRP-06/03, Department of Structural Engineering, University of California, San Diego.
Mander, J. B., Priestley, M. J. N., and Park, R. (1988). "Theoretical stress-strain model for confined concrete." Journal of the Structural Engineering, 114(ST8), 1804-1826.
McKenna, F. T., and Fenves, G. L. (2001). The OpenSees Command Language Manual, Version 1.2, Pacific Earthquake Engineering Research Center, University of California, Berkeley.
Mazzoni, S., McKenna, F., and Fenves, G. L. (2006). Open system for earthquake engineering simulation user manual, Pacific Earthquake Engineering Research Center, University of California, Berkeley (http://opensees.berkeley.edu/).
Mitchell, J.K. and Wentz, F.J. (1991). "Performance of improved ground during the Loma Prieta Earthquake." University of California, Berkeley, UCB/EERC Report 91/12.
Mitchell, J.K., Baxter, C.D.P. and Munson, T.C. (1995). "Performance of improved ground during earthquakes." In: Proc., Soil Improvement for Earthquake Hazard Mitigation, ASCE Geotechnical Special Publication, vol. 49, pp. 1–36.
Mitchell, J.K., Cooke, H.G. and Schaeffer, J.A. (1998). "Design considerations in ground improvement for seismic risk mitigation." In: Proc., Geotechnical Earthquake Engineering and Soil Dynamics III, ASCE Geotechnical Special Publication No. 75, vol. 1, pp. 580–613.
Mróz, Z. (1967). "On the description of anisotropic workhardening" Journal of the Mechanics and Physics of Solids, 15(3), May, 163-175.
Ohsaki, Y. (1966). "Niigata earthquake, 1964 building damage and soil condition." Soils and Foundations, 6(2), 14-37.
Parra, E. (1996). "Numerical modeling of liquefaction and lateral ground deformation including cyclic mobility and dilation response in soil systems," PhD Thesis, Rensselaer Polytechnic Institute, Troy, NY.
Peng, J., Lu, J., Law, K. H., and Elgamal, A. (2004). "ParCYCLIC: Finite element modeling of earthquake liquefaction response on parallel computers." International Journal for Numerical and Analytical Methods in Geomechanics, 28(12), 1207-1232.
Prevost, J. H. (1985). "A simple plasticity theory for frictional cohesionless soils." Soil Dynamics and Earthquake Engineering, 4(1), 9-17.
Scott, B. D., Park, R. and Priestley, M.J.N. (1982). "Stress-strain behavior of concrete confined by overlapping hoops at low and high strain rates." ACI Journal, 79(1), 13-27.

20
SDSC. (2007). IA-64 cluster user guide, San Diego Supercomputer Center, San Diego, CA.
SDSC. (2008). Datastar user guide, San Diego Supercomputer Center, San Diego, CA.
Seed, H. B., and Idriss, I. M. (1967). "Analysis of soil liquefaction: Niigata earthquake." Journal of Soil Mechanics and Foundations Division, 93(3), 83-108.
Spacone, E., Filippou, F. C., and Taucer, F. F. (1996). "Fibre beam-column model for non-linear analysis of R/C frames: part I. formulation." Earthquake Eng and Structural Dynamics, 25(7), 711-725.
Somerville, P., and Collins, N.. (2002). "Ground motion time histories for the Humboldt Bay Bridge." Report, prepared for the PEER Methodology Testbeds Project, URS Corporation, Pasadena, CA.
Tokimatsu, K., Midorikawa, S., Tamura, S., Kuwayama, S., and Abe, A. (1991). "Preliminary report on the geotechnical aspects of the Philippine Earthquake of July 16, 1990." Proceedings of the 2nd International Conference on Recent Advances in Geotechnical Earthquake Engineering and Soil Dynamics, University of Missouri-Rolla, 1, 357-364.
Tokimatsu, K., Kojima, H., Kuwayama, S., and Midorikawa, S. (1994). "Liquefaction-induced damages to buildings in 1990 Luzon Earthquake." Journal of Geotechnical Engineering, 120(2), 290-307.
Uang, C.-M., Elgamal, A., Li, W.-S. and Chou, C.-C. (1999). "Ji-Ji, Taiwan earthquake of September 21, 1999: performance evaluation of buildings and bridges," Report No. SSRP 99/17, Department of Structural Engineering, University of California, San Diego, La Jolla, CA.
Yan, L. (2006). "Sensor data analysis and information extraction for structural health monitoring," PhD Thesis, University of California, San Diego, La Jolla, CA.
Yang, Z. (2000). "Numerical modeling of earthquake site response including dilation and liquefaction," PhD Thesis, Columbia University, New York, NY.
Yang, Z., and Elgamal, A. (2002). "Influence of permeability on liquefaction-induced shear deformation." Journal of Engineering Mechanics, 128(7), 720-729.
Yang, Z. (2002). "Development of geotechnical capabilities into OpenSees platform and their applications in soil-foundation-structure interaction analyses." PhD Thesis, University of California, Davis, CA.
Yang, Z., Elgamal, A. and Parra, E. (2003). "A computational model for cyclic mobility and associated shear deformation." J. of Geotechnical and Geoenvironmental Eng, ASCE, 129(12), 1119-1127.
Yang, Z., and Elgamal, A. (2004). “Multi-surface cyclic plasticity sand model with lode angle

21
effect,” Journal of Geotechnical and Geological Engineering, 26(3), 3350348, Springer, Netherlands.
Yang, Z., Elgamal, A., Adalier, K. and Sharp, M.K. (2004a). "Earth dam on liquefiable foundation and remediation: numerical simulation of centrifuge experiments", J. Engrg. Mech., 130(10) 1168-1176.
Yang, Z., Lu, J., and Elgamal, A. (2004b). "A web-based platform for computer simulation of seismic ground response." Advances in Engineering Software, 35(5), 249-259.
Yoshimi, Y., and Tokimatsu, K. (1977). "Settlement of buildings on saturated sand during earthquakes." Soils and Foundations, 17(1), 23-38.
Youd, T. L., and Holzer, T. L. (1994). "Piezometer performance at the Wildlife liquefaction site." Journal of Geotechnical Engineering, 120(6), 975-995.
Zeghal, M. and Elgamal, A. (1994). “Analysis of site liquefaction using earthquake records,''
Journal of Geotechnical Engineering, ASCE, 120(6), 996-1017. Zhang, Y., Conte, J.P., Yang, Z., Elgamal, A., Bielak, J. and Acero, G. (2008). “Two-
dimensional nonlinear earthquake response analysis of a bridge-foundation-ground system.” Earthquake Spectra, 24(2), May, 343-386.

22
Table 1. HBMCB soil profile properties
Soil Layer (depth range in m)
Mass Density kg/m3
Shear Modulus G (kPa)
Shear strength su (kPa)
Approach Embankment 2000 30000 30 Crust layer (0 m – 2 m) 1500 60000 40 Layer 1 (2 m – 9.33 m) 1300 19000 10 Embankment Foundation 1500 25000 25 Layer 2 (9.33 m – 22 m) 1500 60000 40 Layer 3 (22 m – 44.5 m) 1800 196000 75 Layer 4 (44.5 m – 63.25 m) 1900 335000 75 Layer 5 (63.25 m – 74.5 m) 1900 475000 75

23
(a)
(b)
(c)
Figure 1. Multi-yield surface soil models: a) Von Mises or J2 (Elgamal et al. 2008), b) Drucker-Prager (Yang and Elgamal 2003), and c) Lade-Duncan (Yang and Elgamal 2004).

24
(a)
(b)
Figure 2. (a) Concrete Kent-Scott-Park model with degraded linear unloading/reloading stiffness; and (b) reinforcing steel bilinear inelastic model with linear kinematic hardening (Kent and Park 1971; Scott et al. 1982; Mander et al. 1988, after Elgamal et al. 2008).

25
a)
b)
c)
d)
Figure 3. Final deformed mesh (factor of 10) of the shallow foundation model (1/2 mesh due to symmetry for 75, 500, 960, and 4480-element cases; dark zone represents remediated domain): a) 75-element case; b) 500-element; c) 960-element; d) 4480-element.
Figure 4. Base input motion for the shallow foundation model

26
Figure 5. Vertical displacement time histories of the foundation for the shallow foundation model

27
a)
b)
Figure 6. Parallel speedup factors for different mesh sizes (supercomputer: Datastar): a) 75 and 500 elements; b) 960 and 4480 elements.

28
(a)
(b) Figure 7. Pile-supported wharf (Lu 2006): a) Final deformed mesh, and b) Close-up of final deformed mesh (amplified by a factor of 30)
Figure 8. Deck longitudinal displacement time history and base input record (Lu 2006)
Landside
Waterside

29
Figure 9. Ji-Ji Taiwan earthquake Mouken No. 2 Bridge site showing cracks at wing wall and embankment (Uang et al. 1999).
(a)
(b)
Figure 10. Humboldt Bay Middle Channel Bridge: a) Sky view (Zhang et al. 2008), and b) Final deformed mesh (factor of 50; arrows indicate soil lateral deformation and settlement (adapted from Yan 2006)

30
Reinforcing steel (955mm2)
Unconfined concrete Confined concrete
0.61m2.13m0.61m
0.61
m0.
61m
(a)
(c)
(d)
(e)
Unconfined concrete
Reinforcing steel (127mm2)
Confined concrete
1.37m
(b)
(f)
Figure 11. Modeling of pier and pile group using fiber-section beam-column elements with uni-axial material constitutive models (Yan 2006): (a) fiber discretization of pier cross-section; (b) fiber discretization of pile cross-section; (c) pile group with pile cap above ground; (d) pile group with pile cap below ground surface; (e) abutment and approach ramp zone; (f) boundary condition along the FE model base; I: own weight; and II: earthquake analysis.
Rigid frame (Pile cap)
“Rigid” linear beam-column
elements

31
Figure 12. Elevation and plan views of the bridge system after earthquake shaking.
Figure 13. Correlation between abutment displacement and bridge response (Yan 2006): (a) longitudinal displacement dx, and settlement dy at abutment tops; (b) axial force P, vertical shear force V, and longitudinal moment Mz in bridge girders

32
Figure 14. Linear elastic acceleration response spectra (5 percent damped) for locations 1-3 in Fig. 10.

33
Figure 15. 3D stereoscopic visualization of the bridge-foundation-ground system (Yan 2006) by Immersaview (http://www.evl.uic.edu/cavern/agave/immersaview/).

34
(a)
(b) Figure 16. OpenSeesPL user interface (Lu et al. 2006) with mesh showing a circular pile/pile group in level ground (view of ½ mesh shown due to symmetry for uni-directional lateral loading): (a) single pile; (b) 3x3 pile group

35
Figure 17. Deformed shape of a 3x3 pile group under lateral loading (1/2 mesh configuration due to symmetry)
Figure 18. 3x3 Pile group (1/2 mesh configuration due to symmetry).

36
(a)
(b)
Figure 19. 3x3 pile group displacement field (3d, 5d, 6d, and 8d), (a) plan view (top to bottom), and (b) pile head deflection.

37
(a)
(b)
Figure 20. a) Cellular ground modification and FE mesh (1/2 due to symmetry), b) Plan view of single-pile 3D mesh in OpenSeesPL (dark zone represents the pile zone).
38
Figure 21. Base acceleration and ground surface displacement.