Large-Scale Analysis of the Docker Hub...
10
Large-Scale Analysis of the Docker Hub Dataset Nannan Zhao 1 , Vasily Tarasov 2 , Hadeel Albahar 1 , Ali Anwar 1 , Lukas Rupprecht 2 , Dimitrios Skourtis 2 , Amit S. Warke 2 , Mohamed Mohamed 3 , and Ali R. Butt 1 1 Virginia Tech, 2 IBM Research—Almaden, 3 Apple Abstract—Docker containers have become a prominent solu- tion for supporting modern enterprise applications due to the highly desirable features of isolation, low overhead, and efficient packaging of the execution environment. Containers are created from images which are shared between users via a Docker registry. The amount of data Docker registries store is massive; for example, Docker Hub, a popular public registry, stores at least half a million public images. In this paper, we analyze over 167 TB of uncompressed Docker Hub images, characterize them using multiple metrics and evaluate the potential of file- level deduplication in Docker Hub. Our analysis helps to make conscious decisions when designing storage for containers in general and Docker registries in particular. For example, only 3% of the files in images are unique, which means file-level deduplication has a great potential to save storage space for the registry. Our findings can motivate and help improve the design of data reduction, caching, and pulling optimizations for registries. I. I NTRODUCTION Recently, containers [1] have gained significant traction as an alternative to virtual machines [2] for virtualization both on premises and in the cloud. Polls suggest that 87% of enterprises are in the process of adopting containers, and that containers are expected to constitute a lucrative $2.5 billion market by 2020 [3]. In contrast to Virtual Machines (VMs), containers share the same kernel but are isolated in terms of process visibility (e.g., via namespaces [4]) and resource usage (e.g., via control groups [5]). Containers require fewer memory and storage resources, start faster, and typically incur less execution overhead than VMs [6]–[8]. A driving force for fast container adoption is the pop- ular Docker [9] container management framework. Docker combines process containerization with convenient packaging of an application’s complete runtime environment in images. For storage and network efficiency, images are composed of independent, shareable layers of files. Images and their corresponding layers are stored in a centralized registry and accessed by clients as needed. Docker Hub [10] is the most popular registry, currently storing more than 500,000 public image repositories comprising over 2 million layers. The size of the registry is steadily increasing. Over a period from June to September 2017, we observed a linear growth of the number of images in Docker Hub with an average creation rate of 1,241 public repositories per day. We expect this trend to continue as containers gain more popularity. While the massive image dataset presents challenges to the registry and client storage infrastructure, storage for containers 978-1-7281-4734-5/19/$31.00 ©2019 IEEE has remained a largely unexplored area. We believe one of the prime reasons is the limited understanding of what data is stored inside containers. This knowledge can help improve the container storage infrastructure and ensure scalability of and fast accesses to the registry service. Existing work has focused on various aspects of containerization [11]–[16]. However, the registry and its contents have yet to be studied in detail. In this paper, we perform the first, comprehensive, large- scale characterization and redundancy analysis of the images and layers stored in the Docker Hub registry (§II). We download all latest publicly accessible images (as of May 2017), which amount to 47 TB of image data (§III). Based on that dataset, we analyze traditional storage properties, such as file count, data compression ratios, directory depths, as well as Docker-specific properties, e.g., the number of layers per image, image popularity, and the amount of layer sharing. Furthermore, we investigate the potential for data reduction in the Docker registry by using file-level deduplication. Our analysis reveals several interesting insights (§IV). First, the majority of layers are small in size and show a low com- pression ratio. 50% of the layers are smaller than 4 MB which holds both for compressed and uncompressed layers, and the median layer compression ratio is 2.6. As compression is computationally intensive, storing small layers in the registry uncompressed can improve latency during pulls as layers do not have to be uncompressed locally anymore. Second, we find that only around 3% of the files are unique while others are redundant copies. This suggests that file-level deduplication has a great potential to save storage space for large-scale registries. We also find that image accesses are skewed towards a small number of popular images. Specifically, 90% of repositories are pulled less than 300 times since creation, while the largest number of pulls we record for an image is over 600 million. This suggests that image caching is a viable improvement for the registry. Our analysis provides a first insight into the Docker image dataset, which can help improve the design of current data reduction, caching, and pulling optimizations for container registries. II. BACKGROUND Container-based virtualization (such as Linux Contain- ers (LXC) [17]) has emerged as a lightweight virtualization alternative. Compared to Virtual Machine based server vir- tualization technologies (e.g., VMware [18] or Xen [19]), container virtualization works at the operating system level. Containers share the same kernel which improves startup
Transcript of Large-Scale Analysis of the Docker Hub...
Large-Scale Analysis of the Docker Hub Dataset
Nannan Zhao1, Vasily Tarasov2, Hadeel Albahar1, Ali Anwar1, Lukas Rupprecht2,
Dimitrios Skourtis2, Amit S. Warke2, Mohamed Mohamed3, and Ali R. Butt1
1Virginia Tech, 2IBM Research—Almaden, 3Apple
Abstract—Docker containers have become a prominent solu-tion for supporting modern enterprise applications due to thehighly desirable features of isolation, low overhead, and efficientpackaging of the execution environment. Containers are createdfrom images which are shared between users via a Dockerregistry. The amount of data Docker registries store is massive;for example, Docker Hub, a popular public registry, stores atleast half a million public images. In this paper, we analyzeover 167 TB of uncompressed Docker Hub images, characterizethem using multiple metrics and evaluate the potential of file-level deduplication in Docker Hub. Our analysis helps to makeconscious decisions when designing storage for containers ingeneral and Docker registries in particular. For example, only3% of the files in images are unique, which means file-leveldeduplication has a great potential to save storage space forthe registry. Our findings can motivate and help improve thedesign of data reduction, caching, and pulling optimizations forregistries.
I. INTRODUCTION
Recently, containers [1] have gained significant traction as
an alternative to virtual machines [2] for virtualization both
on premises and in the cloud. Polls suggest that 87% of
enterprises are in the process of adopting containers, and that
containers are expected to constitute a lucrative $2.5 billion
market by 2020 [3]. In contrast to Virtual Machines (VMs),
containers share the same kernel but are isolated in terms
of process visibility (e.g., via namespaces [4]) and resource
usage (e.g., via control groups [5]). Containers require fewer
memory and storage resources, start faster, and typically incur
less execution overhead than VMs [6]–[8].
A driving force for fast container adoption is the pop-
ular Docker [9] container management framework. Docker
combines process containerization with convenient packaging
of an application’s complete runtime environment in images.
For storage and network efficiency, images are composed
of independent, shareable layers of files. Images and their
corresponding layers are stored in a centralized registry and
accessed by clients as needed. Docker Hub [10] is the most
popular registry, currently storing more than 500,000 public
image repositories comprising over 2 million layers. The size
of the registry is steadily increasing. Over a period from June
to September 2017, we observed a linear growth of the number
of images in Docker Hub with an average creation rate of
1,241 public repositories per day. We expect this trend to
continue as containers gain more popularity.
While the massive image dataset presents challenges to the
registry and client storage infrastructure, storage for containers
978-1-7281-4734-5/19/$31.00 ©2019 IEEE
has remained a largely unexplored area. We believe one of
the prime reasons is the limited understanding of what data is
stored inside containers. This knowledge can help improve the
container storage infrastructure and ensure scalability of and
fast accesses to the registry service. Existing work has focused
on various aspects of containerization [11]–[16]. However, the
registry and its contents have yet to be studied in detail.
In this paper, we perform the first, comprehensive, large-
scale characterization and redundancy analysis of the images
and layers stored in the Docker Hub registry (§II). We
download all latest publicly accessible images (as of May
2017), which amount to 47 TB of image data (§III). Based on
that dataset, we analyze traditional storage properties, such as
file count, data compression ratios, directory depths, as well
as Docker-specific properties, e.g., the number of layers per
image, image popularity, and the amount of layer sharing.
Furthermore, we investigate the potential for data reduction
in the Docker registry by using file-level deduplication.
Our analysis reveals several interesting insights (§IV). First,
the majority of layers are small in size and show a low com-
pression ratio. 50% of the layers are smaller than 4 MB which
holds both for compressed and uncompressed layers, and the
median layer compression ratio is 2.6. As compression is
computationally intensive, storing small layers in the registry
uncompressed can improve latency during pulls as layers do
not have to be uncompressed locally anymore. Second, we find
that only around 3% of the files are unique while others are
redundant copies. This suggests that file-level deduplication
has a great potential to save storage space for large-scale
registries.
We also find that image accesses are skewed towards a small
number of popular images. Specifically, 90% of repositories
are pulled less than 300 times since creation, while the largest
number of pulls we record for an image is over 600 million.
This suggests that image caching is a viable improvement
for the registry. Our analysis provides a first insight into the
Docker image dataset, which can help improve the design of
current data reduction, caching, and pulling optimizations for
container registries.
II. BACKGROUND
Container-based virtualization (such as Linux Contain-
ers (LXC) [17]) has emerged as a lightweight virtualization
alternative. Compared to Virtual Machine based server vir-
tualization technologies (e.g., VMware [18] or Xen [19]),
container virtualization works at the operating system level.
Containers share the same kernel which improves startup

repository name separated by a “/”, we can search for “/”
and obtain a list of all non-official repositories. The Crawler
downloads all pages from the search results and parses the web
content to build a list of all non-official repositories. We ran the
crawler on May 30th, 2017 and it delivered a list of 634,412
repositories. After removing duplicate entries (introduced by
Docker Hub indexing logic), the final repository list consists
of 457,627 distinct repositories.
B. Downloader
Images in Docker Hub repositories are labeled with versiontags to track different image versions. If a user does not
provide a tag when pulling an image, Docker client pulls the
latest tag by default. In this work we focus on downloading
images with the latest tag to make the analysis more
feasible. We plan to extend our analysis to other image tags
in the future.
Instead of using the Docker client to download images,
we implement our own downloader, which calls the Docker
registry API directly [22] to download manifests and image
layers in parallel. Note that we only download unique layers.
Our downloader runs significantly faster than a dockerpull-based downloader which performs many other opera-
tions in addition to downloading the image. For example, it
automatically extracts each layer’s tar archive file and creates
the corresponding read-only snapshot using the configured
Docker storage driver. This not only takes considerable amount
of time but also leads to overly high storage space utilization.
Furthermore, the local storage format of Docker images makes
it difficult to analyze the contents of each layer separately. Our
downloader can download multiple images simultaneously and
fetch the individual layers of an image in parallel. Layers are
transferred as gzip compressed tar archives.
The whole downloading process took around 30 days. Over-
all, we downloaded 355,319 images, resulting in 1,792,609
compressed layers and 5,278,465,130 files, with a total com-
pressed dataset size of 47 TB. A total of 111,384 images could
not be downloaded due to two reasons: 1) 13% of these images
required authentication; 2) 87% of these images did not have
a latest tag.
C. Analyzer
The analyzer extracts the downloaded layers and analyzes
them along with the image manifests. For each image, it
creates an image profile and individual layer profiles, which
contain metrics for the whole image and its individual layers,
respectively.
a) Layer profile: To produce the layer profile, the an-
alyzer first decompresses and extracts each layer tarball to a
layer directory. Then, it recursively traverses each subdirectory
and obtains its metadata information. A layer profile contains
the following information:
1) Layer metadata: { layer digest; layer size, which is the sum
of contained file sizes (FLS); compressed layer size, which
is the size of compressed layer tarball (CLS); directory
count; file count; max. directory depth }
0 128 256 384 5120
0.2
0.4
0.6
0.8
1
Layer size (MB)
Cum
ulat
ive
laye
r pro
babi
lity
CompressedUncompressed
(a) CDF of layer sizes
5 25 45 65 85 105 1250
2
4
6
8
10
12x 105
Layer size (MB)
Laye
r fre
quen
cy
CompressedUncompressed
(b) Histogram of layer sizes
Fig. 3. Layer size distribution
2) Compression ratio: { FLS-to-CLS; }3) Directory metadata (for every directory in the layer): {
directory name; directory depth; file count; }4) File metadata (for every file in the layer): { file name; file
digest; file type (identified by magic number); file size; }b) Image profile: To create the image profile, the an-
alyzer parses the manifest and obtains the configuration in-
formation such as OS and target architecture. Further, once
individual layers are analyzed, the analyzer builds the image
profile by including pointers to its layer profiles. An image
profile consists of:
1) Image metadata: { image name; sum of containing file sizes
(FIS); compressed image size (CIS); directory count; file
count; }2) Compression ratio: { FIS-to-CIS; }
IV. DATASET CHARACTERIZATION
In this section we carry out our analysis of the Docker
Hub dataset by characterizing layers, images, and files. While
overall we are interested in its general structure, we also
analyze specific properties that allow us to draw conclusions
regarding the caching, compression, and resource provisioning
for Docker images.
A. Layers
We start by analyzing layers in terms of size and compress-
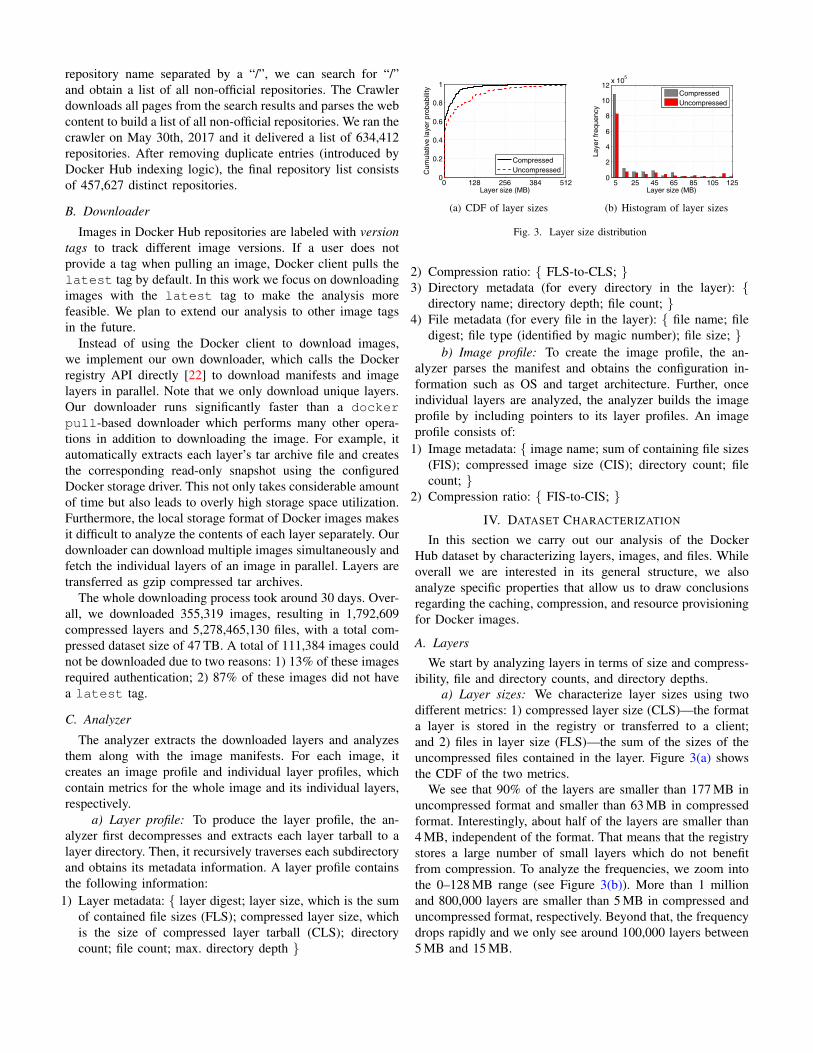
ibility, file and directory counts, and directory depths.a) Layer sizes: We characterize layer sizes using two
different metrics: 1) compressed layer size (CLS)—the format
a layer is stored in the registry or transferred to a client;
and 2) files in layer size (FLS)—the sum of the sizes of the
uncompressed files contained in the layer. Figure 3(a) shows
the CDF of the two metrics.
We see that 90% of the layers are smaller than 177 MB in
uncompressed format and smaller than 63 MB in compressed
format. Interestingly, about half of the layers are smaller than
4 MB, independent of the format. That means that the registry
stores a large number of small layers which do not benefit
from compression. To analyze the frequencies, we zoom into
the 0–128 MB range (see Figure 3(b)). More than 1 million
and 800,000 layers are smaller than 5 MB in compressed and
uncompressed format, respectively. Beyond that, the frequency
drops rapidly and we only see around 100,000 layers between
5 MB and 15 MB.

0 1 2 3 4 5 60
0.2
0.4
0.6
0.8
1
Image size (GB)
Cum
ulat
ive
imag
e pr
obab
ility
CompressedUncompressed
(a) CDF of images by size (GB)
0 256 512 768 1024 1280 15360.3
0.5
0.7
0.9
1
Image size (MB)
Cum
ulat
ive
imag
e pr
obab
ility
CompressedUncompressed
(b) CDF of images by size (MB)
Fig. 9. Image size distribution
0 10 20 30 40 500
0.2
0.4
0.6
0.8
1
Layer count in images
Cum
ulat
ive
imag
e pr
obab
ility
(a) CDF of layer count in images
0 20 40 60 80 100 1200
1
2
3
4
5
6x 10⁴
Layer count in images
Imag
e fre
quen
cy
(b) Histogram of layer count in im-ages
Fig. 10. Layer count
of the compressed image layers, and the sum of the sizes of
files contained in the image (FIS). Figure 9(a) and 9(b) show
the image size distributions at a coarse GB resolution and a
finer resolution only covering images smaller than 1.5 GB.
90% of the images have an uncompressed size less than
1.3 GB while compressed images are less than 0.48 GB. In
the median, this decreases to 94 MB and 17 MB, respectively.
The largest uncompressed image is 498 GB which is a Ubuntu-
based image. Figure 9 shows that the majority of uncom-
pressed images in Docker Hub are small which aligns with the
Docker philosophy to package software and distribute software
in containers but include only its necessary dependencies.
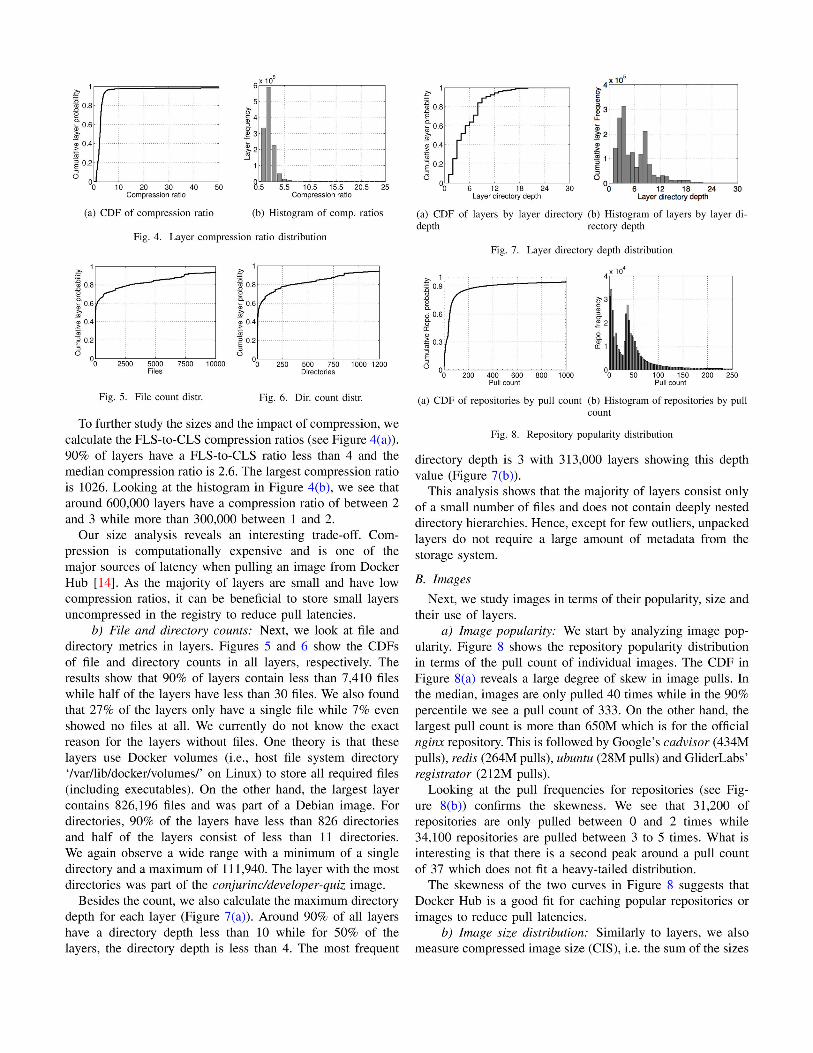
c) Layer count distribution: As discussed in §II-B, im-
ages consist of a set of layers. It is important to understand
the layer count of the images as previous work found that
the number of layers can impact the performance of I/O
operations [14]. Therefore, we count the number of layers per
image and plot the CDF (see Figure 10(a)) and layer count
frequencies (see Figure 10(b)) for all Docker Hub images.
The results show that 90% of the images have less than
18 layers while half of the images have less than 8 layers. 8
layers is also the most frequent layer count per image with
51,300 images consisting of exactly 8 layers. The maximum
layer count is 120 in the cfgarden/120-layer-image. We also
find that there are 7,060 images that consist of only a single
layer.
d) Directory and file count distribution: Lastly, we look
at directory (see Figure 11) and file counts (see Figure 12)
in images to determine if deploying images requires handling
of large amounts of metadata. Looking at directories, we see
that 90% of images have less than 7,344 directories while the
0 3000 6000 9000 120000
0.2
0.4
0.6
0.8
1
Directories
Cum
ulat
ive
imag
e pr
obab
ility
Fig. 11. CDF of images by directories
0 2 4 6 8
x 104
0
0.2
0.4
0.6
0.8
1
Files
Cum
ulat
ive
imag
e pr
obab
ility
Fig. 12. CDF of images by files
median is at 296. For files, 90% of images have less than
64,780 files with a median of 1,090.
This is consistent with our analysis of layer-based file and
directory counts and the number of layers per image. Again,
we conclude that most images do not require an extensive
amount of metadata when being deployed as file and directory
counts are low except for relatively rare outliers.
C. Files
After analyzing layers and images, we conducted a deeper
analysis on the files that are stored in containers. Specifically,
we characterize files in terms of size and type. Based on
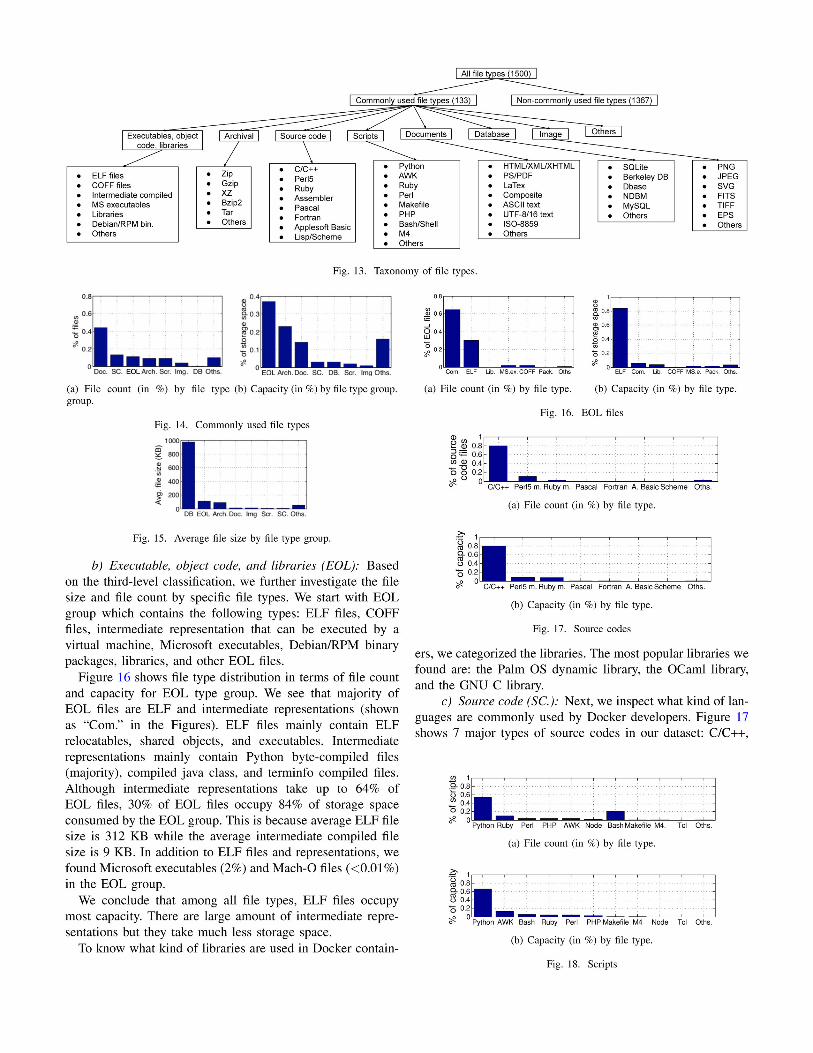
this characterization, we create a three-level classification
hierarchy as shown in Figure 13. At the highest level, we
created two categories: Commonly used file types and non-commonly used file types based on the total file size and file
count for each type. Totally, we got around 1,500 types after
analyzing our whole dataset. We found that only 133 file
types take up more than 7 GB individually and occupy the
most capacity (98.4%, with 166.8 TB) totally. We put these
133 file types into commonly used file type group and the
remaining files into non-commonly used file types. Our further
classification expands on the 98.4% commonly used file types.
At the second level of the hierarchy, we clustered commonly
used file types based on the major file format, usage, or
platform involved by each file type. We identified commonly
used file types relevant to EOL (executable, object code, andlibraries), source code, scripts, documents, archival, images,
databases, and others.
At the third level, we present the specific file types which
take a large percentage of storage space.
a) Common used file types: Figure 14 shows the 8 type
groups in terms of file count and capacity. 13%, 11%, and 9%
of files are source code, EOL, and scripts. EOL files occupy
the most capacity (37%).
We also see that 44% of files are document files such as
Microsoft office files, LaTeX files, etc. Only 4% of files are
image data files, e.g., PNG, JPEG, etc. Besides, we found a
small amount of video files like AVI, MPEG, etc.
To find how file type relate to file size, we calculated the
average file size by file type group as shown in Figure 15. We
see that Database files are much bigger (978.8 KB) than the
files within other type groups. The average size of EOL and
Archival files are around 100 KB.

ASCII HTML. UTF PDF LaTex ISO−X Com.doc Oths.0
0.20.40.60.8
1
% o
f doc
s
(a) File count (in %) by file type.
ASCII HTML UTF PDF ISO−X LaTex Com.doc. Oths.0
0.20.40.60.8
1
% o
f cap
acity
(b) Capacity (in %) by file type.
Fig. 19. Documents
Perl5 module, Ruby module, Pascal, Fortran, Applesoft basic,
and Lisp/Scheme. 80.3% of source files are C/C++ sources
which take about 80% of storage space within the source code
group. Perl5 module source code and Ruby module source
code have an almost similar percentage in terms of file count
(9% for Perl5 module source and 8% for Ruby module source)
but occupy different percentage in terms of capacity (11% for
Perl5 modules and 3% for Ruby modules).
d) Scripts (Scr.): Compared to the source code group, we
found a larger variety of scripting languages used. Our script
group includes Python scripts, AWK, Ruby, Perl, PHP, Make,
M4 macro processor, node, Tcl, Bash/shell, and others. We
see in Figure 18 that more than half of the scripts are Python-
based script (53.5%), which take around 66% of storage space
occupied by all scripts. Another commonly used script type
are Bash/shell scripts (20%) which only occupy 6% of storage
space. 10% of scripts are Ruby scripts which take around 5%
of storage space in the scripts group.
e) Documents (Doc.): As discussed before, 44% of files
are documents which take up to 14% of storage space. As
shown in Figure 19, we see that majority of documents are
text files including ASCII text (80%), UTF8/16 text (5%),
and ISO-8859 text (0.4%), which take up to 70% of storage
space occupied by documents. Note that these text files are rawtext files since we already filter the text based well-known file
types, such as scripts and source code.
Another observation is that XML/HTML/XHTML docu-
ments are the second most commonly used documents (13%),
which take up over 18% of storage space occupied by doc-
uments. Moreover, we found a small amount of PDF/PS
documents and LaTeX files in our dataset.
f) Archival (Arch.): The archival file group, takes up to
23% of capacity and is the second most commonly used file
type group. To figure out what kind of archival files are used in
Docker containers, we look at the archival file type distribution
as shown in Figure 20. We see that majority of archival files
are Zip/gzip files (96.3%) which take up to 70% of storage
space within the archival files, meaning that Zip/gzip files have
a lower average file size. We calculated the average file size
for each file type. The average file sizes are 67 KB, 199 KB,
466 KB, and 534 KB for Zip/gzip, bzip2, tar, and xz files,
Zip/GzipBzip2 XZ Tar Oths.0
0.20.40.60.8
1
% o
f arc
hiva
l
(a) File count (in %) by file type.
Zip/Gzip XZ Bzip2 Tar Oths.0
0.2
0.4
0.6
% o
f cap
acity
(b) Capacity (in %) by file type.
Fig. 20. Archival files
berkeley MySQL Dbase NDBM SQLite Oths.0
0.10.20.30.4
% o
f DB
. file
s
(a) File count (in %) by file type.
SQLite Berkeley Dbase MySQL NDBM Oths.0
0.2
0.4
0.6
% o
f cap
acity
(b) Capacity (in %) by file type.
Fig. 21. Databases
respectively.
g) Databases (DB.): Interestingly, we found a certain
amount of database related files in our dataset. As shown in
Figure 21, over half of the database related files are Berkely
DB (33%) and MySQL (30%) files, but these types take up
less than 40% of capacity occupied by database related files.
7% of database related files are SQLite DB files, which take
up over 57% of capacity.
This finding means that Docker developers run databases
inside Docker containers. The most frequently used databases
are Berkeley DB and MySQL, while the database using most
of capacity is SQLite. We currently do not know whether these
databases are mainly read-only or are also used for write-based
workloads. This might cause performance problems in some
situations due to the copy-on-write overhead of the storage
drivers [21].
h) Images (Img.): We also found some image data files,
such as PNG, JPEG, SVG, etc. in Docker container images. As
shown in Figure 22, more than half of image files are PNG
files (67%), which take about 45% of capacity occupied by
image files. The second most commonly used image files are
JPEG files which take up around 20% capacity.
V. DEDUPLICATION ANALYSIS
In this section, we investigate the potential for data reduc-
tion in the Docker registry by analyzing the efficacy of layer
sharing and file-level deduplication.
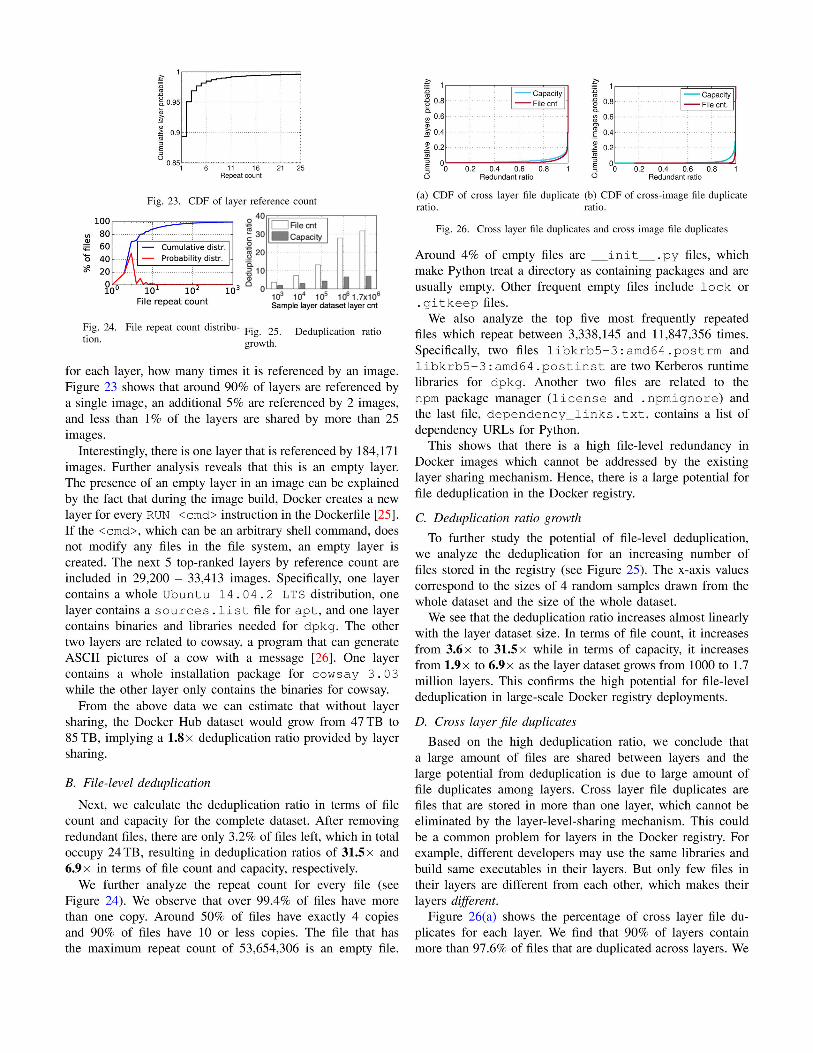
A. Layer sharing
Compared to other existing containerization frame-
works [23], [24], Docker supports the sharing of layers among
different images. To study the effectiveness of this approach,
we compute how many times each layer is referenced by
images. Specifically, we analyze all image manifests and count
PNG SVG JPEG FITS TIFF EPS Oths.0
0.2
0.4
0.6
% o
f Im
gs
(a) File count (in %) by file type.
PNG JPEG SVG FIT TIFF EPS Oths.0
0.2
0.40.5
% o
f cap
acity
(b) Capacity (in %) by file type.
Fig. 22. Images

EOL Arch.Doc. SC. DB. Scr. Img Oths.0
20
40
60C
apac
ity (T
B)
0.7
0.8
0.9
1
Ded
uplic
atio
n ra
tio
Fig. 27. Overall deduplication ratio.
ELF IP. PE. Pack. Libr. COFFOths.0
10
20
30
40
50
Cap
acity
(TB
)
0.5
0.7
0.9
1
Ded
uplic
atio
n ra
tio
Fig. 28. Deduplication results forEOL files.
C/C++ Perl5 m.Ruby m. Pascal Fortran A.Basic Scheme Oths.0
1
2
3
4
5
Cap
acity
(TB
)
0.5
0.6
0.7
0.8
0.9
1
Ded
uplic
atio
n ra
tio
Fig. 29. Deduplication results for source codes.
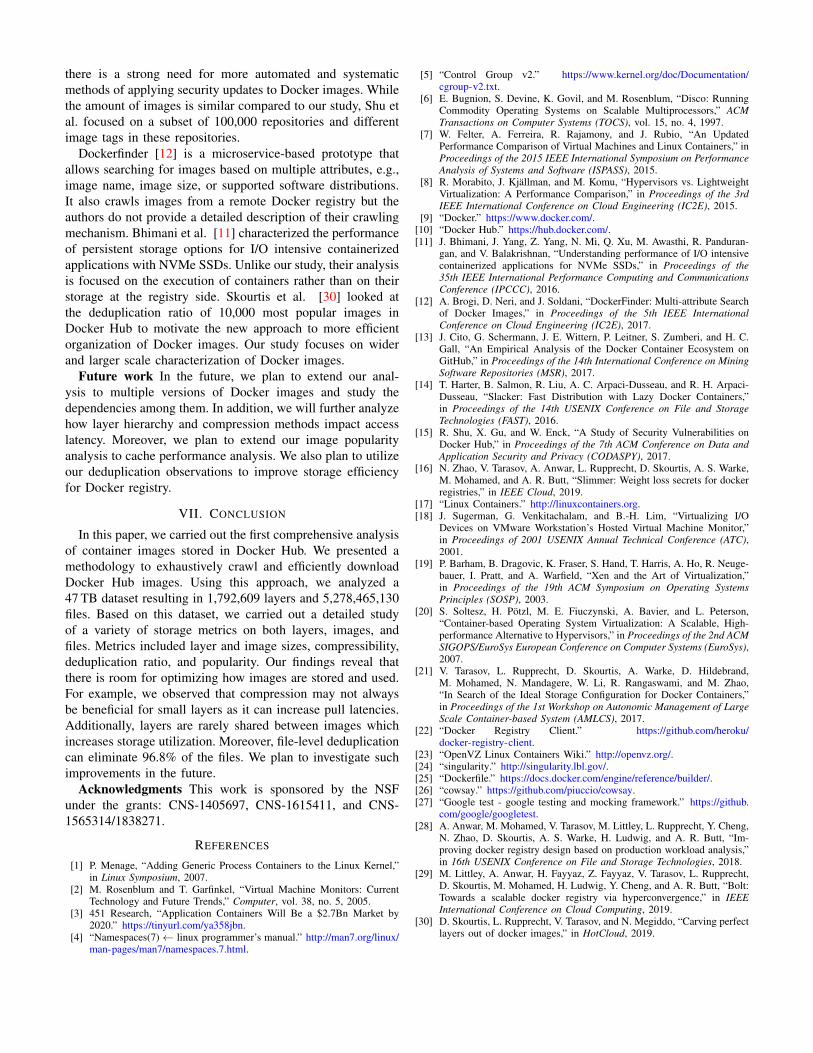
also calculate the percentage of files that are duplicated across
images. As shown in Figure 26(b), 90% of images contain
more than 99.4% of files that are duplicated across images,
indicating that majority of files are duplicated across different
images and layers.
E. Deduplication by file types
To understand what are the file duplicates and why there are
so many file duplicates, we look at the deduplication results
from the perspective of file types. In this section, we present
the deduplication results for common file types that occupy
the most capacity.
Figure 27 shows deduplication results for the following
type groups: EOL, archival, documents, source code, scripts,
images, and databases. Note that the y-axes show the capacity
occupied by different type groups and their deduplication
ratios.
The overall deduplication ratio is 85.69%, and most of the
type groups have a comparable ratio. For example, 86% of
EOL files, which include executables, object files, and li-
braries, can be deduplicated at file-level. Source codes, scripts,
and documents have the highest deduplication ratio (96.8% for
source codes, 98% for scripts, and 92% for documents), which
means that Docker developers are more prone to duplicate
source code, scripts, and documents.
Next, we see that EOL files, archival, and images have a
similar deduplication ratio of around 86%. Compared to other
type groups, the redundant EOL files and archival files occupy
over half of the capacity (51.4%). Database related files have
the lowest deduplication ratio (76%), which contributes little
to the overall savings.
a) Executable, object code, and libraries (EOL): We
further calculate the deduplication ratio for specific file types
in each common type group. We start from the EOL group
since it occupies the most capacity and contributes a lot to the
overall savings after deduplication.
Figure 28 shows the deduplication results for EOL files. We
see that ELF files, intermediate representations, and PE files
have the highest deduplication ratio (around 87%). Especially,
the redundant ELF files occupy the most capacity (73.4%).
Libraries and COFF files have the lowest deduplication ratio
of 53.5% and 61% respectively.
We also calculate the deduplication ratio for each intermedi-
ate representation and libraries. We found that all the interme-
diate representations have a high deduplication ratio (greater
than 77%). Especially, the redundant Python byte-compiled
code take up to 67% of capacity occupied by intermediate
representations. Although the overall deduplication ratio of
the library group is lower, we observed that the GNU C/C++
library and the Palm OS dynamic library have a deduplication
ratio of over 90%.
b) Source code (SC.): As discussed, Docker developers
are more prone to replicate source code. To find out which
kind of source codes are replicated frequently, we study
deduplication on 7 common languages as shown in Figure 29.
We see that all the languages have a high deduplication ratio
of over 90% except for Lisp/Scheme. In particular, redundant
C/C++ source files take up over 77% of capacity occupied
by source code files. To find out why there are so many
duplicate C/C++ source files, we inspect those files and find
a frequently reused sources related to Google Test [27], a
cross-platform C++ test framework available on GitHub [27].
Interestingly, we also observe that there are a large number
of repositories related to Google Test but there is no official
repository. We suspect that many developers replicate open
source code from external public repositories, such as GitHub,
and store it in their container images. This could also explain
why there are so many shared source code files across different
images. Considering that Docker Hub allows developer to
automatically build images from source code in external public
repositories and automatically push the built image to their
Docker repositories, we believe that replicated source code in
different images is a common case in the Docker Hub registry.
VI. RELATED WORK
Due to its increasing popularity, Docker has recently
received increased attention from the research community.
Slacker [14] studied 57 images from Docker Hub for a variety
of metrics. The authors used the results from their study
to derive a benchmark to evaluate the push, pull, and run
performance of Docker graph drivers based on the studied
images. Compared to Slacker, our analysis focuses on the
entire Docker Hub dataset. Anwar et al. [28] propose a new
Docker registry design that employs a two-tier registry cache
hierarchy. Bolt [29] presents a hyperconverged Docker registry
to improve latency and throughput. However, both of these
designs are based on workload traces and do not consider
content and storage properties of images. Cito et al. [13]
conducted an empirical study for characterizing the Docker
ecosystem with a focus on prevalent quality issues, and the
evolution of Docker files based on a dataset of 70,000 Docker
files. However, their study did not focus on actual image data.
Shu et al. [15] studied the security vulnerabilities in Docker
Hub images based on a dataset of 356,218 images and found
there is a strong need for more automated and systematic
methods of applying security updates to Docker images. While
the amount of images is similar compared to our study, Shu et
al. focused on a subset of 100,000 repositories and different
image tags in these repositories.
Dockerfinder [12] is a microservice-based prototype that
allows searching for images based on multiple attributes, e.g.,
image name, image size, or supported software distributions.
It also crawls images from a remote Docker registry but the
authors do not provide a detailed description of their crawling
mechanism. Bhimani et al. [11] characterized the performance
of persistent storage options for I/O intensive containerized
applications with NVMe SSDs. Unlike our study, their analysis
is focused on the execution of containers rather than on their
storage at the registry side. Skourtis et al. [30] looked at
the deduplication ratio of 10,000 most popular images in
Docker Hub to motivate the new approach to more efficient
organization of Docker images. Our study focuses on wider
and larger scale characterization of Docker images.
Future work In the future, we plan to extend our anal-
ysis to multiple versions of Docker images and study the
dependencies among them. In addition, we will further analyze
how layer hierarchy and compression methods impact access
latency. Moreover, we plan to extend our image popularity
analysis to cache performance analysis. We also plan to utilize
our deduplication observations to improve storage efficiency
for Docker registry.
VII. CONCLUSION
In this paper, we carried out the first comprehensive analysis
of container images stored in Docker Hub. We presented a
methodology to exhaustively crawl and efficiently download
Docker Hub images. Using this approach, we analyzed a
47 TB dataset resulting in 1,792,609 layers and 5,278,465,130
files. Based on this dataset, we carried out a detailed study
of a variety of storage metrics on both layers, images, and
files. Metrics included layer and image sizes, compressibility,
deduplication ratio, and popularity. Our findings reveal that
there is room for optimizing how images are stored and used.
For example, we observed that compression may not always
be beneficial for small layers as it can increase pull latencies.
Additionally, layers are rarely shared between images which
increases storage utilization. Moreover, file-level deduplication
can eliminate 96.8% of the files. We plan to investigate such
improvements in the future.
Acknowledgments This work is sponsored by the NSF
under the grants: CNS-1405697, CNS-1615411, and CNS-
1565314/1838271.
REFERENCES
[1] P. Menage, “Adding Generic Process Containers to the Linux Kernel,”in Linux Symposium, 2007.
[2] M. Rosenblum and T. Garfinkel, “Virtual Machine Monitors: CurrentTechnology and Future Trends,” Computer, vol. 38, no. 5, 2005.
[3] 451 Research, “Application Containers Will Be a $2.7Bn Market by2020.” https://tinyurl.com/ya358jbn.
[4] “Namespaces(7)← linux programmer’s manual.” http://man7.org/linux/man-pages/man7/namespaces.7.html.
[5] “Control Group v2.” https://www.kernel.org/doc/Documentation/cgroup-v2.txt.
[6] E. Bugnion, S. Devine, K. Govil, and M. Rosenblum, “Disco: RunningCommodity Operating Systems on Scalable Multiprocessors,” ACMTransactions on Computer Systems (TOCS), vol. 15, no. 4, 1997.
[7] W. Felter, A. Ferreira, R. Rajamony, and J. Rubio, “An UpdatedPerformance Comparison of Virtual Machines and Linux Containers,” inProceedings of the 2015 IEEE International Symposium on PerformanceAnalysis of Systems and Software (ISPASS), 2015.
[8] R. Morabito, J. Kjallman, and M. Komu, “Hypervisors vs. LightweightVirtualization: A Performance Comparison,” in Proceedings of the 3rdIEEE International Conference on Cloud Engineering (IC2E), 2015.
[9] “Docker.” https://www.docker.com/.[10] “Docker Hub.” https://hub.docker.com/.[11] J. Bhimani, J. Yang, Z. Yang, N. Mi, Q. Xu, M. Awasthi, R. Panduran-
gan, and V. Balakrishnan, “Understanding performance of I/O intensivecontainerized applications for NVMe SSDs,” in Proceedings of the35th IEEE International Performance Computing and CommunicationsConference (IPCCC), 2016.
[12] A. Brogi, D. Neri, and J. Soldani, “DockerFinder: Multi-attribute Searchof Docker Images,” in Proceedings of the 5th IEEE InternationalConference on Cloud Engineering (IC2E), 2017.
[13] J. Cito, G. Schermann, J. E. Wittern, P. Leitner, S. Zumberi, and H. C.Gall, “An Empirical Analysis of the Docker Container Ecosystem onGitHub,” in Proceedings of the 14th International Conference on MiningSoftware Repositories (MSR), 2017.
[14] T. Harter, B. Salmon, R. Liu, A. C. Arpaci-Dusseau, and R. H. Arpaci-Dusseau, “Slacker: Fast Distribution with Lazy Docker Containers,”in Proceedings of the 14th USENIX Conference on File and StorageTechnologies (FAST), 2016.
[15] R. Shu, X. Gu, and W. Enck, “A Study of Security Vulnerabilities onDocker Hub,” in Proceedings of the 7th ACM Conference on Data andApplication Security and Privacy (CODASPY), 2017.
[16] N. Zhao, V. Tarasov, A. Anwar, L. Rupprecht, D. Skourtis, A. S. Warke,M. Mohamed, and A. R. Butt, “Slimmer: Weight loss secrets for dockerregistries,” in IEEE Cloud, 2019.
[17] “Linux Containers.” http://linuxcontainers.org.[18] J. Sugerman, G. Venkitachalam, and B.-H. Lim, “Virtualizing I/O
Devices on VMware Workstation’s Hosted Virtual Machine Monitor,”in Proceedings of 2001 USENIX Annual Technical Conference (ATC),2001.
[19] P. Barham, B. Dragovic, K. Fraser, S. Hand, T. Harris, A. Ho, R. Neuge-bauer, I. Pratt, and A. Warfield, “Xen and the Art of Virtualization,”in Proceedings of the 19th ACM Symposium on Operating SystemsPrinciples (SOSP), 2003.
[20] S. Soltesz, H. Potzl, M. E. Fiuczynski, A. Bavier, and L. Peterson,“Container-based Operating System Virtualization: A Scalable, High-performance Alternative to Hypervisors,” in Proceedings of the 2nd ACMSIGOPS/EuroSys European Conference on Computer Systems (EuroSys),2007.
[21] V. Tarasov, L. Rupprecht, D. Skourtis, A. Warke, D. Hildebrand,M. Mohamed, N. Mandagere, W. Li, R. Rangaswami, and M. Zhao,“In Search of the Ideal Storage Configuration for Docker Containers,”in Proceedings of the 1st Workshop on Autonomic Management of LargeScale Container-based System (AMLCS), 2017.
[22] “Docker Registry Client.” https://github.com/heroku/docker-registry-client.
[23] “OpenVZ Linux Containers Wiki.” http://openvz.org/.[24] “singularity.” http://singularity.lbl.gov/.[25] “Dockerfile.” https://docs.docker.com/engine/reference/builder/.[26] “cowsay.” https://github.com/piuccio/cowsay.[27] “Google test - google testing and mocking framework.” https://github.
com/google/googletest.[28] A. Anwar, M. Mohamed, V. Tarasov, M. Littley, L. Rupprecht, Y. Cheng,
N. Zhao, D. Skourtis, A. S. Warke, H. Ludwig, and A. R. Butt, “Im-proving docker registry design based on production workload analysis,”in 16th USENIX Conference on File and Storage Technologies, 2018.
[29] M. Littley, A. Anwar, H. Fayyaz, Z. Fayyaz, V. Tarasov, L. Rupprecht,D. Skourtis, M. Mohamed, H. Ludwig, Y. Cheng, and A. R. Butt, “Bolt:Towards a scalable docker registry via hyperconvergence,” in IEEEInternational Conference on Cloud Computing, 2019.
[30] D. Skourtis, L. Rupprecht, V. Tarasov, and N. Megiddo, “Carving perfectlayers out of docker images,” in HotCloud, 2019.


![Improving Docker Registry Design based on Production ... › ~butta › docs › fast2018-dockerAnalysis.pdf · Docker Hub [5], IBM Cloud container registry [12], or Artifactory [1].](https://static.fdocuments.in/doc/165x107/60c40e4e788a4b48945651df/improving-docker-registry-design-based-on-production-a-butta-a-docs-a.jpg)
![Chapter T:VDocker Introduction Architecture Docker Images (continued) q Ready-to-use images can be loaded from [Docker Hub]. Docker pulls images automatically from Docker Hub first](https://static.fdocuments.in/doc/165x107/5f05d4487e708231d414eaa9/-chapter-tv-docker-introduction-architecture-docker-images-continued-q-ready-to-use.jpg)