Large eddy simulations and stereoscopic particle image …jos/pbl/ces_marcosles_corrpr.pdf · The...
9
ARTICLE IN PRESS Chemical Engineering Science ( ) -- Contents lists available at ScienceDirect Chemical Engineering Science journal homepage: www.elsevier.com/locate/ces Large eddy simulations and stereoscopic particle image velocimetry measurements in a scraped heat exchanger crystallizer geometry M. Rodriguez Pascual a, ∗ , F. Ravelet b , R. Delfos a , J.J. Derksen c , G.J. Witkamp a a Process and Energy Department, Faculty of Mechanical Engineering, Delft University of Technology, The Netherlands b lnstitut de Mécanique des Fluides de Toulouse, France c Chemical and Materials Engineering Department, University of Alberta, Canada ARTICLE INFO ABSTRACT Article history: Received 25 September 2008 Received in revised form 23 December 2008 Accepted 12 January 2009 Keywords: Fluid mechanics Crystallization Scaling Heat transfer Lattice-Boltzmann method Scraped heat exchanger crystallizers Chemical reactors The transport phenomena in scraped heat exchanger (HE) crystallizers are critical for the process perfor- mance. Fluid flow and turbulence close to the HE surface as generated by stirring elements and scraper blades are crucial in this respect as they aim at avoiding an insulating scale layer on the HE surface. For this reason we performed large-eddy simulations of the turbulent flow (at a Reynolds number of 5 × 10 4 ) in a typical cooling crystallizer geometry with a focus on the bottom region where the heat exchanging surface was located. The flow simulations were validated with stereoscopic PIV experiments performed higher up in the crystallizer. Water at a constant temperature was the working fluid in the experiments as well as in the simulations. For reasons of optical accessibility being hindered by the scrapers, the experiments could not be done near the heat exchanging surface. The flow structures as revealed by the large-eddy simulations could explain the local occurrence of scaling on an evenly cooled HE surface, and its irreproducibility caused by instantaneous cold spots. © 2009 Elsevier Ltd. All rights reserved. 1. Introduction In several types of cooling crystallization processes, solutions or melts are brought by the action of heat exchangers (HEs) into su- persaturated regions where crystals will form. In industrial continu- ous processes, where solution is constantly fed into the crystallizer, control and stability of the bulk solution temperature is mandatory. For this reason a degree of turbulence inside the crystallizer is nec- essary to achieve good mixing of the whole solution, and with this aim stirrers are commonly used. Several computational and experi- mental studies of fluid flow in stirred tanks have been done in the past with a view to optimizing mixing processes motivated by their general importance in the chemical process industries (Yianneskis et al., 1987; Sch ¨ afer et al., 1998; Derksen et al., 1999; Derksen and Van den Akker, 1999). In cooling crystallization this turbulent mixing determines the heat transfer rates that are directly responsible for the production rates, while the residence time in the crystallizer de- termines size and quality of the crystals. Particle flow interactions re- late to solid separation, attrition and agglomeration processes. Stud- ies on the influence of the flow on the heat and mass transfer and particle–flow interactions are of major interest but not an easy task ∗ Corresponding author. Tel.: +0031612686185; fax: +0031152786975. E-mail address: [email protected] (M. Rodriguez Pascual). 0009-2509/$ - see front matter © 2009 Elsevier Ltd. All rights reserved. doi:10.1016/j.ces.2009.01.034 to perform due to the complexities related to turbulence and the wide range of length and time-scales involved. To bring the solution to the desired supersaturation HEs are typi- cally in direct contact with the solution. The thermal boundary layer near the HE surface depends on the crystallizer flow characteristics. Because of the higher supersaturation at the HE surface the nucle- ation and growth rates of the crystals are faster than in the bulk of the solution. This situation is responsible for the formation of a scale layer of crystals on the HE surface in several cases of cooling crystal- lization from a solution and (in particular) from a melt, including ice crystallization from aqueous solutions. This scale layer reduces heat transfer, thus affecting the stability and efficiency of the crystalliza- tion process. To avoid this scale layer formation, it is common to use mechanical actions such as scraping. Depending on the composition of the solution and the characteristics of the mechanical scraping action (velocity, scraper shape and applied force), a maximum tem- perature difference between the solution and the HE surface can be maintained without the occurrence of scaling. In any case, to pre- vent scaling the HE surface temperature also has to be as uniform as possible, avoiding cold spots where scaling will start. A laboratory scale scraped HE crystallizer was specifically de- signed to study the ice scaling behaviour of aqueous electrolyte solutions. The crystallizer was designed to operate in a continuous mode in order to control the solution temperature with the feed flow. In this way a constant difference between surface and solution Please cite this article as: Rodriguez Pascual, M., et al., Large eddy simulations and stereoscopic particle image velocimetry measurements in a scraped heat exchanger crystallizer geometry. Chemical Engineering Science (2009), doi: 10.1016/j.ces.2009.01.034
Transcript of Large eddy simulations and stereoscopic particle image …jos/pbl/ces_marcosles_corrpr.pdf · The...
ARTICLE IN PRESSChemical Engineering Science ( ) --
Contents lists available at ScienceDirect
Chemical Engineering Science
journal homepage: www.e lsev ier .com/ locate /ces
Large eddy simulations and stereoscopic particle image velocimetrymeasurements ina scraped heat exchanger crystallizer geometry
M. Rodriguez Pascuala,∗, F. Raveletb, R. Delfosa, J.J. Derksenc, G.J. Witkampa
aProcess and Energy Department, Faculty of Mechanical Engineering, Delft University of Technology, The Netherlandsblnstitut de Mécanique des Fluides de Toulouse, FrancecChemical and Materials Engineering Department, University of Alberta, Canada
A R T I C L E I N F O A B S T R A C T
Article history:Received 25 September 2008Received in revised form 23 December 2008Accepted 12 January 2009
Keywords:Fluid mechanicsCrystallizationScalingHeat transferLattice-Boltzmann methodScraped heat exchanger crystallizersChemical reactors
The transport phenomena in scraped heat exchanger (HE) crystallizers are critical for the process perfor-mance. Fluid flow and turbulence close to the HE surface as generated by stirring elements and scraperblades are crucial in this respect as they aim at avoiding an insulating scale layer on the HE surface. Forthis reason we performed large-eddy simulations of the turbulent flow (at a Reynolds number of 5×10⁴)in a typical cooling crystallizer geometry with a focus on the bottom region where the heat exchangingsurface was located. The flow simulations were validated with stereoscopic PIV experiments performedhigher up in the crystallizer. Water at a constant temperature was the working fluid in the experimentsas well as in the simulations. For reasons of optical accessibility being hindered by the scrapers, theexperiments could not be done near the heat exchanging surface. The flow structures as revealed by thelarge-eddy simulations could explain the local occurrence of scaling on an evenly cooled HE surface, andits irreproducibility caused by instantaneous cold spots.
© 2009 Elsevier Ltd. All rights reserved.
1. Introduction
In several types of cooling crystallization processes, solutions ormelts are brought by the action of heat exchangers (HEs) into su-persaturated regions where crystals will form. In industrial continu-ous processes, where solution is constantly fed into the crystallizer,control and stability of the bulk solution temperature is mandatory.For this reason a degree of turbulence inside the crystallizer is nec-essary to achieve good mixing of the whole solution, and with thisaim stirrers are commonly used. Several computational and experi-mental studies of fluid flow in stirred tanks have been done in thepast with a view to optimizing mixing processes motivated by theirgeneral importance in the chemical process industries (Yianneskiset al., 1987; Schafer et al., 1998; Derksen et al., 1999; Derksen andVan den Akker, 1999). In cooling crystallization this turbulent mixingdetermines the heat transfer rates that are directly responsible forthe production rates, while the residence time in the crystallizer de-termines size and quality of the crystals. Particle flow interactions re-late to solid separation, attrition and agglomeration processes. Stud-ies on the influence of the flow on the heat and mass transfer andparticle–flow interactions are of major interest but not an easy task
∗ Corresponding author. Tel.: +0031612686185; fax: +0031152786975.E-mail address: [email protected] (M. Rodriguez Pascual).
0009-2509/$ - see front matter © 2009 Elsevier Ltd. All rights reserved.doi:10.1016/j.ces.2009.01.034
to perform due to the complexities related to turbulence and thewide range of length and time-scales involved.
To bring the solution to the desired supersaturation HEs are typi-cally in direct contact with the solution. The thermal boundary layernear the HE surface depends on the crystallizer flow characteristics.Because of the higher supersaturation at the HE surface the nucle-ation and growth rates of the crystals are faster than in the bulk ofthe solution. This situation is responsible for the formation of a scalelayer of crystals on the HE surface in several cases of cooling crystal-lization from a solution and (in particular) from a melt, including icecrystallization from aqueous solutions. This scale layer reduces heattransfer, thus affecting the stability and efficiency of the crystalliza-tion process. To avoid this scale layer formation, it is common to usemechanical actions such as scraping. Depending on the compositionof the solution and the characteristics of the mechanical scrapingaction (velocity, scraper shape and applied force), a maximum tem-perature difference between the solution and the HE surface can bemaintained without the occurrence of scaling. In any case, to pre-vent scaling the HE surface temperature also has to be as uniformas possible, avoiding cold spots where scaling will start.
A laboratory scale scraped HE crystallizer was specifically de-signed to study the ice scaling behaviour of aqueous electrolytesolutions. The crystallizer was designed to operate in a continuousmode in order to control the solution temperature with the feedflow. In this way a constant difference between surface and solution
Please cite this article as: Rodriguez Pascual, M., et al., Large eddy simulations and stereoscopic particle image velocimetry measurements in a scrapedheat exchanger crystallizer geometry. Chemical Engineering Science (2009), doi: 10.1016/j.ces.2009.01.034

2 M. Rodriguez Pascual et al. / Chemical Engineering Science ( ) --
ARTICLE IN PRESS
Fig. 1. Radial distribution of temperature T(r) and heat flux Jq(r) across the HE surface (between scrapers). Ttlc is the measured temperature by the thermo chromic liquidcrystal sheet. Tsol and The are the temperatures of the solution and the heat exchanger, respectively. Note: temperatures above 36 ◦C are approximated (being outside theproper calibration range) (Rodriguez Pascual et al., 2008).
temperatures could be maintained, and the maximum temperaturedifference achievable with efficient removal of the ice scaling layeron the HE surface could be measured. Further details of the setupand operation of this crystallizer can be found in (Rodriguez Pascualet al., 2008; Vaessen et al., 2002; Pronk et al., 2005).
The location where the ice scaling starts as well as the lack ofreproducibility and spread in experimental results encountered inprevious studies prompted us to investigate the local temperatureand heat flux distribution across the HE surface. These HE surfacetemperatures were measured by using a thermo chromatic liquidcrystal (TLC) sheet placed directly upon the HE surface in the samecrystallizer geometry used here for the simulations.
To avoid hysteresis effects of the TLC due to the working rangewe decided to study the HE surface temperature in an inverted ex-periment, where instead of cooling down of a solution from a tem-perature above the working range, we heated up pure water to about32 ◦C. In this way exposure of the TLC sheet to high temperatureswas avoided. So the solution was kept at a temperature of about32 ◦C, and was heated through the HE surface with a thermal liquidof around 41.5 ◦C, while the feed flow was about 28 ◦C.
The solution temperature was measured with two sensors at topand bottom of the crystallizer, at 4.5 and 22 cm from the HE surface,respectively.
The difference between the in and outgoing thermal liquid in thecrystallizer was about 0.5 ◦C, and the difference between top andbottom solution in the crystallizer about 0.1 ◦C. After this stationarysituation was obtained (monitored using thermometers), the imag-ing was started. Further details of the experimental procedure areexplained in Rodriguez Pascual et al. (2008). Results are shown inFig. 1.
The result shows that, even though the process as a whole is sta-tionary, the HE surface temperature is far from uniform, but ratheraxial symmetric with a strong dependence on the radial distance tothe centre (r). Near the shaft and close to the outer wall the heat fluxbetween HE and solution, reflected by the calculated heat flux Jq(r),is lower by a factor of at least five compared to halfway the radius.So the question why Jq(r) varies so much over the scraped HE platehad to be answered. Since the cooling of the HE plate from the HE-coolant fluid side did not show local variations, the differences inlocal heat flux could only be caused by the flow field inside the crys-tallizer itself. The accessible part of the flow field above the scrapersand below the stirrer was therefore investigated using stereoscopicparticle image velocimetry, (3C-PIV); further details can be found in
(Rodriguez Pascual et al., 2008). The average axial, radial and tan-gential velocities of the flow field in this middle section of the crys-tallizer were derived from these PIV images.
These measurements revealed that, besides the rotational flowcaused by scrapers and stirrer, there is also a strong secondary flow,provoked by the rotating geometries. It was, however, not feasibleto measure the velocities in the lower scraper region just above theHE surface where the actual scaling occurs because the revolvingscrapers hindered the optical accessibility required for PIV. For amore detailed analysis of the flow field in this regionwewere obligedto rely on information obtained by modelling the flow field.
To model the flow large-eddy simulation (LES) in a lattice-Boltzmann scheme for discretizing the Navier–Stokes equationswas used. The major reasons for employing a lattice-Boltzmanndiscretization scheme are its almost full locality of operations, itscomputational efficiency (in terms of floating-point operations perlattice site and time step), and its ability to simulate flows in com-plex geometries. An interface model to represent the revolvingparts of the geometry was avoided by modelling of the movinggeometry with an adaptive force field technique. This approach asapplied to turbulent mixing tank flows has been experimentally val-idated extensively (Derksen et al., 1999; Derksen, 2001), includingassessments of grid effects.
The LES methodology has proven to be a powerful tool to studyand visualize stirred tank flows, because it accounts for both theunsteady and the periodic behaviour of these flows, and it can effec-tively be employed to explicitly resolve phenomena directly relatedto moving boundaries. Results of the single-phase lattice-BoltzmannLES code applied to stirred tank flow have been extensively com-pared to phase-averaged and phase-resolved experimental data(Derksen et al., 1999; Derksen, 2001).
The computational results of the flow field for the scraped HEcrystallizer geometry used in this study are presented in this paper.To validate the correctness of the calculated flow field characteristicsthe results for the middle section of the crystallizer were comparedwith the previous results from the 3C-PIV measurements.
2. Simulation setup
The Navier–Stokes equations governing the flow in the stirredtank were discretized according to the lattice-Boltzmann method.This is an inherently parallel and efficient numerical scheme for com-putational transport physics (see e.g. Succi, 2001 for an overview).
Please cite this article as: Rodriguez Pascual, M., et al., Large eddy simulations and stereoscopic particle image velocimetry measurements in a scrapedheat exchanger crystallizer geometry. Chemical Engineering Science (2009), doi: 10.1016/j.ces.2009.01.034

ARTICLE IN PRESSM. Rodriguez Pascual et al. / Chemical Engineering Science ( ) -- 3
Fig. 2. (a) Side view of the crystallizer, (b) top view of the crystallizer and (c) sideway view of the real scraper geometry.
The strong turbulence generated by the impeller and scrapers pro-hibits direct numerical simulation: the computational effort for re-solving all length and time-scales would be too large.
In LES only the large scales are resolved explicitly; the ratio-nale behind it is that the small scales behave more universally andare therefore more prone to modelling than the large geometry-dependent scales (Lesieur and Métais, 1996). Modelling instead ofresolving the small scales alleviates the computational burden. Formodelling of the small scales the standard Smagorinsky subgridscale model was applied. A value of cS = 0.12 was adopted as theSmagorinsky constant, which is within the range of values commonlyused in shear-driven turbulence.
The stirred-scraped crystallizer configuration consists of a cylin-drical, flat-bottomed tank with a diameter of 240mm and a heightof 300mm. The flat bottom area of the crystallizer that acts as theheat-exchanging surface is scraped by a set of four rotating scraperblades with a diameter of 198mm that is driven by a vertical shaft. Inthe experimental system there is no gap between the scraper bladesand the surface, because if there were a gap an ice scale layer couldbe formed that is not immediately scraped away. In the LES com-putations there is a small gap (1 grid spacing = 1mm) to be able todeal with the discontinuous velocity (zero at the bottom; �r at thescraper). Halfway the shaft a 45◦ pitch blade turbine with a diameterof 100mm is installed to keep the slurry homogeneously mixed. Thegeometry is defined in Fig. 2a and b. The geometry of the scraper inthe simulations closely mimics the experimental geometry (Fig. 2c).
The uniform, cubic grid inherent to most of the lattice-Boltzmannformulations comprised 1.8×10⁷ nodes. In terms of spatial resolution:the linear size of a cubic lattice cell amounted to approximately1mm. In the light of earlier studies (Derksen, 2001) this is consideredadequate resolution. The time step in the LES was such that oneimpeller revolution took 4200 time steps.
Instead of letting the impeller and scrapers revolve in the tank, thespecific tank-impeller geometry used here is such that we also couldhave taken a static geometry in a rotating reference frame. Given thegood and validated performance of the computer code for rotatingimpellers, and the addition of static internals in future simulations,we decided to perform the simulations in a static reference framewith revolving impeller and scrapers.
The Reynolds number that fully determines this single-phase flowis defined as Re = ND2/� with N the impeller speed in rps, D thediameter of the scraper and � the kinematic viscosity of the workingfluid. The continuous phase was water with a density = 103 kg/m3
and, at the constant temperature of the 3C-PIV experiment of 20 ◦C,� = 10−6 m2/s. The scraper and impeller were set to rotate at a speedof 77 rpm corresponding to Re = 5×10⁴.
The LES is started from a zero velocity field. In the start-up phaseof the flow we monitor the total kinetic energy in the tank. Oncethis has stabilized we start collecting flow data for later statisticalanalysis such as average velocity and turbulent kinetic energy fields.
3. Results and discussion
3.1. The overall flow field in the crystallizer
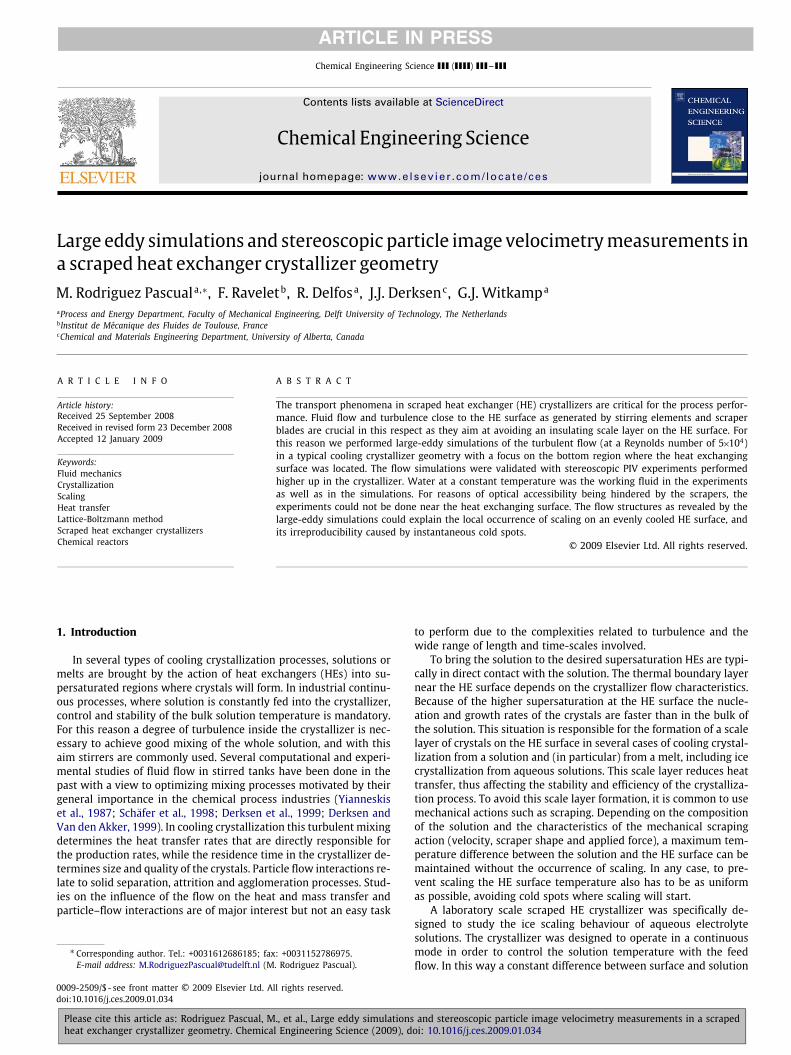
The flow field as measured by 3C-PIV for the middle section ofthe crystallizer (Rodriguez Pascual et al., 2008) qualitatively explainsthe heat flux distribution at the HE surface as obtained from the(TLC) measured surface temperatures. In the core around the shaftthe heat flux is low because of the absence of a radial and axial meanflow. From about 60mm from the shaft, there is a secondary flow inthe radial axial plane. From 60 to 100mm the fluid flows downward,and from 105mm to the wall the fluid flows upwards (Fig. 3).
In Fig. 4 the dash–dotted line represents the tangential velocityof the scraper. The solid line representing the time and axially aver-aged tangential flow measured by the PIV, suggests that the solutionis in solid body rotation up to about 40mm from the shaft. This un-wanted behaviour of the flow prevents proper mixing of the rotatingsolution with the bulk, and causes low heat flux at the bottom ofthis region. When moving radially outward, the flow tends to con-serve its angular momentum; hence the tangential velocity quicklydecreases (in a frictionless flow this would lead to a `potential vortex'(Batchelor, 1967). As a simplified physical model of the flow, wefitted the measured tangential velocity profile with the Oseen vor-tex solution (Batchelor, 1967), which gradually transits from a solidbody rotation in the inner region to a free vortex flow in the outerthe region. The transition takes place at approximately r = 40mm, asshown in Fig. 4. The measured tangential flow matches qualitativelywith the vortex flow in the Oseen model.
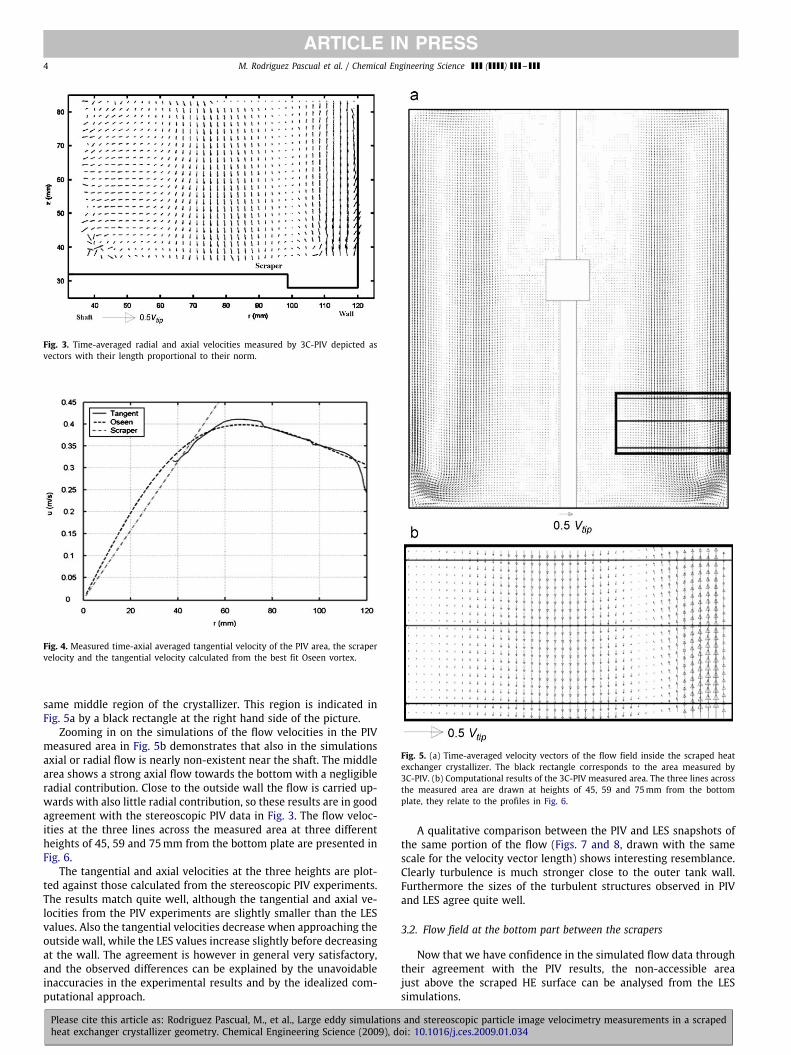
From the measured flow field we cannot explain the tempera-ture distribution profile at the HE surface, although we expect thatthis distribution should be related to the flow field close to the HEsurface. So for a more detailed explanation of the distribution theflow pattern between the scrapers just above the surface had to bestudied. Due to the problematic measuring access created by thepresence of the rotating scrapers we have for this purpose to rely onCFD simulations. Fig. 5a shows the axial and radial time-averagedvelocities for the whole tank as obtained from the LES computationalsimulations, after steady state was achieved and therefore the totalkinetic energy was constant, plotted as velocity vectors. To validatethe computational results we compare the simulated flow velocitieswith the velocities calculated from the 3C-PIV measurements in the
Please cite this article as: Rodriguez Pascual, M., et al., Large eddy simulations and stereoscopic particle image velocimetry measurements in a scrapedheat exchanger crystallizer geometry. Chemical Engineering Science (2009), doi: 10.1016/j.ces.2009.01.034
4 M. Rodriguez Pascual et al. / Chemical Engineering Science ( ) --
ARTICLE IN PRESS
Fig. 3. Time-averaged radial and axial velocities measured by 3C-PIV depicted asvectors with their length proportional to their norm.
Fig. 4. Measured time-axial averaged tangential velocity of the PIV area, the scrapervelocity and the tangential velocity calculated from the best fit Oseen vortex.
same middle region of the crystallizer. This region is indicated inFig. 5a by a black rectangle at the right hand side of the picture.
Zooming in on the simulations of the flow velocities in the PIVmeasured area in Fig. 5b demonstrates that also in the simulationsaxial or radial flow is nearly non-existent near the shaft. The middlearea shows a strong axial flow towards the bottom with a negligibleradial contribution. Close to the outside wall the flow is carried up-wards with also little radial contribution, so these results are in goodagreement with the stereoscopic PIV data in Fig. 3. The flow veloc-ities at the three lines across the measured area at three differentheights of 45, 59 and 75mm from the bottom plate are presented inFig. 6.
The tangential and axial velocities at the three heights are plot-ted against those calculated from the stereoscopic PIV experiments.The results match quite well, although the tangential and axial ve-locities from the PIV experiments are slightly smaller than the LESvalues. Also the tangential velocities decrease when approaching theoutside wall, while the LES values increase slightly before decreasingat the wall. The agreement is however in general very satisfactory,and the observed differences can be explained by the unavoidableinaccuracies in the experimental results and by the idealized com-putational approach.
Fig. 5. (a) Time-averaged velocity vectors of the flow field inside the scraped heatexchanger crystallizer. The black rectangle corresponds to the area measured by3C-PIV. (b) Computational results of the 3C-PIV measured area. The three lines acrossthe measured area are drawn at heights of 45, 59 and 75mm from the bottomplate, they relate to the profiles in Fig. 6.
A qualitative comparison between the PIV and LES snapshots ofthe same portion of the flow (Figs. 7 and 8, drawn with the samescale for the velocity vector length) shows interesting resemblance.Clearly turbulence is much stronger close to the outer tank wall.Furthermore the sizes of the turbulent structures observed in PIVand LES agree quite well.
3.2. Flow field at the bottom part between the scrapers
Now that we have confidence in the simulated flow data throughtheir agreement with the PIV results, the non-accessible areajust above the scraped HE surface can be analysed from the LESsimulations.
Please cite this article as: Rodriguez Pascual, M., et al., Large eddy simulations and stereoscopic particle image velocimetry measurements in a scrapedheat exchanger crystallizer geometry. Chemical Engineering Science (2009), doi: 10.1016/j.ces.2009.01.034

ARTICLE IN PRESSM. Rodriguez Pascual et al. / Chemical Engineering Science ( ) -- 5
Fig. 6. Tangential and axial velocities calculated from 3C-PIV experiments and from LES simulations at heights of 45, 59 and 75mm from the bottom plate.
Fig. 7. Instantaneous capture of the flow from the 3C-PIV measurements; vectorsrepresent the axial and radial velocity and their length proportional to their norm.
Fig. 8. Instantaneous capture of the flow from the LES simulations; vectors representthe axial and radial velocity and their length proportional to their norm.
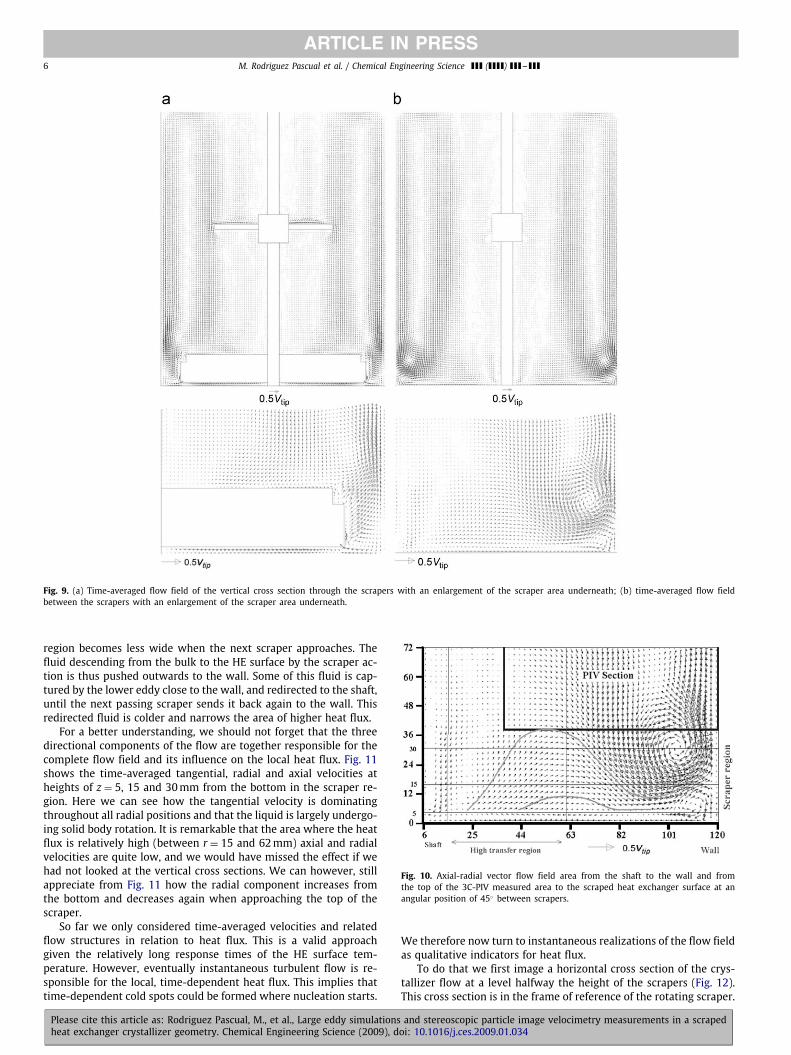
By considering time-averaged flow fields resolved for the angularposition of the scraper in the LES more information about the flowpatterns near the bottom can be gained. In Fig. 9 we show the averageflow in a vertical cross section through the scrapers (Fig. 9a) and inbetween the scraper blades (Fig. 9b).
The cross section through the scrapers (Fig. 9a) shows that thefluid at the tip of the scraper is forced outwards to the wall andsubsequently upwards. Another important observation is that in themiddle region the downward flow above the scraper is carried ra-dially towards the centre of the crystallizer instead of being carriedoutwards as happens in between scrapers (Fig. 9b).
To be able to explain the radial variation in local heat flux, amore detailed analysis of the region between the scrapers is needed.Fig. 10 zooms in on the time-averaged flow in this area halfwaybetween the scrapers, in the region from the shaft to the wall onthe horizontal axis and from the 3C-PIV measured area down to thescraped HE surface on the vertical axis.
In the scraper region z = 0–35mm height from the HE surface,from the shaft till more or less r = 10mm in the radial direction thesolution has hardly an axial or radial velocity component. Betweenr = 10 and 15mm a vertical down flow is observed but with no ra-dial component explaining the low heat flux because limited mix-ing with the rest of the tank volume. Beyond r = 15mm the liquidstarts getting axial and radial velocity components, mainly towardsthe outside tank wall. If we look onto the high transfer region inFig. 10 between r = 15 and 62mm, we can observe that this is thearea where the axial velocity is positive removing the liquid from theHE surface upwards. Here we actually have to differentiate betweentwo levels: the fluid trajectories starting between r = 15 and 40mmfrom the shaft (represented by the top line in Fig. 10) and the fluidtrajectories starting between r = 40 and 60mm (bottom curve inFig. 10). As we can see, the top trajectory brings the liquid higher upafter which it is carried into the main secondary flow that transportsthe fluid to the top of the crystallizer. In the bottom fluid trajectorythe axial velocity is lower. This keeps the liquid close to the HE sur-face while approaching the outside tank wall. This makes that thefluid in the bottom trajectory is being cooled further on its way alongthe trajectory. This limits the local heat flux coefficient. This couldexplain why from r = 40mm on the TLC measurements showed thatthe local heat flux coefficient starts to decrease (Rodriguez Pascualet al., 2008). Also note that fluid can get trapped by the vortex formedat the scraper tip at the HE surface from r = 100mm until the out-side wall. This eddy retains the liquid in this region rotating withoutmuch mixing with the rest of the liquid causing even lower localheat flux close to the wall. Also very close to the bottom a smallinward radial flow is present in between the scrapers (Fig. 10); inFig. 9a a small radial flow is pushed outwards by the action of thescraper. The net effect is quite important as it explains the shapeof the region of high heat flux between two scraper passages asshown in the TLCmeasurements (Rodriguez Pascual et al., 2008). This
Please cite this article as: Rodriguez Pascual, M., et al., Large eddy simulations and stereoscopic particle image velocimetry measurements in a scrapedheat exchanger crystallizer geometry. Chemical Engineering Science (2009), doi: 10.1016/j.ces.2009.01.034
6 M. Rodriguez Pascual et al. / Chemical Engineering Science ( ) --
ARTICLE IN PRESS
Fig. 9. (a) Time-averaged flow field of the vertical cross section through the scrapers with an enlargement of the scraper area underneath; (b) time-averaged flow fieldbetween the scrapers with an enlargement of the scraper area underneath.
region becomes less wide when the next scraper approaches. Thefluid descending from the bulk to the HE surface by the scraper ac-tion is thus pushed outwards to the wall. Some of this fluid is cap-tured by the lower eddy close to the wall, and redirected to the shaft,until the next passing scraper sends it back again to the wall. Thisredirected fluid is colder and narrows the area of higher heat flux.
For a better understanding, we should not forget that the threedirectional components of the flow are together responsible for thecomplete flow field and its influence on the local heat flux. Fig. 11shows the time-averaged tangential, radial and axial velocities atheights of z = 5, 15 and 30mm from the bottom in the scraper re-gion. Here we can see how the tangential velocity is dominatingthroughout all radial positions and that the liquid is largely undergo-ing solid body rotation. It is remarkable that the area where the heatflux is relatively high (between r = 15 and 62mm) axial and radialvelocities are quite low, and we would have missed the effect if wehad not looked at the vertical cross sections. We can however, stillappreciate from Fig. 11 how the radial component increases fromthe bottom and decreases again when approaching the top of thescraper.
So far we only considered time-averaged velocities and relatedflow structures in relation to heat flux. This is a valid approachgiven the relatively long response times of the HE surface tem-perature. However, eventually instantaneous turbulent flow is re-sponsible for the local, time-dependent heat flux. This implies thattime-dependent cold spots could be formed where nucleation starts.
Fig. 10. Axial-radial vector flow field area from the shaft to the wall and fromthe top of the 3C-PIV measured area to the scraped heat exchanger surface at anangular position of 45◦ between scrapers.
We therefore now turn to instantaneous realizations of the flow fieldas qualitative indicators for heat flux.
To do that we first image a horizontal cross section of the crys-tallizer flow at a level halfway the height of the scrapers (Fig. 12).This cross section is in the frame of reference of the rotating scraper.
Please cite this article as: Rodriguez Pascual, M., et al., Large eddy simulations and stereoscopic particle image velocimetry measurements in a scrapedheat exchanger crystallizer geometry. Chemical Engineering Science (2009), doi: 10.1016/j.ces.2009.01.034

ARTICLE IN PRESSM. Rodriguez Pascual et al. / Chemical Engineering Science ( ) -- 7
Fig. 11. Time-averaged tangential, radial and axial velocities calculated from LES simulations at heights of 5, 15 and 30mm from the bottom plate in the scraper region.
Fig. 12. Instantaneous vertical view of the flow field in the frame of reference of the rotating scraper of the horizontal plane halfway the scraper height just above the HE andzoom of the right down quarter. The scraper rotates in the counter clockwise direction. In the rotating reference frame view of the figure, the wall now rotates clockwise.
It reveals that the scraper tip creates a turbulent flow near the wallbehind its blade that dissipates its energy quite rapidly (over roughlyhalf the distance between two scraper blades). The liquid near thetank's outer wall does not mix very well with the rest; it largely flowsalong the wall until the next scraper blade comes by. The instan-taneous differences in local turbulence could however, provoke in-stantaneous cold spots. At these spots nucleation can start, which isa statistical and instantaneous event followed by fast lateral growth.This would explain the lack of reproducibility and spread in scalingexperiments. Near the shaft the flow is less erratic and no instanta-neous cold spots are expected there.
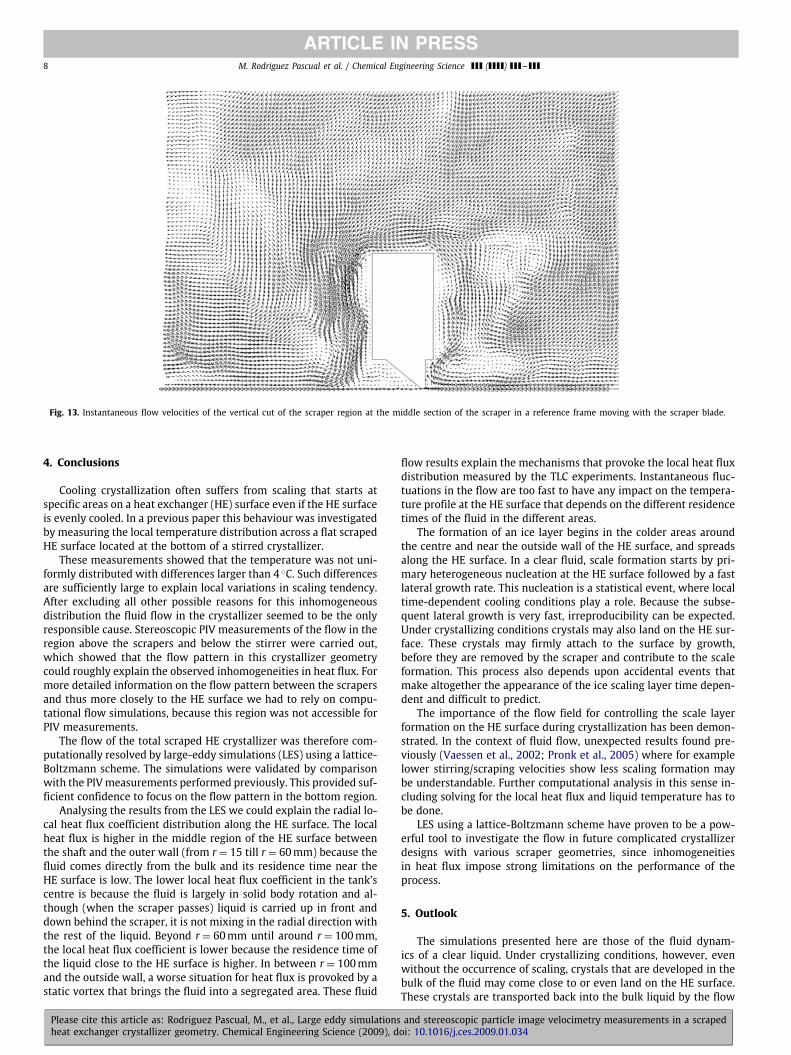
The high heat flux in the middle area of the HE surface is stilldifficult to interpret from Fig. 12. For this purpose a vertical crosssection of the flow was made perpendicular to the scraper blade atr = 60mm from the shaft, see Fig. 13.
This cross section shows how in the middle of a scraper bladethe liquid from the bulk is carried down to the HE surface in nearthe wake of the scraper. From Fig. 10 we now know that this flowat the back of the scraper is pushed outwards to the outside walland that later on (in between the two scrapers) it is moved upwardsaway from the HE surface in the region from around r = 15mmuntil 40mm. Therefore the contact time of the liquid with the HEsurface in the middle region of a scraper blade is lower than in theother areas, and because the liquid comes directly from the bulk, thetemperature difference comparedwith the cooling liquid underneath
the HE surface is higher. This down flow at the back of the scraper(that starts from close to the shaft along of the total scraper lengthand that should not be confused with the averaged main downwardsecondary flow that starts at around r = 50mm) also reduces thethickness of the thermal boundary layer, which enhances the heatflux. At the front of the scraper the liquid is pushed upwards, andmost of it is moved outwards and merges with the main secondaryflow that runs to the top of the crystallizer.
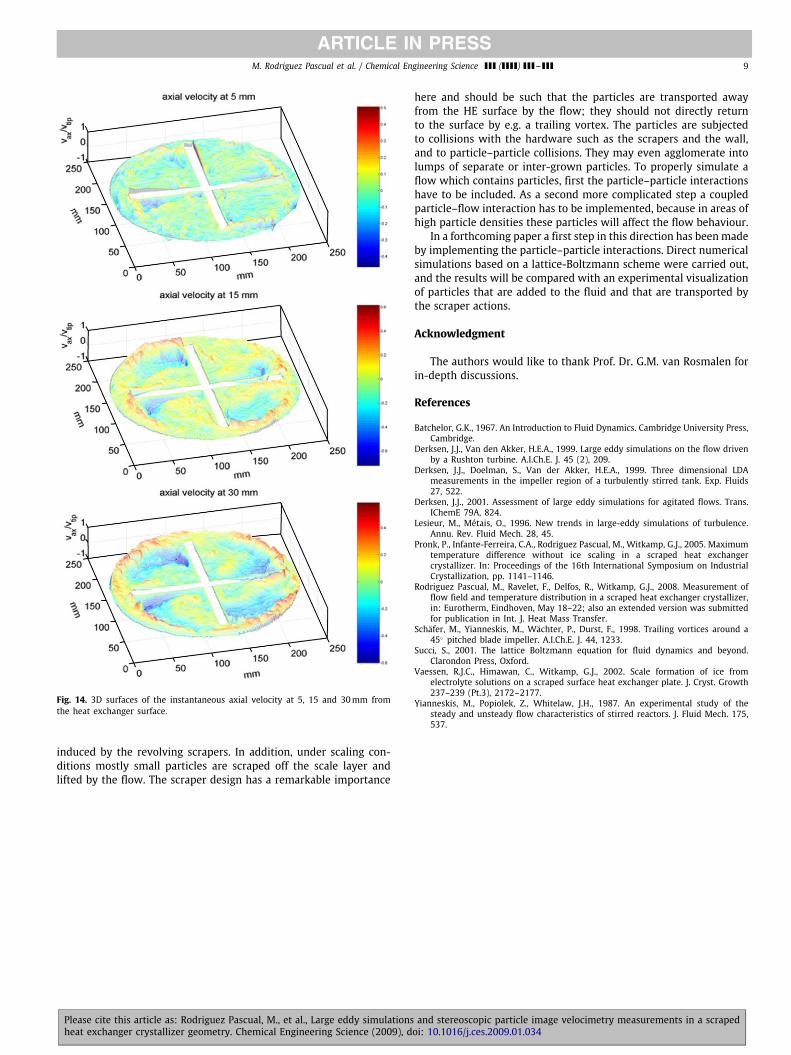
Realizing that the main cause responsible for the inhomogeneousdistribution of local heat flux on the HE surface is the axial velocitycomponentwe now consider the instantaneous axial velocity at threehorizontal cross sections at heights of z = 5, 15, and 30mm (Fig. 14).
As we can see from Fig. 14 the fluid is brought down to theHE in the wake of the scraper blades. This downward axial velocitybehind the scraper is zero near the centre of the tank and increases(negatively) in the radial direction until close to the tip of the scraperwhere it turns positive as approaching the outside wall. As the heightincreases from z = 5 to 30mm the downward velocity gets stronger.
This figure also shows how the down flow coming from the bulk(as we already saw in Fig. 13) is pushed up again by the front ofthe next scraper, and as we know from Fig. 10 also outwards to theoutside wall. This means that the scraper blade's middle region iscontinuously refreshedwith every scraper passage by the bulk liquid,what explains the higher local heat flux coefficient in the middlearea of the HE surface compared to the centre and outside areas.
Please cite this article as: Rodriguez Pascual, M., et al., Large eddy simulations and stereoscopic particle image velocimetry measurements in a scrapedheat exchanger crystallizer geometry. Chemical Engineering Science (2009), doi: 10.1016/j.ces.2009.01.034
8 M. Rodriguez Pascual et al. / Chemical Engineering Science ( ) --
ARTICLE IN PRESS
Fig. 13. Instantaneous flow velocities of the vertical cut of the scraper region at the middle section of the scraper in a reference frame moving with the scraper blade.
4. Conclusions
Cooling crystallization often suffers from scaling that starts atspecific areas on a heat exchanger (HE) surface even if the HE surfaceis evenly cooled. In a previous paper this behaviour was investigatedby measuring the local temperature distribution across a flat scrapedHE surface located at the bottom of a stirred crystallizer.
These measurements showed that the temperature was not uni-formly distributed with differences larger than 4 ◦C. Such differencesare sufficiently large to explain local variations in scaling tendency.After excluding all other possible reasons for this inhomogeneousdistribution the fluid flow in the crystallizer seemed to be the onlyresponsible cause. Stereoscopic PIV measurements of the flow in theregion above the scrapers and below the stirrer were carried out,which showed that the flow pattern in this crystallizer geometrycould roughly explain the observed inhomogeneities in heat flux. Formore detailed information on the flow pattern between the scrapersand thus more closely to the HE surface we had to rely on compu-tational flow simulations, because this region was not accessible forPIV measurements.
The flow of the total scraped HE crystallizer was therefore com-putationally resolved by large-eddy simulations (LES) using a lattice-Boltzmann scheme. The simulations were validated by comparisonwith the PIVmeasurements performed previously. This provided suf-ficient confidence to focus on the flow pattern in the bottom region.
Analysing the results from the LES we could explain the radial lo-cal heat flux coefficient distribution along the HE surface. The localheat flux is higher in the middle region of the HE surface betweenthe shaft and the outer wall (from r = 15 till r = 60mm) because thefluid comes directly from the bulk and its residence time near theHE surface is low. The lower local heat flux coefficient in the tank'scentre is because the fluid is largely in solid body rotation and al-though (when the scraper passes) liquid is carried up in front anddown behind the scraper, it is not mixing in the radial direction withthe rest of the liquid. Beyond r = 60mm until around r = 100mm,the local heat flux coefficient is lower because the residence time ofthe liquid close to the HE surface is higher. In between r = 100mmand the outside wall, a worse situation for heat flux is provoked by astatic vortex that brings the fluid into a segregated area. These fluid
flow results explain the mechanisms that provoke the local heat fluxdistribution measured by the TLC experiments. Instantaneous fluc-tuations in the flow are too fast to have any impact on the tempera-ture profile at the HE surface that depends on the different residencetimes of the fluid in the different areas.
The formation of an ice layer begins in the colder areas aroundthe centre and near the outside wall of the HE surface, and spreadsalong the HE surface. In a clear fluid, scale formation starts by pri-mary heterogeneous nucleation at the HE surface followed by a fastlateral growth rate. This nucleation is a statistical event, where localtime-dependent cooling conditions play a role. Because the subse-quent lateral growth is very fast, irreproducibility can be expected.Under crystallizing conditions crystals may also land on the HE sur-face. These crystals may firmly attach to the surface by growth,before they are removed by the scraper and contribute to the scaleformation. This process also depends upon accidental events thatmake altogether the appearance of the ice scaling layer time depen-dent and difficult to predict.
The importance of the flow field for controlling the scale layerformation on the HE surface during crystallization has been demon-strated. In the context of fluid flow, unexpected results found pre-viously (Vaessen et al., 2002; Pronk et al., 2005) where for examplelower stirring/scraping velocities show less scaling formation maybe understandable. Further computational analysis in this sense in-cluding solving for the local heat flux and liquid temperature has tobe done.
LES using a lattice-Boltzmann scheme have proven to be a pow-erful tool to investigate the flow in future complicated crystallizerdesigns with various scraper geometries, since inhomogeneitiesin heat flux impose strong limitations on the performance of theprocess.
5. Outlook
The simulations presented here are those of the fluid dynam-ics of a clear liquid. Under crystallizing conditions, however, evenwithout the occurrence of scaling, crystals that are developed in thebulk of the fluid may come close to or even land on the HE surface.These crystals are transported back into the bulk liquid by the flow
Please cite this article as: Rodriguez Pascual, M., et al., Large eddy simulations and stereoscopic particle image velocimetry measurements in a scrapedheat exchanger crystallizer geometry. Chemical Engineering Science (2009), doi: 10.1016/j.ces.2009.01.034
ARTICLE IN PRESSM. Rodriguez Pascual et al. / Chemical Engineering Science ( ) -- 9
Fig. 14. 3D surfaces of the instantaneous axial velocity at 5, 15 and 30mm fromthe heat exchanger surface.
induced by the revolving scrapers. In addition, under scaling con-ditions mostly small particles are scraped off the scale layer andlifted by the flow. The scraper design has a remarkable importance
here and should be such that the particles are transported awayfrom the HE surface by the flow; they should not directly returnto the surface by e.g. a trailing vortex. The particles are subjectedto collisions with the hardware such as the scrapers and the wall,and to particle–particle collisions. They may even agglomerate intolumps of separate or inter-grown particles. To properly simulate aflow which contains particles, first the particle–particle interactionshave to be included. As a second more complicated step a coupledparticle–flow interaction has to be implemented, because in areas ofhigh particle densities these particles will affect the flow behaviour.
In a forthcoming paper a first step in this direction has been madeby implementing the particle–particle interactions. Direct numericalsimulations based on a lattice-Boltzmann scheme were carried out,and the results will be compared with an experimental visualizationof particles that are added to the fluid and that are transported bythe scraper actions.
Acknowledgment
The authors would like to thank Prof. Dr. G.M. van Rosmalen forin-depth discussions.
References
Batchelor, G.K., 1967. An Introduction to Fluid Dynamics. Cambridge University Press,Cambridge.
Derksen, J.J., Van den Akker, H.E.A., 1999. Large eddy simulations on the flow drivenby a Rushton turbine. A.I.Ch.E. J. 45 (2), 209.
Derksen, J.J., Doelman, S., Van der Akker, H.E.A., 1999. Three dimensional LDAmeasurements in the impeller region of a turbulently stirred tank. Exp. Fluids27, 522.
Derksen, J.J., 2001. Assessment of large eddy simulations for agitated flows. Trans.IChemE 79A, 824.
Lesieur, M., Métais, O., 1996. New trends in large-eddy simulations of turbulence.Annu. Rev. Fluid Mech. 28, 45.
Pronk, P., Infante-Ferreira, C.A., Rodriguez Pascual, M., Witkamp, G.J., 2005. Maximumtemperature difference without ice scaling in a scraped heat exchangercrystallizer. In: Proceedings of the 16th International Symposium on IndustrialCrystallization, pp. 1141–1146.
Rodriguez Pascual, M., Ravelet, F., Delfos, R., Witkamp, G.J., 2008. Measurement offlow field and temperature distribution in a scraped heat exchanger crystallizer,in: Eurotherm, Eindhoven, May 18–22; also an extended version was submittedfor publication in Int. J. Heat Mass Transfer.
Schafer, M., Yianneskis, M., Wachter, P., Durst, F., 1998. Trailing vortices around a45◦ pitched blade impeller. A.I.Ch.E. J. 44, 1233.
Succi, S., 2001. The lattice Boltzmann equation for fluid dynamics and beyond.Clarondon Press, Oxford.
Vaessen, R.J.C., Himawan, C., Witkamp, G.J., 2002. Scale formation of ice fromelectrolyte solutions on a scraped surface heat exchanger plate. J. Cryst. Growth237–239 (Pt.3), 2172–2177.
Yianneskis, M., Popiolek, Z., Whitelaw, J.H., 1987. An experimental study of thesteady and unsteady flow characteristics of stirred reactors. J. Fluid Mech. 175,537.
Please cite this article as: Rodriguez Pascual, M., et al., Large eddy simulations and stereoscopic particle image velocimetry measurements in a scrapedheat exchanger crystallizer geometry. Chemical Engineering Science (2009), doi: 10.1016/j.ces.2009.01.034