Large-eddy simulation of supersonic turbulent flow in axisymmetric nozzles and diffusers
12
Large-eddy simulation of supersonic turbulent flow in axisymmetric nozzles and diffusers Somnath Ghosh a , Joern Sesterhenn b , Rainer Friedrich a, * a Fachgebiet Stro ¨ mungsmechanik, Technische Universita ¨t Mu ¨ nchen, Boltzmannstr. 15, D-85748 Garching, Germany b Fakulta ¨t fu ¨ r Luft- und Raumfahrttechnik, Universita ¨ t der Bundeswehr Mu ¨ nchen, Werner-Heisenberg-Weg 39, D-85577 Neubiberg/Mu ¨ nchen, Germany Received 23 October 2007; received in revised form 15 January 2008; accepted 24 January 2008 Available online 2 April 2008 Abstract Effects of extra strain and dilatation rates on the turbulence structure in nozzles and diffusers with fully developed supersonic pipe flow as inflow condition are investigated by means of LES using high-order numerical schemes. Results from a DNS of pipe and nozzle flow validating the LES are also shown. It is found that weak pressure gradients already strongly inhibit or enhance the Reynolds stresses via corresponding changes of production and pressure–strain terms. The results constitute a database for the improvement of second- order turbulence models for compressible flow. Ó 2008 Elsevier Inc. All rights reserved. Keywords: LES; Compressible wall-bounded flows; Mean dilatation effects 1. Introduction Compressibility effects in simple turbulent shear flows along isothermal walls, like fully developed channel or pipe flow, manifest themselves in terms of mean density and temperature variations in the near-wall layer and thereby increase the anisotropy of the Reynolds stress tensor. While the peak value of the streamwise Reynolds stress grows with increasing Mach number, the peak values of the other stresses decrease as a consequence of reduced pressure–strain correlations. Since wave-propagation effects are unimportant up to supersonic Mach numbers, solutions of the Poisson equation for the pressure fluctua- tions by means of a Green function have proven for fully-developed supersonic channel flow (Foysi et al., 2004) that the decrease in mean density from the wall to the channel core is responsible for the decrease of all pres- sure–strain correlations compared to incompressible flow. Analogous decrease of pressure–strain correlations with increasing Mach number has been observed in pipe flows (Ghosh et al., 2006). Hence, similar mechanisms control the changes in anisotropy of the Reynolds stress transport. They may be summarized as follows. The production of the streamwise Reynolds stress declines with increasing Mach number, but scales with the wall shear stress and the local viscosity along the semi-local wall-normal coordinate. The corresponding pressure–strain correlation does not follow this scaling law, and decreases faster with increasing Mach number which explains the increase in streamwise Rey- nolds stress. The wall-normal and azimuthal Reynolds stresses have no production terms in their balance equa- tions and decay with increasing Mach number since the pressure–strain correlations decay. It is to be expected that flows subjected to acceleration and deceleration exhibit even more complex Reynolds stress transport mechanisms. The response of flows to expansion or compression leads to transport phenomena which cannot be explained in terms of mean property vari- ations alone. Bradshaw (1974, 1977) has used the appropri- ate term ‘complex flows’ to denote flows in which 0142-727X/$ - see front matter Ó 2008 Elsevier Inc. All rights reserved. doi:10.1016/j.ijheatfluidflow.2008.01.011 * Corresponding author. E-mail address: [email protected] (R. Friedrich). www.elsevier.com/locate/ijhff Available online at www.sciencedirect.com International Journal of Heat and Fluid Flow 29 (2008) 579–590
-
Upload
somnath-ghosh -
Category
Documents
-
view
218 -
download
5
Transcript of Large-eddy simulation of supersonic turbulent flow in axisymmetric nozzles and diffusers

Available online at www.sciencedirect.com
www.elsevier.com/locate/ijhff
International Journal of Heat and Fluid Flow 29 (2008) 579–590
Large-eddy simulation of supersonic turbulent flowin axisymmetric nozzles and diffusers
Somnath Ghosh a, Joern Sesterhenn b, Rainer Friedrich a,*
a Fachgebiet Stromungsmechanik, Technische Universitat Munchen, Boltzmannstr. 15, D-85748 Garching, Germanyb Fakultat fur Luft- und Raumfahrttechnik, Universitat der Bundeswehr Munchen, Werner-Heisenberg-Weg 39, D-85577 Neubiberg/Munchen, Germany
Received 23 October 2007; received in revised form 15 January 2008; accepted 24 January 2008Available online 2 April 2008
Abstract
Effects of extra strain and dilatation rates on the turbulence structure in nozzles and diffusers with fully developed supersonic pipeflow as inflow condition are investigated by means of LES using high-order numerical schemes. Results from a DNS of pipe and nozzleflow validating the LES are also shown. It is found that weak pressure gradients already strongly inhibit or enhance the Reynolds stressesvia corresponding changes of production and pressure–strain terms. The results constitute a database for the improvement of second-order turbulence models for compressible flow.� 2008 Elsevier Inc. All rights reserved.
Keywords: LES; Compressible wall-bounded flows; Mean dilatation effects
1. Introduction
Compressibility effects in simple turbulent shear flowsalong isothermal walls, like fully developed channel or pipeflow, manifest themselves in terms of mean density andtemperature variations in the near-wall layer and therebyincrease the anisotropy of the Reynolds stress tensor.While the peak value of the streamwise Reynolds stressgrows with increasing Mach number, the peak values ofthe other stresses decrease as a consequence of reducedpressure–strain correlations. Since wave-propagationeffects are unimportant up to supersonic Mach numbers,solutions of the Poisson equation for the pressure fluctua-tions by means of a Green function have proven forfully-developed supersonic channel flow (Foysi et al.,2004) that the decrease in mean density from the wall tothe channel core is responsible for the decrease of all pres-sure–strain correlations compared to incompressible flow.
0142-727X/$ - see front matter � 2008 Elsevier Inc. All rights reserved.
doi:10.1016/j.ijheatfluidflow.2008.01.011
* Corresponding author.E-mail address: [email protected] (R. Friedrich).
Analogous decrease of pressure–strain correlations withincreasing Mach number has been observed in pipe flows(Ghosh et al., 2006). Hence, similar mechanisms controlthe changes in anisotropy of the Reynolds stress transport.They may be summarized as follows. The production of thestreamwise Reynolds stress declines with increasing Machnumber, but scales with the wall shear stress and the localviscosity along the semi-local wall-normal coordinate. Thecorresponding pressure–strain correlation does not followthis scaling law, and decreases faster with increasing Machnumber which explains the increase in streamwise Rey-nolds stress. The wall-normal and azimuthal Reynoldsstresses have no production terms in their balance equa-tions and decay with increasing Mach number since thepressure–strain correlations decay.
It is to be expected that flows subjected to accelerationand deceleration exhibit even more complex Reynoldsstress transport mechanisms. The response of flows toexpansion or compression leads to transport phenomenawhich cannot be explained in terms of mean property vari-ations alone. Bradshaw (1974, 1977) has used the appropri-ate term ‘complex flows’ to denote flows in which

580 S. Ghosh et al. / Int. J. Heat and Fluid Flow 29 (2008) 579–590
significant pressure gradients and strain rates exist. He hasdiscussed the increase in Reynolds stresses by bulk com-pression and their decrease by bulk expansion in super-sonic turbulent boundary layers and has highlighted theneed to improve engineering calculation methods. Hisattempt to account for mean dilatation effects in his empir-ical Reynolds shear stress equation provides some, but notsufficient improvement in predicting complex compressibleflows. In their review article on the physics of supersonicturbulent boundary layers, Spina et al. (1994) stress theneed for systematic experimental and DNS data for suchcomplex, compressible flows.
Effects of rapid compression on isotropic turbulence upto an initial turbulent Mach number of M t ¼ 0:29 werestudied by Cambon et al. (1993). Using DNS they find tur-bulence amplification and show that, although there is arise in pressure-dilatation correlation at higher M t and athigher compression rates, this is accompanied by anincreased turbulent kinetic energy (TKE) production ratethrough the redistributive pressure–strain correlations.The increase in pressure-dilatation correlation is relativelysmall compared to that of TKE production. Maheshet al. (1994) study rapid compression of a shear flow bymeans of DNS and show that the degree of amplificationof TKE and streamwise intensities is higher than in isotro-pic turbulence. Again, the importance of pressure–straincorrelations is confirmed by this study. Effects of rapidexpansion on a supersonic turbulent boundary layer havebeen studied experimentally by Dussauge and Gaviglio(1987). They found that the rapid parts of the pressure–strain correlations are modified and the Reynolds stressdecay in the expansion is mainly caused by bulk dilatationproduction terms (i.e. part of kinetic production) and to alesser extent by mean pressure gradient production terms(enthalpic production).
While studying the literature, we did not come acrosssystematic numerical investigations of the effects of weak,distributed pressure gradients on compressible, wall-bounded turbulence. Hence, it is our aim to contributenew findings about effects of such weak, distributed dilata-tion on the turbulence structure in supersonic nozzles anddiffusers using well-established and accurate numericalmethods. Data presented here from these canonical flowcomputations could be readily used for further improve-ment of Reynolds stress closures.
The flow configuration chosen is fully-developed super-sonic pipe flow subjected to gradual acceleration/decelera-tion in a nozzle/diffuser with circular cross-section andisothermal wall. The supersonic pipe flow is driven by ahomogeneous body force facilitating the use of streamwiseperiodicity. Data from this simulation is specified as inflowconditions in real-time to the nozzle/diffuser simulations.Results from large-eddy simulations of these flows usingan explicit filtering version of the approximate deconvolu-tion method (ADM) of Stolz et al. (2001) are reported here.A DNS has also been performed to validate the LES datafor pipe and nozzle flow.
2. Governing equations and coordinate systems
The governing Navier–Stokes equations are written in apressure–velocity–entropy form (Sesterhenn, 2001) in gen-eralized curvilinear coordinates:
pt ¼ �qc2
Xþ þ X� þ Y þ þ Y � þ Zþ þ Z�½ �
þ pCv½st þ X s þ Y s þ Zs�;
ut ¼ �ffiffiffiffiffiffig11
p2½Xþ � X�� � Y u � g21
2ffiffiffiffiffiffig22
p ½Y þ � Y ��
� Zu � g31
2ffiffiffiffiffiffig33
p ½Zþ � Z�� þn1;in
l;j
qosij
onl ;
vt ¼ �X v �ffiffiffiffiffiffig22
p2½Y þ � Y �� � Zv � g12
2ffiffiffiffiffiffig11
p ½Xþ � X��
� g32
2ffiffiffiffiffiffig33
p ½Zþ � Z�� þn2;in
l;j
qosij
onl ;
wt ¼ �X w �ffiffiffiffiffiffig33
p2½Zþ � Z�� � Y w � g23
2ffiffiffiffiffiffig22
p ½Y þ � Y ��
� g13
2ffiffiffiffiffiffig11
p ½Xþ � X�� þn3;in
l;j
qosij
onl ;
st ¼ �X s � Y s � Zs þ 1
qT�nl
i
o
onl �knli
oT
onl
� �þW
� �: ð1Þ
The coordinates nl are related to the cartesian coordi-nates xi by o
oxi¼ onl
oxi
o
onl. u1 � u; u2 � v; u2 � w are the veloci-ties along coordinates n1 � n; n2 � g; n3 � f and are relatedto the cartesian velocity components ui through ul ¼ nl
;iui.glm is defined as glm ¼ nl
;inm;i , where nl
;i stands for onl
oxi. The
above equations for the evolution of p; u; v;w and s aresolved along with an ideal gas equation of state,p ¼ qRT , with constant Cp;Cv and constant Prandtl num-ber (Pr). The dynamic viscosity is assumed to vary withtemperature according to Sutherland’s law: l / T 0:7.
X�; Y �; Z� can be interpreted as acoustic waves propa-gating with velocities u�
ffiffiffiffiffiffig11
pc, v�
ffiffiffiffiffiffig22
pc and w�ffiffiffiffiffiffi
g33p
c along the curvilinear coordinates n1; n2; n3. X s;Y s; Zs are entropy waves with velocities u; v, and w andX u;v;w; Y u;v;w; Zu;v;w are vorticity waves with correspondingvelocities u; v;w, respectively:
X� � ðu�ffiffiffiffiffiffig11
pcÞ
pn
qc� unffiffiffiffiffiffi
g11p" #
; X s � usn;
X v � u vn �g12
g11un
� �; X w � u wn �
g13
g11un
� �;
Y � � ðv�ffiffiffiffiffiffig22
pcÞ
pg
qc� vgffiffiffiffiffiffi
g22p" #
; Y s � vsg;
Y u � v ug �g21
g22vg
� �; Y w � v wg �
g23
g22vg
� �;
S. Ghosh et al. / Int. J. Heat and Fluid Flow 29 (2008) 579–590 581
Z� � ðw�ffiffiffiffiffiffig33
pcÞ
pf
qc� wfffiffiffiffiffiffi
g33p" #
; Zs � wsf;
Zu � w uf �g31
g33wf
� �; Zv � w vf �
g32
g33wf
� �:
The viscous stress (neglecting bulk viscosity effects), thestrain rate tensor and the dissipation rate are defined as
sij ¼ 2l sij �1
3skkdij
� �; sij ¼
1
2
oui
oxjþ ouj
oxi
� �; W ¼ sijsij:
These equations are solved in an orthogonal (cylindri-cal) coordinate system for the pipe flow simulations andin a non-orthogonal system for the nozzle/diffuser simula-tions. The singularity at the axis is avoided by placing nogridpoint on the axis by suitable staggering following Moh-seni and Colonius (2000).
Cylindrical coordinates for a domain of length Lx inaxial direction and radius R are defined as follows andinclude the wall-normal tanh stretching:
x1 ¼ nLx; x2 ¼tanh jftanh j
R cos 2pg; x3 ¼tanh jftanh j
R sin 2pg;
where n; g; f vary uniformly from 0 to 1 and j is the stretch-ing factor (j is taken to be 1:1 in all computations in orderto avoid high aspect-ratio of the grid near the centerline).
The non-orthogonal coordinates for the nozzle/diffusersimulations with a domain of length Lx in axial directionand an axially varying radius f ðnÞ are defined as follows:
x1 ¼ nLx; x2 ¼tanh jftanh j
f ðnÞ cos 2pg;
x3 ¼tanh jftanh j
f ðnÞ sin 2pg:
f ðnÞ is determined in our flow cases using isentropicstreamtube equations and specifying a pressure distributionin such a way that the flow goes through an extended re-gion of constant pressure gradient.
3. Numerical method
Sixth-order compact central schemes (Lele, 1992) areused for spatial discretization in the LES. In the DNS,fifth-order compact upwind schemes (Adams and Shariff,1996) have been used for the convection terms and sixth-order compact central schemes for the molecular transportterms. The flow field is advanced in time in both cases usinga third-order low-storage Runge–Kutta scheme (William-son, 1980).
3.1. LES approach
An explicit filtering variant (Mathew et al., 2003) of theApproximate Deconvolution Method (Stolz et al., 2001) isused for modelling the subgrid scale terms which is brieflyexplained here using a 1d nonlinear transport equation
ouotþ of ðuÞ
ox¼ 0:
The low-pass filtered transport equation can be writtenas
o�uotþ of ð�uÞ
ox¼ of ð�uÞ
ox� G � of ðuÞ
ox; ð2Þ
where �u ¼ G � u ¼R
Gðx� x0Þuðx0Þdx0 and G is a spatiallow-pass filter. Approximate deconvolution u� ¼ QN � �uuses the approximate inverse of G, QN � G�1 computedusing the Van Cittert series, QN ¼
PNn¼0ðI � GÞn, (Stolz
et al., 2001) truncated at N ¼ 6 (I is the identity operator).Eq. (2) can now be written
o�uotþ of ð�uÞ
ox¼ of ð�uÞ
ox� G � of ðu�Þ
oxþ G � of ðu�Þ
ox� of ðuÞ
ox
� �:
ð3Þ
For a useful LES, the low-wavenumber content of thedeconvolved field u� should be as close as possible to thatof u, i.e. G � u� � G � u ¼ �u.
The assumption u ¼ u� gives the simplest LES equation
o�uotþ G � of ðu�Þ
ox¼ 0: ð4Þ
A more sophisticated LES equation can be obtained bymodelling the square bracket on the RHS of (3) (Mathewet al., 2006). This LES approach is not used here due toits extensive numerical costs. The procedure used to solve(4) involves the following three steps:
deconvolution : u�ðnÞ ¼ QN � �un;
integration : u�ðnþ1Þ u�ðnÞ;
filtering : �uðnþ1Þ ¼ G � u�ðnþ1Þ:
In a simulation, step 1 follows step 3, so that both steps canbe combined:
u�ðnÞ QN � G � u�ðnÞ:
Additional regularization by artificial dissipation isfound to be necessary in order to mimic the effect of dissi-pative scales on the resolved scales since the deconvolvedvariable, u�, can contain wavenumbers only up to theNyquist limit of the coarse LES grid. In the ADM formu-lation of Adams and Leonard (1999) and subsequently inthat of Stolz et al. (2001), additional regularization isachieved by adding a relaxation term of the formvðI � QN � GÞ � �u to the filtered equation. A model that isnearly equivalent to a relaxation term is obtained by anadditional filtering step with the filter QN � G (Mathewet al., 2003). Thus the procedure of deconvolution and reg-ularization is combined here into a single-step filtering withthe filter ðQN � GÞ2 at each time step.
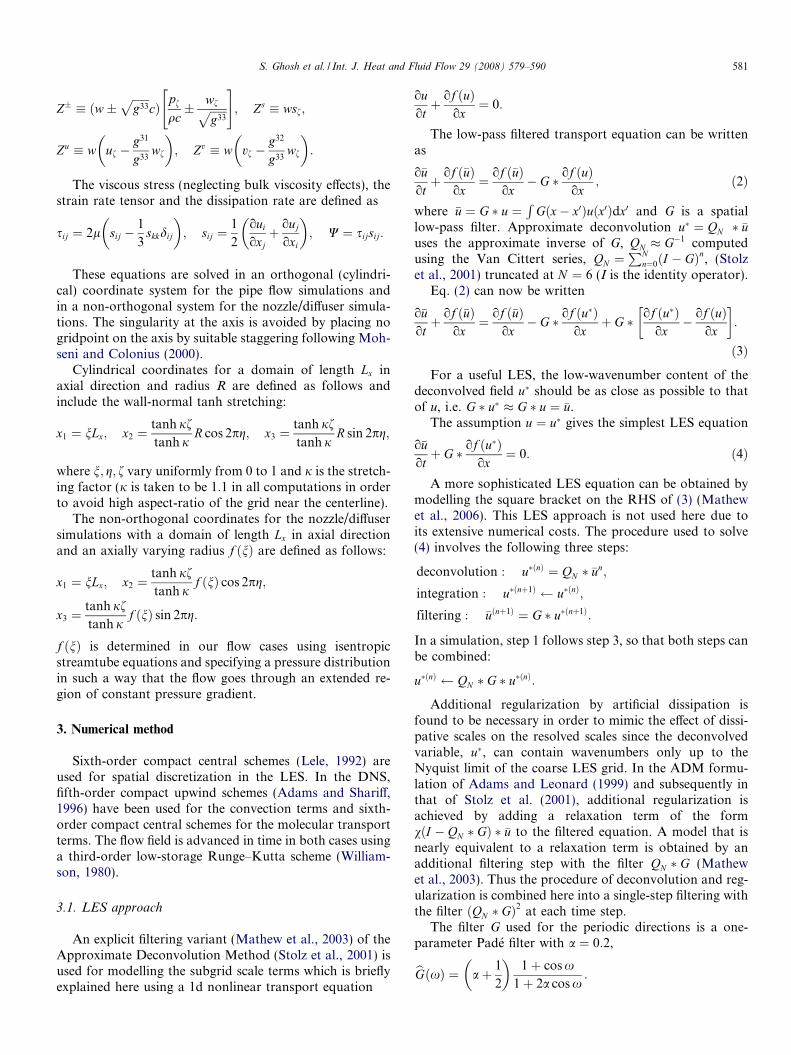
The filter G used for the periodic directions is a one-parameter Pade filter with a ¼ 0:2,
bGðxÞ ¼ aþ 1
2
� �1þ cos x
1þ 2a cos x:
0
0.2
0.4
0.6
0.8
1
0 0.2 0.4 0.6 0.8 1
Fig. 1. Transfer functions of filters and their approximate inverse for aperiodic case. a= 0.2 and N = 6: (—) G, (–––) QN, (.. ..) QN * G, (– – –)(QN * G)2.
582 S. Ghosh et al. / Int. J. Heat and Fluid Flow 29 (2008) 579–590
The transfer functions of G, QN � G, ðQN � GÞ2 are shownin Fig. 1.
Ghosh et al. (2006) performed LES of supersonic pipeflow with an isothermal wall using this single-step explicitfiltering technique and found very satisfactory agreementwith their DNS data concerning correlations that are dom-inated by large scales.
3.2. Boundary conditions
In the present work, fully-developed supersonic turbu-lent pipe flow serves as inflow condition for nozzle and dif-fuser flow. The streamwise periodic pipe flow and thenozzle/diffuser flow simulations are coupled using standardMPI routines (Schlueter et al., 2002). Inflow conditions arespecified in the form of characteristics in a similar manneras Poinsot and Lele (1992). In the supersonic region of theinflow plane all the incoming characteristics (Xþ;X�;X v;X w;X s) are specified. In the subsonic region the outgo-ing acoustic wave X� is computed from the nozzle flowsimulation and this provides acoustic transparency to theinflow. For the viscous terms at the inflow, the streamwisederivatives are computed on a mixed stencil involvingpoints from the pipe and the nozzle/diffuser simulations.
Partially non-reflecting outflow conditions (Poinsot andLele, 1992) are used in the subsonic region of the outflowplane. The pressure at the outflow is specified by addinga forcing term of the form X� ¼ Kðp � pinfÞ to the axialmomentum equation. This form of forcing brings informa-tion into the computational domain about the ambientpressure, pinf . Poinsot and Lele (1992) provide a way toevaluate the constant K such that the imposed conditionhas only a weak influence on the flow
K ¼ rð1�M2Þc=L;
where M is the maximum Mach number in the subsonicflow, L is a characteristic domain size, c is a speed of soundand r is a constant. In our flow cases, M and c were takenas average quantities, L as the axial domain size andr ¼ 0:25.
Extra conditions for the viscous terms are specified bysetting to zero the axial derivatives of the transverse shearstresses and the heat flux through the outflow plane
os12
ox1
¼ 0;os13
ox1
¼ 0;oq1
ox1
¼ 0;
where x1 is a coordinate normal to the outflow plane. Nosponge layer has been used either in the LES or in theDNS.
At the walls impermeability and no-slip conditions holdand the walls are kept at the same constant temperature inboth the pipe and the nozzle/diffuser simulations.
3.3. Computational parameters
We have chosen fully-developed turbulent flow throughpipes of constant circular cross-section with isothermalwall as well-defined inflow conditions for the nozzle/dif-fuser simulations. The working fluid is air with a Prandtlnumber of 0:7, a ratio of specific heats, c ¼ 1:4. The flowis driven by a constant body force. The Mach and the fric-tion Reynolds numbers of the incoming pipe flow for thenozzle computation are 1:5 and 245, while those for the dif-fuser computation are 1:8 and 280. While the Mach num-ber is based on the speed of sound at wall temperatureand bulk velocity, the friction Reynolds number Res isdefined using the friction velocity us ¼
ffiffiffiffiffiffiffiffiffiffiffiffiffisw=qw
p, the pipe
radius R and the kinematic viscosity at the wall, mwðT wÞ.The domain length of each configuration (pipe or nozzle/diffuser) is L ¼ 10R. The streamwise variation of the flowcross-section is calculated using streamtube equations fora given streamwise pressure distribution. This is done toensure that the turbulence is subjected to an extendedregion of nearly constant weak pressure gradient. The Cla-user pressure gradient parameter, b ¼ d�
sw
d�pdx, has an average
value of �1:6 in the nozzle and 1:6 in the diffuser, respec-tively. The ratios of nozzle- and diffuser radii to pipe radiusat the ends of the computational domains are 1.58 (nozzle)and 0.93 (diffuser). The number of grid points used to dis-cretize the pipe and nozzle domains are 64� 64� 50 in theLES and 256� 128� 91 in the DNS in streamwise, circum-ferential and radial directions. For the LES of diffuser flow,a grid of 64� 64� 50 points is chosen as well.
4. Results
Results are presented in three sections. The first sectionis dedicated to fully-developed supersonic pipe flow thatserves as inflow condition for nozzle and diffuser flow. Inthe second section, we discuss mean flow features in thenozzle, the evolution of Reynolds stresses and Reynoldsstress budgets with a focus on pressure–strain correlationsand the various contributions to production. Most of theresults are based on LES data. DNS data are occasionallyused to validate the results. The third section concentrateson analogous effects in the diffuser. Here, only LES dataare available.
0
5
10
15
20
25
1 10 100
Fig. 3. Van Driest transformed velocity. Solid line: DNS; dashed line:LES. Dotted line: uþ ¼ 2:5 ln yþ þ 5:5.
6 7 8 9
S. Ghosh et al. / Int. J. Heat and Fluid Flow 29 (2008) 579–590 583
4.1. Fully-developed supersonic pipe flow
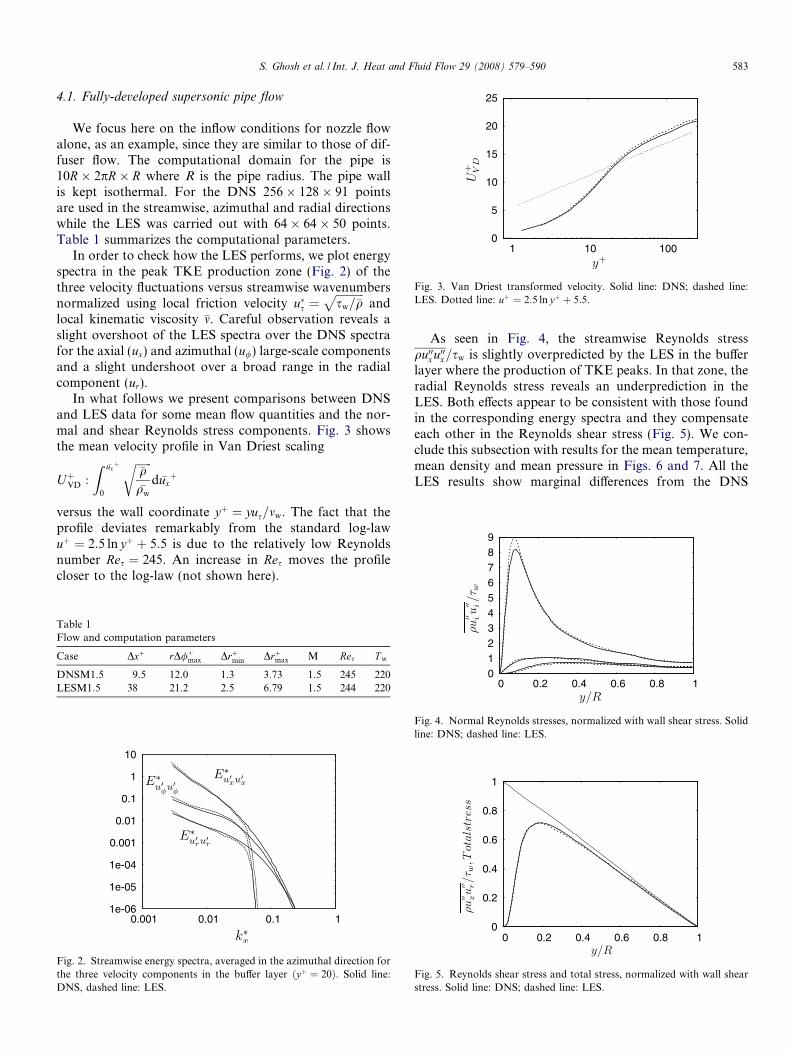
We focus here on the inflow conditions for nozzle flowalone, as an example, since they are similar to those of dif-fuser flow. The computational domain for the pipe is10R� 2pR� R where R is the pipe radius. The pipe wallis kept isothermal. For the DNS 256� 128� 91 pointsare used in the streamwise, azimuthal and radial directionswhile the LES was carried out with 64� 64� 50 points.Table 1 summarizes the computational parameters.
In order to check how the LES performs, we plot energyspectra in the peak TKE production zone (Fig. 2) of thethree velocity fluctuations versus streamwise wavenumbersnormalized using local friction velocity u�s ¼
ffiffiffiffiffiffiffiffiffiffisw=�q
pand
local kinematic viscosity �m. Careful observation reveals aslight overshoot of the LES spectra over the DNS spectrafor the axial (ux) and azimuthal (u/) large-scale componentsand a slight undershoot over a broad range in the radialcomponent (ur).
In what follows we present comparisons between DNSand LES data for some mean flow quantities and the nor-mal and shear Reynolds stress components. Fig. 3 showsthe mean velocity profile in Van Driest scaling
UþVD :
Z �uxþ
0
ffiffiffiffiffiffi�q�qw
rd �ux
þ
versus the wall coordinate yþ ¼ yus=mw. The fact that theprofile deviates remarkably from the standard log-lawuþ ¼ 2:5 ln yþ þ 5:5 is due to the relatively low Reynoldsnumber Res ¼ 245. An increase in Res moves the profilecloser to the log-law (not shown here).
Table 1Flow and computation parameters
Case Dxþ rD/þmax Drþmin Drþmax M Res T w
DNSM1.5 9.5 12.0 1.3 3.73 1.5 245 220LESM1.5 38 21.2 2.5 6.79 1.5 244 220
1e-06
1e-05
1e-04
0.001
0.01
0.1
1
10
0.001 0.01 0.1 1
Fig. 2. Streamwise energy spectra, averaged in the azimuthal direction forthe three velocity components in the buffer layer ðyþ ¼ 20Þ. Solid line:DNS, dashed line: LES.
As seen in Fig. 4, the streamwise Reynolds stressqu00x u00x=sw is slightly overpredicted by the LES in the bufferlayer where the production of TKE peaks. In that zone, theradial Reynolds stress reveals an underprediction in theLES. Both effects appear to be consistent with those foundin the corresponding energy spectra and they compensateeach other in the Reynolds shear stress (Fig. 5). We con-clude this subsection with results for the mean temperature,mean density and mean pressure in Figs. 6 and 7. All theLES results show marginal differences from the DNS
0 1 2 3 4 5
0 0.2 0.4 0.6 0.8 1
Fig. 4. Normal Reynolds stresses, normalized with wall shear stress. Solidline: DNS; dashed line: LES.
0
0.2
0.4
0.6
0.8
1
0 0.2 0.4 0.6 0.8 1
Fig. 5. Reynolds shear stress and total stress, normalized with wall shearstress. Solid line: DNS; dashed line: LES.
0
0.5
1
1.5
2
2.5
3
0 0.2 0.4 0.6 0.8 1
Fig. 8. Streamwise variation of cross-sectional area (A), mean centerlineMach number (M c) and pressure (pc) in the nozzle. (—) LES, (–––)Isentropic streamtube. Subscript ‘o’ denotes value at inflow x=L ¼ 0.
0.1 0.2 0.3 0.4 0.5 0.6 0.7 0.8 0.9
1 1.1
0 0.2 0.4 0.6 0.8 1
Fig. 9. Streamwise variation of mean centerline density (qc), wall density(qw) and centerline temperature (T c) in the nozzle. (—) LES, (–––)Isentropic streamtube. Subscript ‘o’ denotes value at inflow x=L ¼ 0.
0.7
0.8
0.9
1
1.1
1.2
1.3
1.4
0 0.2 0.4 0.6 0.8 1
Fig. 6. Mean temperature and density profiles. Solid lines: DNS; dashedlines: LES.
0.992
0.993
0.994
0.995
0.996
0.997
0.998
0.999
1
1.001
0 0.2 0.4 0.6 0.8 1
Fig. 7. Mean pressure profiles. Solid lines: DNS; dashed lines: LES.
584 S. Ghosh et al. / Int. J. Heat and Fluid Flow 29 (2008) 579–590
results. An interesting physical aspect should be noted inFig. 7. The radial pressure variations are so low that theycan be neglected with respect to the strong mean tempera-ture variations. As a result, the mean ideal gas law predictsa close radial coupling between mean temperature and den-sity fields.
4.2. Nozzle flow
For an improved understanding of compressibility andacceleration effects it is necessary to discuss the behaviourof mean primitive flow variables first. Fig. 8 contains axialprofiles of mean centerline Mach number and pressure(normalized with their values at the inflow). Fig. 8 also pre-sents the axial variation of the nozzle cross-section A, nor-malized with its upstream value, Ao. A starts increasing atx=L ¼ 0:16, after a short section of constant diameter.When A has reached its maximum value of 2:5, the center-line Mach number has increased from 1:52 to 2:5 whichrepresents a factor of 1.64 increase. Fig. 9 shows profilesof mean temperature and density along the nozzle center-line. In both figures results obtained from isentropicstreamtube equations have been plotted for comparison.Since viscous effects are of little importance in the coreregion of the nozzle, the flow behaves close to the acceler-
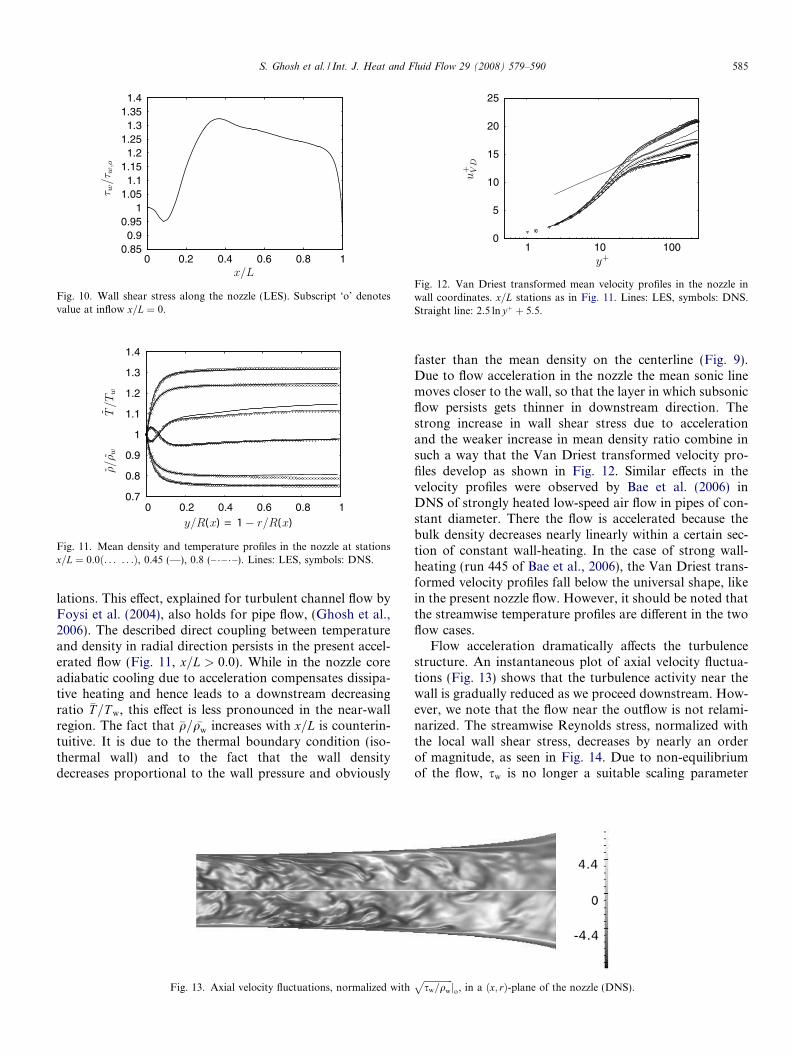
ated isentropic flow with decreasing pressure, density andtemperature. Of course, we cannot expect full agreementbetween the real flow and the streamtube results, becausestreamline curvature, which sets in at x=L � 0:1 affectsthe near-wall turbulence activity and, in turn, also the flowand the thermodynamic variables on the axis. The wallshear stress first shows an increase and a subsequent slowdecrease (Fig. 10). It should be noted that the abrupt jumpin the wall shear stress near the outflow is a consequence ofthe outflow boundary condition which, however, remainslocal. In what follows, sw is used for normalization at posi-tions x/L = 0.0, 0.45, and 0.8. At these downstream posi-tions, sw is obviously larger than in the pipe, as a resultof acceleration.
Fig. 11 presents the streamwise evolution of radial meantemperature and density profiles and a comparison of DNSand LES data, which proves good agreement. In fullydeveloped pipe flow (x=L ¼ 0:0) mean density and temper-ature are directly linked in radial direction, since the radialpressure gradient is negligibly small. The heat generated bydissipation in the wall layer strongly increases the meantemperature and leads to a heat flux out of the pipe. Themean density in turn drops from its high wall value to alow core value and thus reduces the pressure–strain corre-
0.85 0.9
0.95 1
1.05 1.1
1.15 1.2
1.25 1.3
1.35 1.4
0 0.2 0.4 0.6 0.8 1
Fig. 10. Wall shear stress along the nozzle (LES). Subscript ‘o’ denotesvalue at inflow x=L ¼ 0.
0.7
0.8
0.9
1
1.1
1.2
1.3
1.4
0 0.2 0.4 0.6 0.8 1
Fig. 11. Mean density and temperature profiles in the nozzle at stationsx=L ¼ 0:0ð. . . . . .Þ, 0.45 (—), 0.8 (– – –). Lines: LES, symbols: DNS.
0
5
10
15
20
25
1 10 100
Fig. 12. Van Driest transformed mean velocity profiles in the nozzle inwall coordinates. x=L stations as in Fig. 11. Lines: LES, symbols: DNS.Straight line: 2:5 ln yþ þ 5:5.
S. Ghosh et al. / Int. J. Heat and Fluid Flow 29 (2008) 579–590 585
lations. This effect, explained for turbulent channel flow byFoysi et al. (2004), also holds for pipe flow, (Ghosh et al.,2006). The described direct coupling between temperatureand density in radial direction persists in the present accel-erated flow (Fig. 11, x=L > 0:0). While in the nozzle coreadiabatic cooling due to acceleration compensates dissipa-tive heating and hence leads to a downstream decreasingratio �T=T w, this effect is less pronounced in the near-wallregion. The fact that �q= �qw increases with x=L is counterin-tuitive. It is due to the thermal boundary condition (iso-thermal wall) and to the fact that the wall densitydecreases proportional to the wall pressure and obviously
Fig. 13. Axial velocity fluctuations, normalized with
faster than the mean density on the centerline (Fig. 9).Due to flow acceleration in the nozzle the mean sonic linemoves closer to the wall, so that the layer in which subsonicflow persists gets thinner in downstream direction. Thestrong increase in wall shear stress due to accelerationand the weaker increase in mean density ratio combine insuch a way that the Van Driest transformed velocity pro-files develop as shown in Fig. 12. Similar effects in thevelocity profiles were observed by Bae et al. (2006) inDNS of strongly heated low-speed air flow in pipes of con-stant diameter. There the flow is accelerated because thebulk density decreases nearly linearly within a certain sec-tion of constant wall-heating. In the case of strong wall-heating (run 445 of Bae et al., 2006), the Van Driest trans-formed velocity profiles fall below the universal shape, likein the present nozzle flow. However, it should be noted thatthe streamwise temperature profiles are different in the twoflow cases.
Flow acceleration dramatically affects the turbulencestructure. An instantaneous plot of axial velocity fluctua-tions (Fig. 13) shows that the turbulence activity near thewall is gradually reduced as we proceed downstream. How-ever, we note that the flow near the outflow is not relami-narized. The streamwise Reynolds stress, normalized withthe local wall shear stress, decreases by nearly an orderof magnitude, as seen in Fig. 14. Due to non-equilibriumof the flow, sw is no longer a suitable scaling parameter
ffiffiffiffiffiffiffiffiffiffiffiffiffisw=qw
pjo, in a ðx; rÞ-plane of the nozzle (DNS).
-0.05
0
0.05
0.1
0.15
0.2
0.25
0 0.2 0.4 0.6 0.8 1
Fig. 16. Contributions to production of the axial Reynolds stress in thenozzle at stations x=L ¼ 0:0 (dotted line) and 0.45 (solid line). sh: meanshear, dil: mean dilatation, es: extra rate of strain. Lines: LES, symbols:DNS. All terms are normalized by s2
w=�l.
0 1 2 3 4 5 6 7 8 9
0 0.2 0.4 0.6 0.8 1
Fig. 14. Streamwise Reynolds stress in the nozzle normalized with thelocal wall shear stress. Lines: LES, symbols: DNS. x=L stations as inFig. 11.
586 S. Ghosh et al. / Int. J. Heat and Fluid Flow 29 (2008) 579–590
for collapsing Reynolds stress profiles in the core region, asit is for fully-developed pipe flow (Ghosh et al., 2006).Fig. 15 presents the downstream evolution of the Reynoldsshear stress and the total shear stress. Here again, a dra-matic decrease of all terms in the flow direction is observed.Finally, a strong decay of the solenoidal TKE dissipationrate and a decrease of the peak value of the turbulent Machnumber from 0.25 to 0.17 are observed in this flow (notshown here for brevity).
In order to understand the reasons for these changes inthe nozzle, we examine production terms and pressure–strain correlations in the Reynolds stress budgets ofqu00x u00x=2, qu00x u00r , qu00r u00r =2 and express them in a cylindricalðx;/; rÞ-coordinate system which differs only weakly fromthe computational coordinate system. In such a systemthe radial budget contains production terms as well. Wedistinguish between ‘kinetic’ and ‘enthalpic’ productionand split, following Gaviglio et al. (1977), the first into con-tributions due to shear, extra rate of strain and mean dila-tation. It should be noted that production by meandilatation is the only explicit compressibility effect, sinceproduction by shear and extra rate of strain appear alsoin incompressible pipe flow with varying cross-section.
0
0.2
0.4
0.6
0.8
1
0 0.2 0.4 0.6 0.8 1
Fig. 15. Reynolds shear stress and total shear stress in the nozzlenormalized with the local wall shear stress. Lines: LES, symbols: DNS.x=L stations as in Fig. 11.
The ‘kinetic’ production terms in the nozzle (and diffuser)flow without swirl are
P xx ¼ �qu00x u00ro eux
or|fflfflfflfflfflfflfflffl{zfflfflfflfflfflfflfflffl}shear
� 1
3qu00x u00x
o eul
oxl|fflfflfflfflfflfflfflfflffl{zfflfflfflfflfflfflfflfflffl}mean dilatation
�qu00x u00xo eux
ox� 1
3
o eul
oxl
� �|fflfflfflfflfflfflfflfflfflfflfflfflfflfflfflfflfflfflffl{zfflfflfflfflfflfflfflfflfflfflfflfflfflfflfflfflfflfflffl}
extra rate of strain
P xr ¼ �qu00r u00ro eux
or|fflfflfflfflfflfflfflffl{zfflfflfflfflfflfflfflffl}shear1
�qu00x u00xo eur
ox|fflfflfflfflfflfflffl{zfflfflfflfflfflfflffl}shear2
� 2
3qu00x u00r
o eul
oxl|fflfflfflfflfflfflfflfflffl{zfflfflfflfflfflfflfflfflffl}mean dilatation
�qu00x u00ro eux
oxþ o eur
or� 2
3
o eul
oxl
� �|fflfflfflfflfflfflfflfflfflfflfflfflfflfflfflfflfflfflfflfflfflfflfflfflffl{zfflfflfflfflfflfflfflfflfflfflfflfflfflfflfflfflfflfflfflfflfflfflfflfflffl}
extra rate of strain
P rr ¼ �qu00x u00ro eur
ox|fflfflfflfflfflfflffl{zfflfflfflfflfflfflffl}shear
� 1
3qu00r u00r
o eul
oxl|fflfflfflfflfflfflfflfflffl{zfflfflfflfflfflfflfflfflffl}mean dilatation
�qu00r u00ro eur
or� 1
3
o eul
oxl
� �|fflfflfflfflfflfflfflfflfflfflfflfflfflfflfflfflfflfflffl{zfflfflfflfflfflfflfflfflfflfflfflfflfflfflfflfflfflfflffl}
extra rate of strain
-0.01
0
0.01
0.02
0.03
0.04
0.05
0.06
0.07
0 0.2 0.4 0.6 0.8 1
Fig. 17. Contributions to production of the Reynolds shear stress in thenozzle at stations x=L ¼ 0:0 (dotted line), 0:45 (solid line). sh1: mean shear(shear1), dil: mean dilatation. Lines: LES, symbols: DNS. All terms arenormalized by s2
w=�l.

-0.01
-0.005
0
0.005
0.01
0.015
0 0.2 0.4 0.6 0.8 1
Fig. 19. Pressure–strain correlation Prr in the nozzle. Lines: LES atx=L ¼ 0:0 ð. . . . . .Þ, 0.45 (—), 0.8 (– – –). ( ), (�): Prr (DNS) atx=L ¼ 0; 0:45, respectively. Terms are normalized by s2
w=�l.
S. Ghosh et al. / Int. J. Heat and Fluid Flow 29 (2008) 579–590 587
Figs. 16 and 17 show the contributions to P xx and P xr inthe nozzle at x=L ¼ 0:45 and in fully-developed pipe flow(which corresponds to the position x=L ¼ 0), normalizedwith local values of s2
w=�l. Among the two production byshear terms in P xr, the first is dominant and the second isnegligible in this specific nozzle. Clearly, compressibilityin the form of mean dilatation counteracts the shear pro-duction of the qu00x u00x , qu00x u00r components. Production byacceleration (extra rate of strain) does the same, at leastin the streamwise component. The production rates byshear are themselves reduced by the stabilization of thetwo stresses qu00x u00r and qu00r u00r . Again, good agreement isfound between the DNS and LES results. In the qu00x u00x -bud-get enthalpic production appears on the RHS in the form�u00x
o�pox and has only a very small positive value (not shown).
The pressure–strain correlations can be split into devia-toric and dilatational parts
Pxx ¼ p0ou00xox� d 0
3
� �þ 1
3p0d 0;
Pxr ¼ p0ou00roxþ 1
roru00xor
� �;
Prr ¼1
rp0
oru00ror� d 0
3
� �þ 1
3p0d 0:
d 0 represents dilatational fluctuations. Profiles of Pxx, Pxr,normalized with local values of s2
w=�l, are presented in Figs.18 and 19 for stations x=L ¼ 0:0; 0:45; 0:8. The dramaticreduction of the deviatoric parts in the nozzle is obvious.The contribution of the pressure-dilatation correlation isvery small. Besides the weak production by shear, thePrr-term is the only source term in the radial stress budget.The streamwise decay of qu00r u00r is therefore mainly due tothe reduction of the pressure–strain correlation which canbe traced back to the reduction of pressure and velocity-gradient fluctuations. It remains to be shown which rolemean dilatation, extra strain rate and mean density varia-tion play in damping pressure fluctuations.
-0.03
-0.025
-0.02
-0.015
-0.01
-0.005
0
0.005
0 0.2 0.4 0.6 0.8 1
Fig. 18. Pressure–strain correlation Pxx in the nozzle. Lines: LES atx=L ¼ 0:0ð. . . . . .Þ, 0.45 (—), 0.8 (– – –). ( ), (�): Pxx (DNS) atx=L ¼ 0; 0:45, respectively. (), p0d 0=3 (LES) at x=L ¼ 0:45. Terms arenormalized by s2
w=�l.
4.3. Diffuser flow
Supersonic turbulent diffuser flow is not just the oppo-site of nozzle flow. Its behaviour strongly depends on therate of deceleration, and the Mach and Reynolds numbersat the inlet. We recall that the inlet Mach and friction Rey-nolds numbers are 1.8 and 280. The chosen higher incom-ing Mach and Reynolds numbers (they are 1.5 and 250 fornozzle flow) avoid noticeable transonic regions at the endof the diffuser. Moreover, the axial profiles of centerlineMach number and pressure (Fig. 20), as well as centerlinedensity and temperature (Fig. 21) do not follow predictionsof the isentropic streamtube equations. Wall and centerlinepressure, density and temperature distributions grow muchfaster due to trains of compression and expansion wavesreminding us of shock trains observed in experiments atstronger flow deceleration (Matsuo et al., 1999). The wallshear stress in this flow first decreases and subsequentlyincreases, see Fig. 22. At positions x/L = 0.2, 0.45 whereflow conditions are investigated below, it is remarkablylower than at the inflow plane (x/L = 0.0) which corre-sponds to fully-developed pipe flow.
0.9
1
1.1
1.2
1.3
1.4
1.5
1.6
1.7
1.8
0 0.2 0.4 0.6 0.8 1
Fig. 20. Axial variation of cross-sectional area, mean centerline Machnumber and pressure in the diffuser. (—) LES, (–––) Isentropic stream-tube. Subscript ‘o’ denotes value at inflow x=L ¼ 0.

0.95
1
1.05
1.1
1.15
1.2
1.25
1.3
1.35
0 0.2 0.4 0.6 0.8 1
Fig. 21. Axial variation of mean centerline density and temperature in thediffuser. (—-) LES, (–––) Isentropic streamtube. Subscript ‘o’ denotesvalue at inflow x=L ¼ 0.
0.6
0.7
0.8
0.9
1
1.1
1.2
1.3
1.4
1.5
0 0.2 0.4 0.6 0.8 1
Fig. 22. Wall shear stress along the diffuser. Subscript ‘o’ denotes value atinflow x=L ¼ 0.
0.6 0.7 0.8 0.9
1 1.1 1.2 1.3 1.4 1.5 1.6
0 0.2 0.4 0.6 0.8 1
Fig. 23. Mean density and temperature profiles in the diffuser at stationsx=L ¼ 0:0ð. . . . . .Þ, 0.2 (—), 0.45 (– – –).
0
5
10
15
20
25
30
1 10 100
Fig. 24. Van Driest transformed mean velocity profiles in the diffuser inwall coordinates. x=L stations as in Fig. 23. Straight line: 2:5 ln yþ þ 5:5.
588 S. Ghosh et al. / Int. J. Heat and Fluid Flow 29 (2008) 579–590
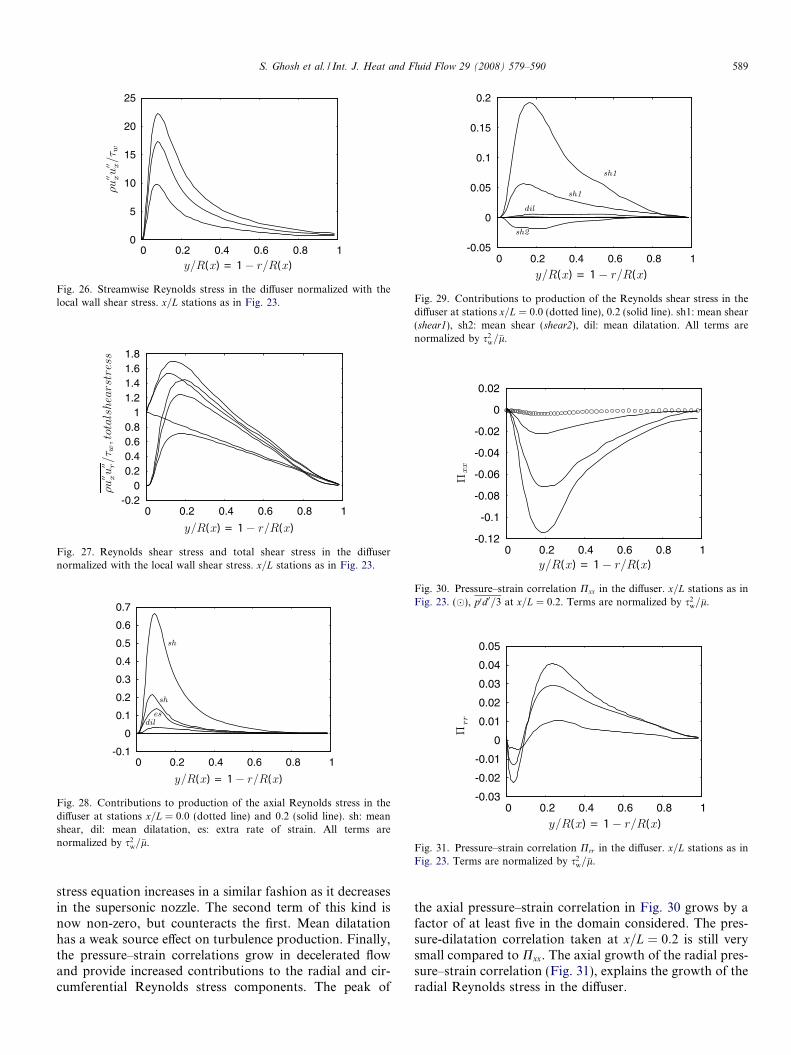
Fig. 23 reveals that the mean temperature grows in thediffuser in flow direction due to compression and increaseddissipation rate (not shown). As a consequence the meandensity ratio decays in flow direction. The Van Driesttransformed mean axial velocity now reaches levels higherthan in fully developed pipe flow, see Fig. 24. This is pre-dominantly a result of the streamwise reduction of wallshear stress. Increased turbulence activity in the near-wallregion of the diffuser is observed in the plot of instanta-neous axial velocity fluctuations (Fig. 25) The Reynoldsstresses provide the proof of the enhanced turbulence activ-ity. As an example we show the streamwise Reynolds stressin Fig. 26 and the total as well as Reynolds shear stress in
Fig. 25. Axial velocity fluctuations, normalized with
Fig. 27. Although the flow deceleration is fairly weak (thecenterline Mach number decreases from 1.8 to 1.45) theReynolds stresses increase by roughly a factor of 2. As atypical sign of decelerated wall-bounded flow, the maxi-mum shear stress increases in magnitude and moves awayfrom the wall. We also note a growth in the solenoidal dis-sipation rate and the turbulent Mach number and areaware that an LES can predict trends of turbulent dissipa-tion rates reliably, but not their absolute values. Theenhanced turbulence activity is reflected in the productionof Reynolds stresses by mean shear, extra rate of strainand mean dilatation. Fig. 28 shows that, in contrast tothe nozzle flow, mean dilatation and extra rates of strainnow act as sources producing streamwise Reynolds stress.The first production by shear term (Fig. 29) in the shear
ffiffiffiffiffiffiffiffiffiffiffiffiffisw=qw
pjo, in a ðx; rÞ-plane of the diffuser (LES).
-0.12
-0.1
-0.08
-0.06
-0.04
-0.02
0
0.02
0 0.2 0.4 0.6 0.8 1
Fig. 30. Pressure–strain correlation Pxx in the diffuser. x=L stations as inFig. 23. (), p0d 0=3 at x=L ¼ 0:2. Terms are normalized by s2
w=�l.
-0.03
-0.02
-0.01
0
0.01
0.02
0.03
0.04
0.05
0 0.2 0.4 0.6 0.8 1
Fig. 31. Pressure–strain correlation Prr in the diffuser. x=L stations as inFig. 23. Terms are normalized by s2
w=�l.
-0.05
0
0.05
0.1
0.15
0.2
0 0.2 0.4 0.6 0.8 1
Fig. 29. Contributions to production of the Reynolds shear stress in thediffuser at stations x=L ¼ 0:0 (dotted line), 0:2 (solid line). sh1: mean shear(shear1), sh2: mean shear (shear2), dil: mean dilatation. All terms arenormalized by s2
w=�l.
-0.1
0
0.1
0.2
0.3
0.4
0.5
0.6
0.7
0 0.2 0.4 0.6 0.8 1
Fig. 28. Contributions to production of the axial Reynolds stress in thediffuser at stations x=L ¼ 0:0 (dotted line) and 0:2 (solid line). sh: meanshear, dil: mean dilatation, es: extra rate of strain. All terms arenormalized by s2
w=�l.
-0.2 0
0.2 0.4 0.6 0.8
1 1.2 1.4 1.6 1.8
0 0.2 0.4 0.6 0.8 1
Fig. 27. Reynolds shear stress and total shear stress in the diffusernormalized with the local wall shear stress. x=L stations as in Fig. 23.
0
5
10
15
20
25
0 0.2 0.4 0.6 0.8 1
Fig. 26. Streamwise Reynolds stress in the diffuser normalized with thelocal wall shear stress. x=L stations as in Fig. 23.
S. Ghosh et al. / Int. J. Heat and Fluid Flow 29 (2008) 579–590 589
stress equation increases in a similar fashion as it decreasesin the supersonic nozzle. The second term of this kind isnow non-zero, but counteracts the first. Mean dilatationhas a weak source effect on turbulence production. Finally,the pressure–strain correlations grow in decelerated flowand provide increased contributions to the radial and cir-cumferential Reynolds stress components. The peak of
the axial pressure–strain correlation in Fig. 30 grows by afactor of at least five in the domain considered. The pres-sure-dilatation correlation taken at x=L ¼ 0:2 is still verysmall compared to Pxx. The axial growth of the radial pres-sure–strain correlation (Fig. 31), explains the growth of theradial Reynolds stress in the diffuser.
590 S. Ghosh et al. / Int. J. Heat and Fluid Flow 29 (2008) 579–590
5. Conclusions
Supersonic turbulent pipe flow subjected to gradualacceleration/deceleration in a nozzle/diffuser has beeninvestigated by means of LES in order to assess the effectsof mean dilatation and extra rate of strain on the turbu-lence structure. Occasionally, DNS has been used to vali-date the LES results. Although the rates of acceleration/deceleration and mean dilatation are small, the decrease/increase in Reynolds stress components is large. At thesame time dilatational fluctuations are only weaklyaffected, so that explicit compressibility terms (like pres-sure-dilatation and compressible dissipation rate) remainsmall. While extra rates of strain and mean dilatation actas small source/sink terms in the Reynolds stress transportequations, the strong modification of production due toshear caused by large changes in pressure–strain correla-tions is the major cause of decay/amplification of Reynoldsstresses in these flows. It remains to be shown in which wayextra-rates of strain, mean dilatation and mean densityvariations affect pressure and velocity-gradient fluctuationsand thus control the variation of pressure–strain correla-tions. This is the aim of future work.
References
Adams, N.A., Leonard, A., 1999. Deconvolution of subgrid scales for thesimulation of shock-turbulence interaction. In: Voke, P., Sandham,N.D., Kleiser, L. (Eds.), Direct and Large-Eddy Simulation III. p. 201.
Adams, N.A., Shariff, K., 1996. A high-resolution hybrid compact-ENOscheme for shock-turbulence interaction problems. Journal of Com-putational Physics 127, 27–51.
Bae, J.H., Yoo, J.Y., Choi, H., McEligot, D.M., 2006. Effects of largedensity variation on strongly heated internal air flows. Physics ofFluids, 18.
Bradshaw, P., 1974. The effect of mean compression or dilatation on theturbulence structure of supersonic boundary layers. Journal of FluidMechanics 63, 449–464.
Bradshaw, P., 1977. Compressible turbulent shear layers. Annual Reviewof Fluid Mechanics 9, 33–52.
Cambon, C., Coleman, G.N., Mansour, N.N., 1993. Rapid distortionanalysis and direct simulation of compressible homogeneous turbu-
lence at finite mach numbers. Journal of Fluid Mechanics 257, 641–665.
Dussauge, J.P., Gaviglio, J., 1987. The rapid expansion of a supersonicturbulent flow: role of bulk dilatation. Journal of Fluid Mechanics 174,81–112.
Foysi, H., Sarkar, S., Friedrich, R., 2004. Compressibility effects andturbulence scalings in supersonic channel flow. Journal of FluidMechanics 509, 207–216.
Gaviglio, J., Dussauge, J., Debieve, J., Favre, A., 1977. Behaviour of aturbulent flow, strongly out of equilibrium at supersonic speeds.Physics of Fluids 20 (10), 179–192.
Ghosh, S., Sesterhenn, J., Friedrich, R., 2006. DNS and LES ofCompressible Turbulent Pipe Flow with Isothermal Wall. Direct andlarge eddy simulation VI. Springer.
Lele, S., 1992. Compact finite difference schemes with spectral-likeresolution. Journal of Computational Physics 103, 16–42.
Mahesh, K., Lele, S.K., Moin, P., 1994. The response of anisotropicturbulence to rapid homogeneous one-dimensional compression.Physics of Fluids 6 (2), 1062.
Mathew, J., Lechner, R., Foysi, H., Sesterhenn, J., Friedrich, R., 2003. Anexplicit filtering method for large eddy simulation of compressibleflows. Physics of Fluids 15, 2279–2289.
Mathew, J., Foysi, H., Friedrich, R., 2006. A new approach to LES basedon explicit filtering. International Journal of Heat and Fluid Flow 27,594–602.
Matsuo, K., Miyazato, Y., Kim, H., 1999. Shock train and pseudo-shockphenomena in internal gas flows. Progress in Aerospace Sciences 35,33–100.
Mohseni, K., Colonius, T., 2000. Numerical treatment of polar coordinatesingularities. Journal of Computational Physics 157, 787–795.
Poinsot, T.J., Lele, S.K., 1992. Boundary conditions for direct simulationsof compressible viscous flows. Journal of Computational Physics 101,104–129.
Schlueter, J.U., Shankaran, S., Kim, S., Pitsch, H., Alonso, J.J., 2002.Integration of RANS and LES flow solvers: interface validation.Annual Research Briefs, CTR, Stanford, pp. 155–166.
Sesterhenn, J., 2001. A characteristic-type formulation of the Navier–Stokes equations for high order upwind schemes. Computers andFluids 30, 37–67.
Spina, E.F., Smits, A.J., Robinson, S.K., 1994. The physics of supersonicturbulent boundary layers. Annual Review of Fluid Mechanics 26,287–319.
Stolz, S., Adams, N.A., Kleiser, L., 2001. An approximate deconvolutionmodel for large-eddy simulation with application to incompressibleflows. Physics of Fluids 13, 997–1015.
Williamson, J.K., 1980. Low-storage Runge–Kutta schemes. Journal ofComputational Physics 35, 48–56.