Large-Eddy Simulation of a stratocumulus to cumulus transition as observed during the First...
17
Large-Eddy Simulation of a stratocumulus to cumulus transition as observed during the First Lagrangian of ASTEX Stephan de Roode and Johan van der Dussen Delft University of Technology, Netherlands cumulus penetrating stratocumulus, Bretagne, France View on Delft, Johannes Vermeer, 1661
-
Upload
suzanna-preston -
Category
Documents
-
view
215 -
download
0
Transcript of Large-Eddy Simulation of a stratocumulus to cumulus transition as observed during the First...
Large-Eddy Simulation of a stratocumulus to
cumulus transition as observed during the First
Lagrangian of ASTEX
Stephan de Roode and Johan van der Dussen
Delft University of Technology, Netherlands
cumulus penetrating stratocumulus, Bretagne, France View on Delft, Johannes Vermeer, 1661

ASTEX First Lagrangian
12-14 June 1992
Contents
ASTEX First Lagrangian
- observations
- previous numerical studies
Large-Eddy Simulation results
- mean state
- turbulence

Observed stratocumulus to cumulus transition
Bretherton and Pincus, 1995
Bretherton et al, 1995
Duynkerke et al, 1995
De Roode and Duynkerke, 1997

Observed stratocumulus to cumulus transition
Bretherton and Pincus, 1995
Bretherton et al, 1995
Duynkerke et al, 1995
De Roode and Duynkerke, 1997
GCSS case,1995
EUCREM/GCSS,Duynkerke et al, 1999
like GCSS ATEX case,Stevens et al, 2001
Study of ASTEX First Lagrangian wtih SCM and 2D models by Bretherton et al, 1999:
"there are substantial quantitative differences in the cloud cover and liquid water path between models."

Satellite images Flights 1 and 5

Inversion jumps
-10
-8
-6
-4
-2
0
2
0 5 10 15 20
Δ2 = 0
Δθv = 0
FIRE I mean
ASTEX Flight 2
ASTEX Flight 3
ΔYCOMS II
Δ θl [ ]K
Buoyancy reversalcriterion
DYCOMS II
EUROCStransition to cumulus, increases
EUROCS FIRE case
ASTEX
Lock (2009)

Entrainment rates
0
0.5
1
1.5
2
2.5 DALES oldother LESDALES 3.1DALES 3.1 HRobservations
ASTEXA209
ASTEXRF06
FIRE I DYCOMS IIRF01
too large?
Dales paper to be submitted by Heus et al.

Set-up of simulation
Initialization
Take vertical profiles from GCSS ASTEX A209 intercomparison case
Time varying forcing
SST and subsidence rate from Bretherton et al. (1999)
Geostrophic winds from observations
Dutch Atmospheric Large-Eddy Simulation (Dales) model (Heus et al,
2009)
1283 grid points (6.4x6.4x2.5 km3) on 32 processors
Monotone advection ("kappa") scheme for passive scalars
Time step t = 0.5 s (Runge-Kutta)
Bulk microphysics (Khairoutdinov and Kogan 2000)
Longwave radiation: "GCSS WG1" parameterization
Shortwave radiation: "EUROCS FIRE" delta-Eddington, Independent Pixel
Approximation
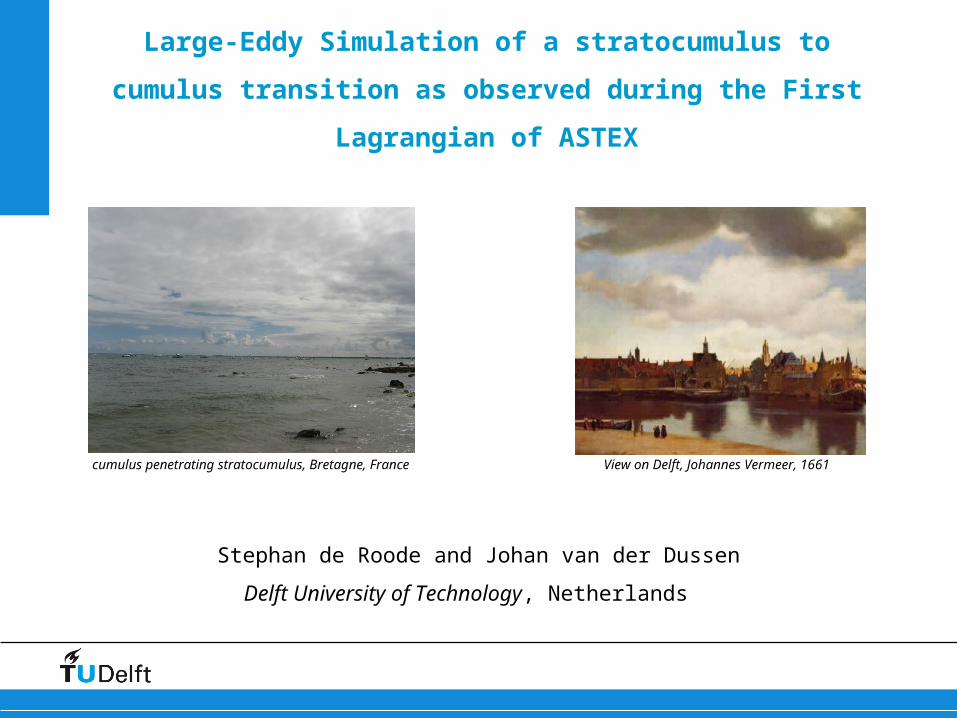
Simulated mean cloud-top height

Simulated cloud boundaries
mean cloud top
mean cloud base
lowest cloud base

Entrainment rate
0
0.5
1
1.5
2
0 5 10 15 20 25 30 35 40
ASTEX Lagrangianold GCSS mean
time (hours)
Including microphysics (rain and cloud droplet sedimentation) decreases entrainment rate

Cloud liquid water path evolution
0
50
100
150
200
0 5 10 15 20 25 30 35 40
time (hours)
0 10
2000
cloud fraction0 1
0
2000
cloud fraction0 1
0
2000
cloud fraction

Mean state Hour 9 Mean state
Hour 19
2 4 6 8 10 120
500
1000
1500
2000
2500
3000
Total water content (g/kg)
285 290 295 300 305 3100
500
1000
1500
2000
2500
3000
Liquid water potential temperature [K]
290 295 300 305 3100
500
1000
1500
2000
2500
3000
Liquid water potential temperature [K]
0 2 4 6 8 10 120
500
1000
1500
2000
2500
3000
Total water content (g/kg)
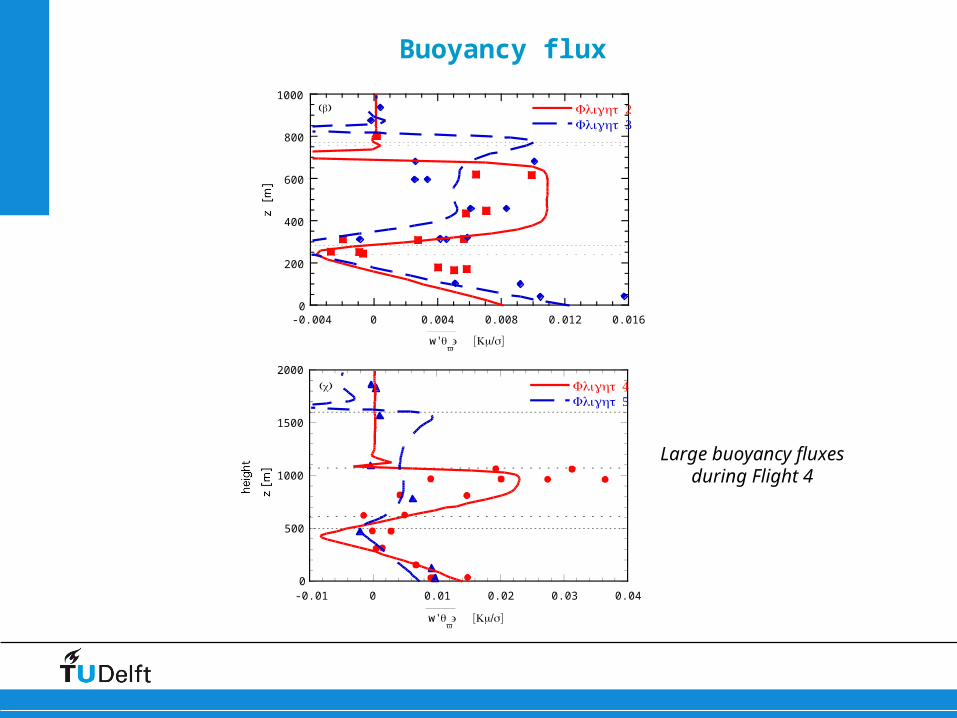
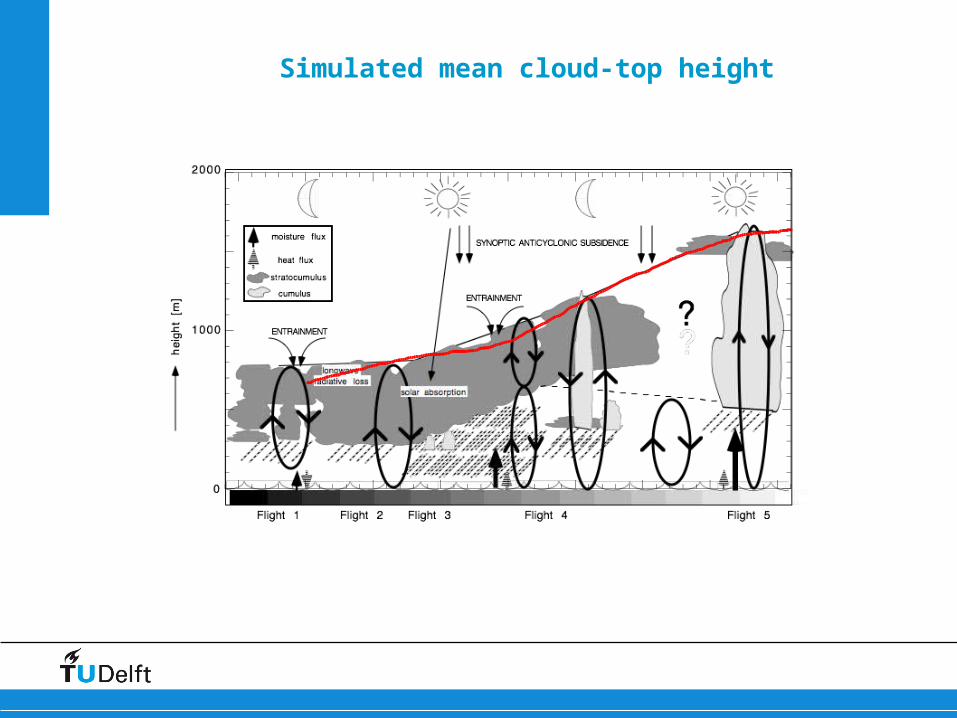
Buoyancy flux
-0.004 0 0.004 0.008 0.012 0.0160
200
400
600
800
1000
w'θv [ / ]' Km s
( )b Flight 2Flight 3
-0.01 0 0.01 0.02 0.03 0.040
500
1000
1500
2000
w'θv [ / ]' Km s
( )c Flight 4Flight 5
Large buoyancy fluxesduring Flight 4
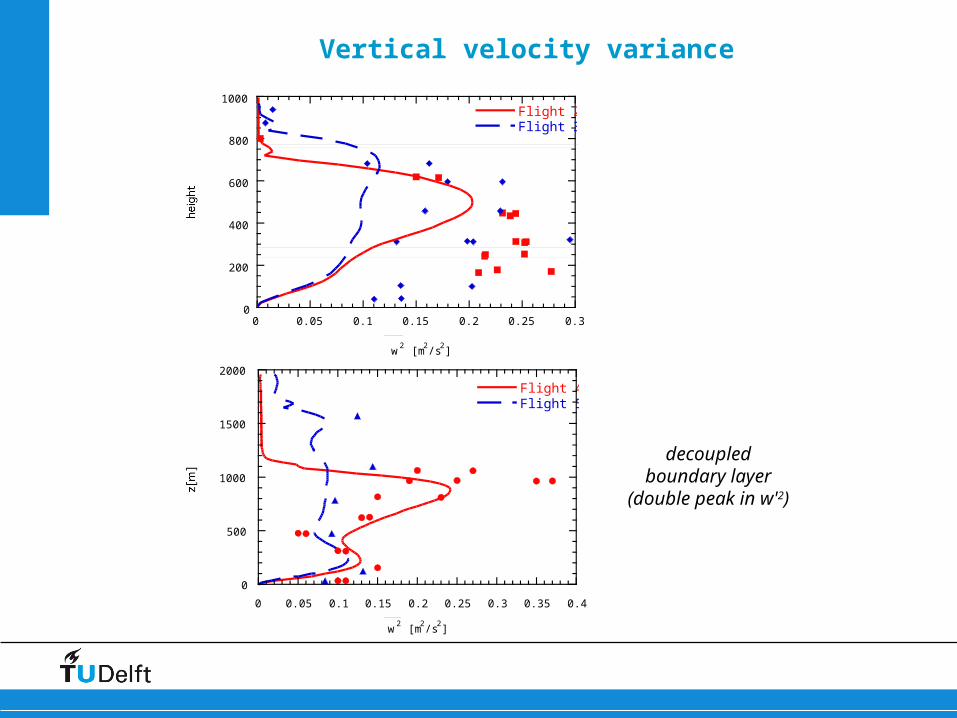
Vertical velocity variance
Flight 4Flight 5
0 0.05 0.1 0.15 0.2 0.25 0.3 0.35 0.4
0
500
1000
1500
2000
w2 [m
2/s
2]
0 0.05 0.1 0.15 0.2 0.25 0.30
200
400
600
800
1000
w2 [m
2/s
2]
Flight 2Flight 3
decoupledboundary layer
(double peak in w'2)
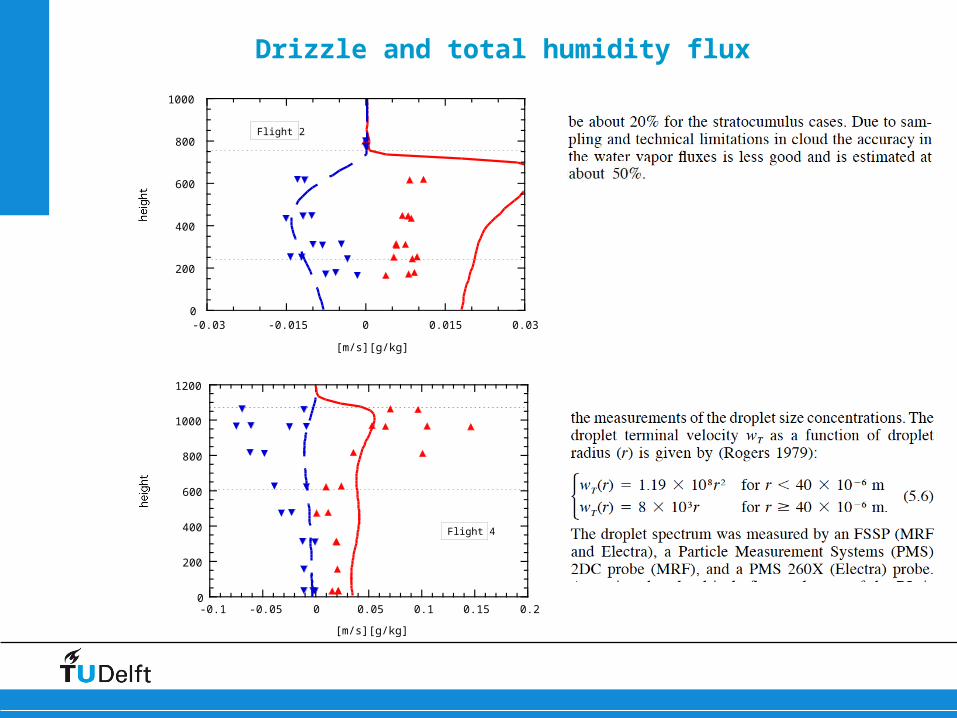
Drizzle and total humidity flux
-0.03 -0.015 0 0.015 0.030
200
400
600
800
1000
[m/s][g/kg]
Flight 2
-0.1 -0.05 0 0.05 0.1 0.15 0.20
200
400
600
800
1000
1200
Flight 4
[m/s][g/kg]
Summary
Strong points
+ aircraft observations of turbulence and entrainment rate
+ critical regime with regard to cloud fraction
+ passes through two previous intercomparison cases (revisiting Flights 2 and 3)
Weak points
- quite large uncertainty in total humidity fluxes
Status of the case
- refine forcing of free atmosphere (longwave radiative cooling, geostrophic forcing)
Research questions: Study and provide detailed 3D LES fields on a large horizontal domain
+ connection to radiation community (McICA)
+ length scale analysis (NWP horizontal resolution -> 1 km)