Large-Eddy Simulation in typical industrial bends -...
18
03/03/2014 Products Solutions Services Large-Eddy Simulation of typical industrial bends In-plane and out-of-plane bend at Re =20’000 by V. Kumar, B. Kissling*, P. Panathansiou and F. Aydin * Experimental data Slide 1 V. Kumar
Transcript of Large-Eddy Simulation in typical industrial bends -...
03/03/2014
Products Solutions Services
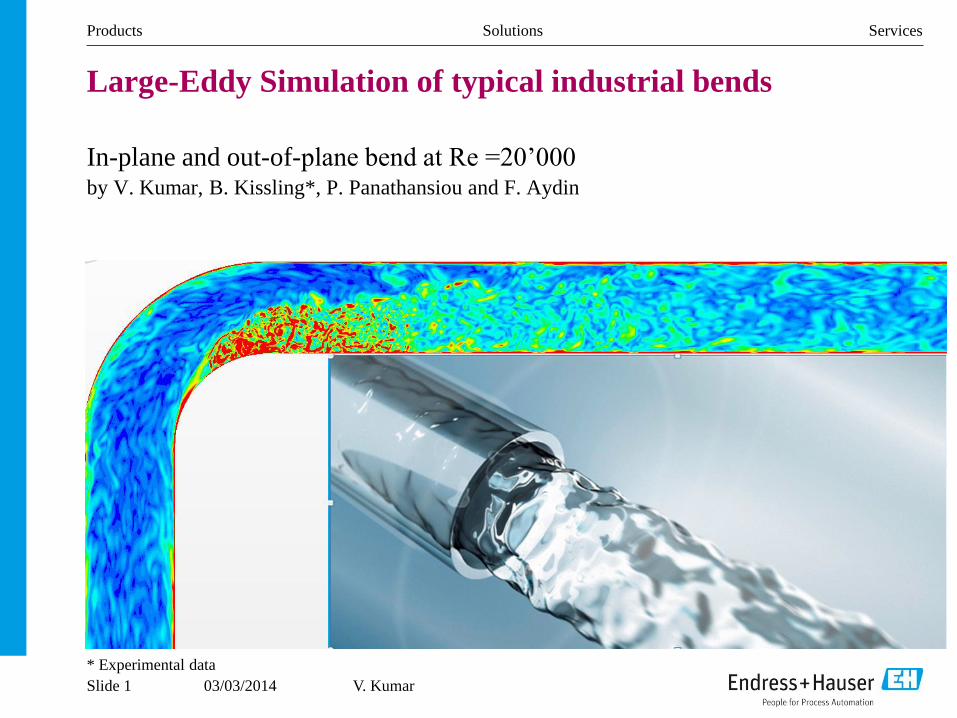
Large-Eddy Simulation of typical industrial bends
In-plane and out-of-plane bend at Re =20’000 by V. Kumar, B. Kissling*, P. Panathansiou and F. Aydin
* Experimental data
Slide 1 V. Kumar
03/03/2014
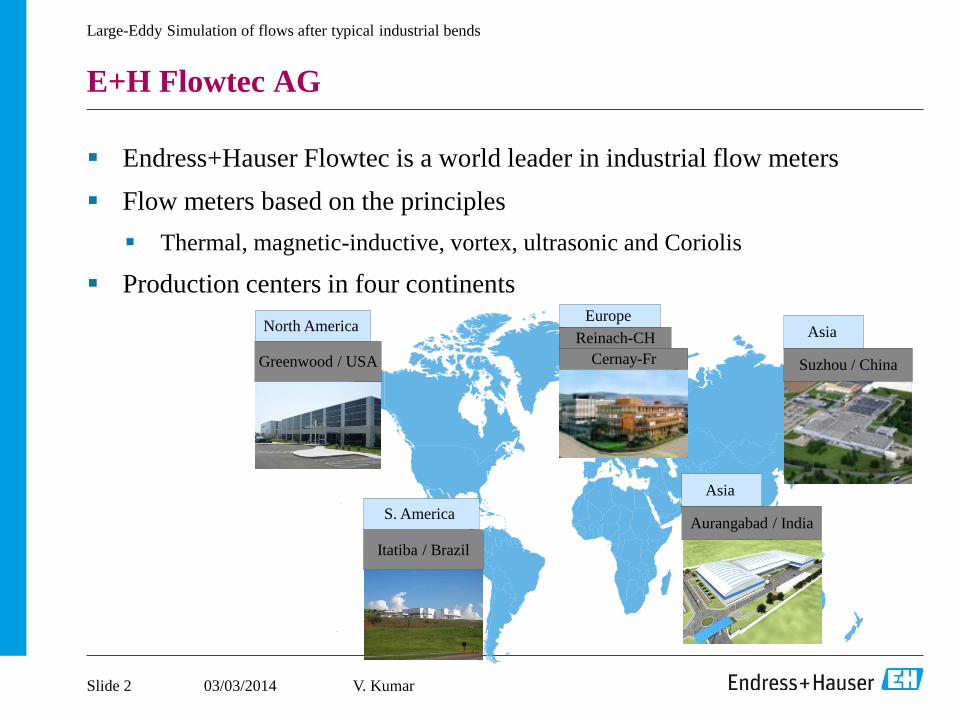
E+H Flowtec AG
Endress+Hauser Flowtec is a world leader in industrial flow meters
Flow meters based on the principles
Thermal, magnetic-inductive, vortex, ultrasonic and Coriolis
Production centers in four continents
Large-Eddy Simulation of flows after typical industrial bends
Reinach-CH
Cernay-Fr
Europe
Asia
North America Asia
Greenwood / USA Suzhou / China
Aurangabad / India
Itatiba / Brazil
S. America
Slide 2 V. Kumar
03/03/2014
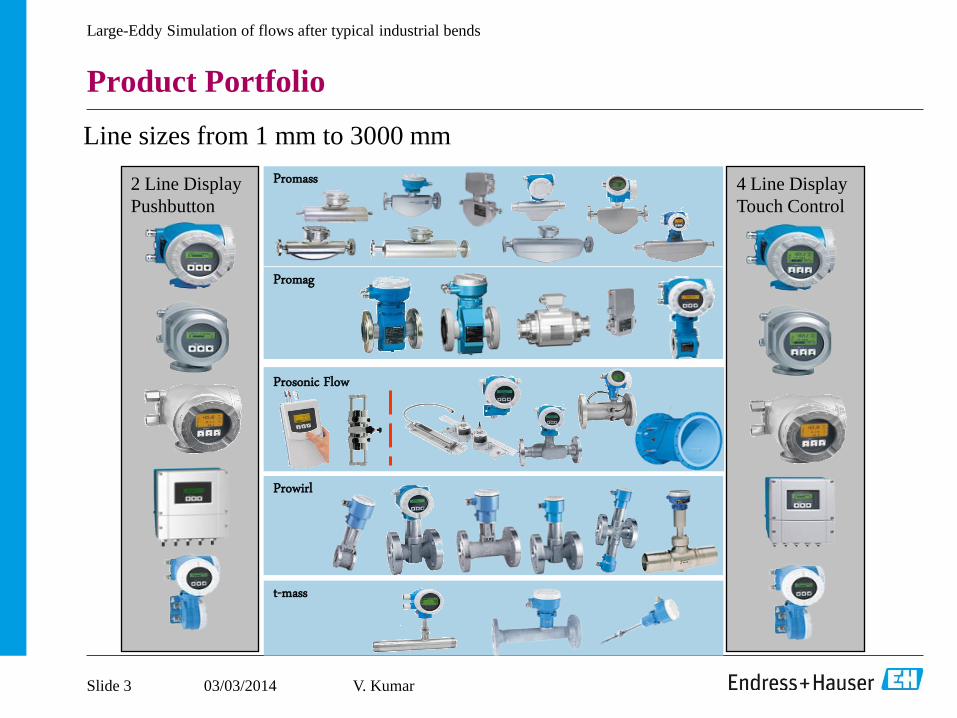
Product Portfolio
Line sizes from 1 mm to 3000 mm
Large-Eddy Simulation of flows after typical industrial bends
4 Line Display
Touch Control
2 Line Display
Pushbutton
Prosonic Flow
Promass
Promag
Prowirl
t-mass
Slide 3 V. Kumar
03/03/2014
Where CFD is playing its role?
Optimizing the design of the flow meters
Flow meters can resolve effects of the order of 0.05% to 1%
highly accurate models and high quality grids are required
To investigate installation effects on the flow meters
how does the flow develops after a disturbance
Typical disturbances are bends, diffusors, reducers
Large-Eddy Simulation of flows after typical industrial bends
→ It is very important for a turbulence model to accurately model the effects near
the wall
Slide 4 V. Kumar
03/03/2014
Bend Simulations
Large-Eddy Simulation of flows after typical industrial bends
Slide 5 V. Kumar
03/03/2014
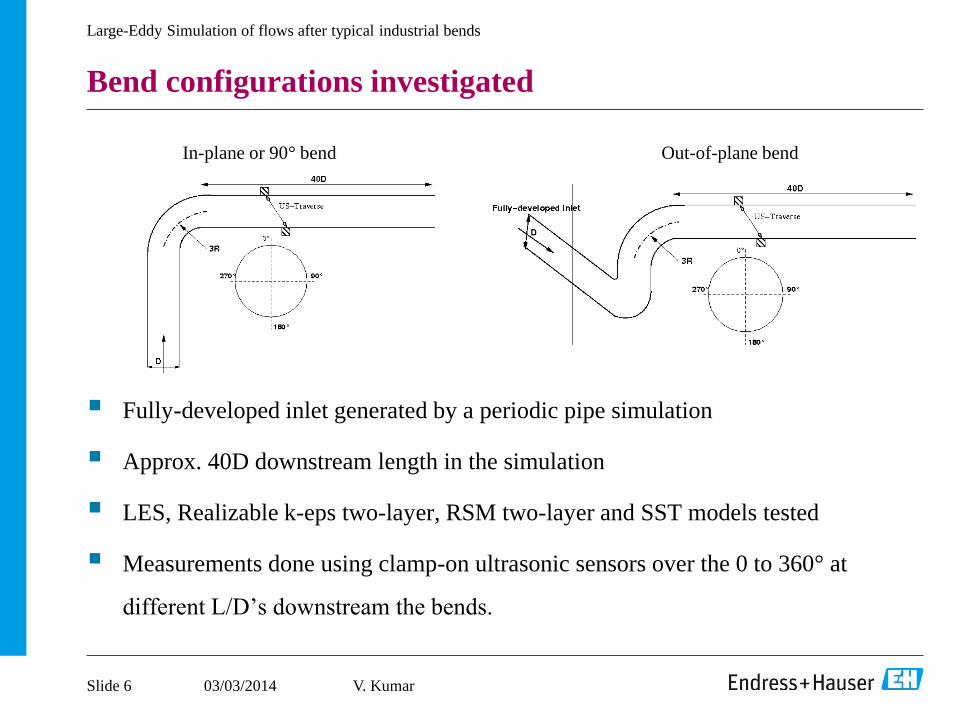
Bend configurations investigated
In-plane or 90° bend Out-of-plane bend
Fully-developed inlet generated by a periodic pipe simulation
Approx. 40D downstream length in the simulation
LES, Realizable k-eps two-layer, RSM two-layer and SST models tested
Measurements done using clamp-on ultrasonic sensors over the 0 to 360° at
different L/D’s downstream the bends.
Large-Eddy Simulation of flows after typical industrial bends
Slide 6 V. Kumar
03/03/2014
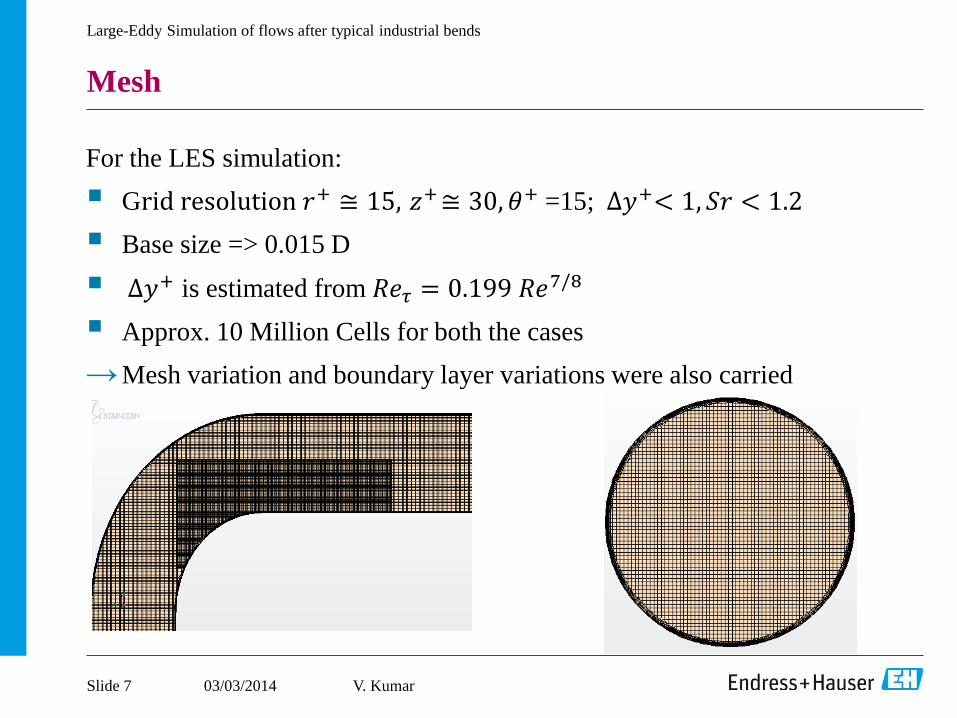
Mesh
For the LES simulation:
Grid resolution 𝑟+ ≅ 15, 𝑧+ ≅ 30, 𝜃+ =15; ∆𝑦+< 1, 𝑆𝑟 < 1.2
Base size => 0.015 D
∆𝑦+ is estimated from 𝑅𝑒𝜏 = 0.199 𝑅𝑒7/8
Approx. 10 Million Cells for both the cases
→ Mesh variation and boundary layer variations were also carried
Large-Eddy Simulation of flows after typical industrial bends
Slide 7 V. Kumar
03/03/2014
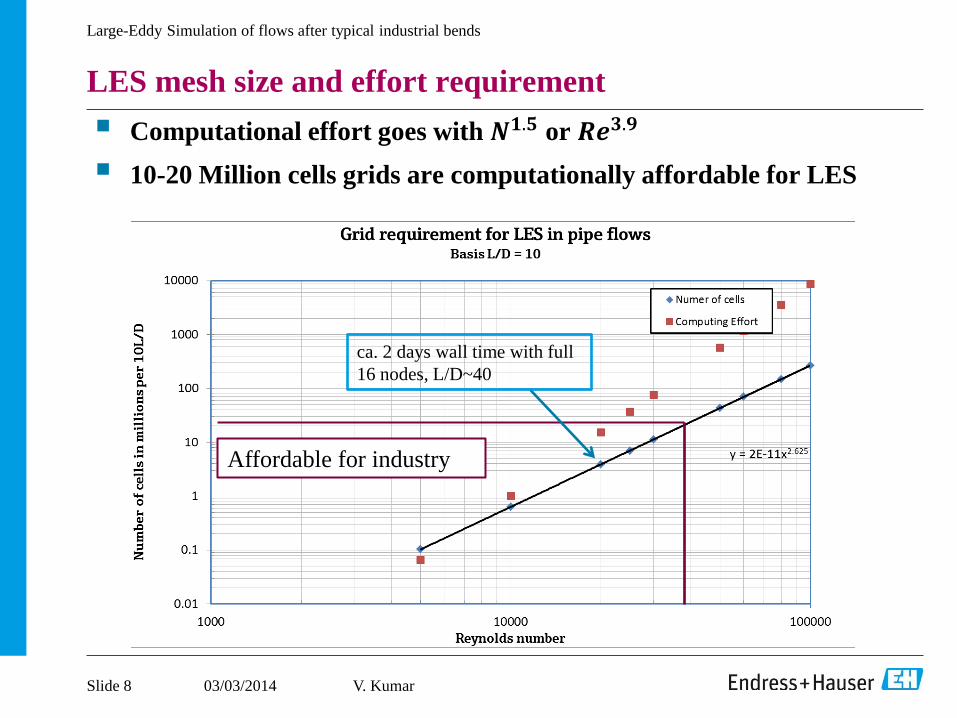
LES mesh size and effort requirement
Computational effort goes with 𝑵𝟏.𝟓 or 𝑹𝒆𝟑.𝟗
10-20 Million cells grids are computationally affordable for LES
Large-Eddy Simulation of flows after typical industrial bends
Affordable for industry
ca. 2 days wall time with full
16 nodes, L/D~40
Slide 8 V. Kumar
03/03/2014
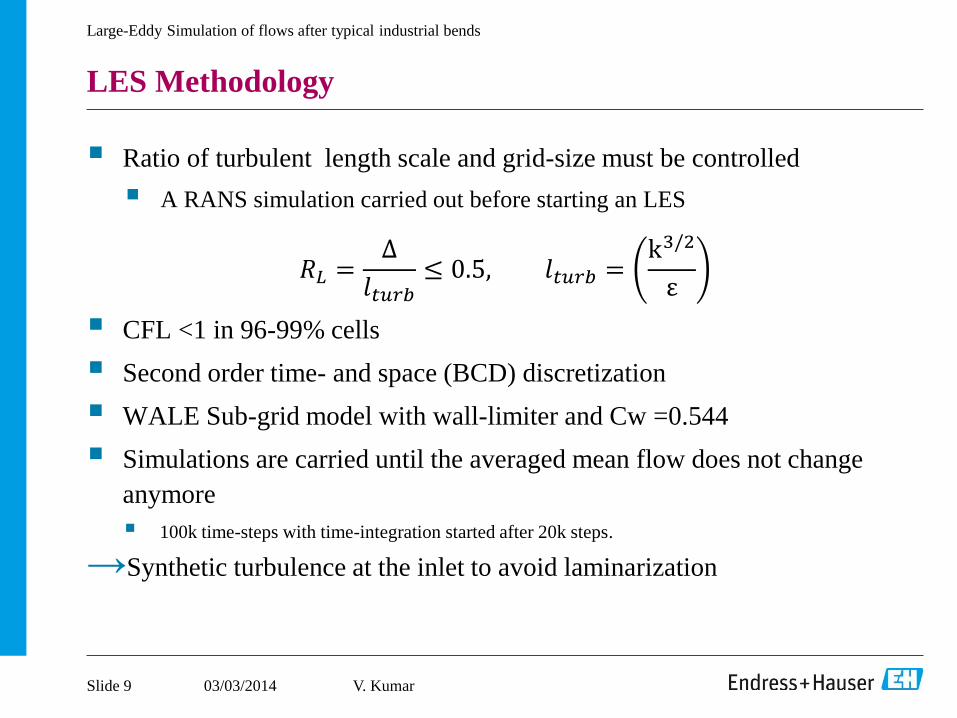
LES Methodology
Ratio of turbulent length scale and grid-size must be controlled
A RANS simulation carried out before starting an LES
𝑅𝐿 =∆
𝑙𝑡𝑢𝑟𝑏≤ 0.5, 𝑙𝑡𝑢𝑟𝑏 =
k3/2
ε
CFL <1 in 96-99% cells
Second order time- and space (BCD) discretization
WALE Sub-grid model with wall-limiter and Cw =0.544
Simulations are carried until the averaged mean flow does not change
anymore
100k time-steps with time-integration started after 20k steps.
→Synthetic turbulence at the inlet to avoid laminarization
Large-Eddy Simulation of flows after typical industrial bends
Slide 9 V. Kumar
03/03/2014
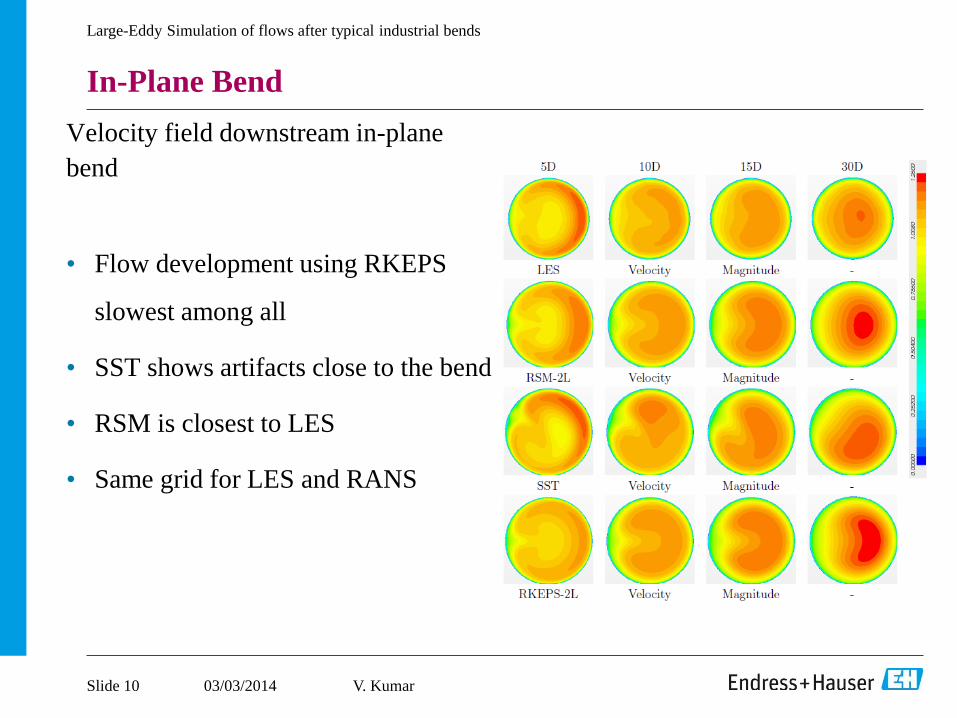
In-Plane Bend
Velocity field downstream in-plane
bend
• Flow development using RKEPS
slowest among all
• SST shows artifacts close to the bend
• RSM is closest to LES
• Same grid for LES and RANS
Large-Eddy Simulation of flows after typical industrial bends
Slide 10 V. Kumar
03/03/2014
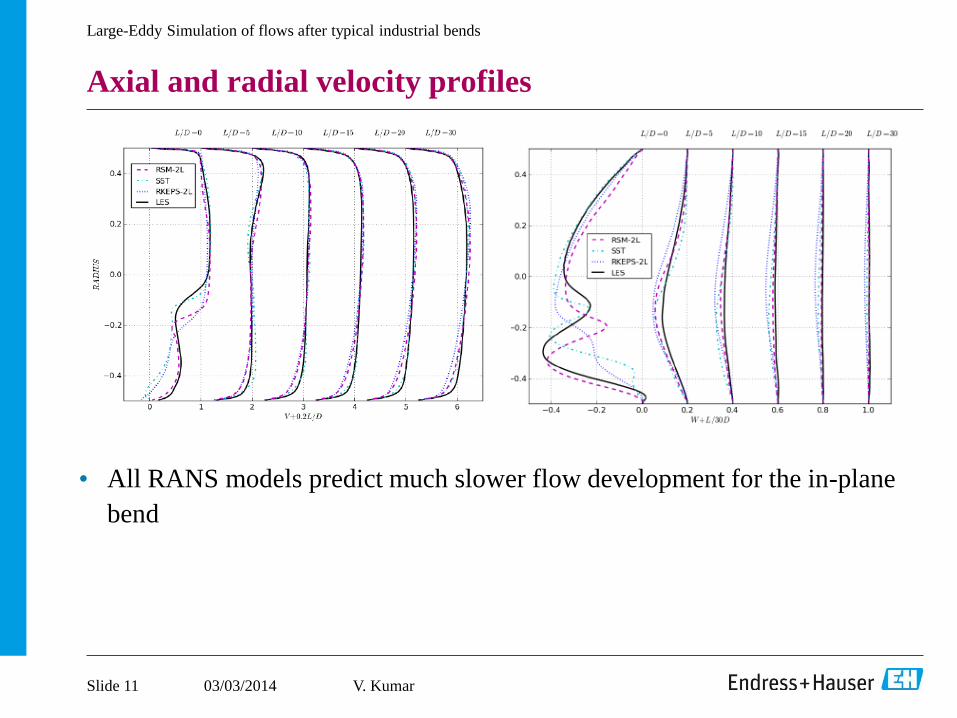
Axial and radial velocity profiles
• All RANS models predict much slower flow development for the in-plane
bend
Large-Eddy Simulation of flows after typical industrial bends
Slide 11 V. Kumar
03/03/2014
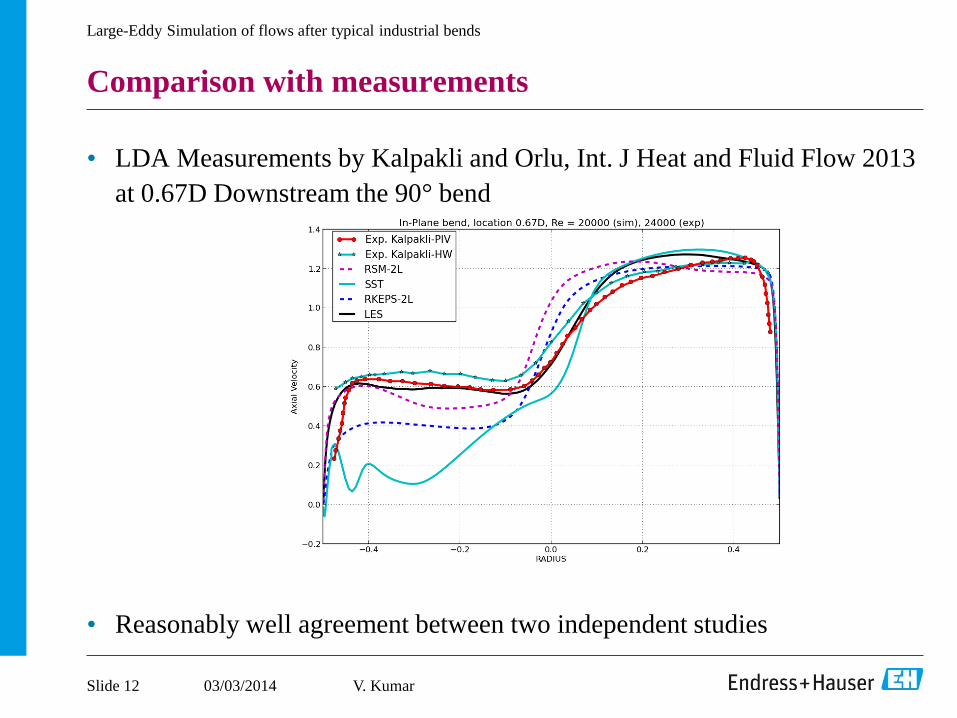
Comparison with measurements
• LDA Measurements by Kalpakli and Orlu, Int. J Heat and Fluid Flow 2013
at 0.67D Downstream the 90° bend
• Reasonably well agreement between two independent studies
Large-Eddy Simulation of flows after typical industrial bends
Slide 12 V. Kumar
03/03/2014
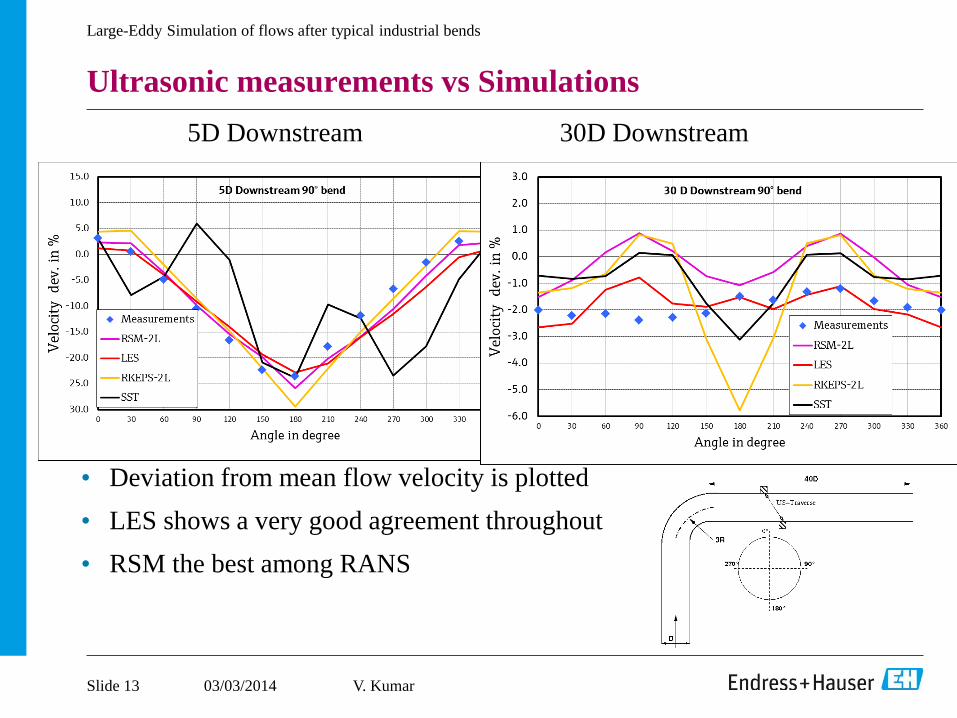
Ultrasonic measurements vs Simulations
5D Downstream 30D Downstream
• Deviation from mean flow velocity is plotted
• LES shows a very good agreement throughout
• RSM the best among RANS
Large-Eddy Simulation of flows after typical industrial bends
Slide 13 V. Kumar
03/03/2014
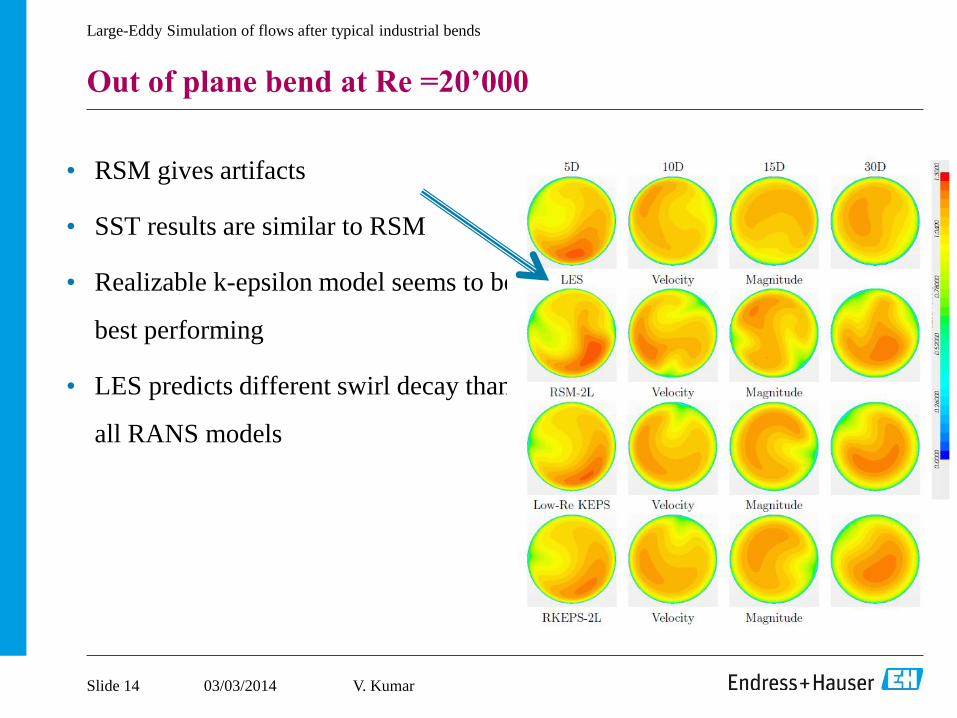
Out of plane bend at Re =20’000
• RSM gives artifacts
• SST results are similar to RSM
• Realizable k-epsilon model seems to be
best performing
• LES predicts different swirl decay than
all RANS models
Large-Eddy Simulation of flows after typical industrial bends
Slide 14 V. Kumar
03/03/2014
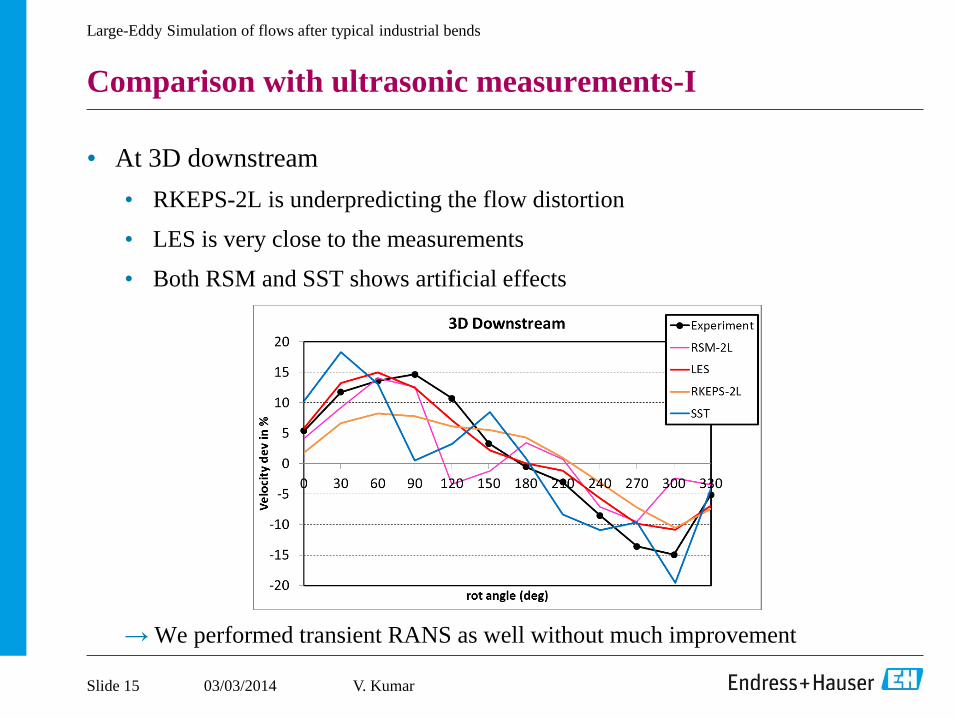
Comparison with ultrasonic measurements-I
• At 3D downstream
• RKEPS-2L is underpredicting the flow distortion
• LES is very close to the measurements
• Both RSM and SST shows artificial effects
→ We performed transient RANS as well without much improvement
Large-Eddy Simulation of flows after typical industrial bends
Slide 15 V. Kumar
03/03/2014
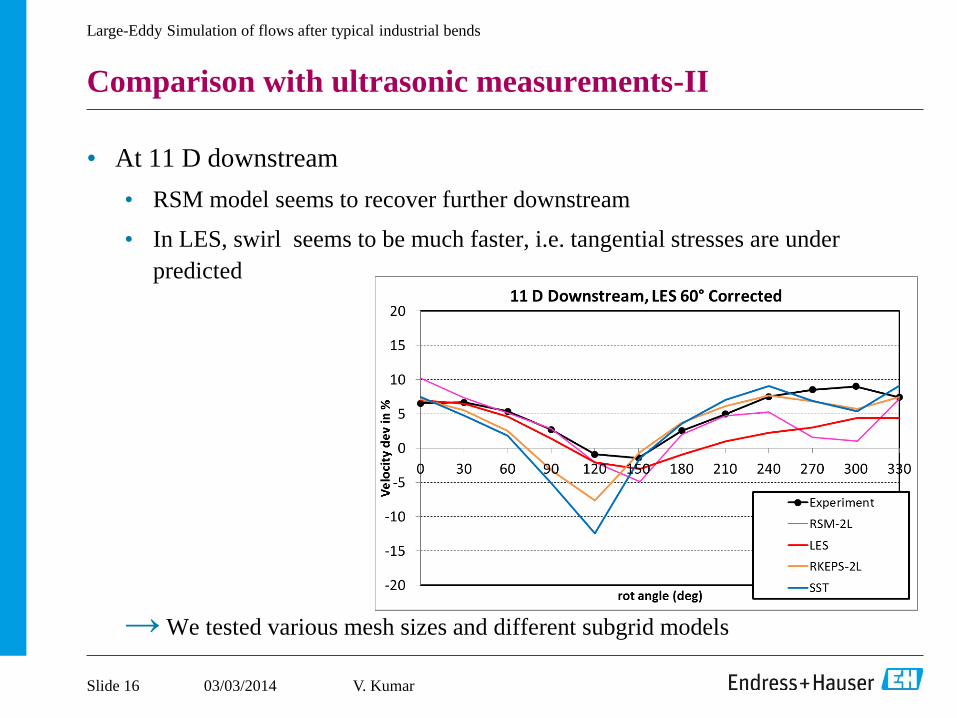
Comparison with ultrasonic measurements-II
• At 11 D downstream
• RSM model seems to recover further downstream
• In LES, swirl seems to be much faster, i.e. tangential stresses are under
predicted
→ We tested various mesh sizes and different subgrid models
Large-Eddy Simulation of flows after typical industrial bends
Slide 16 V. Kumar
03/03/2014
Conclusions
In-plane bend:
• Both RSM and LES are well predicting the flow up to 30D downstream
• Realizable K-Epsilon model predicts slower decay of disturbances
• SST significantly worse than others
Out-of-plane bend:
• RANS are better predicting the rotational decay
• Close to the bend, both RSM and SST are not performing well
• LES is predicting very well close to the bend
• However further downstream, swirl decay much slower than as predicted by RANS
and in experiments
• LES models and grid-resolution to be thoroughly investigated for swirling flows
Large-Eddy Simulation of flows after typical industrial bends
Slide 17 V. Kumar
03/03/2014
Thank you
Large-Eddy Simulation of flows after typical industrial bends
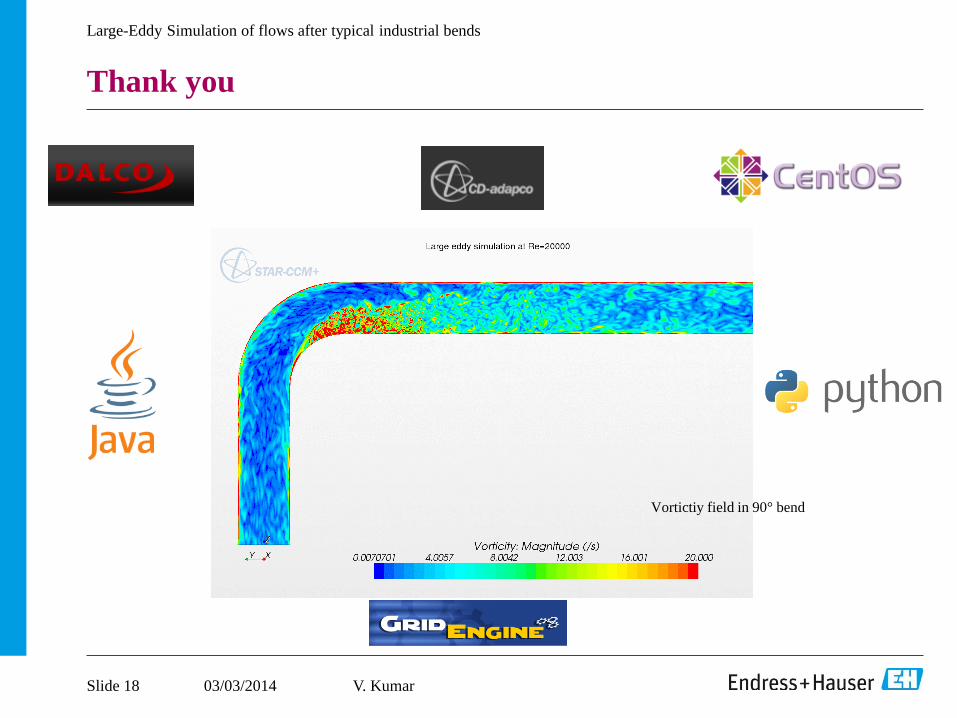
Vortictiy field in 90° bend
Slide 18 V. Kumar