Large CP violation in B system -...
32
D0 dimuon charge asymmetry with Z’ and LHCb Hyung Do Kim (SNU) HD Kim, SG Kim and S Shin, arXiv:1205.6481 Large CP violation in B system Friday, June 8, 12
-
Upload
truongcong -
Category
Documents
-
view
213 -
download
0
Transcript of Large CP violation in B system -...
D0 dimuon charge asymmetry with Z’ and LHCb
Hyung Do Kim (SNU)HD Kim, SG Kim and S Shin, arXiv:1205.6481
Large CP violation in B system
Friday, June 8, 12

Outline
Friday, June 8, 12
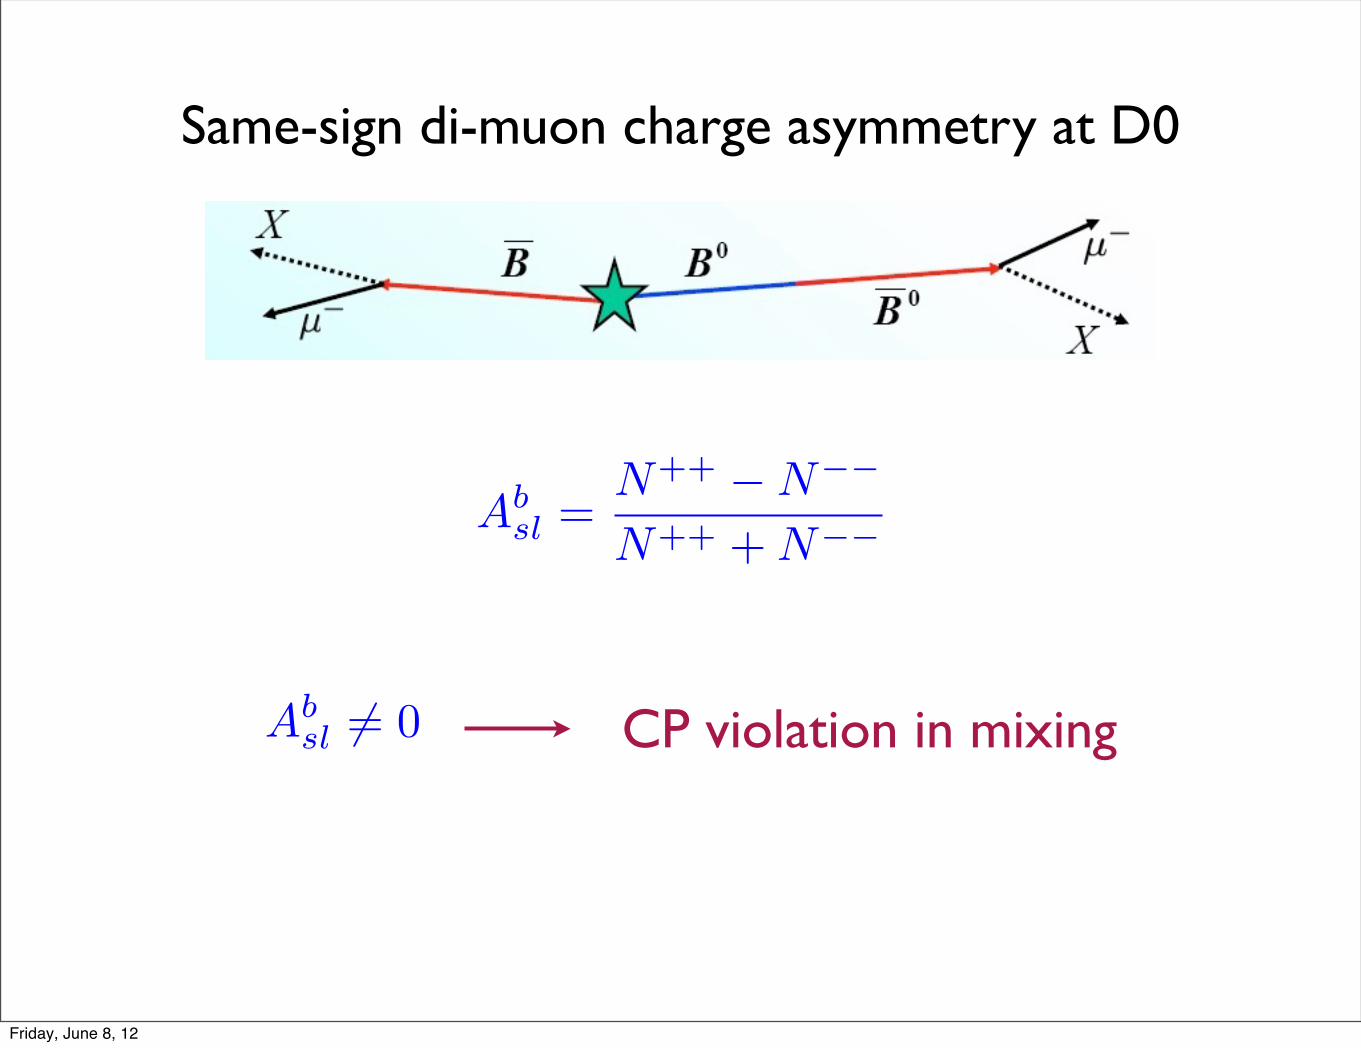
Same-sign di-muon charge asymmetry at D0
Absl =
N++ �N��
N++ +N��
Absl 6= 0 CP violation in mixing
Friday, June 8, 12
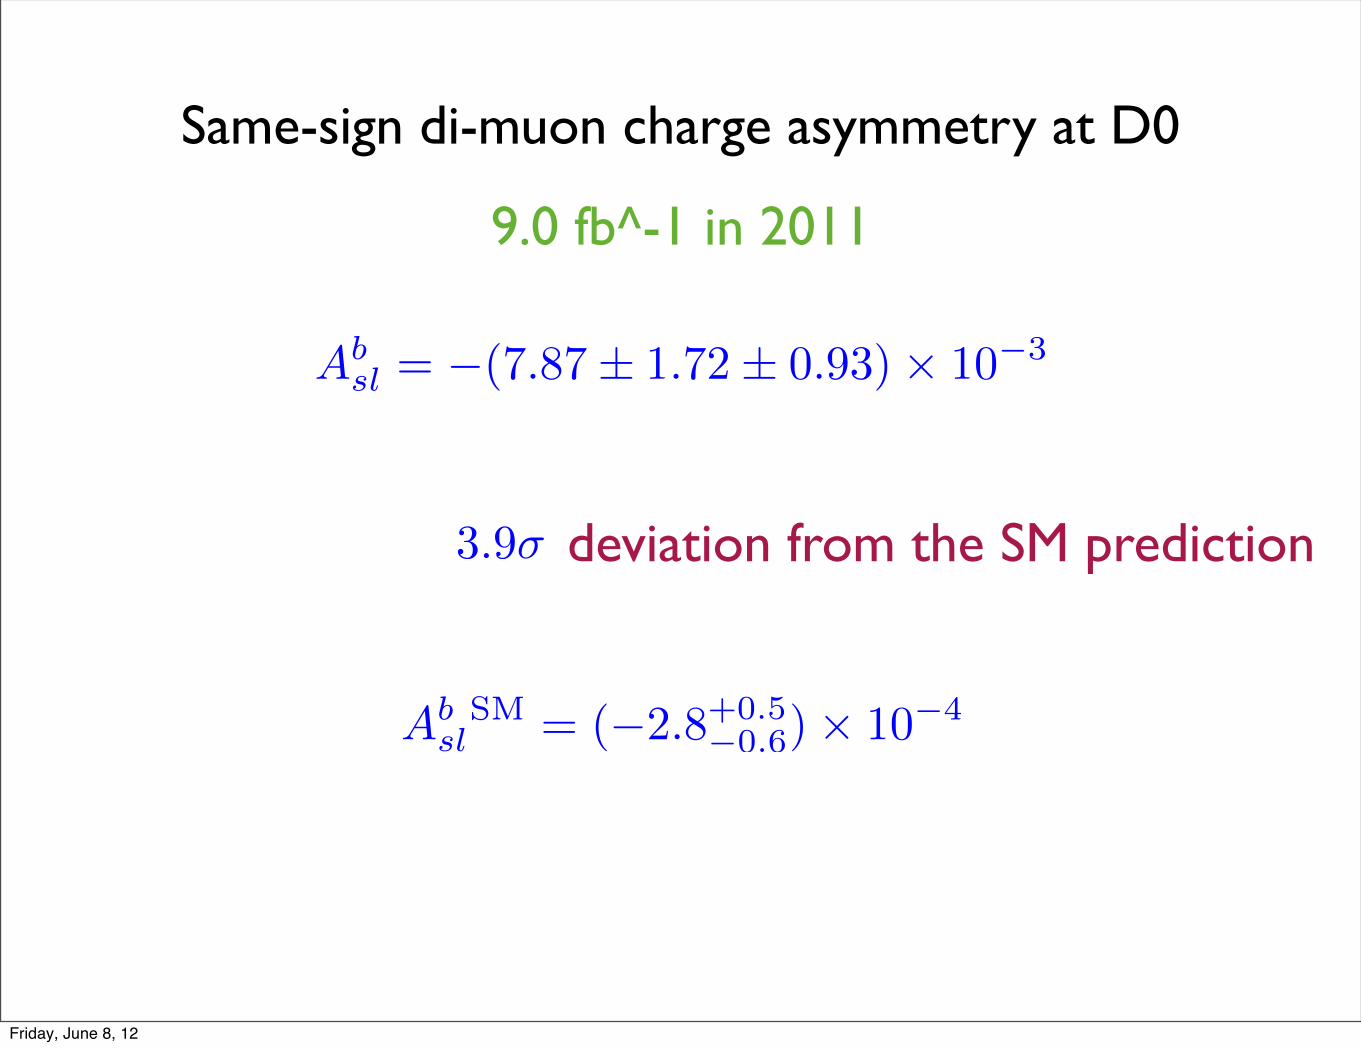
Same-sign di-muon charge asymmetry at D0
Absl = �(7.87± 1.72± 0.93)⇥ 10�3
9.0 fb^-1 in 2011
Ab SMsl = (�2.8+0.5
�0.6)⇥ 10�4
3.9� deviation from the SM prediction
Friday, June 8, 12

Friday, June 8, 12

Bd or Bs?
assl =�(B̄s ! µ+X)� �(Bs ! µ�X)
�(B̄s ! µ+X) + �(Bs ! µ�X)
same for Bd
Absl = (0.59± 0.02)adsl + (0.41± 0.02)assl
Friday, June 8, 12
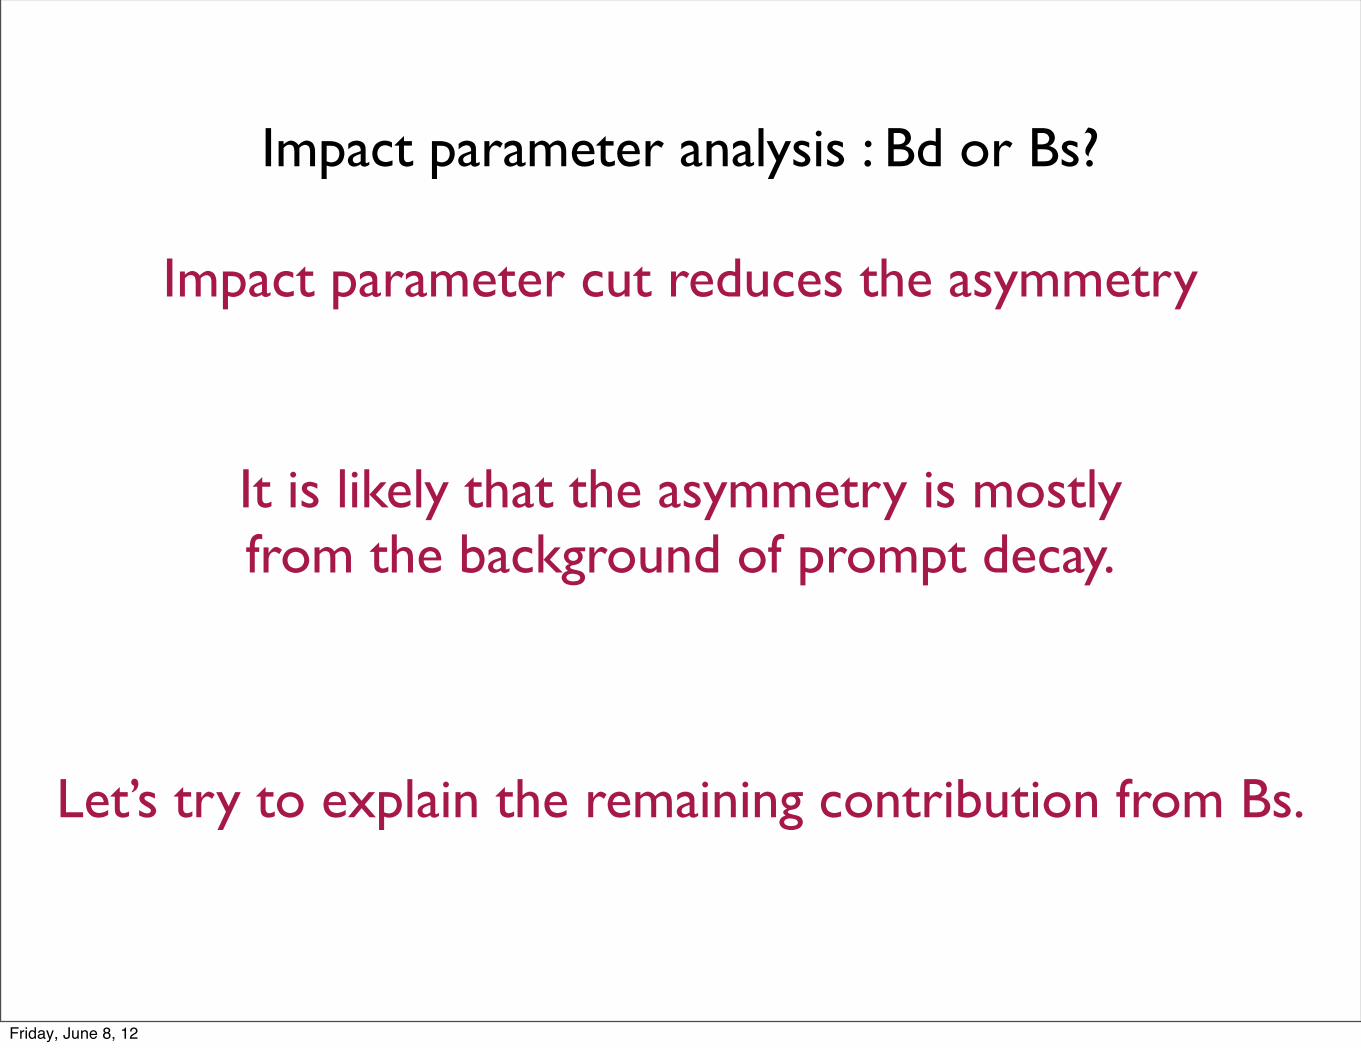
Impact parameter analysis : Bd or Bs?
Impact parameter cut reduces the asymmetry
It is likely that the asymmetry is mostly from the background of prompt decay.
Let’s try to explain the remaining contribution from Bs.
Friday, June 8, 12

reconstruction, which are about 30 !m and 15 !m, re-spectively, in the plane perpendicular to the beam axis. Thechosen value of 120 !m gives the minimal uncertainty onadsl and assl defined in Eq. (2). The measurement of theseasymmetries using the combination of Ab
sl measurementswith IP above and below the chosen cut is discussed belowin this section.
In total, 0:356! 109 muons in the inclusive-muon sam-ple and 0:714! 106 events in the like-sign dimuon sampleare selected for the IP>120 measurement. Events are subjectto the same analysis as for the entire sample, exceptthat the ratio RK"K0
S# is not used because of insufficientK0
S ! "$"% decays in the dimuon sample. Backgroundasymmetries should not depend on the muon IP, and weverified that the difference in kaon asymmetry for thewhole sample and the IP>120 events agree: aK"IP>120# %aK"all# & "%1:6' 1:5#%. We therefore use the values
given in Tables VII and VIII. All other measured quanti-ties are given in Table XVIII. The background fractionsare strongly suppressed in the IP>120 sample, and theirinfluence on the measurement of Ab
sl is significantlysmaller. Using these values, we obtain for the inclusive-muon sample
Absl"IP>120# & "%0:422' 0:240"stat# ' 0:121"syst##%;
(43)
and for the like-sign dimuon sample
Absl"IP>120# & "%0:818' 0:342"stat# ' 0:067"syst##%:
(44)
We obtain the final value of Absl"IP>120# using the linear
combination of Eq. (13), and select the value of # tominimize the total uncertainty on Ab
sl, which correspondsto # & %9:29. The combination for a negative value of #is equivalent to the weighted average of Eqs. (43) and (44)taking into account the correlation of uncertainties (see theAppendix for more details). The corresponding asymmetryAbsl is found to be
Absl"IP>120# & "%0:579' 0:210"stat# ' 0:094"syst##%:
(45)
The contributions to the uncertainties in Eqs. (43)–(45) aregiven in Table XIX.
106
107
108
109
0 0.01 0.02 0.03 0.04 0.05IP(µ) [cm]
Ent
ries
DØ, 9.0 fb-1DataMCMC, L muons
FIG. 19 (color online). The muon IP distribution in theinclusive-muon sample (bullets). The solid line represents themuon IP distribution in simulation. The shaded histogram isthe contribution from L muons in simulation.
TABLE XIX. Sources of uncertainty on Absl"IP>120# in
Eqs. (43)–(45). The first nine rows contain statistical uncertain-ties, and the next four rows contain systematic uncertainties.
Source $"Absl# ! 102
Eq. (43)$"Ab
sl# ! 102
Eq. (44)$"Ab
sl# ! 102
Eq. (45)
A or a (stat) 0.055 0.244 0.093fK (stat) 0.048 0.031 0.058RK (stat) N/A 0.244 0.074P"" ! !#=P"K ! !# 0.007 0.004 0.006P"p ! !#=P"K ! !# 0.012 0.004 0.010AK 0.023 0.012 0.017A" 0.037 0.009 0.026Ap 0.025 0.007 0.019$ or ! 0.210 0.075 0.157fK (syst) 0.112 0.027 0.083RK (syst) N/A 0.014 0.007", K, p multiplicity 0.016 0.016 0.016cb or Cb 0.043 0.057 0.041Total statistical 0.240 0.342 0.210Total systematic 0.121 0.067 0.094Total 0.269 0.348 0.230
TABLE XVIII. Input quantities for the measurement of Absl
using muons with IP above and below 120 !m. Only statisticaluncertainties are given.
Quantity IP> 120 !m IP< 120 !m
fK ! 102 5:19' 0:37 17:64' 0:27f" ! 102 5:65' 0:40 34:72' 1:86fp ! 102 0:05' 0:03 0:45' 0:20FK ! 102 4:48' 4:05 21:49' 0:62F" ! 102 4:43' 3:95 40:47' 2:26Fp ! 102 0:03' 0:05 0:59' 0:23fS ! 102 89:11' 0:88 47:18' 2:03Fbkg ! 102 8:94' 8:26 62:56' 3:07FSS ! 102 91:79' 7:65 53:66' 2:68a! 102 %0:014' 0:005 $0:835' 0:002abkg ! 102 $0:027' 0:023 $0:864' 0:049A! 102 %0:529' 0:120 $0:555' 0:060Abkg ! 102 %0:127' 0:093 $0:829' 0:077C" 0:70' 0:05 0:95' 0:02CK 0:39' 0:06 0:98' 0:01FLL="FLL $ FSL# 0:089' 0:062 0:350' 0:029cb 0:109' 0:011 0:038' 0:007Cb 0:526' 0:037 0:413' 0:032
MEASUREMENT OF THE ANOMALOUS LIKE-SIGN DIMUON . . . PHYSICAL REVIEW D 84, 052007 (2011)
052007-19
From the known frequencies of oscillations, !Mq=2!(q ! d, s), the period of oscillation for the B0 meson ismany times longer than its lifetime so that the mixingprobability of B0 mesons effectively increases with longdecay lengths and large impact parameters. The B0
s mesonoscillates a number of times within its lifetime so that it is‘‘fully mixed’’ for any appreciable impact parameter re-quirement. As a result, the fraction of B0 mesons that haveoscillated into the other flavor is increased in the samplewith large muon impact parameter. This behavior is dem-onstrated in Fig. 20, which shows the normalized IP dis-tributions for muons produced in oscillating decays of B0
and B0s mesons in simulation. The contribution of the adsl
asymmetry in Absl is therefore enhanced in the sample with
a large muon IP. From simulation, the mixing probabilityof B0 meson in the IP>120 sample is determined to be
"d"IP>120;MC# ! 0:342$ 0:004; (46)
with the uncertainty limited by the number of simulatedevents. This value can be compared to the input to thesimulation for the B0 mixing probability integrated overtime, "d ! 0:1864$ 0:0022 [3]. The coefficients Cd andCs in Eq. (2) for the IP>120 selection become
Cd"IP>120# ! 0:728$ 0:018;
Cs"IP>120# ! 0:272$ 0:018:(47)
The value of Absl"IP>120# should therefore be reduced rela-
tive to the value for the full dimuon sample, if the contri-bution of assl dominates the asymmetry Ab
sl.The measurement of IP<120 is performed using
1:687% 109 muons in the inclusive-muon sample and2:857% 106 events in the like-sign dimuon sample.Exactly the same procedure is applied as for the mainmeasurement, using the background and muon reconstruc-tion asymmetries given in Tables VII and VIII. All otherquantities are given in Table XVIII. The backgroundfractions are significantly increased in the samples withsmall muon IP, thereby increasing the uncertainties relatedto the background description (Table XX).
Using these values we obtain from the inclusive-muonsample
Absl"IP<120# ! "&1:65$ 2:77"stat# $ 4:96"syst##%; (48)
and from the like-sign dimuon sample
Absl"IP<120# ! "&1:17$ 0:44"stat# $ 0:59"syst##%: (49)
The measurement using the linear combination given inEq. (13) is performed with # ! '1:27, which minimizesthe total uncertainty on Ab
sl. The value of Absl is found to be
Absl"IP<120# ! "&1:14$ 0:37"stat# $ 0:32"syst##%: (50)
The mean mixing probability "d in the IP<120 sampleobtained in simulation is found to be
"d"IP<120;MC# ! 0:084$ 0:002; (51)
and the coefficients Cd and Cs in Eq. (2) for the IP<120
selection are
Cd"IP<120# ! 0:397$ 0:022;
Cs"IP<120# ! 0:603$ 0:022:(52)
The measurements with IP<120 and IP>120 use indepen-dent data samples, and the dependence of Ab
sl on adsl and a
ssl
is different for the IP<120 and IP>120 samples. The mea-surements given in Eqs. (45) and (50) can therefore be
TABLE XX. Sources of uncertainty on Absl"IP<120# in
Eqs. (48)–(50). The first nine rows contain statistical uncertain-ties, the next four rows contain systematic uncertainties.
Source $"Absl# % 102
Eq. (48)$"Ab
sl# % 102
Eq. (49)$"Ab
sl# % 102
Eq. (50)
A or a (stat) 0.136 0.233 0.285fK (stat) 1.059 0.173 0.082RK (stat) N/A 0.141 0.155P"! ! %#=P"K ! %# 0.388 0.060 0.026P"p ! %#=P"K ! %# 0.699 0.064 0.004AK 0.986 0.123 0.089A! 1.727 0.165 0.075Ap 1.261 0.123 0.050$ or ! 0.606 0.107 0.071fK (syst) 4.951 0.508 0.034RK (syst) N/A 0.286 0.307!, K, p multiplicity 0.137 0.034 0.025cb or Cb 0.305 0.087 0.093Total statistical 2.774 0.439 0.366Total systematic 4.962 0.590 0.323Total 5.685 0.735 0.488
10-2
10-1
0 0.01 0.02 0.03 0.04 0.05IP(µ) [cm]
Fra
ctio
nal e
ntri
es DØ MC Oscillating decays B0
Oscillating decays B0s
FIG. 20. The normalized IP distribution for muons produced inoscillating decays of B0 mesons (points with error bars) and B0
s
mesons (solid histogram) in simulation.
V.M. ABAZOV et al. PHYSICAL REVIEW D 84, 052007 (2011)
052007-20
We conclude that the observed dependence of the like-sign dimuon charge asymmetry on muon IP is consistentwith the hypothesis that it has its origin from semileptonicb-hadron decays. The contributions of adsl and a
ssl to A
bsl can
be determined separately by dividing the sample accordingto the muon IP, although the uncertainties on the values ofadsl and assl do not allow for the definitive conclusion thatthe deviation of Ab
sl from its SM prediction is dominatedfrom the assl asymmetry.
XV: CONCLUSIONS
We have presented an update to the previous measure-ment [11] of the anomalous like-sign dimuon charge asym-metry Ab
sl with 9:0 fb!1 of integrated luminosity. Theanalysis has improved criteria for muon selection, whichprovide a stronger background suppression and increasethe size of the like-sign dimuon sample. A more accuratemeasurement of the fraction of kaons that produce muonsin the inclusive-muon sample (fK), and an additional mea-surement of the ratio of such yields in like-sign dimuon toinclusive-muon data (RK " FK=fK) using K0
S ! !#!!
decay have been performed. This provides better precisionof RK, and an independent estimate of the systematicuncertainty on this quantity. The value of the like-signdimuon charge asymmetry Ab
sl in semileptonic b-hadrondecays is found to be
Absl " $!0:787% 0:172$stat& % 0:093$syst&&%: (55)
This measurement disagrees with the prediction of thestandard model by 3.9 standard deviations and providesevidence for anomalously large CP violation in semilep-tonic neutral B decay. The residual charge asymmetry oflike-sign dimuon events after taking into account all back-ground sources is found to be
Ares " $!0:246% 0:052$stat& % 0:021$syst&&%: (56)
It differs by 4.2 standard deviations from the standardmodel prediction.Separation of the sample by muon impact parameter
allows for separate extraction of adsl and assl. We obtain
adsl " $!0:12% 0:52&%; assl " $!1:81% 1:06&%:
(57)
The correlation "ds between these two quantities is
"ds " !0:799: (58)
The uncertainties on adsl and assl do not allow for thedefinitive conclusion that assl dominates the value of Ab
sl.Our results are consistent with the hypothesis that the
anomalous like-sign dimuon charge asymmetry arises fromsemileptonic b-hadron decays. The significance of thedifference of this measurement with the SM prediction isnot sufficient to claim observation of physics beyond the
TABLE XXIII. Values of Absl with their statistical and system-
atic uncertainties obtained for different IP selections.
Selection Sample Central Uncertainty '102
value '102 statistical systematic
All events 1# !1:042 1.304 2.3132# !0:808 0.202 0.222
comb. !0:787 0.172 0.093IP< 50 #m 1# !3:244 4.101 7.466
2# !2:837 0.776 1.221comb. !2:779 0.674 0.694
IP> 50 #m 1# !0:171 0.343 0.3112# !0:593 0.257 0.074
comb. !0:533 0.239 0.100IP< 80 #m 1# !1:293 3.282 5.841
2# !1:481 0.541 0.810comb. !1:521 0.458 0.501
IP> 80 #m 1# !0:388 0.280 0.1792# !0:529 0.285 0.048
comb. !0:472 0.226 0.091IP< 120 #m 1# !1:654 2.774 4.962
2# !1:175 0.439 0.590comb. !1:138 0.366 0.323
IP> 120 #m 1# !0:422 0.240 0.1212# !0:818 0.342 0.067
comb. !0:579 0.210 0.094
TABLE XXIV. Mean mixing probability ($d) obtained insimulation, and the coefficients Cd and Cs in Eq. (2), used fordifferent selections.
Sample $d$MC& Cd Cs
IP<50 0:059% 0:002 0:316% 0:021 0:684% 0:021IP<80 0:069% 0:002 0:351% 0:022 0:649% 0:022IP<120 0:084% 0:002 0:397% 0:022 0:603% 0:022IP>50 0:264% 0:004 0:674% 0:020 0:326% 0:020IP>80 0:299% 0:004 0:701% 0:019 0:299% 0:019IP>120 0:342% 0:004 0:728% 0:018 0:272% 0:018
TABLE XXV. Measured values of adsl nd assl for different muon
IP thresholds. In each column, the measurements using thesamples with muon IP larger and smaller than the given thresh-old are combined. We also give the correlation "ds between adsland assl.
Quantity muon IP threshold50 #m 80 #m 120 #m
adsl ' 102 #1:51% 0:93 #0:42% 0:68 !0:12% 0:52assl ' 102 !4:76% 1:79 !2:57% 1:34 !1:81% 1:06"ds !0:912 !0:857 !0:799
V.M. ABAZOV et al. PHYSICAL REVIEW D 84, 052007 (2011)
052007-22
Friday, June 8, 12
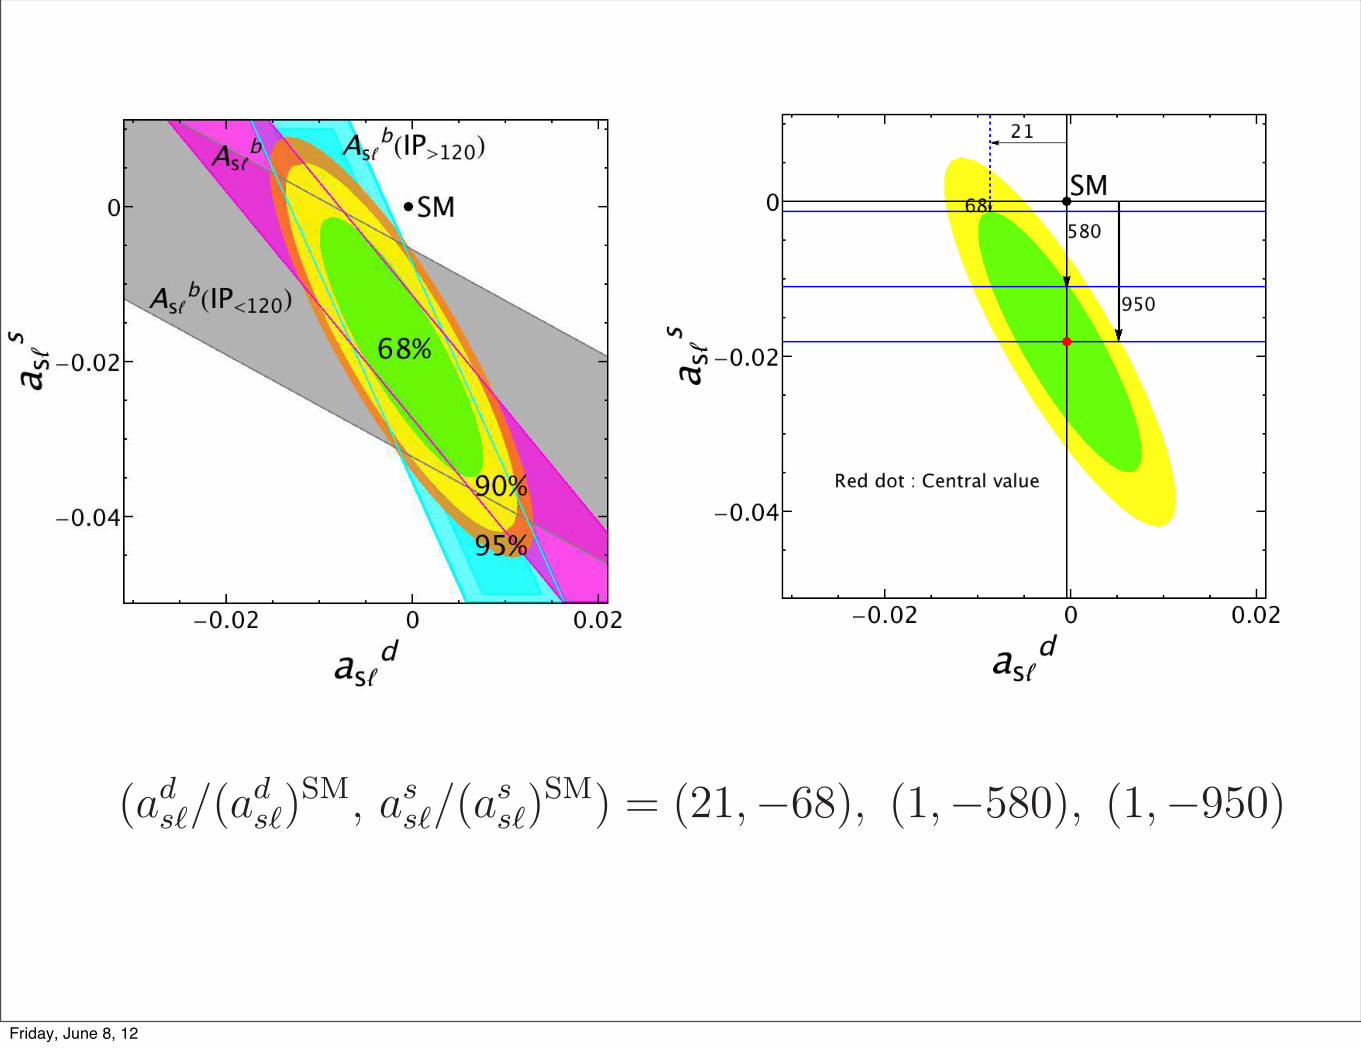
(a) Combined fit (b) Possible enhancement
FIG. 1. We reproduced the measurements with di!erent muon impact parameter (IP) selections
according to [2] in (a). The bands are the 90% uncertainties on each individual measurement of
IP<120 (Gray), IP>120 (Cyan), and the result without the IP cut (Purple) in (2). The green (68%),
yellow (90%), and orange (95%) ellipses are obtained from the !2-fit combining the measurements
of IP<120 and IP>120 using the independent data sample. To explain the asymmetry within 1" in
the (ads!, ass!) plane, the required NP contribution is expressed in terms of ads!/(a
ds!)
SM (number at
the horizontal arrow) or !ass!/(ass!)
SM (numbers at the vertical arrows) in (b). The red dot denotes
the observed central value of (ads!, ass!).
point of view of ads!, we cannot explain the asymmetry within 1! in the "2-fit without NP
contribution in ass!.2 The second point shows that at least 580 times bigger size of ass! is
necessary to be within 1! region if there is no change in ads!. To be in the central point in
which the "2 fit is the best, ass! should be enhanced by a factor of 950. (ads! central value is
consistent with the standard model prediction.)
Such asymmetry has been explained in the context of many new physics models. One of
the simplest approaches is considering the flavor violating interaction of b and s quarks with
an additional U(1) neutral gauge boson Z !, which contribute to the o!-diagonal decay width
"12 from the absorptive part of the Bs ! B̄s mixing [4, 5]. In general models with new "12,
the enhancement of the asymmetry can be achieved by the Im("12) without su!ering from
2 If we aim for the asymmetry within 90% confidence region (1.65") or 2" region, the enhancement in ads!
can be achieved without having any contribution in ass!.
4
Imposing the lower limits of the muon impact parameter (IP), it is possible to reduce the
background dramatically, which is mainly from the long-lived charged mother particles of
the muon and the anti-muon. In the 2011 data, the separation of the sample by the muon
impact parameter induces the separate determination of ads! and ass! such that
ass! = !(18.1± 10.6)" 10!3 , (6)
ads! = !(1.2± 5.2)" 10!3 , (7)
where the SM predictions using the SM fit of |Vub| = (3.56+0.15!0.20)" 10!3 [3] are
asSMs! = (1.9± 0.3)" 10!5, (8)
adSMs! = !(4.1 ± 0.6)" 10!4. (9)
The separately determined ass! has about 1.7! deviation from the SM prediction if ads! can
be freely chosen to fit the data. Similarly the ads! is within 1! if ass! can be arbitrary. It
should be emphasized that large contribution from new physics is inevitable if both of ads!
and ass! are considered.
We reproduced the "2-fit combining the impact parameter cut (120µm) analysis of IP<120
and IP>120 in Fig. 1. As seen in the figure, we need to consider both of ads! and ass! together
in the 2D plane. In this figure, we used the central values in the fraction of contribution by
ads! and ass! in Abs!, shown in [2]. In Fig. 1 (b), the required NP contribution is expressed
in terms of ads!/(ads!) (number at the horizontal arrow) or !ass!/(a
ss!)
SM (numbers at the
vertical arrows). The red dot denotes the observed central value of (ads!, ass!). Without any
NP contribution to ads!, the enhancement !ass!/(ass!)
SM > 580 (950) is needed to explain
the asymmetry within 1! (above the observed central value). With the assumption of
the maximal NP contribution to ads!/(ads!)
SM = 21, we still need the large enhancement
!ass!/(ass!)
SM > 68 to explain the asymmetry within 1!.
To investigate the possibility accommodating such large new CP violating contribution
in the Bs ! B̄s mixing system for the dimoun charge asymmetry within 1! in the "2-fit, we
will take three points explained in Fig. 1 (b) as reference ones.
(ads!/(ads!)
SM, ass!/(ass!)
SM) = (21,!68), (1,!580), (1,!950) . (10)
If we focus on Bs system, the first point shows that at least 68 times enhancement of ass! is
needed to be within 1! region even if we allow arbitrarily large new physics in ads!. In the
3
Friday, June 8, 12

Impact parameter analysis : Bd or Bs?
assl = (�1.8± 1.1)⇥ 10�2
as SMsl = (1.9± 0.3)� 10�5
1.6� deviation from
Imposing the lower limits of the muon impact parameter (IP), it is possible to reduce the
background dramatically, which is mainly from the long-lived charged mother particles of
the muon and the anti-muon. In the 2011 data, the separation of the sample by the muon
impact parameter induces the separate determination of ads! and ass! such that
ass! = !(18.1± 10.6)" 10!3 , (6)
ads! = !(1.2± 5.2)" 10!3 , (7)
where the SM predictions using the SM fit of |Vub| = (3.56+0.15!0.20)" 10!3 [3] are
asSMs! = (1.9± 0.3)" 10!5, (8)
adSMs! = !(4.1 ± 0.6)" 10!4. (9)
The separately determined ass! has about 1.7! deviation from the SM prediction if ads! can
be freely chosen to fit the data. Similarly the ads! is within 1! if ass! can be arbitrary. It
should be emphasized that large contribution from new physics is inevitable if both of ads!
and ass! are considered.
We reproduced the "2-fit combining the impact parameter cut (120µm) analysis of IP<120
and IP>120 in Fig. 1. As seen in the figure, we need to consider both of ads! and ass! together
in the 2D plane. In this figure, we used the central values in the fraction of contribution by
ads! and ass! in Abs!, shown in [2]. In Fig. 1 (b), the required NP contribution is expressed
in terms of ads!/(ads!) (number at the horizontal arrow) or !ass!/(a
ss!)
SM (numbers at the
vertical arrows). The red dot denotes the observed central value of (ads!, ass!). Without any
NP contribution to ads!, the enhancement !ass!/(ass!)
SM > 580 (950) is needed to explain
the asymmetry within 1! (above the observed central value). With the assumption of
the maximal NP contribution to ads!/(ads!)
SM = 21, we still need the large enhancement
!ass!/(ass!)
SM > 68 to explain the asymmetry within 1!.
To investigate the possibility accommodating such large new CP violating contribution
in the Bs ! B̄s mixing system for the dimoun charge asymmetry within 1! in the "2-fit, we
will take three points explained in Fig. 1 (b) as reference ones.
(ads!/(ads!)
SM, ass!/(ass!)
SM) = (21,!68), (1,!580), (1,!950) . (10)
If we focus on Bs system, the first point shows that at least 68 times enhancement of ass! is
needed to be within 1! region even if we allow arbitrarily large new physics in ads!. In the
3
Friday, June 8, 12
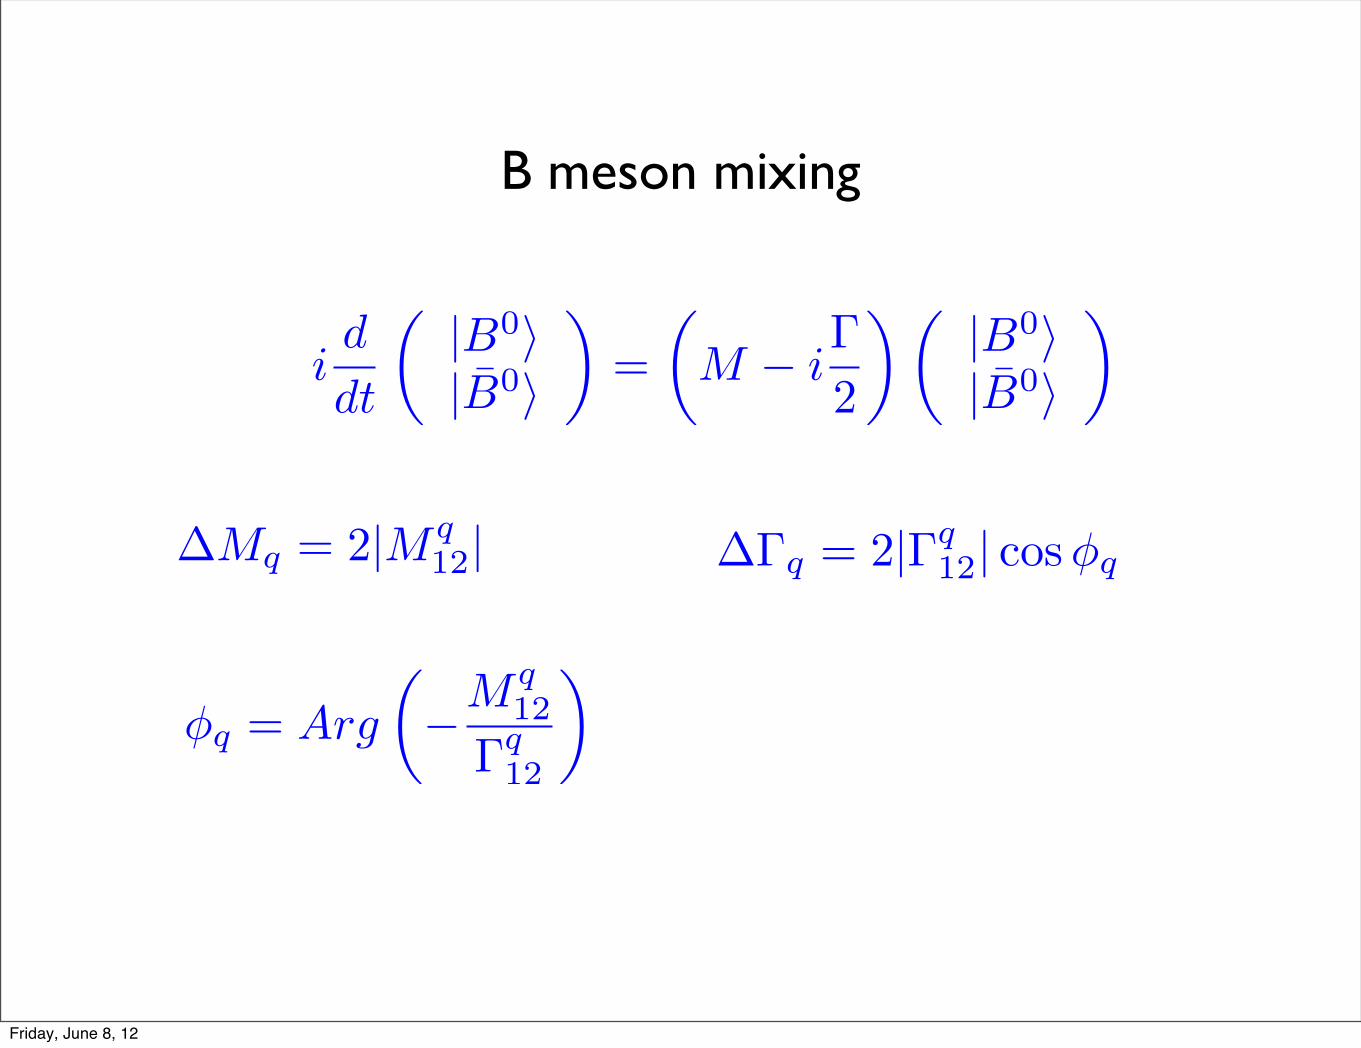
id
dt
✓|B0⇥|B̄0⇥
◆=
✓M � i
�
2
◆✓|B0⇥|B̄0⇥
◆
B meson mixing
�Mq = 2|Mq12|
�q = Arg
✓�Mq
12
�q12
◆
⇥�q = 2|�q12| cos�q
Friday, June 8, 12

aqsl = Im�q12
Mq12
=|�q
12||Mq
12|sin�q =
⇥�q
⇥Mqtan�q
Friday, June 8, 12

hqe2i�q =
MqNP12
MqSM12
h̃qe2i�̃q =
�qNP12
�qSM12
Friday, June 8, 12

for real and non-negative parameters h̃q and hq, with the phases constrained in the region,
0 ! !q, !̃q ! ". Then, the flavor specific charge asymmetry is given by [5]
aqs! =|!q SM
12 ||M q SM
12 |1
1 + h2q + 2hq cos 2!q
"!"
#h̃q sin 2!̃q(1 + hq cos 2!q) + hq sin 2!q(1 + h̃q cos 2!̃q)#
cos#SMq
+"
(1 + h̃q cos 2!̃q)(1 + hq cos 2!q) + hqh̃q sin 2!q sin 2!̃q
#
sin #SMq
$
.
(17)
Therefore, the ratio is given by
#aqs!/(aqs!)
SM =1
1 + h2q + 2hq cos 2!q
"!"
h̃q sin 2!̃q(1 + hq cos 2!q)# hq sin 2!q(1 + h̃q cos 2!̃q)#
cot#SMq
#"
(1 + h̃q cos 2!̃q)(1 + hq cos 2!q) + hqh̃q sin 2!q sin 2!̃q
# $
.
(18)
The factor 1/(1+h2q+2hq cos 2!q) is fixed by the ratio of "MSM
q /"Mq, near to 1. Therefore,
we see that the sizable NP contribution to h̃q takes the dominant role in explaining the
observed dimuon charge asymmetry.
The Z ! models to enhance the ass! requires the existence of nonzero o#-diagonal couplings
gLsb and gRsb, where gL,R"# is the coupling of Z ! to fermions $L,R and %L,R. Turning o# one of
the couplings gLsb and gRsb for simplicity, this scenario demands the existence of rather large
couplings gL,R$$ > 1 to explain the asymmetry within 1! range from the central value due
to the strict "Ms constraint. The situation is same even in the case that the mass of Z !
is similar to that of the Z boson. Such large gL,R$$ couplings can violate the observations in
the electroweak precision test (EWPT). Therefore, we need to turn on both of the flavor
changing couplings gLsb and gRsb. The scenario considering the gL,R$$ couplings to explain the
dimuon charge asymmetry will be called as “g$$ scenario” in this paper.
On the other hand, considering the nonzero Z ! coupling to the charm quark pair can also
explain the dimuon charge asymmetry by considering the interference of the NP contribution
and the SM process. Due to the interference, the couplings gL,Rsb gL,Rcc contribute to the
enhancement of the asymmetry linearly while gL,Rs,b gL,R$$ do quadratically. Therefore, it is
possible to explain the asymmetry with rather smaller Z ! couplings in this scenario so that
we can avoid the direct constraint such as the decay of Bs $ DDs [6]. The scenario
considering such contribution will be called as “gcc scenario” in this paper.
6
Friday, June 8, 12

�12
Bs decay to taus/charms are less constrained(upper bound on Br ~ 5%)
O(1) contribution from new physics is allowed
Alok, Baek, London (2011)
Bobeth, Haisch (2011)
Friday, June 8, 12

b
s
c
c
W
s
b
Friday, June 8, 12

Effective Z’Fox, Liu, Tucker-Smith, Weiner (2011)
L = �MQQc � y�qQc
˜Q = cos ✓Q+ sin ✓q
q̃ = � sin ✓Q+ cos ✓q
sin ✓ =yh�ip
|M |2 + |y2h�i|2
Q̄�µDµQ = g0 sin2 ✓Z 0µ¯̃q�µq̃ + · · ·
ge↵ = g0 sin2 ✓
MQ̃ 4⇡MZ0
ge↵
Friday, June 8, 12
hqe2i�q =
MqNP12
MqSM12
h̃qe2i�̃q =
�qNP12
�qSM12
Friday, June 8, 12

Mass difference : Delta Ms
Delta M is precisely measured
Friday, June 8, 12

lowing result from [5, 12, 13]
MNP12 =
4GF!2
1
g21
M2Z
M2Z!
"
!
1
3!6/23(gLsb)
2 +1
3!6/23(gRsb)
2 # 2 !3/23gLsbgRsb
"
1
4+
1
6
#
mBs
mb +ms
$2%
+4
3
&
!3/23 # !!24/23'
gLsbgRsb
"
1
24+
1
4
#
mBs
mb +ms
$2%(
f 2BsmBsBBs ,
(21)
where ! = "s(MZ!)/"s(mb). Using the value "s(MZ! $ MZ) $ 0.118, "s(mb) $ 0.22,
mt = 172.9 GeV,MW = 80.399 GeV, GF = 1.166"10!5 GeV!2, Vtb = 0.88, and Vts = 0.0387
from [14], we obtain
hs =7.79" 105
g21" Abs.
!
(gLsb)2 + (gRsb)
2 # 6 !!3/23gLsbgRsb
"
1
4+
1
6
#
mBs
mb +ms
$2%
+4&
!!3/23 # !!30/23'
gLsbgRsb
"
1
24+
1
4
#
mBs
mb +ms
$2%(
= (1.41" 106)" Abs.)
(gLsb)2 + (gRsb)
2 # kgLsbgRsb
*
,
(22)
where k $ 5.33 is given6 and ‘Abs.’ means the absolute value. The value of hs should be
as small as < 2.3 to satisfy the experimental constraint of (16). Therefore, the terms inside
the squared bracket of (22) must be as small as < 1.6 " 10!6. This result can be rewritten
as
Abs.)
(gLsb)2 + (gRsb)
2 # kgLsbgRsb
*
< 1.6" 10!6 . (23)
The quadratic form inside the Abs. symbol of (23) describes a complex hyperbolic surface.
With the inclusion of Abs. symbol, the hyperbolic surface is flipped along the asymptotic
complex lines satisfying
(gLsb)2 + (gRsb)
2 # k gLsbgRsb = 0 , (24)
or equivalently,
gRsb = agLsb , gRsb = (1/a)gLsb , (25)
where a $ 5.135268. On these asymptotic lines, #L = #R where #L,R is the phase of gL,Rsb
respectively. Consequently, the bound (23) indicate that the generic values of |gL,Rsb | must be
6 Actually, the coe!cients including k is sensitive on our initial choice of the input parameters.
10
smaller than 10!3 unless they are within (or close to) the asymptotic lines (25). Since the
!Ms constraint parametrized by (23) is highly stringent for |gL,Rsb | > 10!3, the parameter
space containing such values of couplings cannot avoid the fine tuning.
For the case that one of gL,Rsb is turned o", we can easily induce that the absolute value
of the remaining nonzero coupling must be definitely smaller than 1.8 ! 10!3. Therefore,
the required value of |gL,R!! | or |gL,Rcc | for the explanation of the dimuon charge asymmetry in
this case must be larger than 1, which is easily induced from analyzing the results in [4, 5].
B. !"s and !J/" #s from Bs " J/" !
The enhancement of the like-sign dimuon charge asymmetry is constrained by the exper-
imental measurement of the width di"erence !#s of the mass eigenstate B0s mesons, and
the phase di"erence !J/" #s between the Bs mixing and the b " scc̄ decay. These are simul-
taneously determined by measuring the indirect CP asymmetry of Bs " J/" ! decay. The
recent result from the LHCb of 1fb!1 integrated luminosity shows that [15]
!#s = 0.116± 0.018(stat.)± 0.006(syst.) ps!1 , (26)
!J/" #s = #0.001± 0.101(stat.)± 0.027(syst.) rad , (27)
in which !#s has about 1.2# deviation7 from (!#s)SM = (0.087 ± 0.021) ps!1 and !J/$ #s
agrees well with the SM prediction (!J/" #s )SM = Arg. ((VtsV "
tb)2/(VcsV "
cb)2) = #2$SM
s =
#0.036 ± 0.002 [3]. Such new LHCb results dramatically reduce the room of new physics
contribution in Bs # B̄s mixing compared to those of the previous LHCb (337 pb!1), the
CDF (5.2 fb!1), and the D0 (8.0 fb!1).
We first deal with the issue related with !J/" #s , whose measurement at the LHCb 1fb!1
shows the most dramatic changes compared to the previous ones. The analytic expression of
!J/" #s is well summarized in [16] and [5]. Neglecting the SM strong phases in the Bs " J/" !
process, we obtain [5, 16]
sin!J/" #s = # sin 2$SM
s + sin !sM + 2|r%| cos!s
M sin%% , (28)
where !sM = Arg.(M12/MSM
12 ) is from the NP phase in the dispersive part of Bs# B̄s mixing,
and the term with r% is from the NP phase in the b " scc̄ decay.
7 Note that the sign of !"s is fixed to be positive in this result.
11
Friday, June 8, 12
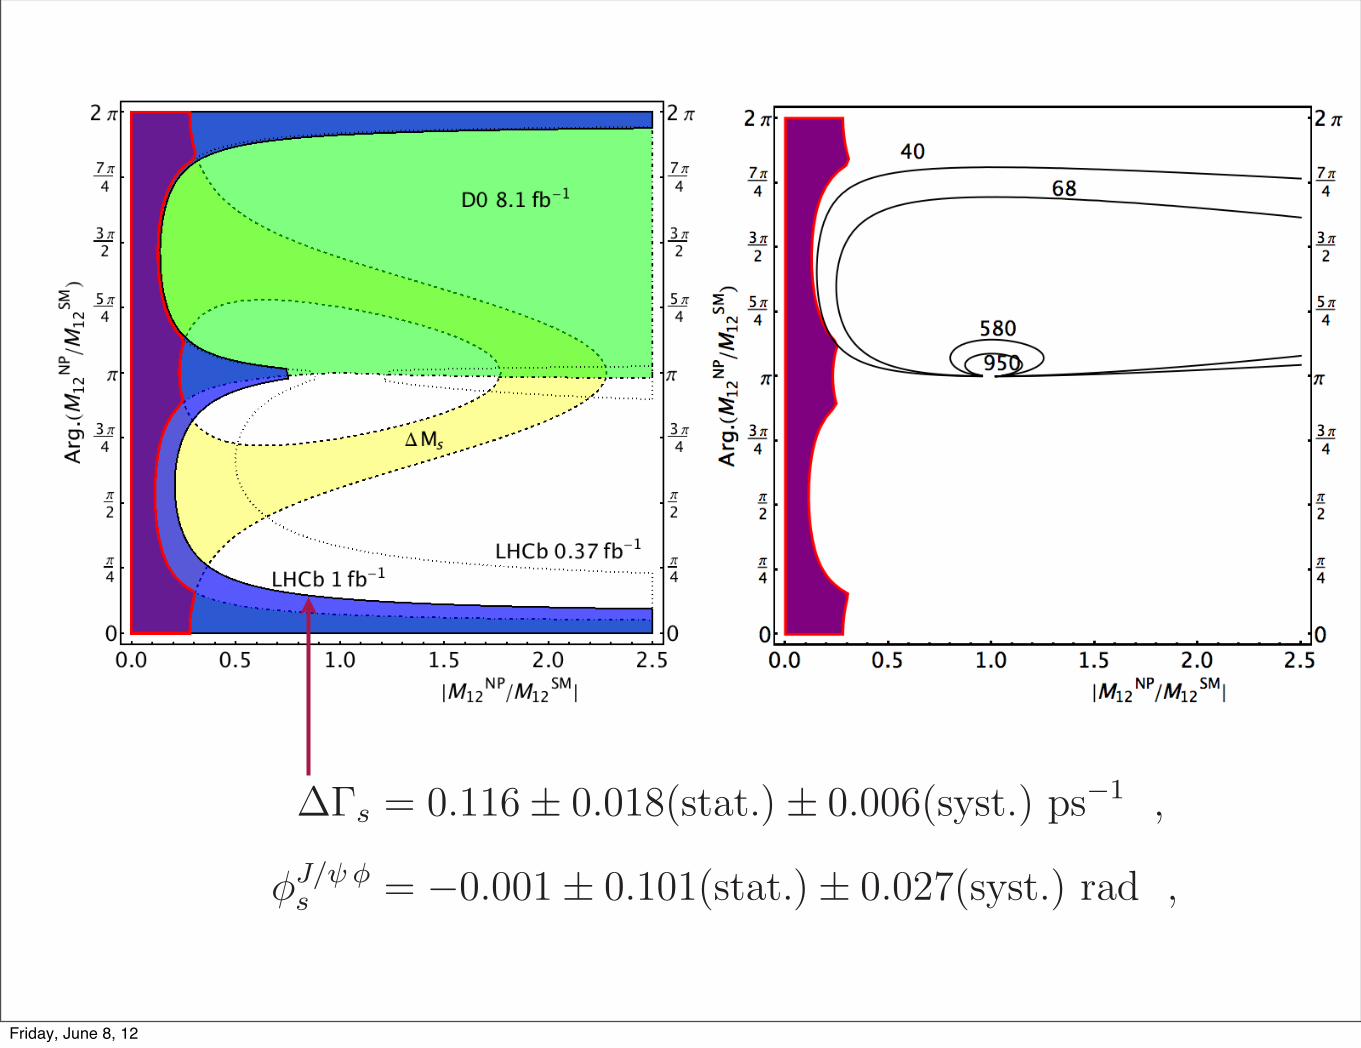
(a) Experimental bounds in the Bs sysmtem (b) Possible enhancement if !s12 = !sSM
12
FIG. 3. (a) The experimental bounds apply for the general NP scenarios without new phases in
b ! scc̄, such as the g!! scenario. The final allowed region of hs = |MNP12 /MSM
12 | and 2!s =
Arg.(MNP12 /MSM
12 ) from the "Ms, "J/" #s (LHCb 1fb!1, 0.37fb!1, and D0 8fb!1) constraints is
shown as the purple color surrounded by the thick red line. The yellow region (inside the dashed
line boundary) : allowed by 90% "Ms. The green region (inside the dot-dashed line boundary)
: allowed by 90% "J/" #s at the 8.0 fb!1 D0. ("J/" #s = 0.15 ± 0.18(stat.) ± 0.06(syst.) [17]). The
blue region (inside the line boundary) : allowed by 90% "J/" #s at the recent 1.0 fb!1 LHCb and
the boundary at the 0.37 fb!1 at the LHCb in the last year is denoted as the dotted lines. The
purple region surrounded by the thick red line denotes the allowed parameter space from all the
commented constraints. The remaining hs < 0.3 " 1, which provides a fine tuning choice in the
parameter space explaining ass$. (b) Without the NP contribution to !12, we represent the possible
enhancement of #ass$/(ass$)
SM with the numbers and the contours. In this case, the enhancement
is quite limited such that #ass$/(ass$)
SM < 40 to be consistent with all the experimental bounds.
When there is no NP phase contribution in b ! scc̄, such as g!! scenario in Z ",
we have r% = 0. Since we know that sin !sM = hs sin 2"s/
!
1 + h2s + 2hs cos 2"s =
(hs sin 2"s)"
!MSMs
!Ms$ hs sin 2"s, the small value of !J/" #
s requires hs sin 2"s to be also
small. Combining with the !Ms constraint, it is possible to show the allowed region in
terms of the general parameters hs and 2"s as Fig. 3. In such cases, the fine tuning
hs < 0.3 " 1 is required to avoid the constraints from the !Ms and !J" #s simultaneously.
12
smaller than 10!3 unless they are within (or close to) the asymptotic lines (25). Since the
!Ms constraint parametrized by (23) is highly stringent for |gL,Rsb | > 10!3, the parameter
space containing such values of couplings cannot avoid the fine tuning.
For the case that one of gL,Rsb is turned o", we can easily induce that the absolute value
of the remaining nonzero coupling must be definitely smaller than 1.8 ! 10!3. Therefore,
the required value of |gL,R!! | or |gL,Rcc | for the explanation of the dimuon charge asymmetry in
this case must be larger than 1, which is easily induced from analyzing the results in [4, 5].
B. !"s and !J/" #s from Bs " J/" !
The enhancement of the like-sign dimuon charge asymmetry is constrained by the exper-
imental measurement of the width di"erence !#s of the mass eigenstate B0s mesons, and
the phase di"erence !J/" #s between the Bs mixing and the b " scc̄ decay. These are simul-
taneously determined by measuring the indirect CP asymmetry of Bs " J/" ! decay. The
recent result from the LHCb of 1fb!1 integrated luminosity shows that [15]
!#s = 0.116± 0.018(stat.)± 0.006(syst.) ps!1 , (26)
!J/" #s = #0.001± 0.101(stat.)± 0.027(syst.) rad , (27)
in which !#s has about 1.2# deviation7 from (!#s)SM = (0.087 ± 0.021) ps!1 and !J/$ #s
agrees well with the SM prediction (!J/" #s )SM = Arg. ((VtsV "
tb)2/(VcsV "
cb)2) = #2$SM
s =
#0.036 ± 0.002 [3]. Such new LHCb results dramatically reduce the room of new physics
contribution in Bs # B̄s mixing compared to those of the previous LHCb (337 pb!1), the
CDF (5.2 fb!1), and the D0 (8.0 fb!1).
We first deal with the issue related with !J/" #s , whose measurement at the LHCb 1fb!1
shows the most dramatic changes compared to the previous ones. The analytic expression of
!J/" #s is well summarized in [16] and [5]. Neglecting the SM strong phases in the Bs " J/" !
process, we obtain [5, 16]
sin!J/" #s = # sin 2$SM
s + sin !sM + 2|r%| cos!s
M sin%% , (28)
where !sM = Arg.(M12/MSM
12 ) is from the NP phase in the dispersive part of Bs# B̄s mixing,
and the term with r% is from the NP phase in the b " scc̄ decay.
7 Note that the sign of !"s is fixed to be positive in this result.
11
Friday, June 8, 12

Figure 2: Unitarity triangle fit. In each plot inputs that are grayed out are not used to obtain the black contour(which represents the SM allowed 1� region), the p–value and the fit predictions presented in the upper leftcorners. The deviations of the fit predictions for sin(2�) and BR(B ! ⌧⌫) from the respective measurementsare obtained using the actual chi-square distribution for these quantities. The p-value of the complete SM fit(i.e. including all the inputs) is p
SM
= 1.7%. In the upper panel, we consider a scenario with a new phase in Bd
mixing, thereby removing the sin(2�) and ↵ inputs. In the lower panel we consider a scenario with new physicsin B ! ⌧⌫, thereby removing the BR(B ! ⌧⌫) input.
study a fit wherein no semi-leptonic input from b ! c or b ! u is being used. Instead, in thisfit BR(B ! ⌧⌫) and �M
Bs along with ✏K
, �MBs/�M
Bd and � are used. Interestingly this fitgives
sin(2�)fit = 0.905± 0.047 , (6)
ffit
Bd= (202.9± 9.3) MeV (7)
Thus, once again, sin(2�) is o↵ by 3.1� whereas fBd is in very good agreement with directly
measured value which we again take to mean that the bulk of the discrepancy is in sin(2�) ratherthan in B ! ⌧⌫ or in V
cb
.Next we investigate the role of ✏
K
. In the bottom panel of Fig. 3 we show a fit where onlyinput from B-physics, namely �M
Bs/�MBd , �M
Bs , �, |Vcb
| and BR(B ! ⌧⌫) are used. Thisfit yields,
sin(2�)fit = 0.889± 0.055 , (8)
ffit
Bd= (200.7± 11) MeV (9)
Thus, sin(2�)fit is o↵ by ⇡ 2.4� and again ffit
Bdis in good agreement with its direct determination.
We are, therefore, led to conclude that the role of ✏K
in the discrepancy is subdominant and thatthe bulk of the new physics contribution is likely to be in B–physics. As before, the fact that
.
Demise of CKM & its aftermath
a
Enrico Lunghi† and Amarjiit Soni††b†Physics Department, Indiana University, Bloomington, IN 47405, USA
††Department of Physics, Brookhaven National Laboratory,Upton, NY 11973, USA
Using firmly established experimental inputs such as ✏K , �Md, �Ms, Br(B ! ⌧⌫), �, Vcb
along with corresponding lattice matrix elements which have been well studied and are infull QCD such as BK , SU3 breaking ratio ⇠, BBs and in particular without using Vub or thepseudoscalar decay constants fBd or fBs from the lattice, we show that the CKM-paradigmnow appears to be in serious conflict with the data. Specifically the SM predicted value ofsin 2� seems too high compared to direct experimental measured value by over 3�. Further-more, our study shows that new physics predominantly e↵ects B-mixings and Bd ! Ks, andnot primarily in kaon-mixing or in B ! ⌧⌫. Model independent operator analysis suggeststhe scale of underlying new physics, accompanied by a BSM CP-odd phase, responsible forbreaking of the SM is less than a few TeV, possibly as low as a few hundred GeV. Two possibleBSM scenarios, namely warped extra-dimensions and SM with a 4th generation, are brieflydiscussed. Generic predictions of warped flavor models are briefly discussed. While SM with4th generation (SM4) is a very simple way to account for the observed anomalies, SM4 isalso well motivated due to its potential role in dynamical electroweak symmetry breaking viacondensation of heavy quarks and in baryogenesis.
1 Introduction
The next big step in our understanding of particle physics will be the uncovering of the electro-weak symmetry breaking (EWSB) mechanism. The present and upcoming collider experiments
aInvited talk at the EW Moriond 2010bSpeaker
arX
iv:1
104.
2117
v3 [
hep-
ph]
27 Ju
n 20
11
Friday, June 8, 12

FIG. 4. We represent the allowed parameter space explaining the dimuon charge asymmetry
within 1! for the case i) in the contents. The purple region surrounded by the thick red line is
the case without the new phase in b ! scc̄ as explained in Fig. 3. The blue line represents the
extended bound of "J/! "s in the case i) where hs can be sizable to cancel the contribution from
the b ! scc̄. The contours denote the 50, 68, 580, and 950 of the ratio "ass#/(ass#)
SM. Even
with arbitrary contribution in ads#, we see that the bound of "J/! "s do not allow the enhancement
"ass#/(ass#)
SM = 68 to explain the dimuon charge asymmetry within 1!.
which provides a strong constraint on the values of |gL,Rsb gL,Rcc | unless the Z ! vector coupling
to the charm quark pair is axial. For |gLsb| # k+|gRsb|, the most stringent bound is obtained
from the ! = + case and | sin"+| $ | sin #R|. For the other case, the most stringent bound
is obtained from the ! = " case and | sin""| $ | sin #L|. Without considering the (almost)
axial vector-like interaction of Z !cc̄, the constraint (35) provides
|gRsbgL,Rcc sin #R| < O(10"5) ,
|gLsbgL,Rcc sin #L| < 10"4 .(36)
When #L = #R or |gLsb/gRsb| is far from 1, the angle | sin(2$̃s)| is approximately simplified as
| sin #L| or | sin #R| so that we can directly use the constraint (35) to check the allowed the
parameter space for the dimuon charge asymmetry.
14
smaller than 10!3 unless they are within (or close to) the asymptotic lines (25). Since the
!Ms constraint parametrized by (23) is highly stringent for |gL,Rsb | > 10!3, the parameter
space containing such values of couplings cannot avoid the fine tuning.
For the case that one of gL,Rsb is turned o", we can easily induce that the absolute value
of the remaining nonzero coupling must be definitely smaller than 1.8 ! 10!3. Therefore,
the required value of |gL,R!! | or |gL,Rcc | for the explanation of the dimuon charge asymmetry in
this case must be larger than 1, which is easily induced from analyzing the results in [4, 5].
B. !"s and !J/" #s from Bs " J/" !
The enhancement of the like-sign dimuon charge asymmetry is constrained by the exper-
imental measurement of the width di"erence !#s of the mass eigenstate B0s mesons, and
the phase di"erence !J/" #s between the Bs mixing and the b " scc̄ decay. These are simul-
taneously determined by measuring the indirect CP asymmetry of Bs " J/" ! decay. The
recent result from the LHCb of 1fb!1 integrated luminosity shows that [15]
!#s = 0.116± 0.018(stat.)± 0.006(syst.) ps!1 , (26)
!J/" #s = #0.001± 0.101(stat.)± 0.027(syst.) rad , (27)
in which !#s has about 1.2# deviation7 from (!#s)SM = (0.087 ± 0.021) ps!1 and !J/$ #s
agrees well with the SM prediction (!J/" #s )SM = Arg. ((VtsV "
tb)2/(VcsV "
cb)2) = #2$SM
s =
#0.036 ± 0.002 [3]. Such new LHCb results dramatically reduce the room of new physics
contribution in Bs # B̄s mixing compared to those of the previous LHCb (337 pb!1), the
CDF (5.2 fb!1), and the D0 (8.0 fb!1).
We first deal with the issue related with !J/" #s , whose measurement at the LHCb 1fb!1
shows the most dramatic changes compared to the previous ones. The analytic expression of
!J/" #s is well summarized in [16] and [5]. Neglecting the SM strong phases in the Bs " J/" !
process, we obtain [5, 16]
sin!J/" #s = # sin 2$SM
s + sin !sM + 2|r%| cos!s
M sin%% , (28)
where !sM = Arg.(M12/MSM
12 ) is from the NP phase in the dispersive part of Bs# B̄s mixing,
and the term with r% is from the NP phase in the b " scc̄ decay.
7 Note that the sign of !"s is fixed to be positive in this result.
11
Friday, June 8, 12

When Z’ couples to taus
Friday, June 8, 12

FIG. 5. This shows the consistency of explaining the observed ass! within 1!. The orange color
with thick line boundary region denotes !ass!/(ass!)
SM > 580 and the dashed line 68 when hs =
|MNP12 /MSM
12 | " 1 such as the g"" scenario. The experimental results with 90%C.L. !"s at the
LHCb 1fb!1 is shown with light green color, while the result of B+ # K+"+"! from [20] is
shown in the light purple color. Figure is simply depicted in terms of Re("sNP12 /"s SM
12 ) = h̃s cos 2!̃s
and Im("sNP12 /"s SM
12 ) = h̃s sin 2!̃s with the assumption that hs " 1. We can easily see that
the explanation of ass! and the experimental bound !"s are orthogonal since they depend on
the Im.("NP12 ) and Re.("NP
12 ), respectively. The three experimental results are only marginally
consistent.
Combining all the limits, we obtain the limit of the couplings as Fig. 6. The allowed range
of g## |gL,Rsb | from the 90% C.L. experimental bounds is shown. We deal with the case that
!L = !R $ !, which is considered in the fine-tuned region of (25). This figure is an example
! = "/4 and g## > 0. The rough upper limit of the coupling is obtained g## |gL,Rsb | < 3%10!4.
Even for the other cases, the upper limit is below 10!3.
In the gL"" scenario, this provides a strong direct upper bound of the couplings as shown
in Fig. 7. To explain the asymmetry within 1#, the value of |gR"" | must be much larger than
that of |gL"" |. 10
10 In this case, the anomaly cancellation in the g!! scenario is threaten, unless we assume a scenario like
17
Friday, June 8, 12

FIG. 6. The colored region denotes the parameter space allowed by the 90% C.L. experimental
bounds of g!! |gL,Rsb |. This is the case that !L = !R ! ! = "/4 and g!! > 0. This parameter space
is free from the !"s bound by making "sNP12 /"s SM
12 almost imaginary, as well as the !Ms bound.
Since gL"" = g!! , the rough upper limit of the coupling is obtained gL"" |gL,Rsb | ! 3" 10!4. Even for
the other cases, the upper limit is below 10!3.
D. sin 2# from B0 # J/$KS
In this section, we deal with the additional experimental bound when the NP phases con-
tribute to the b # scc process, such as the gcc scenario. This is the indirect CP asymmetry
sin 2! in the “golden plate” mode B # J/"KS. The SM prediction of sin 2! can be obtained
from the fit of the unitarity triangle. According to [25], we obtain sin(2!)fit = 0.731±0.038,
while the experimental measurements provide sin 2!meas = 0.668 ± 0.028. In this case, the
SM prediction is within 1# of the measured value. The detail analytic form of sin 2! is well
described in [16] and [5], which is similar to sin 2!s in Bs # J/" $ as (28). In the absence
of the SM strong phase,
sin 2!meas = sin(2!)fit + 2|r| cos(2!)fit sin% . (41)
the e#ective Z ! model [24]. This is because there is no way to cancel the SU(2)2U(1)! anomaly from the
gR!! coupling.
18
Z’ coupling to tau_L is highly constrained
Friday, June 8, 12

(a) Possible enhancement in ass!
(b) Limit of gL""/gR""
FIG. 7. The limit of the couplings explaining the observed ass! in the g"" scenario is shown. In
(a), the region inside the blue line box is those remained after applying the b ! s!!̄ constraint,
which is precisely shown in (b). In figure (b), we expressed the conservative exclusion region
(grey region) based on the experimental bounds of 90% C.L from the b ! s!!̄ processes, which is
|gL""gL,Rsb | < 3"10!4. This is the fine-tuned case that gRsb = agLsb and "L = "R = #/4 as an example.
This parameter space is free from the !"s bound by making "sNP12 /"s SM
12 almost imaginary, as well
as the !Ms bound. The ratio of #ass!/(ass!) is shown as a contour plot with the contours 68, 580,
and 950. To explain the asymmetry within 1$, the value of |gR"" | must be much larger than |gL"" |.
In the gcc scenario, the analytic form of |r| is obtained as
|r| =!
!
!
!
1
g21
M2Z
M2Z!
2(gLcc + gRcc)(gLsb + gRsb)
VcbV "cs · 0.17
!
!
!
!
$ (5.2" 102)" |(gLcc + gRcc)(gLsb + gRsb)| , (42)
and the angle ! is simply obtained in the fine-tuned case (25) such that ! = ", " + #.
Therefore, the allowed range with 90% C.L. of the experimental result and the SM fit is
obtained as
#1.4" 10!4 < |(gLcc + gRcc)(gLsb + gRsb)| sin! < 1.4" 10!5 . (43)
As the experimental bound by $J/# $s , this provides the strong constraint on the NP param-
eter space unless the coupling Z #cc̄ is (almost) axial vector-like. This bound will be shown
in Sec. V with other experimental constraints.
On the other hand, the fitting value of sin(2%)fit is enlarged if we drop the value of |Vub|
as an input since its inclusive and exclusive determination has a large di!erence. Instead,
19
Friday, June 8, 12

FIG. 8. We changed the parameters in Fig. 5 in terms of 2!̃s ! |gRsbgR!! | in the conservative case
that gL!! = 0.1gR!! and gRsb = agLsb (hs " 0). The description on the colored region is same as that
in Fig. 5. This shows better understanding on the limits of the couplings in the g!! scenario. We
see that the rough consistent region of |gRsbgR!! | is about 10!2 with ads"/(ads")
SM = 21.
charge asymmetry within 1! in the "2-fit
|gL,Rsb gL,R!! | > 1.8# 10!2 without (ads")NP ,
|gL,Rsb gL,R!! | > 6.2# 10!3 with ads"/(ads")
SM = 21 .(47)
Since |gL,R!! | < 1, the values of Max{|gL,Rsb |} cannot be smaller than $ 6.2 # 10!3 so that
the couplings gL,Rsb lie on the asymptotic lines (25), having more than 1% fine tuning. The
allowed parameter space is shown in Fig. 8 where we used gL!! = 0.1gR!! to maximally satisfy
the constraint by b % s##̄ as explained in Sec. IIIC. We see that the rough consistent region
of |gRsbgR!! | is about 10!2 with ads"/(ads")
SM = 21. We also show the allowed parameter space
of !"s and B+ % K+$+$! from [20], redrawn from the allowed region in Fig. 5.
Consequently, the g!! scenario where the Z " coupling to the $ pair enhances the ass"
requires the existence of the coupling |gL,Rsb gL,R!! | larger than about 10!2 to explain the dimuon
charge asymmetry. Therefore, this parameter space cannot avoid the fine tuning from the
!Ms constraint. In addition, due to the constraint from the b % s##̄ experiments, the
coupling |gL!! | must be as small as 3 # 10!4. This result demands a non-trivial approach
21
Friday, June 8, 12
When Z’ couples to charms
Friday, June 8, 12
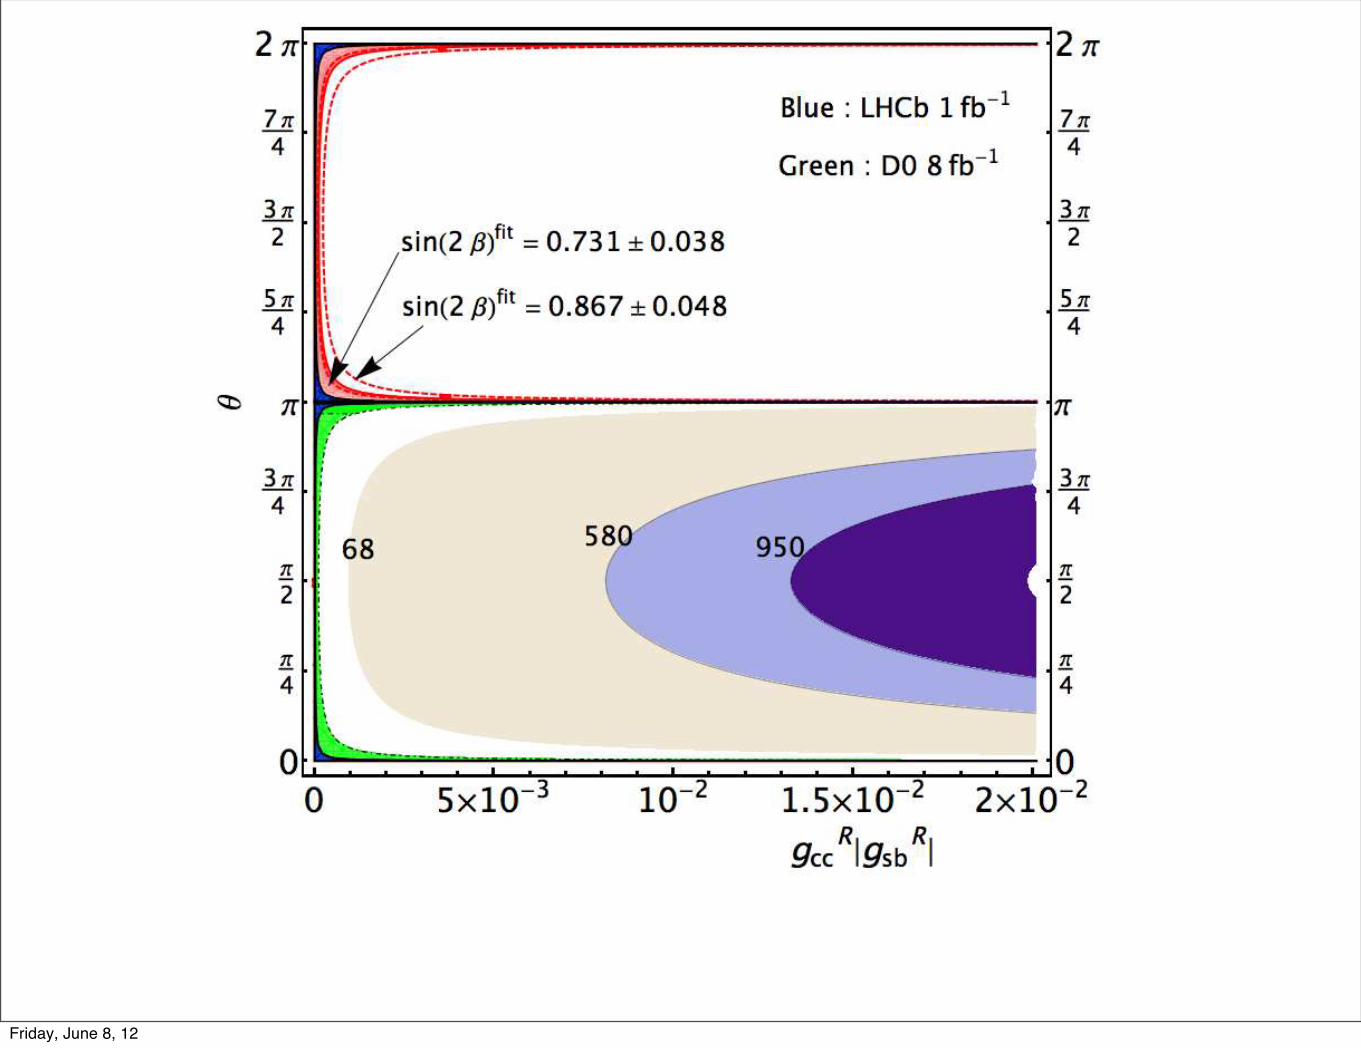
FIG. 9. We represent the allowed parameter space explaining the dimuon charge asymmetry by
fixing gLcc = 0 and gRcc > 0 on the fine tuning region gRsb = agLsb. (Therefore, !L = !R = !) The
numbers in the contours denote the ratio !ass!/(ass!)
SM as previous figures. The light pink region
denotes the 90% bound from the B0 " J/"KS considering the usual fit sin(2#)fit = 0.731± 0.038
and that surrounded by the red dashed line is for the special fit sin(2#)fit = 0.867 ± 0.048 in [26].
The latter case only constrains the parameter region $ < ! < 2$ in this case since the sign of
sin% # sin ! in (44) for gRcc > 0 and gRsb = agLsb is negative. The green region is that allowed by
the 90% &J/" #s at the 8.0 fb!1 D0. The blue region is 90% &J/" #s at the recent 1.0 fb!1 LHCb.
The minimum value of |gRccgRsb| to explain the D0 dimuon charge asymmetry within 1' is about
8 $ 10!3 and 10!3, without the NP contribution to ads! and with the maximal contribution of
ads!/(ads!)
SM = 21, respectively. These bounds do not satisfy the experimental constraints, which is
expected in our simple analysis.
in establishing an anomaly free model as mentioned at the end of Sec. IIIC. The allowed
parameter space explaining the observed ass! within 1! is marginally consistent with the
experimental bounds of !"s at the LHCb 1fb!1 and the result of B+ " K+"+"! from [20].
22
Friday, June 8, 12

FIG. 10. We show what extent the interaction Z !cc̄ should be axial vector-like in this figure. For
various values of the di!erence !c ! (gLcc + gRcc)/gRcc, our parameter space explaining the dimoun
charge asymmetry is shown for !c > 0, by fixing gRsb " (1/a)gLsb with "L = "R = 3#/2, which
is di!erent from the case in Fig. 9. The numbers in the contours denote the value of the ratio
#ass!/(ass!)
SM. The contour line with pink color is the boundary #ass!/(ass!)
SM = 68 which demand
ads!/(ads!)
SM = 21 to explain the dimoun charge asymmetry within 1$ in the fit of Fig. 1. The
meshed blue region denotes the allowed region by the recent LHCb 1fb"1 result of %J/" #s and the
light red is that explaining the sin 2& with the special fit sin(2&)fit = 0.867 ± 0.048 proposed in
[26]. Of course, the upper bound using the usual fit will be roughly around the lower bound of
the light red region. In this case, the coupling |gRccgRsb| > 7.5 $ 10"3 and 10"3 are required for the
explanation of the asymmetry within 1$ without the NP contribution to ads! and with the maximal
contribution of ads!/(ads!)
SM = 21, respectively. Our parameter space with #ass!/(ass!)
SM > 580
and ads!/(ads!)
SM = 1 can simultaneously explain the recent LHCb 1fb"1 result and the sin 2& with
special fit of sin 2& in [26] for !c < 3$ 10"2.
the dimuon charge asymmetry within 1! without any NP contribution in ads!, we have
!
!
"
1.15gLsb # 1.76gRsb#
gRcc +"
#1.03gLsb + 0.64gRsb#
gLcc!
! · | sin "L(R)| > 1.3$ 10"2 , (52)
24
Friday, June 8, 12
Conclusion
We need A^b from Bd : working in progress
It is notoriously difficult to explain the dimuon charge asymmetry solely in terms of Bs CPV.
Before LHCb, Z’ coupling to charms looked attractive.
After LHCb, Z’ coupling to charms is as bad as to taus.
After LHCb, axial-vector coupling of Z’ to charms works.(if charm_L induced flavor violation can be ignored)
Friday, June 8, 12