![Walking like an ant: a quantitative and experimental ...rspb.royalsocietypublishing.org/content/royprsb/284/1858/20170308... · with the bright colours of a butterfly [3] or grasshoppers](https://static.fdocuments.in/doc/165x107/5a9f1b977f8b9a8e178c5648/walking-like-an-ant-a-quantitative-and-experimental-rspbro-the-bright-colours.jpg)
LARGE CAP VALUE EQUITY - LADWPretirement.ladwp.com/AgendaItems/20170308 Item 12.pdf · MFS® LARGE...
42
Transcript of LARGE CAP VALUE EQUITY - LADWPretirement.ladwp.com/AgendaItems/20170308 Item 12.pdf · MFS® LARGE...


22342.6 exp31JUL17FOR INSTITUTIONAL USE ONLY
MFS® LARGE CAP VALUE EQUITY
Presented to
Los Angeles Department of Water and Power 8 March 2017
The Russell 1000® Value Index is a trademark/service mark of the Frank Russell Company, Russell® is a trademark of the Frank Russell Company.

MFS® Large Cap Value Equity299-I-CT-LCV-8Mar17
Presenters
Kate Mead, CFA - Investment Officer- Institutional Equity Portfolio Manager- As an Institutional Portfolio Manager, participates in the research process and strategy discussions.
Assesses portfolio risk, customizes portfolios to client objectives and guidelines, and manages dailycash flows. Communicates investment policy, strategy, and positioning.
- Joined MFS in 1997; previous positions include Equity Research Analyst.- Previous experience includes 2 years as Financial Analyst - Real Estate Advisory Services at
Coopers & Lybrand, Financial Advisory Services.- Affiliations include Boston Security Analysts Society, Inc., CFA Institute- University of Pennsylvania, MBA- Villanova University, BS, magna cum laude
Carolyn Lucey, CIMA - Director, Relationship Management- As a Relationship Manager, responsible for the overall client experience including communicating
portfolio positioning, strategy, and performance attribution and ensuring that our clients' ongoing serviceneeds are met.
- Joined MFS in 1998; previous positions include Investment Director for Private Portfolio Services; VicePresident, Director of Product Management; Assistant Vice President, Domestic Equity Product Manager.
- Previous experience includes 1 year as Product Manager at Van Kampen American Capital; 6 years asProduct Manager at John Hancock Funds; 2 years as Associate at Putnam Investments.
- Affiliations include Investment Management Consultants Association (IMCA)- Manhattanville College, BA
MFS® Large Cap Value Equity299-I-CT-LCV-8Mar17
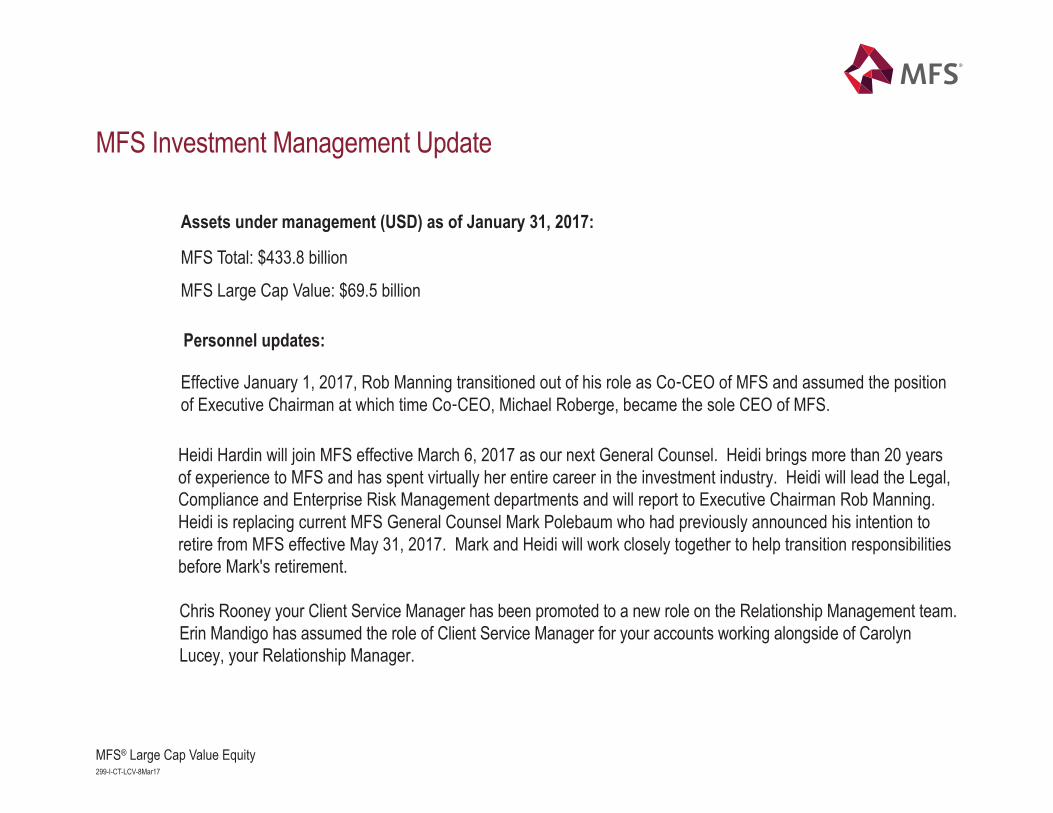
MFS Investment Management Update
Assets under management (USD) as of January 31, 2017:
MFS Total: $433.8 billion
MFS Large Cap Value: $69.5 billion
Chris Rooney your Client Service Manager has been promoted to a new role on the Relationship Management team. Erin Mandigo has assumed the role of Client Service Manager for your accounts working alongside of Carolyn Lucey, your Relationship Manager.
Effective January 1, 2017, Rob Manning transitioned out of his role as Co‐CEO of MFS and assumed the position of Executive Chairman at which time Co‐CEO, Michael Roberge, became the sole CEO of MFS.
Heidi Hardin will join MFS effective March 6, 2017 as our next General Counsel. Heidi brings more than 20 years of experience to MFS and has spent virtually her entire career in the investment industry. Heidi will lead the Legal, Compliance and Enterprise Risk Management departments and will report to Executive Chairman Rob Manning. Heidi is replacing current MFS General Counsel Mark Polebaum who had previously announced his intention to retire from MFS effective May 31, 2017. Mark and Heidi will work closely together to help transition responsibilities before Mark's retirement.
Personnel updates:

MFS® overview
We apply a uniquely collaborative approach to build better insights for our clients
Integrated ResearchWe look at investment opportunities across the globe byintegrating fundamental equity, quantitative and creditdisciplines in our analysis.
Global CollaborationOur team philosophy and incentive structure ensure strong collaboration across the firm.
Active Risk ManagementWe take a holistic approach to actively managing risk withreviews in place at security, portfolio and firm levels and aclear focus on generating alpha for our clients.
1MFS® Large Cap Value Equity299-I-CT-LCV-8Mar17.1

2MFS® Large Cap Value Equity299-I-CT-LCV-8Mar17.2
Business profile (USD)426 billion total MFS AUM
Global equities (21%)
EAFE/International equities (20%)
US equities (34%)
Regional equities (6%)
Fixed Income (13%)
Multi-Strategy (5%)
Asia Pacific (36%)
EMEA (23%)
North America (41%)
RegionsInstitutional business by client type and region3
Client types
• Defined benefit/defined contribution
• Endowment and foundation
• Sovereign wealth fund/government agency
• Institutional platform/insurance subadvisory
Well-diversified business across clients, regions, and investment strategies
Diversified client and asset base1
AssetsGlobal equities 88.2 billionEAFE/international equities 86.7 billionUS equities 144.3 billionRegional equities 26.8 billionFixed Income2 57.1 billionMulti-strategy/Other 22.5 billion
Assets
As of 31-Dec-16.1 Data is rounded to the nearest figure. 2 Total fixed income assets, including non-dedicated fixed income mandates are 77 billion USD.3 Represents global clients in institutional vehicles only. 28452.13 ex31OCT17

3MFS® Large Cap Value Equity299-I-CT-LCV-8Mar17.3
MFS investment professionals
As of 31-Dec-16.Years = average years industry experience.
1 Member of Investment Management Committee.
47 equity portfolio managers
22 years
President, Chief Executive Officer and Chief Investment Officer – Michael Roberge1
Vice Chairman – David Antonelli1
34 fixed income analysts 18 years
64 equity analysts 13 years
9 quantitative analysts 14 years
22 fixed income portfolio managers
26 years
8 quantitative portfolio managers
22 years
Portfolio management(77)
Research team(107)
Trading(31)
Trading Analytics(2)
Gregory Heller1, Director of Global Fixed Income Trading Brenda Farley1, Director of Global Equity Trading14 equity traders – 18 years
17 fixed income traders – 20 years
Jeffrey Estella1, Director of Trading Analytics1 trading analytics analyst – 14 years
Executive ChairmanRobert Manning1
8 fixed income associates 4 years
21 equity associates 5 years
15 quantitative associates 10 years
Research/investmentassociates
(44)
TOTAL261

4MFS® Large Cap Value Equity299-I-CT-LCV-8Mar17.4
Mark Garabedian,Transaction Cost Specialist
Robb Mansi, Director of Global Investment and Client Support
Matthew HalperinJohn McAreeJulie O’Dette
Jennifer RoshonMatthew Sweeney
Justin DonohueSteven DonovanChristopher Frier
Trading and Analytics Investment Operations
MFS equity investment professionals
Michael FlintCharles GraulRobert JohnsonMarc Pascal
Alfred SabloneMichael SpallaEric TrachMatt Wilkinson
Jennifer BlanchetteAlan BrownRichard DeveneyClaudio Faiella
Executive Chairman – Robert ManningPresident, Chief Executive Officer, and Chief Investment Officer – Michael Roberge
Vice Chairman – David AntonelliChief Investment Officer – Global Equity – Kevin Beatty
Chief Investment Risk Officer, Director of Quantitative Solutions – Joseph Flaherty
Brenda Farley, Director of Equity Trading
Fundamental Research
David FalcoMolly Frew Genevieve Gilroy Lionel GomezSimon GreshamWard Griffiths Katharine JacksonJude JasonZahid KassamSalman KhanYuko KikuchiTakeyuki KoraBradford Mak Stuart McPherson Sandeep MehtaAyako Mikami Colin MooreJohnathan MunkoRaj NairVipin NarulaJames NealeRichard Offen
Mariana AraujoKoki AkalaMichael AurelioRyan BallAparna Bedi TannaIan BigneyEric Braz Stephen CampfieldKatherine CannanJeffrey ChoMaile ClarkTim ClarkChristopher CorkThomas Crowley Poojah DaftaryShanti Das-WermesClaud DavisEdward DearingNicholas DemkoTimothy Dittmer Reinier DobbelmannPhilip Evans
Alison O’Neill MackeyMariana PaixaoHarry PurcellAndrew QuatraleMarco QuizaC.V. RaoMatthew ScholderErica SchulteJames SchusterDeividas SeferisEleanor ShingJoseph Skorski Florence TajGaurav TewaryJeanine ThomsonScott WalkerStephen WhiteRobert WilsonKevin Wei-Cher YeohDonald Zhang
QUANTITATIVE Dino DavisJames FallonMatthew KrummellJonathan SageJohn Stocks
Portfolio Management
VALUENevin ChitkaraPablo de la MataAnne-Christine FarstadRick GableSteven Gorham Camille Humphries LeeKatrina MeadJeffrey MorrisonKevin SchmitzMaura ShaughnessyDavid ShindlerBenjamin StoneBrooks TaylorBarnaby Wiener
COREKevin BeattyFilipe BenzinhoGabrielle GourgeyVictoria HigleyChristopher JenningsBen KottlerDaniel LingJoseph MacDougallEdward MaloneyDavid MannheimRyan McAllisterRoger MorleySanjay NatarajanMarcus Smith Chris Sunderland
GROWTHRobert AlmeidaDavid AntonelliMatthew BarrettAndrew BoydJeffrey ConstantinoKevin DwanEric FischmanBrett FleishmanPeter FruzzettiJose Luis GarciaPaul GordonMichael GrossmanJamie KeatingRobert LauThomas MelendezDimi NtantoulisMatthew SabelNicole Zatlyn
Bradley Zancanaro
Quantitative Research
Mark CitroNoah RumpfShruthi SaralayaMichael TataBhushan VartakJenney Zhang
Jeffrey Estella, Director of Trading Analytics and Investment Operations
Trading and Risk Analytics
As of 31-Dec-16.

Nevin ChitkaraPortfolio Manager
23 years industry experience
Steven Gorham, CFAPortfolio Manager
26 years industry experience
Kate Mead, CFAInstitutional Portfolio Manager
21 years industry experience
Experienced MFS Large Cap Value Equity team
Additional resources
Gary Hampton, CFAInvestment Product Specialist
19 years industryexperience
Camille Lee, CFAInstitutional Portfolio Manager
26 years industry experience
Joseph MacDougall, CFAInstitutional Portfolio Manager
21 years industry experience
Barnaby WienerPortfolio Manager22 years industry
experience
Brooks TaylorPortfolio Manager22 years industry
experience
Benjamin Stone, IIMRPortfolio Manager20 years industry
experience
Pablo de La MataPortfolio Manager12 years industry
experience
Jonathan Sage, CFAPortfolio Manager20 years industry
experience
Jeffrey MorrisonPortfolio Manager27 years industry
experience
Kevin SchmitzPortfolio Manager21 years industry
experience
David ShindlerPortfolio Manager15 years industry
experience
5MFS® Large Cap Value Equity299-I-CT-LCV-8Mar17.5
Experienced management, tested by markets, backed by depth

6MFS® Large Cap Value Equity299-I-CT-LCV-8Mar17.6
Commitment to world class client service results in enduring relationships
Representative MFS institutional client list1Serving over 800 institutional clients globally
Public funds • Andra AP-Fonden• Bureau of Labor Funds, Taiwan• Canada Post Corporation, Canada• City of Phoenix• County of Los Angeles• Federation of National Public Service Workers Personnel
Mutual Aid Associations, Japan• Government Pension Investment Fund of Japan• Government Pension Fund, Thailand• Hospital Authority Provident Fund Scheme, Hong Kong• Kapitalforeningen Lærernes Pension Invest, Denmark• Kapitalforeningen LD• LSR, The Pension Fund for State Employees in Iceland• Nebraska Investment Council• Parliamentary Contributory Pension Fund
1 As of 31-Dec-16. This does not represent a complete list of MFS’ institutional clients. The selection of clients represents a sampling of those who have agreed to the use of their names. It is not known whether the listed clients approve or disapprove of MFS Institutional Advisors Inc. or the advisory service provided. The criteria used to include the above listed clients are a mix of
investment style, type of client, and other considerations.
Corporate• American Airlines• Bristol-Myers Squibb• CenturyLink• Chrysler• Manulife Financial, Canada• Mitsubishi Electric Pension Fund• Nestlé• Panasonic Pension Fund, Japan• PepsiCo Inc.• Robert Bosch GmbH• Telstra Super, Australia• Toyota Motor Corporation, Japan
Sub-advised accounts• ANZ New Zealand Investments• GuideStone Capital Management• NTUC Income Insurance, Singapore• Russell Investment Group
Non-profit & other• Archdiocese of New York• Children’s Hospital of Pittsburgh• Construction and Building Industry
SuperannuationFund, Australia
• Furman University• National Gallery of Art• Northwell Health System, Inc.• Oregon and Southwest Washington Painters• Providence College• REST Industry Super, Australia• Saskatchewan Healthcare Employees' Pension
Plan, Canada• Texas A&M Foundation• Trinity University• UFCW Tri-State Pension• Unipension• University of British Columbia, Canada• University of Western Ontario, Canada
30848.6

7MFS® Large Cap Value Equity299-I-CT-LCV-8Mar17.7
Your MFS relationship team
Carolyn LuceyDirectorRelationship Management
Phone: +1.617.954.5980Email: [email protected]
Erin Mandigo
Client Service Manager
Phone: +1.617.954.4046Email: [email protected]
MFS Institutional Advisors, Inc111 Huntington Avenue
Boston, MA 02199Tel: +1.617.965.5000
Boston • Hong Kong • London • Mexico City • Sao Paulo • Singapore • Sydney • Tokyo • Toronto

8MFS® Large Cap Value Equity299-I-CT-LCV-8Mar17.8
Disciplined focus on high quality, attractively valued companies to provide compelling long-term risk-adjusted returns
Goals • Outperform the Russell 1000® Value Index with lower volatility over full market cycles• Achieve a competitive ranking in relevant peer universes over full market cycles
PhilosophyThe tenets of our investment philosophy are based upon the following beliefs: • Valuation is one of the most important drivers of stock price performance• Quality is underappreciated by the market
Strategy
We leverage our bottom-up, global research platform to identify undervalued, high quality companies that: • Have sustainable, durable franchises• Generate significant free cash flow• Maintain strong balance sheets• Have strong management teams who are good stewards of capital
Our valuation approach is flexible, but we place a strong emphasis on cash flow and returns-basedmethodologies
We focus on downside risk management at the individual security level
Focus on quality and valuation has driven strong long-term risk-adjusted returns

9MFS® Large Cap Value Equity299-I-CT-LCV-8Mar17.9
BOSTONTORONTO
MEXICO CITY
SÃO PAULO
SYDNEY
SINGAPORE
HONG KONG
TOKYO
LONDON
Idea generation
Collaborative research environment
98 fundamental researchanalysts: 28 U.S. equityanalysts and 36 non-U.S.equity analysts; 34 creditanalysts; backed by 29research/investmentassociates
8 global sector teamsorganized by region and sectors
Extensive integrationacross equity and fixedincome, geographies andasset classes
77 portfolio managerswith significant industryexperience in value, core,growth, quantitative andfixed income
Quantitative researchteam: 9 quantitativeanalysts provide proprietaryresearch models, stockrankings, and scenariotesting; backed by15 quantitative researchassociates
Fundamental research & valuation analysis
Analysis & construction
Global research platform
We believe global collaboration and integration provide competitive advantages
As of 31-Dec-16.
MFS Large Cap Value Equity portfolio
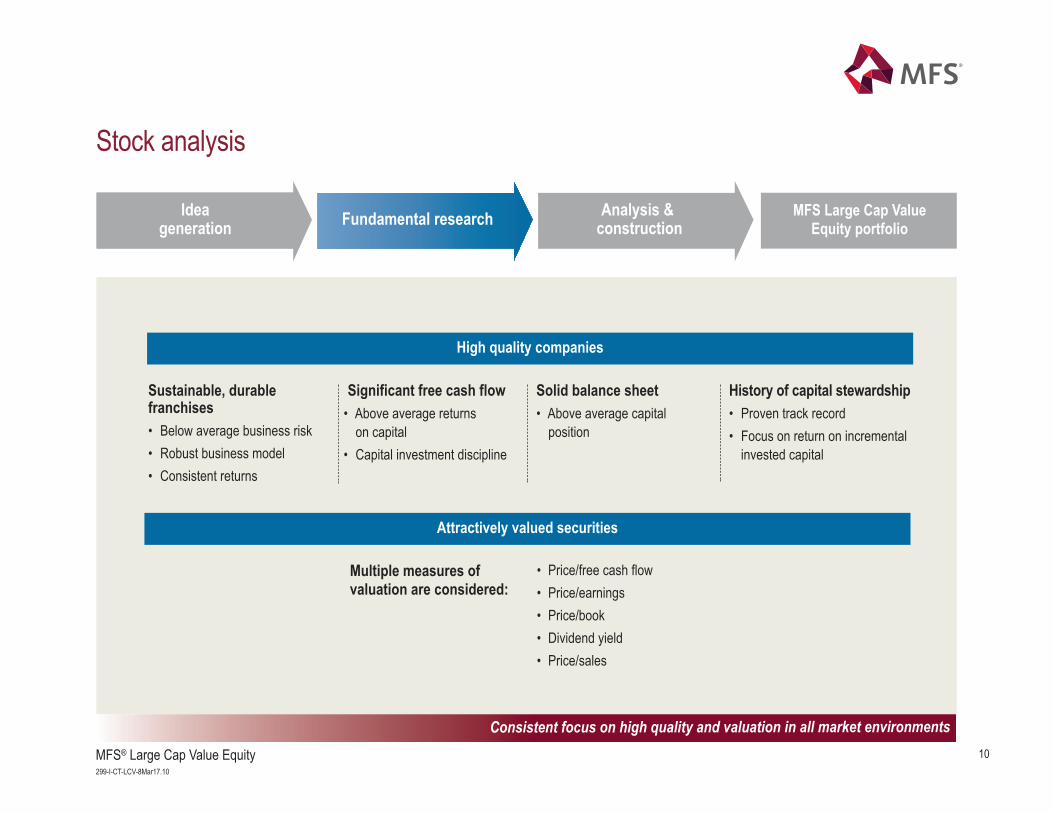
MFS Large Cap Value Equity portfolioFundamental research Idea
generationAnalysis &
construction
Sustainable, durable franchises• Below average business risk• Robust business model• Consistent returns
High quality companies
Significant free cash flow• Above average returns
on capital• Capital investment discipline
Solid balance sheet• Above average capital
position
History of capital stewardship• Proven track record• Focus on return on incremental
invested capital
Attractively valued securities
Multiple measures of valuation are considered:
• Price/free cash flow• Price/earnings• Price/book• Dividend yield• Price/sales
Stock analysis
Consistent focus on high quality and valuation in all market environments10MFS® Large Cap Value Equity
299-I-CT-LCV-8Mar17.10

11MFS® Large Cap Value Equity299-I-CT-LCV-8Mar17.11
MFS Large Cap Value Equity portfolioAnalysis & constructionFundamental researchIdea generation
Buy analysis
• Sustainable, durable franchises• Significant free cash flow• Solid balance sheet• History of capital stewardship• Attractively valued securities
Sell analysis
• Stock becomes expensive• Better alternative available• Breakdown in quality dimensions
Portfolio construction
• Determine position size by conviction, risk andreward, and liquidity
• Manage risk- Security level assessment: operational risk,
financial risk, valuation risk• Maintain well diversified large-cap value portfolio
Focus on downside risk management in making all investment decisions
Portfolio construction

12MFS® Large Cap Value Equity299-I-CT-LCV-8Mar17.12
MFS Large Cap Value – investing for the long term
0 – 1Year
1 – 3Years
3 – 5Years
5 - 10Years
10+Years
Prop
ortio
n of p
ortfo
lio (%
)
7.8
12.1 13.0
39.8
27.3
Data as of 31-Dec-16. Portfolio holdings duration since inception of strategy.
Weighted average holdings duration: 7.8 years

13MFS® Large Cap Value Equity299-I-CT-LCV-8Mar17.13
Longer time horizon provides alpha opportunites
Source: NYSE
0
1
2
3
4
5
6
7
8
9
2001 2002 2003 2004 2005 2006 2007 2008 2009 2010 2011 2012 2013 2014 2015 2016
Ave
rage
ho
ldin
g p
erio
d (
ye
ars
)
MFS Large Cap Value EquityNYSE Average1

14MFS® Large Cap Value Equity299-I-CT-LCV-8Mar17.14
1Q98
2Q
98
3Q98
4Q
98
1Q99
2Q
99
3Q99
4Q
99
1Q00
2Q
00
3Q00
4Q
00
1Q01
2Q
01
3Q01
4Q
01
1Q02
2Q
02
3Q02
4Q
02
1Q03
2Q
03
3Q03
4Q
03
1Q04
2Q
04
3Q04
4Q
04
1Q05
2Q
05
3Q05
4Q
051Q
062Q
063Q
064Q
061Q
072Q
073Q
074Q
071Q
082Q
083Q
084Q
081Q
092Q
093Q
094Q
091Q
102Q
103Q
104Q
101Q
112Q
113Q
114Q
111Q
122Q
123Q
124Q
121Q
132Q
133Q
134Q
131Q
142Q
143Q
144Q
141Q
152Q
153Q
154Q
151Q
162Q
163Q
164Q
16
-10
-5
0
5
10
15
Perc
ent (
%)
MFS Large Cap Value outperformed Russell 1000® Value Index MFS Large Cap Value underperformed Russell 1000® Value Index
200400600800
100012001400160018002000
Basis
poin
ts Decreased appetitefor risk
Decreased appetite for risk
Heightened appetite for risk
Heightened appetite for risk
Decreased appetite for risk
Yield Premium: Barclays U.S. High-Yield Corporate Bond Index Spread Over U.S. 10 Year Treasuries
Past performance is no guarantee of future results. This exhibit is not designed to assert a direction in performance, but rather highlights the historical relationship between our Large Cap Valuestrategy and the spread environment given the strategy’s focus on having less risk than the market. For complete performance results, please see Composite Report in appendix. Sources: Barclays and SPAR, FactSet.
1 Russell 1000® Value Index.2 Periods over 1 year are annualized.
Value Strategy Value Strategy Value Strategy Value Strategy Value Strategy Value StrategyOutperformed1 Underperformed1 Outperformed1 Underperformed1 Outperformed1 Underperformed1
1Q98 – 3Q02 4Q02 – 2Q07 3Q07 – 1Q09 2Q09 – 2Q14 3Q14 – 1Q16 2Q16 – 4Q16Relative performance2 +6.2% -0.9% +7.7% -1.4% +3.4% -3.3%Absolute performance2 +5.6% +18.3% -25.5% +20.3% +4.8% +12.2%
Investor risk appetite has influenced relative performance
Historical relationship between market’s risk appetite and the MFS Large Cap Value strategy (USD)
Heightenedappetite for risk

15MFS® Large Cap Value Equity299-I-CT-LCV-8Mar17.15
Focused on downside risk management, upside participation
Historical relative performance in diverse markets (USD)
1 Russell 1000® Value Total Return.Source: benchmark performance from SPAR, FactSet Research Systems Inc.
Down markets Up markets Total0
5
10
15
20
25
30
35
40
45
Numb
er of
quar
ters a
bove
/below
benc
hmar
k
Number of outperforming quarters
Number of underperforming quarters
MFS Large Cap Value Equity Composite (gross of fees) vs Russell 1000® Value Index, Jan 1998 - December 2016
Average quarterly +1.9% -0.1% +0.5%relative performance
Up marketscapture ratio = 98%
Down marketscapture ratio = 77%

16MFS® Large Cap Value Equity299-I-CT-LCV-8Mar17.16
LADWP’s investment guidelines 1. The Portfolios shall be equity securities of companies doing business in the United States. It is expected that the Portfolios will
be fully invested (<5% cash) at all times. Equity securities shall be restricted to those issues listed on the New York, American,NASDAQ, or other nationally recognized United States stock exchanges.
2. The Board recognizes the Manager is an active manager investing in a universe of securities that resembles the Russell 1000®
Value Index. The Manager will adjust its Portfolios on an ongoing basis to attempt to outperform the investment results of theRussell 1000® Value Index.
3. The Manager shall not use derivatives within the Portfolios without the expressed written consent of the Plan. If the Managerelects to use derivatives as part of its investment strategy, the Plan requires that the Manager provide written documentation of the rationale for using such instruments. Use of derivatives for speculation is prohibited. Only exchange-traded derivativeswill be utilized.
4. For prudent diversification, no more than 5% of the Portfolios shall be invested in any one issue as of the time of purchase,unless that issue represents more than 5% of the Russell 1000® Value Index. In such cases, the maximum amount allowed is125% of the benchmark weight. At no time shall any specific issue represent more than 10% of the Portfolios. In addition, noissue shall be purchased in the Portfolios if more than 10% of the outstanding shares of that company are held by the Managerin the total of all of its accounts.
5. The Manager shall invest in securities specifically authorized in these written guidelines. Unauthorized investments includeforeign securities listed and traded on U.S. exchanges, including American Depository Receipts (ADRs). All foreign securitiesexcept for Benefit Driven Incorporations (BDIs) included in the Russell Indexes are unauthorized. Additional unauthorizedinvestments include short sales, futures, direct investment in raw commodities, and the use of non-approved derivativesecurities (i.e. equity futures and forward contracts), and/or the purchase of securities on margin.

17MFS® Large Cap Value Equity299-I-CT-LCV-8Mar17.17
Style performance (%), one year as of 31-Jan-17 Russell 1000® Value sector performance (%), one year as of 31-Jan-17
Russell2000Value
RussellMid Cap
Value
Russell2000
Growth
Russell1000Value
RussellMid CapGrowth
S&P 500 Russell1000
Growth
MSCIEAFE
40.2
29.2 26.9 24.620.0 20.0 17.2
12.0
Mater
ials
Fina
ncial
s
Indus
trials
Infor
matio
nTe
chno
logy
Ener
gy
Telec
ommu
nicati
onSe
rvice
s
Cons
umer
Disc
retio
nary
Utilit
ies
Real
Estat
e
Healt
h Car
e
Cons
umer
Stap
les
57.6
35.2 33.1 31.026.8
18.1 17.913.2 13.0 10.8 8.7
Market and portfolio overview
Portfolio performance (%), one year as of 31-Jan-17
Portfolio Value (Employees’ Retirement, Disability & Death Benefit Plan)Beginning value as of 18-Feb-04 243,663,470Contributions +31,873,721Withdrawals –238,016,361Change in market value +475,173,789Ending value as of 31-Jan-17 512,694,619
Source: benchmark performance from SPAR, FactSet Research Systems, Inc.Past performance is no guarantee of future results.
Employees' Retirement,Disability & DeathBenefit Plan (net)
Retiree HealthBenefits Fund (net)
Russell 1000 Value
21.5 21.124.6
Portfolio Value (Retiree Health Benefits Fund)Beginning value as of 15-Sep-09 42,450,334Contributions +11,824,326Withdrawals –34,956,819Change in market value +66,880,043Ending value as of 31-Jan-17 86,197,884

18MFS® Large Cap Value Equity299-I-CT-LCV-8Mar17.18
Risk appetite changed throughout the year
1 Based on composite data compared to the Russell 1000 Value index Source: FactSet, iShares iBoxx $ Investment Grade Crop Bond and iShares iBoxx $ High Yield Corporate Bd Returns YTD through 12/30/2016. Past performance is no guarantee of future results.
-10%
-8%
-6%
-4%
-2%
0%
2%
4%
6%
Jan-16 Feb-16 Mar-16 Apr-16 May-16 Jun-16 Jul-16 Aug-16 Sep-16 Oct-16 Nov-16 Dec-16
Relative Performance:Investment Grade Corporate Bonds vs. High Yield Corporate Bonds
MFS Large Cap
Value outperforms1
MFS Large Cap
Value underperforms1

19MFS® Large Cap Value Equity299-I-CT-LCV-8Mar17.19
Year end 2016: elevated risk appetite
Source: Strategas
300
500
700
900
1100
1300
1500
1700
Telecom Energy Financials Discretionary Materials Health Care Industrials Technology Staples Utilities
Spre
ad (
bps)
High Yield Sector SpreadsCurrent Reading vs. 52-Week High & 52-Week Low
High yield spreads are
at 52-week lows for
9 out 10 sectors
52-Week High
52-Week Low
Current

20MFS® Large Cap Value Equity299-I-CT-LCV-8Mar17.20
Lower stock correlations = good long term opportunities
Source: Strategas
0.35
0.40
0.45
0.50
0.55
0.60
0.65
0.70
0.75
Jan Apr Jul Oct Jan Apr Jul Oct Jan Apr Jul Oct Jan Apr Jul Oct
S&P 500 Rolling 65-Day Correlations
2013 2014 2015 2016
China Devaluation Oil at $26
Brexit
Election
Correlations reach
nearly 10 year lows

21MFS® Large Cap Value Equity299-I-CT-LCV-8Mar17.21
Relative outperformance by factor
Source: FactSet attributions for the Russell 1000 Value Index through 31-Dec-20161 Relative performance of companies that generate >75% of their revenues in the US vs. companies that generate <25% in the US.
6%
10%
2%
8%
2%
20%
-2%
10%
13% 13%
3%2%
-5%
0%
5%
10%
15%
20%
25%
Small vs.Large Cap
High Beta vs.Low Beta
Low Quality vsHigh Quality
US vs Non-USRevenues
Out
perfo
rman
ce %
Since Election (Nov 9th) 5.8% 10.0% 2.1% 8.1%
4Q16 2.3% 19.7% -2.2% 9.6%
2016 13.3% 13.3% 3.0% 1.9%
1
22MFS® Large Cap Value Equity299-I-CT-LCV-8Mar17.22
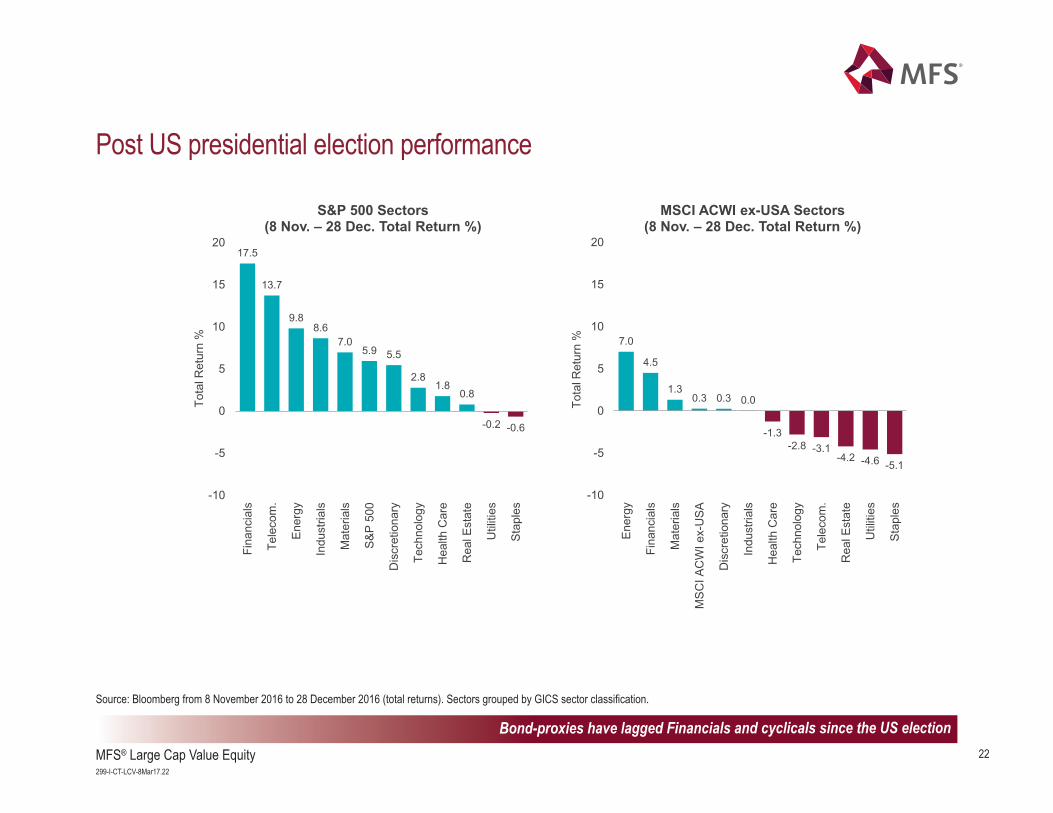
Post US presidential election performance
Source: Bloomberg from 8 November 2016 to 28 December 2016 (total returns). Sectors grouped by GICS sector classification.
17.5
13.7
9.88.6
7.05.9 5.5
2.81.8
0.8
-0.2 -0.6
-10
-5
0
5
10
15
20F
inancia
ls
Tele
com
.
Energ
y
Industr
ials
Mate
rials
S&
P 5
00
Dis
cre
tionary
Technolo
gy
Health C
are
Real E
sta
te
Utilit
ies
Sta
ple
s
Tota
l R
etu
rn %
S&P 500 Sectors (8 Nov. – 28 Dec. Total Return %)
7.0
4.5
1.30.3 0.3 0.0
-1.3
-2.8 -3.1-4.2 -4.6 -5.1
-10
-5
0
5
10
15
20
Energ
y
Fin
ancia
ls
Mate
rials
MS
CI A
CW
I ex-U
SA
Dis
cre
tionary
Industr
ials
Health C
are
Technolo
gy
Tele
com
.
Real E
sta
te
Utilit
ies
Sta
ple
s
Tota
l R
etu
rn %
MSCI ACWI ex-USA Sectors (8 Nov. – 28 Dec. Total Return %)
Bond-proxies have lagged Financials and cyclicals since the US election

23MFS® Large Cap Value Equity299-I-CT-LCV-8Mar17.23
The views expressed are those of the portfolio managers, and are subject to change at any time. These views do not necessarily reflect the views of MFS or others in the MFS organization, andshould not be relied upon as investment advice, as securities recommendations, or as an indication of trading intent on behalf of any MFS investment product. No forecasts can be guaranteed.
Past performance is no guarantee of future results.
SummaryAs of 31 January 2017Looking back on 2016, the benchmark ended the year up over 17% in US Dollar terms with nearly half of the year's total return coming during the fourth quarterfollowing the US Presidential elections. Optimism that a political outsider may bring about changes that could accelerate growth in the US through corporate taxreform, reduced regulatory burden and an infrastructure spending program sent equity markets soaring to all time high levels. 2016 started out on a much stronger note for our strategy's relative performance, however the latter part of the year proved more difficult for us, with nearly all of the underperformance occurring from November 9th through the end of the year. While investor interest in higher beta, smaller cap and lower quality companies started during the middle of the third quarter, these trends accelerated meaningfully following the election, presenting significant relative performance headwinds for this high quality, lower risk strategy.In addition, rising interest rates translated into a stronger US Dollar, adding to this strategy's relative performance challenges. We have historically had a greaterexposure to global, multi-national companies, which are likely to be more negatively affected by a strengthening dollar as compared to our benchmark. This maybe a negative in the short-term, however, with our longer-term lens, we believe they're more likely to result in opportunities for this strategy.From the bottom of the market in 2009, with a brief pause in 2015, the Russell 1000 Value is up over 250% through the end of 2016, which equates to anannualized return of nearly 17.5% in US Dollar terms - a level that is significantly above the long-term averages for equity market returns. As a result, we wouldexpect a more muted absolute return environment going forward. The MFS Large Cap Value strategy has historically added the most value for clients in morechallenging market environments. It's tough to know what the future holds, but in a lower growth environment, it stands to reason that there will be less cushionto absorb external shocks. While the events of 2016 have reminded us that predicting the future is extremely difficult, history has shown that buying high-quality companies at reasonablevaluation adds value over the long-term. We are confident that our strategy, which owns some of the highest quality companies in the market, trading atreasonable valuations, is well positioned to benefit over time.

24MFS® Large Cap Value Equity299-I-CT-LCV-8Mar17.24
Compliance with LADWP’s investment guidelinesAs of 31 January 2017
Yes No
All companies doing business in the United States ✔All issues listed on the New York, American, ✔NASDAQ or other nationally recognized stock exchange
Portfolio is fully invested (<5% cash) ✔Derivatives Prohibited ✔No more than 5% in any one issue at purchase ✔unless issue represents more than 5% of the Russell 1000® Value (R1V). If greater than 5% of R1V than maximum 125% of benchmark weight (up to 10%).
No issue purchased if more than 10% of the ✔outstanding shares held by manager
All securities held specifically authorized ✔in the written guidelines

25MFS® Large Cap Value Equity299-I-CT-LCV-8Mar17.25
Employees’ Retirement, Disability & Death Benefit PlanPerformance overview
YTD 1 Year 2 Years 3 Years 4 Years 5 Years 6 Years 7 Years 10 Years Inception to date
(18-Feb-04)
1.0 0.7
21.124.6
9.9 8.8 10.5 10.213.4 12.5 14.5 14.1 12.4 12.0 13.2 13.3
7.4 5.78.9 7.5
Excess returns (%) vs.Russell 1000® Value 0.3 -3.5 1.1 0.4 0.8 0.4 0.4 -0.1 1.7 1.4
Annualized returns (%), as of 31-Jan-17
Annual returns (%) 2016 2015 2014 2013 2012 2011 2010 2009 2008 2007 2006Portfolio (gross) 15.5 -0.1 11.9 36.4 16.7 0.8 12.7 20.7 -31.5 10.1 21.7Portfolio (net) 15.1 -0.4 11.5 36.0 16.3 0.4 12.3 20.3 -31.7 9.7 21.3Russell 1000® Value 17.3 -3.8 13.5 32.5 17.5 0.4 15.5 19.7 -36.8 -0.2 22.2Excess net return -2.2 3.5 -1.9 3.5 -1.2 0.0 -3.2 0.6 5.1 9.9 -0.9
Portfolio (net)
Russell 1000® Value

26MFS® Large Cap Value Equity299-I-CT-LCV-8Mar17.26
Retiree Health Benefits Fund Performance overview
Excess returns (%) vs.Russell 1000® Value 0.3 -3.5 1.1 0.3 0.9 0.4 0.4 -0.2 -0.1
Portfolio (net)
Russell 1000® Value
YTD 1 Year 2 Years 3 Years 4 Years 5 Years 6 Years 7 Years Inceptionto date
(15-Sep-09)
1.0 0.7
21.124.6
9.9 8.810.5 10.2
13.4 12.514.5 14.1 12.4 12.0 13.1 13.3 12.8 12.9
Annualized returns (%), as of 31-Jan-16
Annual returns (%) 2016 2015 2014 2013 2012 2011 2010Portfolio (gross) 15.5 -0.1 11.9 36.4 16.7 0.7 12.6Portfolio (net) 15.1 -0.4 11.5 36.0 16.3 0.4 12.2Russell 1000® Value 17.3 -3.8 13.5 32.5 17.5 0.4 15.5Excess net return -2.2 3.4 -2.0 3.5 -1.2 0.0 -3.3

27MFS® Large Cap Value Equity299-I-CT-LCV-8Mar17.27
Performance drivers – sectorsRelative to Russell 1000® Value Index (USD) – one year as of 31 January 2017
Attribution results are generated by the FactSet application utilizing a methodology which is widely accepted in the investment industry. Results are based upon daily holdings using a buy and holdmethodology to generate individual security returns and do not include expenses. As such, attribution results are essentially estimates and may not aggregate to the total return of the portfolio or ofthe benchmark which can be found elsewhere in this presentation.
Average relative Portfolio Benchmark Sector Stock Currency Relative weighting (%) returns (%) returns (%) allocation (%) + selection (%) + effect (%) = contribution (%)
Contributors Utilities -5.6 9.6 13.2 0.6 -0.0 -- 0.6 Real Estate -4.8 -- 13.0 0.6 -- -- 0.6 Consumer Discretionary 2.3 22.6 17.9 -0.2 0.4 -- 0.2 Detractors Materials 0.9 19.2 57.6 0.3 -1.3 -- -1.0 Financials 2.8 30.8 35.2 0.4 -1.2 -- -0.7 Information Technology -2.8 23.6 31.0 -0.1 -0.5 -- -0.7 Consumer Staples 2.9 7.0 8.7 -0.4 -0.2 -- -0.6 Health Care 5.0 11.5 10.8 -0.8 0.2 -- -0.6 Energy -7.3 21.6 26.8 -0.1 -0.3 -- -0.4 Cash 1.5 0.3 -- -0.4 -- -- -0.4 Telecommunication Services -1.2 2.4 18.1 0.2 -0.4 -- -0.2 Industrials 6.3 29.3 33.1 0.5 -0.6 -- -0.0
Total 21.4 24.6 0.8 -4.0 -- -3.2

28MFS® Large Cap Value Equity299-I-CT-LCV-8Mar17.28
Average weighting Returns Relative Portfolio (%) Benchmark (%) Portfolio (%)1 Benchmark (%) contribution (%)Contributors General Electric Co -- 2.5 -- 5.2 0.5 JPMorgan Chase & Co 4.4 2.4 46.3 46.3 0.4 Microsoft Corp -- 0.8 -- -8.3 0.4 Exxon Mobil 1.4 3.5 11.6 11.6 0.3 Goldman Sachs Group Inc 1.9 0.7 44.1 44.1 0.3 Texas Instruments Inc 1.4 -- 46.4 -- 0.3 Allergan Plc 0.0 0.4 -18.8 -23.0 0.2 Wal-Mart Stores Inc -- 1.1 -- 3.5 0.2 Union Pacific Corp 1.1 0.4 51.8 26.5 0.2 The Procter & Gamble Company 1.1 2.2 10.7 10.7 0.2 Detractors CVS Health Corp 1.7 0.1 -16.8 -16.8 -0.7 Bank of America Corp -- 1.6 -- 62.6 -0.6 Accenture Plc 2.6 -- 10.1 -- -0.4 PPG Industries 1.9 -- 6.8 -- -0.4 Mckesson Corp 0.5 -- -13.0 -- -0.3 Verizon Comm 2.3 0.7 2.4 2.4 -0.3 Philip Morris International Inc 3.6 1.1 11.4 11.4 -0.3 Medtronic Inc 2.2 1.1 2.3 2.3 -0.2 Pfizer Inc 3.0 1.9 8.1 8.1 -0.2 Johnson & Johnson 4.2 2.6 11.5 11.5 -0.2
Performance drivers – stocksRelative to Russell 1000® Value Index (USD) – one year as of 31 January 2017
1 Represents performance for the time period stock was held in portfolio. Attribution results are generated by the FactSet application utilizing a methodology which is widely accepted in the investment industry. Results are based upon daily holdings using a buy and holdmethodology to generate individual security returns and do not include expenses. As such, attribution results are essentially estimates and may not aggregate to the total return of the portfolio or ofthe benchmark which can be found elsewhere in this presentation.

29MFS® Large Cap Value Equity299-I-CT-LCV-8Mar17.29
Source: Barra. The Barra information may only be used for your internal use, may not be reproduced or redisseminated in any form and may not be used to create any financial instruments or products or any indices. The Barra information is provided on an "as is" basis and the user of this information assumes the entire risk of any use made of this information. Barra, each of its affiliates and each other person involved in or related to compiling, computing or creating any Barra information (collectively, the "Barra Parties") expressly disclaims all warranties (including
without limitation, any warranties of originality, accuracy, completeness, timeliness, non-infringement, merchantability and fitness for a particular purpose) with respect to this information. Without limiting any of the foregoing, in no event shall any Barra Party have any liability for any direct, indirect, special, incidental, punitive, consequential (including, without limitation, lost profits) or any other damages.
Period ending 31 January 2017 Employees’ Retirement, Retiree Health RussellCharacteristics Death & Disability Plan Benefits Fund 1000® Value# of holdings 86 86 697Weighted avg mkt cap ($ bn) 110.1 bn 110.1 bn 117.1 bnMedian mkt cap ($ bn) 75.5 bn 75.5 bn 58.6 bnYield 2.4% 2.4% 2.5%P/E (12 month forward) 16.0x 16.0x 16.9xPrice/book 2.4x 2.4x 1.9xPrice/sales 1.9x 1.9x 1.8xPrice/cash flow 13.6x 13.6x 11.8xEPS growth 9.1% 9.1% 8.6%Return on equity (3-year average) 20.7% 20.7% 12.9%All characteristics are weighted average unless otherwise noted.
Employees’ Retirement, Retiree Health RussellSector weights Death & Disability Plan Benefits Fund 1000® ValueHealth Care 15.5 15.5 10.4Industrials 15.1 15.1 10.2 Consumer Staples 11.9 11.9 8.1Financials 29.7 29.7 26.7Consumer Discretionary 6.8 6.8 4.6Materials 4.2 4.2 3.0Information Technology 7.2 7.2 9.6Telecommunication Services 1.3 1.3 3.8 Real Estate 0.0 0.0 4.6 Utilities 1.1 1.1 6.1Energy 5.3 5.3 13.0
Employees’ Retirement, Risk* Disability & Death Benefit PlanPredicted tracking error1 2.9% Realized tracking error 2.2% Highest monthly excess return 0.5 Lowest monthly excess return -1.1 R-square 95.81% Beta1 0.99 Alpha 0.76% Information ratio 0.34 Annualized std dev Portfolio 10.72% Index 10.54%Sharpe ratio Portfolio 1.38 Index 1.33*All risk characteristics based on last 5 years of Employees’ Retirement, Disability & Death BenefitPlan relative to the Russell 1000® value.
Employees’ Retirement, Disability & Death Retiree HealthTop ten holdings Benefit Plan Benefits FundJPMorgan Chase & Co 4.6 4.6Philip Morris International Inc 4.1 4.1Johnson & Johnson 3.8 3.8Wells Fargo & Co 3.5 3.5Pfizer Inc 2.6 2.6Accenture PLC 2.4 2.4US Bancorp 2.4 2.4Medtronic PLC 2.3 2.3Goldman Sachs Group Inc 2.3 2.33M Co 1.9 1.9Total 29.9 29.9
1

30MFS® Large Cap Value Equity299-I-CT-LCV-8Mar17.30
Dec2000
Dec2001
Dec2002
Dec2003
Dec2004
Dec2005
Dec2006
Dec2007
Dec2008
Dec2009
Dec2010
Dec2011
Dec2012
Dec2013
Dec2014
Dec2015
Dec2016
75
100
125
150
175
200
225
Perce
nt (%
)
Forward P/E MFS Large Cap Value strategy relative to Russell 1000® Value
3-year average ROE MFS Large Cap Value strategy relative to Russell 1000® Value
As of 31-Dec-16.Based on the MFS institutional representative account. Past performance is no guarantee of future results.
The quality of companies owned within the MFS Large Cap Value strategy remains at a premium while its relative valuation remains in line with history
Inefficient market provides compelling opportunities in high quality companies
31MFS® Large Cap Value Equity299-I-CT-LCV-8Mar17.31
-20
-15
-10
-5
0
5
10
15
20
25
-20 -15 -10 -5 0 5 10 15 20 25
Mana
ger r
eturn
s (%
)
Benchmark returns (%)
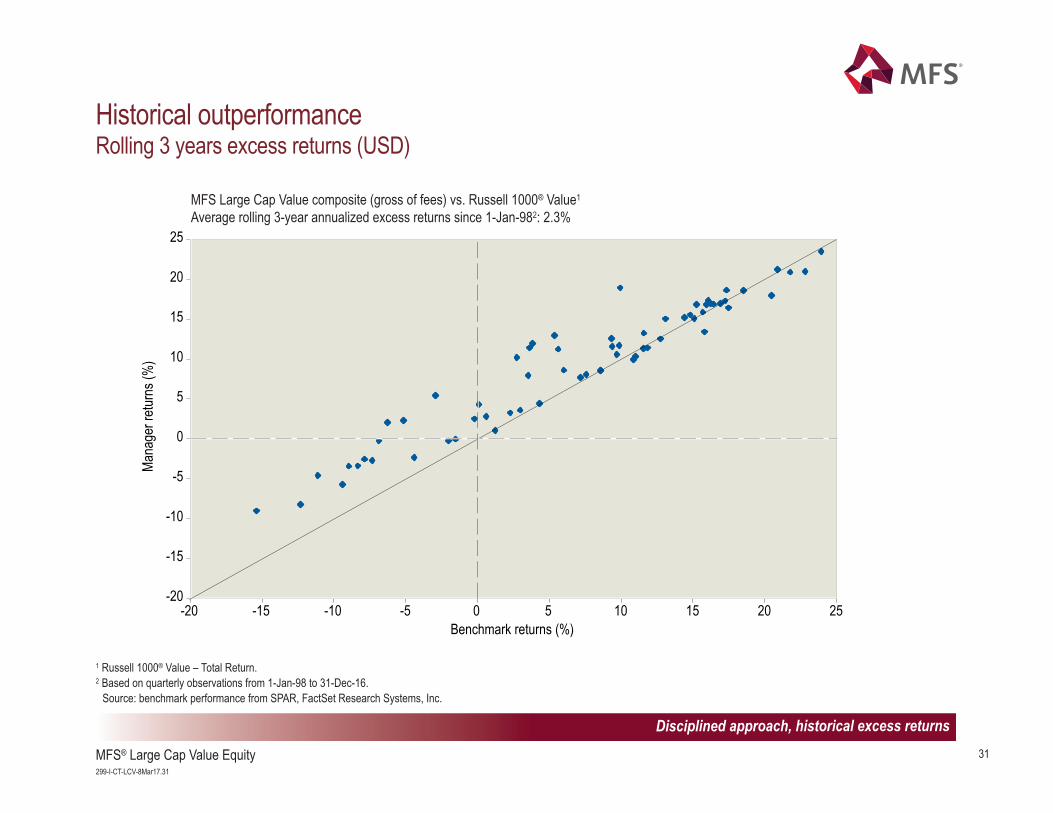
1 Russell 1000® Value – Total Return.2 Based on quarterly observations from 1-Jan-98 to 31-Dec-16.
Source: benchmark performance from SPAR, FactSet Research Systems, Inc.
Historical outperformanceRolling 3 years excess returns (USD)
MFS Large Cap Value composite (gross of fees) vs. Russell 1000® Value1
Average rolling 3-year annualized excess returns since 1-Jan-982: 2.3%
Disciplined approach, historical excess returns

32MFS® Large Cap Value Equity299-I-CT-LCV-8Mar17.32
Portfolio holdings MarketAs of 31-Jan-17 Value (%)
MarketAs of 31-Jan-17 Value (%)
Cash & Cash Equivalents 1.9Consumer Discretionary 6.8Omnicom Group Inc 1.4Comcast Corp 1.3Delphi Automotive PLC 0.9Time Warner Inc 0.9Harley-Davidson Inc 0.5Target Corp 0.4Interpublic Group of Cos Inc 0.4Hanesbrands Inc 0.4Walt Disney Co 0.3Newell Brands Inc 0.2Advance Auto Parts Inc 0.2Consumer Staples 11.9Philip Morris International Inc 4.1CVS Health Corp 1.7General Mills Inc 1.5PepsiCo Inc 1.0Procter & Gamble Co 0.9Archer-Daniels-Midland Co 0.8Altria Group Inc 0.7Coty Inc 0.5JM Smucker Co 0.5Mead Johnson Nutrition Co 0.2Energy 5.3Chevron Corp 1.2Schlumberger Ltd 1.2Exxon Mobil Corp 1.1EOG Resources Inc 1.0Occidental Petroleum Corp 0.8
Financials 29.7JPMorgan Chase & Co 4.6Wells Fargo & Co 3.5US Bancorp 2.4Goldman Sachs Group Inc 2.3Travelers Cos Inc 1.9Chubb Ltd 1.8Citigroup Inc 1.7Aon PLC 1.6MetLife Inc 1.5PNC Financial Services Group Inc 1.3Bank of New York Mellon Corp 1.1Nasdaq Inc 1.1BlackRock Inc 0.9American Express Co 0.9Prudential Financial Inc 0.9State Street Corp 0.8Moody's Corp 0.6Franklin Resources Inc 0.5T Rowe Price Group Inc 0.2S&P Global Inc 0.2Health Care 15.5Johnson & Johnson 3.8Pfizer Inc 2.6Medtronic PLC 2.3Merck & Co Inc 1.4Abbott Laboratories 1.4Thermo Fisher Scientific Inc 1.1Danaher Corp 1.1McKesson Corp 0.6Express Scripts Holding Co 0.6Cigna Corp 0.5

33MFS® Large Cap Value Equity299-I-CT-LCV-8Mar17.33
Portfolio holdings (continued)
Industrials 15.1Johnson Controls International PLC 1.93M Co 1.9Honeywell International Inc 1.8United Parcel Service Inc 1.4Union Pacific Corp 1.2Lockheed Martin Corp 1.2United Technologies Corp 1.1Illinois Tool Works Inc 0.9Eaton Corp PLC 0.9Northrop Grumman Corp 0.9Ingersoll-Rand PLC 0.6Stanley Black & Decker Inc 0.5Equifax Inc 0.4Pentair PLC 0.4Information Technology 7.2Accenture PLC 2.4Texas Instruments Inc 1.5Fidelity NationalInformation Services Inc 0.9International Business Machines Corp 0.7Oracle Corp 0.6Fiserv Inc 0.4Cognizant Technology Solutions Corp 0.3Amdocs Ltd 0.2
Materials 4.2PPG Industries Inc 1.8EI du Pont de Nemours & Co 0.8Sherwin-Williams Co 0.7Crown Holdings Inc 0.5Monsanto Co 0.4Telecommunication Services 1.3Verizon Communications Inc 1.3Utilities 1.1Duke Energy Corp 0.8Xcel Energy Inc 0.3
MarketAs of 31-Jan-17 Value (%)
MarketAs of 31-Jan-17 Value (%)

34MFS® Large Cap Value Equity299-I-CT-LCV-8Mar17.34
Assets Fees
Separate account Initial $100 million 45 basis points or 0.45%
Next $100 million 30 basis points or 0.30%
Over $200 million 28 basis points or 0.28%
LADWP’s fee schedule
35MFS® Large Cap Value Equity299-I-CT-LCV-8Mar17.35
Appendix Contents Page
Glossary of terms 36
Composite report (USD) 38

36MFS® Large Cap Value Equity299-I-CT-LCV-8Mar17.36
Glossary of terms Alpha is a measure of the difference between a portfolio's actual returns and its expected performance, given its level of risk as
measured by beta. A positive alpha figure indicates the portfolio has performed better than its beta would predict. In contrast, anegative alpha indicates the portfolio's underperformance, given the expectations established by the fund's beta.
Beta is a measure of a portfolio's sensitivity to market movements. The beta of the market is 1.00 by definition. A portfolio with abeta of 0.85 would indicate that the portfolio is expected to perform 15% worse that the market's excess return during up marketsand 15% better during down markets , assuming all other factors remain constant.
Earnings-per-share (EPS) growth represents the annualized rate of net-income-per-share growth over the trailing three-yearperiod for the stocks held by the portfolio. Earnings-per-share growth gives a good picture of the rate at which a company hasgrown its profitability per unit of equity.
Excess return is defined as the portfolio's achieved rate of return minus the benchmark return over the same period.
Information ratio is a measure of risk adjusted performance. Dividing the portfolio active return by portfolio tracking error givesyou the information ratio.
Predicted tracking error (also called active risk) is a measure of the expected deviation from the benchmark.
Price/book ratio of the portfolio is the weighted average of the price/book ratios of all the stocks in the portfolio. Book value is thetotal assets of a company, less total liabilities. A company's book value is calculated by dividing the market price of its outstandingstock by the company's book value, and then adjusting for the number of shares outstanding (Stocks with negative book valuesare excluded from this calculation.). The price/book ratio can tell investors approximately how much they're paying for acompany's assets, based on historical, rather than current, valuations.
Price/cash flow is a stock's current price divided by the trailing 12-month cash flow per share. For the portfolio this numberrepresents the weighted average of the price/cash-flow ratios of the stocks in the portfolio. Price/cash-flow represents the amountan investor is willing to pay for a dollar generated from a particular company's operations. Price/cash-flow shows the ability of abusiness to generate cash and acts as a gauge of liquidity and solvency.

37MFS® Large Cap Value Equity299-I-CT-LCV-8Mar17.37
Glossary of terms (continued) P/E (12 month forward) is a stock's current price divided by the company's trailing 12-month earnings per share. The (P/E) ratio
of the portfolio is the weighted average of the price/earnings ratios of the stocks in the portfolio. The P/E ratio of a company,which is a comparison of the cost of the company's stock and its expected next 12-month earnings per share, is calculated bydividing these two figures.
Price/sales is a stock's current price divided by the company's trailing 12-month sales per share. For the portfolio this numberrepresents the weighted average of the price/sales ratios of the stocks in the portfolio. Price/sales represents the amount aninvestor is willing to pay for a dollar generated from a particular company's operations.
R-Squared is the measure of correlation between a portfolio and the market (benchmark). Values range between 0 and 1. Thehigher the value of R-Square, the greater the correlation between the two. R-squared can be used to determine the significanceof a particular beta or alpha. Generally, a higher R-squared will indicate a more useful beta figure. If the R-squared is lower, thenthe beta is less relevant to the fund's performance.
Realized tracking error (also called active risk) is a measure of the actual deviation from the benchmark.
Return on Equity (ROE) represents the amount of net income returned as a percentage of shareholders equity. Return on equitymeasures a corporation's profitability by revealing how much profit a company generates with the money shareholders haveinvested. ROE can be one measure of quality of a company.
Sharpe Ratio is calculated by using standard deviation and excess return to determine reward per unit of risk. The higher theSharpe ratio, the better the portfolio's historical risk-adjusted performance.
Standard Deviation is a statistical measurement of dispersion about an average and depicts how widely a portfolio's returnsvaried over a certain period of time. When a portfoliohas a high standard deviation, the predicted range of performance is wide,implying greater volatility.

Composite: MFS Large Cap Value Equity CompositeBenchmark: Russell 1000® Value - Total Return
Creation Date: 20-Feb-2001
Inception Date: 01-Feb-1989
Investment Objective: Seeks capital appreciation and reasonable income by investing primarily in a portfolio of high quality and undervalued large capitalization stocks with lower volatility over full market cycles (typically 3-5 years).
Institutional Separate Accounts Fee ScheduleAsset Breakpoints (USD) FeeFor Assets Up To 50 MM 55 bpFor Assets From 50 MM To 100 MM 45 bpFor Assets Over 100 MM 40 bp
Accounts are eligible for inclusion in the composite if they have assets greater than 2 MM USD. Accounts are included as of their first full month of performance.
Accounts in Annualized 3-YearComposite and Benchmark Return % Composite Composite at Standard Deviation Assets in Composite
Period Gross of fees Net of fees Benchmark Dispersion End of Period Composite Benchmark (USD million) %Firm2016 14.87 14.24 17.34 0.10 25 10.91 10.93 $58,711.0 13.8
2015 0.10 -0.45 -3.83 0.15 28 11.32 10.83 $51,264.1 12.4
2014 11.27 10.66 13.45 0.10 30 9.83 9.33 $54,551.4 12.7
2013 36.69 35.96 32.53 0.21 33 12.95 12.88 $51,128.8 12.4
2012 17.19 16.55 17.51 0.11 33 15.23 15.73 $36,730.7 11.4
2011 0.77 0.22 0.39 0.27 32 18.93 20.98 $29,468.8 13.2
2010 12.43 11.82 15.51 0.18 29 n/a n/a $27,127.3 12.3
2009 21.85 21.19 19.69 0.49 25 n/a n/a $19,989.1 10.9
2008 -32.09 -32.51 -36.85 0.14 21 n/a n/a $12,169.9 9.5
2007 8.85 8.15 -0.17 0.24 20 n/a n/a $16,018.3 8.1MFS Investment Management® claims compliance with the Global Investment Performance Standards (GIPS®) and has prepared and presented this report in compliance with the GIPS standards. MFS Investment Management® has been independently verified for the periods 1-Jan-1988 through 31-Dec-2015. Verification assesses whether (1) the firm has complied with all the composite construction requirements of the GIPS standards on a firm-wide basis and (2) the firm's policies and procedures are designed to calculate and present performance in compliance with the GIPS standards. MFS Large Cap Value Equity Composite has been examined for the periods 01-Feb-1989 through 31-Dec-2015. The verification and performance examination reports are available upon request.
Total Gross-of-fee returns in USD (includes both capital appreciation and income), are net of transaction costs, withholding taxes and direct expenses, but before management fees, custody and other indirect expenses. Certain institutional accounts hold Canadian trusts subject to custody and other indirect expenses. Certain accounts may be subject to fair valuation as conditions warrant. Typical separate accounts utilize 4:00 PM (London Time) foreign exchange rates; retail products will use rates deemed most appropriate for daily NAV per share calculations. The possibility exists for performance dispersion between otherwise similarly managed accounts and also with the benchmark. Net composite returns are prepared by subtracting from the monthly gross returns one-twelfth of the maximum applicable annual institutional separate account fee. Total returns of the benchmark are provided for each period depicted, expressed in USD. Source of Benchmark Performance: FACTSET ®. Benchmark returns are not examined by independent accountants. Russell 1000 Value - Total Return - constructed to provide a comprehensive barometer for the value securities in the large-cap segment of the U.S. equity universe. Companies in this index generally have lower price-to-book ratios and lower forecasted growth values. The Russell 1000® Value Total Return Index is a trademark/service mark of the Frank Russell Company. Russell® is a trademark of the Frank Russell Company. Composite Dispersion is measured by the asset-weighted standard deviation of account returns for all accounts in the composite for the full period. For composites containing less than six accounts, dispersion is deemed not meaningful. Prior to 31-Mar-2009 accounts would be eligible for inclusion in the composite if they had assets greater than 5.0 MM USD. Prior to 1-Aug-2008, the maximum institutional separate account fee charged for this product was 65 bps. The net returns depicted in this report are based upon the historical max in effect for each of the periods depicted. For purposes of GIPS compliance, the firm is defined as MFS Investment Management® which is comprised of Massachusetts Financial Services Company (MFS) and MFS Institutional Advisors, Inc. (MFSI), each of which is a registered investment advisor, MFS Heritage Trust Company, a New Hampshire Trust company, and MFS Investment Management Canada Limited, a registered investment advisor. Total firm assets are calculated at market value and include assets managed by MFS, MFSI, MFS Heritage Trust Company and MFS Investment Management Canada Limited as well as assets managed by MFS and MFSI in a sub-advisory capacity on behalf of affiliated investment advisors that may or may not be registered under the United States Investment Advisers Act of 1940, such as MFS International (U.K.), Ltd. (MIL UK) and MFS Investment Management K.K. (MIMKK), as well as assets managed by MFS and MFSI on behalf of unaffiliated investment advisors that may or may not be registered under the United States Investment Advisers Act of 1940. Total firm assets for GIPS purposes do not include assets of non-discretionary advisory relationships. In November of 2011 MFS acquired McLean Budden Limited (now MFS Investment Management Canada Limited). Total firm assets from 31-Mar-2012 forward include the assets of institutional and pooled MFS Investment Management Canada Limited products. Assets from 31-Dec-2012 forward include the MFS Investment Management Canada Limited PPM product assets. A complete list of firm composites and descriptions, along with additional information regarding policies for valuing portfolios, calculating and reporting performance, and preparing compliant presentations are available upon request.
Run Time: 24-Jan-17 2:42:20 PM AELV Page 1 of 1
Performance Presentation Report 2016, Q4