Lansing Final Draft - supplemental report final - Tri-Co Mobility... · Michael Hagen Origami Brain...
28
Michigan Livable Communities Demonstration Project Lansing Tri-County Mobility Management & Coordination for Non-Emergency Medical Transportation Report Supplements November 2013 Completed in collaboration with the Michigan Department of Transportation and Michigan State Housing Development Authority.
Transcript of Lansing Final Draft - supplemental report final - Tri-Co Mobility... · Michael Hagen Origami Brain...

Michigan Livable Communities Demonstration Project Lansing Tri-County Mobility Management & Coordination for Non-Emergency Medical Transportation Report Supplements November 2013
Completed in collaboration with the Michigan Department of Transportation and Michigan State Housing Development Authority.

Acknowledgements Many individuals and organizations contributed their time and expertise to the preparation of this report.
Project Leadership Susan Pigg Tri-County Regional Planning Commission Paul Hamilton Tri-County Regional Planning Commission Roger Millar Vice President, Smart Growth America Rayla Bellis Associate, Smart Growth America Geoff Anderson President, Smart Growth America Project Stakeholder Group Debbie Alexander CATA Hanadi Ali STVCC Karen Batterham Ingham County Department of Human Services Rayla Bellis Smart Growth America Dawn Benson Clinton Transit Sharon Brady DDS/SSA Dean H. Brailey Tri-County Bicycle Association Jonathan Bromberg CATA Gale Capling Clinton Transit Paula Clark Bath Charter Township Brian Dunn Central Michigan 2-1-1 Steve Gewirtz Michigan Public Transportation Association Michael Hagen Origami Brain Injury Rehab Center Ashley Hale CATA George Hanby Developmental Disabilities Council Crystal Hewitt DHS Tekea Jackson Capital Area Michigan Works! Kim Johnson MDOT Andy Kilpatrick City of Lansing Michael Laniewski Lansing Mason Ambulance Service Steven Lieby Tri-County Bicycle Association John Lindenmayor League of Michigan Bicyclists Suzanne Love CATA LAC Darlene Mans MDOT Lynne Martinez Capital Community of Bike Share Beth Mugavero St. Vincent Catholic Charities Nick Norcross Michigan Department of Community Health Ody Norkin Indian Trails Jim Osieczonek Eatran/Eaton County Tom Page Michigan 2-1-1 Rodney Palmer Mercy Ambulance Service Steve Palmer MDOT Julie Powers Mid-MEAC Hary Prawiranata TCRPC Joe Pulver Clinton County Road Commission John Sabbadin Lansing Mason Area Ambulance Bob Scheuerman City of East Lansing Ray Severy Meridian Township Janine Sinno Ingham County Health Department Lia Spaniolo Power of We Consortium Howard Spence Commissioner, Eaton County

Denise Sullivan STVCC Donna Webb EATRAN Project Team Lisa Ballard, Principal Current Transportation Solutions Ted Lange, Planner Current Transportation Solutions Kevin Wright, Planner Current Transportation Solutions . This report was produced with the generous support of the Rockefeller Foundation. The Rockefeller Foundation fosters innovative solutions to many of the world’s most pressing challenges, affirming its mission, since 1913, to “promote the well-being” of humanity. Today, the Foundation works to ensure that more people can tap into the benefits of globalization while strengthening resilience to its risks. Foundation initiatives include efforts to mobilize an agricultural revolution in Sub-Saharan Africa, bolster economic security for American workers, inform equitable, sustainable transportation policies in the United States, ensure access to affordable and high-quality health systems in developing countries, accelerate the impact investing industry’s evolution, and develop strategies and services that help vulnerable communities cope with the impacts of climate change. For more information, please visit www.rockefellerfoundation.org. The Rockefeller Foundation, 420 Fifth Avenue, New York, NY 10018 The cover image was created using http://www.tagxedo.com. Any errors and all interpretations are the responsibility of Smart Growth America. Please direct questions about this report to Roger Millar, PE, AICP, Vice President: [email protected], (406) 544-1963

Tri-County | Mobility Management Strategies Michigan Livable Communities Demonstration Project
Smart Growth America | iv
Table of Contents Page
Acknowledgements ............................................................ Error! Bookmark not defined.
Table of Contents........................................................................................................... iv
Definitions and Acronyms ............................................................................................. v
Supplement A: Estimated NEMT Need ......................................................................A-1 Calculations for NEMT Trips in the Tri-County Region...........................................A-1 Demand increase not yet showing in data..............................................................A-3 NEMT Requests and unmet needs in the Tri-County area.....................................A-4 Data sources for further information .......................................................................A-8
Supplement B: Non-FTA Federal Programs..............................................................B-1
Supplement C: Medicaid .............................................................................................C-1 Medicare and Medicaid ..........................................................................................C-1 Medicaid Non-Emergency Transportation Webinar Playback and Documents......C-1 Medicaid Brokerage Final Rule Excerpt .................................................................C-1
Supplement D: Standard Practice for Calculating the Cost of a Ride ...................D-1
Supplement E: Medicaid Transportation in Other States ........................................E-1 Washington Example..............................................................................................E-1 Oregon Example.....................................................................................................E-4 Florida Example......................................................................................................E-4 North Carolina Example .........................................................................................E-5 Pennsylvania Example ...........................................................................................E-6 California Examples................................................................................................E-6

Tri-County | Mobility Management Strategies Michigan Livable Communities Demonstration Project
Smart Growth America | v
Definitions and Acronyms ACA Patient Protection and Affordable Care Act of 2010. If a state
chooses to participate, the ACA will increases the number of people eligible for Medicaid, which may increase the number of people eligible for Medicaid NEMT.
ACCT Lawmakers created the Agency Council on Coordinated Transportation (ACCT) during the 1998 Washington State legislative session to coordinate affordable and accessible transportation choices for people with special needs in collaboration with state and local agencies and organizations. The council’s Federal Opportunities Workgroup has been working on Medicaid transportation.
ADA Americans with Disabilities Act of 1990. Landmark federal civil rights legislation that requires public transit systems to make their services fully accessible to persons with disabilities, as well as to underwrite a parallel network of paratransit service for those who are unable to use the regular transit system. In general, paratransit service must be provided within 3/4 of a mile of a bus route or rail station, at the same hours and days, for no more than twice the regular fixed route fare. The ADA further requires that paratransit rides be provided to all eligible riders if requested any time the previous day, within an hour of the requested time.
ADA paratransit eligibility
People who cannot travel to a bus or train, even if it accessible, because of a disability. Eligibility can be situational, such as an inability to access a bus or train because of environmental or architectural barriers not under the control of the transit agency.
CATA Capital Area Transit Authority serves Lansing and Ingham County with fixed route, Spec-Tran, and curb-to-curb services. Spec-Tran riders must meet ADA paratransit eligibility. Curb-to-curb service in rural areas of the county is open to the general public.
Clinton Transit Serves Clinton County with demand response and a volunteer program.
CMS The Centers for Medicare and Medicaid Services, the federal agency that oversees Medicaid in all states.
Curb-to-curb Demand response service where the rider meets the vehicle at the curb. This is more common than door-to-door service where the driver can assist the rider to the door.
DD Council Developmental Disabilities Council. The DD Council is a consumer-based program of MDCH. Its Regional Inclusive Community

Tri-County | Mobility Management Strategies Michigan Livable Communities Demonstration Project
Smart Growth America | vi
Coalitions (RICC) are local groups of grassroots people funded and supported by the DD. Members include people with disabilities, family members, friends, local advocates, community leaders and service providers. RICCs are the self-advocacy part of the DD Council. The DD Council is actively advocating for improved Medicaid transportation in Michigan.
Demand response
Another term for paratransit service, and a more general term than curb-to-curb, door-to-door, or specialized transportation. Sometimes used as an umbrella term to include services not required by ADA, such as services for seniors and general public demand response service in low density areas.
DHS County Departments of Human Services. County DHS offices are responsible for implementing Medicaid state policies. They assist clients in finding transportation resources
DRA Deficit Reduction Act of 2005. This legislation and subsequent rule making established the ability for state Medicaid managers to use an NEMT brokerage without the need to apply for a waiver, along with the rules and requirements.
Eatran Eaton County Transit. Services include demand response, Downtown Lansing Express, and out of county medical trips.
Fixed route Public transit service provided on a repetitive, fixed-schedule basis along a specific route, with vehicles stopping to pick up passengers at and deliver them to specific locations. This typically is used in reference to local transit service but can be applied to intercity and commuter bus and rail.
FOW The Federal Opportunities Workgroup, appointed by the ACCT, is charged with identifying relevant federal requirements and barriers that restrict agencies in Washington State from providing more efficient transportation services for people unable to transport themselves.
MDCH Michigan Department of Community Health. MDCH sets Medicaid program policy at the state level. Several agencies within MDCH also play an important role in administering Medicaid programs
Medicaid National health program for families and individuals with low income and resources. Medicaid is required to provide access to medical services for those who cannot transport themselves. Medicare, the national health program for seniors, does not have this requirement.
Mobility management
A systems approach to manage transportation resources that involves creating partnerships with transportation providers in a community or region to enhance travel options, and then developing means to effectively communicate those options to the

Tri-County | Mobility Management Strategies Michigan Livable Communities Demonstration Project
Smart Growth America | vii
public
MSA Medical Services Administration. A part of the MDCH, MSA has the primary responsibility for oversight of Michigan’s Medicaid program.
NEMT Non-emergency medical transportation.
OSA Office of Services to the Aging. OSA is the center point of a statewide network supporting services that benefit the elderly. It is a program of the MDCH.
Paratransit Flexible passenger transportation that does not follow fixed routes or schedules, including shared taxis and services provided by public transit operators. Within the public transportation profession the term usually refers to transportation service required by ADA for individuals with disabilities who are unable to use fixed-route, public transit systems.
Public paratransit
Terminology used in Medicaid literature to differentiate service provided by public transportation from shared taxis and other private sector or non-profit paratransit services. Service may be open to people who are not ADA eligible, especially in low density areas and for service targeted towards seniors.
Spec-Tran Specialized transportation, a term used by CATA and many other transit agencies for their ADA-required paratransit service for people who cannot access fixed route due to disability.
TCRPC Tri-County Regional Planning Commission
Tri-County | Mobility Management Strategies Michigan Livable Communities Demonstration Project
Smart Growth America | A-1
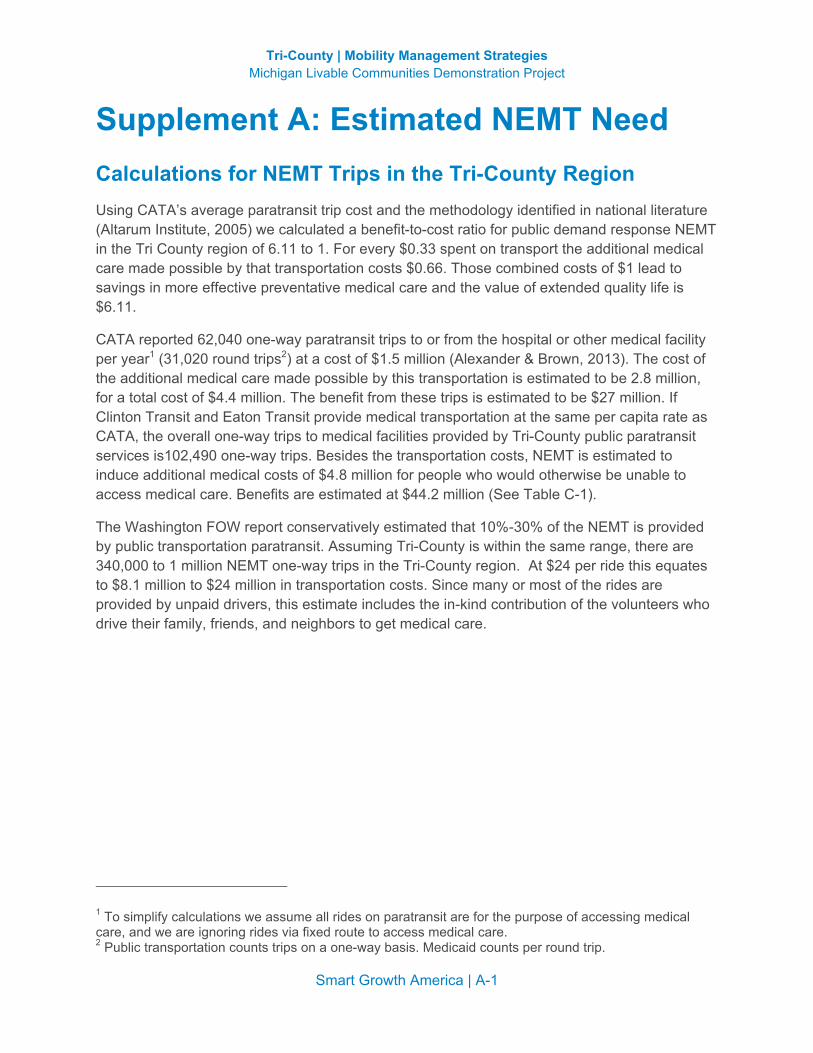
Supplement A: Estimated NEMT Need Calculations for NEMT Trips in the Tri-County Region Using CATA’s average paratransit trip cost and the methodology identified in national literature (Altarum Institute, 2005) we calculated a benefit-to-cost ratio for public demand response NEMT in the Tri County region of 6.11 to 1. For every $0.33 spent on transport the additional medical care made possible by that transportation costs $0.66. Those combined costs of $1 lead to savings in more effective preventative medical care and the value of extended quality life is $6.11.
CATA reported 62,040 one-way paratransit trips to or from the hospital or other medical facility per year1 (31,020 round trips2) at a cost of $1.5 million (Alexander & Brown, 2013). The cost of the additional medical care made possible by this transportation is estimated to be 2.8 million, for a total cost of $4.4 million. The benefit from these trips is estimated to be $27 million. If Clinton Transit and Eaton Transit provide medical transportation at the same per capita rate as CATA, the overall one-way trips to medical facilities provided by Tri-County public paratransit services is102,490 one-way trips. Besides the transportation costs, NEMT is estimated to induce additional medical costs of $4.8 million for people who would otherwise be unable to access medical care. Benefits are estimated at $44.2 million (See Table C-1).
The Washington FOW report conservatively estimated that 10%-30% of the NEMT is provided by public transportation paratransit. Assuming Tri-County is within the same range, there are 340,000 to 1 million NEMT one-way trips in the Tri-County region. At $24 per ride this equates to $8.1 million to $24 million in transportation costs. Since many or most of the rides are provided by unpaid drivers, this estimate includes the in-kind contribution of the volunteers who drive their family, friends, and neighbors to get medical care.
1 To simplify calculations we assume all rides on paratransit are for the purpose of accessing medical care, and we are ignoring rides via fixed route to access medical care. 2 Public transportation counts trips on a one-way basis. Medicaid counts per round trip.

Tri-County | Mobility Management Strategies Michigan Livable Communities Demonstration Project
Smart Growth America | A-2
Table C-1: Estimated Public Transportation Demand Response Trips, Costs, and Benefits for Three Counties

Tri-County | Mobility Management Strategies Michigan Livable Communities Demonstration Project
Smart Growth America | A-3
Table C-‐2: CATA Non-‐Emergency Medical Transportation3
Spec-‐Tran Other
Paratransit Total
Operating Expense @ $24 per ride
Trips to Medical Facilities 59,020 3,020 62,040 $1,488,960 Hospitals 4,921 -‐ 4,921 $118,104 Other Medical Facilities 54,099 3,020 57,119 $1,370,856
Total Trips 319,779 117,448 437,227 $10,493,448 % Medical Trips 18% 3% 14% 14% Farebox recovery ratio at $2.50 per ride: 10% Cost of medical trips not covered by farebox: $1,333,860
Under the current way of doing business, Medicaid pays a small portion of NEMT transportation costs. With Medicaid paying only farebox, it pays 10% of the cost of CATA’s medical rides. The remainder is paid by FTA, state transportation dollars, and county mill levies that are aimed at transportation, not medical care. For CATA, this leaves $1.3 million per year of unreimbursed costs for transporting people to and from medical appointments on demand response services.
If CATA were to be reimbursed the entire cost of the ride, they could reinvest the funds elsewhere. For example, CATA could operate 2 additional fixed route buses 16 hours per day, 7 days per week4. This would benefit people using fixed route service to access medical care, as well as the entire community. Data specific to medical transportation is unavailable for Eatran and Clinton Transit, but we assume the situation is much the same as CATA.
Demand increase not yet showing in data As the population ages we expect NEMT demand to increase over time, growing faster than the general population. We reviewed CATA ridership trends to find historical evidence of ridership increase yet we found the data inconclusive. Using overall demand response ridership as a proxy for NEMT demand, we see an increase since 1995 of 71%. However, this is much lower than the 221% increase in fixed route ridership in Ingham County5. With the limited data we cannot determine if demand response increases are tied to the overall increase in transit ridership, or if aging demographics influence the use.
3 Based on CATA data for May 1, 2012 to April 30, 2013 4 Calculated using NTD 2011 fixed route cost per hour of $112.81, 52 weeks per year, no holidays. 5 We didn’t assess Clinton and Eaton because the rural National Transit Database has only been in existence for about five years, has some questionable data, and is more difficult to access and query than the urban database.
Tri-County | Mobility Management Strategies Michigan Livable Communities Demonstration Project
Smart Growth America | A-4
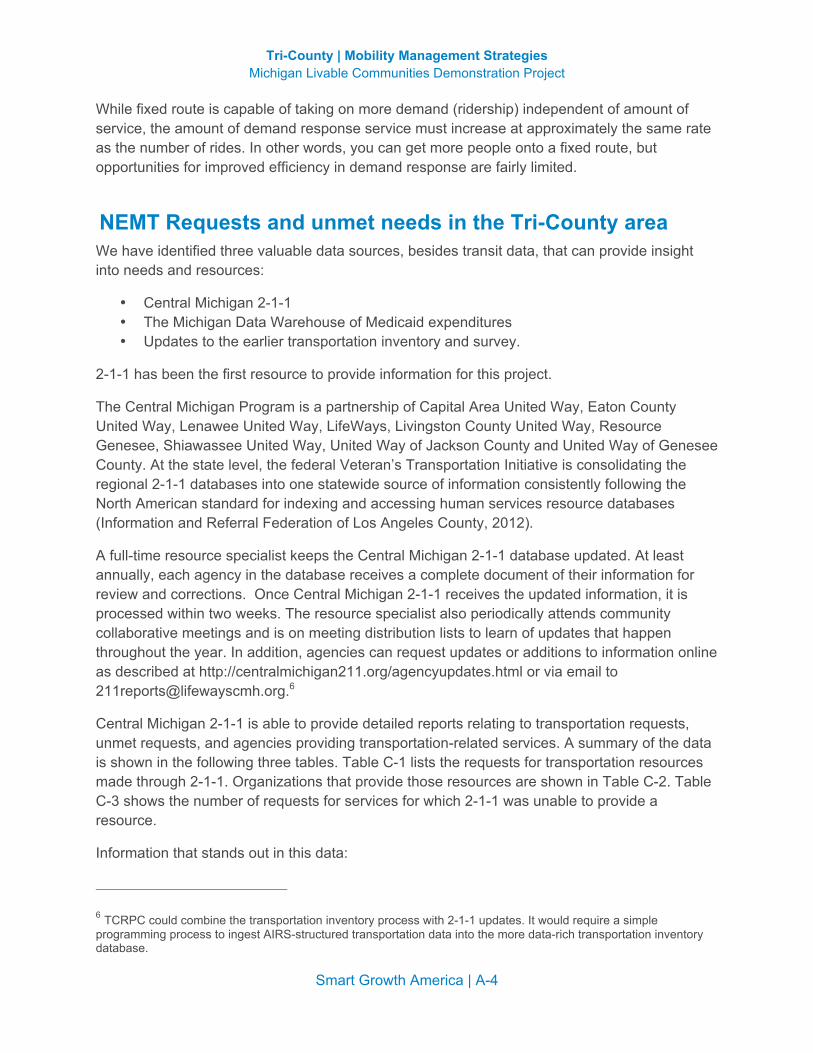
While fixed route is capable of taking on more demand (ridership) independent of amount of service, the amount of demand response service must increase at approximately the same rate as the number of rides. In other words, you can get more people onto a fixed route, but opportunities for improved efficiency in demand response are fairly limited.
NEMT Requests and unmet needs in the Tri-County area We have identified three valuable data sources, besides transit data, that can provide insight into needs and resources:
• Central Michigan 2-1-1 • The Michigan Data Warehouse of Medicaid expenditures • Updates to the earlier transportation inventory and survey.
2-1-1 has been the first resource to provide information for this project.
The Central Michigan Program is a partnership of Capital Area United Way, Eaton County United Way, Lenawee United Way, LifeWays, Livingston County United Way, Resource Genesee, Shiawassee United Way, United Way of Jackson County and United Way of Genesee County. At the state level, the federal Veteran’s Transportation Initiative is consolidating the regional 2-1-1 databases into one statewide source of information consistently following the North American standard for indexing and accessing human services resource databases (Information and Referral Federation of Los Angeles County, 2012).
A full-time resource specialist keeps the Central Michigan 2-1-1 database updated. At least annually, each agency in the database receives a complete document of their information for review and corrections. Once Central Michigan 2-1-1 receives the updated information, it is processed within two weeks. The resource specialist also periodically attends community collaborative meetings and is on meeting distribution lists to learn of updates that happen throughout the year. In addition, agencies can request updates or additions to information online as described at http://centralmichigan211.org/agencyupdates.html or via email to [email protected]
Central Michigan 2-1-1 is able to provide detailed reports relating to transportation requests, unmet requests, and agencies providing transportation-related services. A summary of the data is shown in the following three tables. Table C-1 lists the requests for transportation resources made through 2-1-1. Organizations that provide those resources are shown in Table C-2. Table C-3 shows the number of requests for services for which 2-1-1 was unable to provide a resource.
Information that stands out in this data:
6 TCRPC could combine the transportation inventory process with 2-1-1 updates. It would require a simple programming process to ingest AIRS-structured transportation data into the more data-rich transportation inventory database.

Tri-County | Mobility Management Strategies Michigan Livable Communities Demonstration Project
Smart Growth America | A-5
• The top request through 2-1-1 is for assistance with bus fare, followed by automotive repair and gas money.
• The top request for assistance that cannot be met is for loosely defined “unmet transportation requests”. Assistance with medical appointments transportation ranked third.
• Love INC is, by far, the agency most referred for transportation services, for assistance with bus fare and gas money. This and other agencies in Table 4 are good potential partners in coordination efforts, if they are not currently actively involved.
Table C-3: Central Michigan 2-1-1 Transportation Requests (1/1/2012-4/30/2013)
Referred Service Service Requests
Clinton 46 Bus Fare 10 Automotive Repair 9 Gas Money 8 Automobiles 8 Disability Related Transportation 3 Transportation System Orientation Programs 2 Automobile Payment Assistance 2 Indigent Transportation 2 Transportation Information Clearinghouses/511 Services 1 Medical Appointments Transportation 1 Eaton 115 Gas Money 50 Bus Fare 18 Automotive Repair 17 Automobiles 15 Automobile Payment Assistance 9 Transportation System Orientation Programs 3 Mercy Transportation 2 Disability Related Transportation 1 Ingham 661 Bus Fare 250 Gas Money 200 Automotive Repair 65 Automobiles 61 Automobile Payment Assistance 35 Medical Appointments Transportation 22 Disability Related Transportation 16 Transportation System Orientation Programs 5 Motor Vehicle Registration 3 Transportation for Endangered People 1 Transportation Information Clearinghouses/511 Services 1 Mercy Transportation 1 Indigent Transportation 1 Grand Total 822

Tri-County | Mobility Management Strategies Michigan Livable Communities Demonstration Project
Smart Growth America | A-6
Table C-4: Central Michigan 2-1-1 Agencies Referred for Transportation Services (1/1/2012-4/30/2013)

Tri-County | Mobility Management Strategies Michigan Livable Communities Demonstration Project
Smart Growth America | A-7
Table C-5: Central Michigan 2-1-1 Transportation Unmet Services and Needs (1/1/2012-4/30/2013) Ingham 39 Automotive Repair 27 Client ineligible/target population requirement 6 Service not available 5 No immediate resource available 1 Client ineligible/previously assisted 20 Medical Appointments Transportation 11 Service not available 3 No immediate resource available 2 Client ineligible/other reason 1 Client ineligible/outside service area 1 Client ineligible/target population requirement 1 Service inaccessible/cost 1 Service inaccessible/hours 18 Bus Fare 8 Service not available 3 Client ineligible/target population requirement 3 Client refused referral 2 No immediate resource available 1 Client ineligible/previously assisted 1 Service inaccessible/hours 3 Long Distance Transportation 3 Service not available 2 Indigent Transportation 2 Service not available 82 Unmet Transportation Requests Eaton 10 Automotive Repair 7 Client ineligible/target population requirement 2 Client ineligible/other reason 1 Service not available 7 Medical Appointments Transportation 6 Service not available 1 Service inaccessible/other reason 17 Unmet Transportation Requests Clinton 8 Automotive Repair 7 Client ineligible/target population requirement 1 No immediate resource available 4 Bus Fare 3 Service not available 1 Client refused referral 3 Medical Appointments Transportation 3 Service not available 1 Indigent Transportation 1 Client ineligible/other reason 16 Unmet Transportation Requests

Tri-County | Mobility Management Strategies Michigan Livable Communities Demonstration Project
Smart Growth America | A-8
Data sources for further information At the time this report was drafted, we were waiting for requested information from the Medicaid Data Warehouse, with inquiry information found here: http://ihcs.msu.edu/research/medicaid_match_data_warehouse.php
The Michigan Data Warehouse project is a searchable database created to allow the Department of Human Services to track Medicaid claims. This system has saved Medicaid millions of dollars by allowing staff to reduce fraud and track the use of Medicaid throughout the state. The Data Warehouse has been one of Michigan's greatest successes in Medicaid savings. A number of state agencies are successfully using it to track information. This may be the perfect tool to help the project partners understand and track Medicaid transportation expenses over time. MSU's Institute for Healthcare Studies (IHCS) controls research access to the Medicaid portion of the warehouse. While the Data Warehouse may have exactly the information we are looking for, it is not proving easy to access this data. We have obtained the IHCS Request to Obtain Warehouse Data form, which requires signatures from the Michigan Department of Community Health (MDCH) Director, Bureau Director, or Delegated Authority; a Responsible MDCH Sponsor; and a notary. Because we do not need access to any information containing private, personal data we have been in contact with a number of state officials to try to determine whether we can access the data we need without going through the extensive Data Warehouse access process.
Also, this project began developing a process to update the transportation inventory that is largely in paper format from 1991, 2008, and 2009, yet quantitative data is of little use since the scope was limited to eleven Medicaid or Title III recipient organizations, and we received data so far from only four organizations.

Tri-County | Mobility Management Strategies Michigan Livable Communities Demonstration Project
Smart Growth America | B-1
Supplement B: Non-FTA Federal Programs Sixty-two federal programs fund transportation. The following table lists the possible uses for these programs according to United We Ride. Highlighted programs relate most directly to Medicaid NEMT.
Federal Transportation Service Matrix
Rei
mbu
rsed
C
osts
(Far
es,
Gas
, Bus
Pas
s,
etc.
)
Mob
ility
Mgt
/ Tr
avel
Tra
inin
g/ O
an
d M
Ope
rate
Veh
icle
s (D
irect
or
Con
trac
t)
Purc
hase
Ve
hicl
es
(pub
lic/n
onpr
ofit)
HEALTH AND HUMAN SERVICES Administration for Children and Families
Social Service Block Grant X X X Child Care and Development Block Grant X Head Start X X Refugee and Entrant Assistant Discretionary Grants Refugee and Entrant Asst. State Administered Programs X Refugee and Entrant Targeted Assistance X Refugee and Entrant Asst. Voluntary Agency Programs X State Developmental Disabilities Council and Protection & Advocacy X X X Temporary Assist to Needy Families X Community Services Block Grant X Promoting Safe and Stable Families X
Administration on Aging Grants for Supportive Services and Senior Centers X Programs for American Indian, Alaskan Native and Native Hawaii X
Centers for Medicaid and Medicare Medicaid X State Health Insurance Program X Home and Community Based Waiver X X
Health Resources and Services Administration Community Health Centers X X Healthy Communities Program X X HIV Care Formula X X Maternal and Child Health Block Grant X Rural Health Care Network X X X Rural Health Care Outreach Program X Healthy Start Initiative X Ryan White Care Act Programs
Substance Abuse and Mental Health Services Administration Community Mental Health Services Block Grant X X Prevention and Texas Block Grant X X
DEPARTMENT OF EDUCATION Voluntary Public School Choice X X IDEA X Centers for Independent Living X

Tri-County | Mobility Management Strategies Michigan Livable Communities Demonstration Project
Smart Growth America | B-2
Rei
mbu
rsed
C
osts
(Far
es,
Gas
, Bus
Pas
s,
etc.
)
Mob
ility
Mgt
/ Tr
avel
Tra
inin
g/ O
an
d M
Ope
rate
Veh
icle
s (D
irect
or
Con
trac
t)
Purc
hase
Ve
hicl
es
(pub
lic/n
onpr
ofit)
Independent Living for Older individuals Who are Blind X Independent Living State Grants X Vocational Rehab Grants X
DEPARTMENT OF LABOR Bureau of Indian Affairs
Indian Employment Training and Related Services X X Indian Employment Services X X
Employment and Training Administration Job Corps X X Migrant and Seasonal Farm Worker X X Native American Employment and Training X X Trade Adjustment Assistance for Workers X X Welfare to Work Grants for Tribes X X Welfare to Work for States and Locals X X Work Incentive Grants X X Workforce Investment Act Adult Services Program X Workforce Investment Act Adult Dislocated Worker Program X Workforce Investment Act Youth Activities X
Veterans Programs Veterans Employment Program X Homeless Vet Project
DEPARTMENT OF TRANSPORTATION Elderly and Persons with Disability X Job Access Reverse Commute (consolidated under MAP-21) X X Non-Urbanized Formula (rural) X X Urbanized Formula X New Freedom Program (consolidated under MAP-21) X X Capital Discretionary Program X X
HOUSING AND URBAN DEVELOPMENT Community Planning and Development
Community Development Block Grant X X Housing for Ind. w/AIDS X X X Supportive Housing Programs X Principal and Interest Revitalization of Severely Distressed Housing X
Veteran Affairs Homeless Provider Grants X X Medical Care Benefits X X X
Social Security Administration Ticket to Work Program X
U.S. Department of Agriculture Food stamp and Employment Training Program X
Source: United We Ride 2007c

Tri-County | Mobility Management Strategies Michigan Livable Communities Demonstration Project
Smart Growth America | C-1
Supplement C: Medicaid Medicare and Medicaid Medicare covers everyone over 62 and operates across the country. Medicaid covers the poor and disabled. The federal government pays a percentage-based factors such as poverty rate and unemployment, typically around 54%.
The Medical Services Administration (MSA) was set up under the general fund; now it’s a medical model. Michigan has a B-3 waiver that allows bundling of services. Able-bodied poor were moved to an HMO model. In 2000, those with substance abuse, mental health, and development disabled were also moved to an HMO model.
Medicaid Non-Emergency Transportation Webinar Playback and Documents (Community Transportation Association of America, 2010)
Valerie Miller Medical Transportation Specialist 800.891.0590 x713 202.294.2212
The complete audio and visual playback of the CTAA Medicaid Webinar Parts I and II is available on the CTAA website.
• Medicaid Non-Emergency Transportation Part I Playback • Medicaid Non-Emergency Transportation Webinar Part II Playback
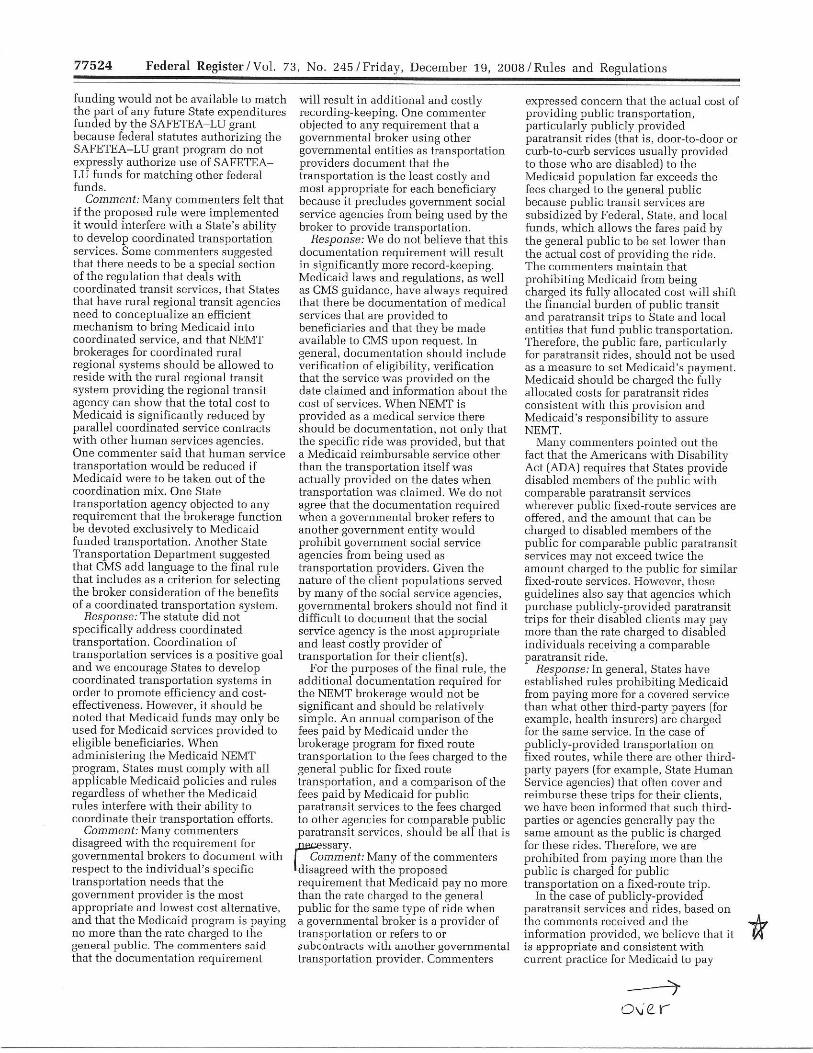
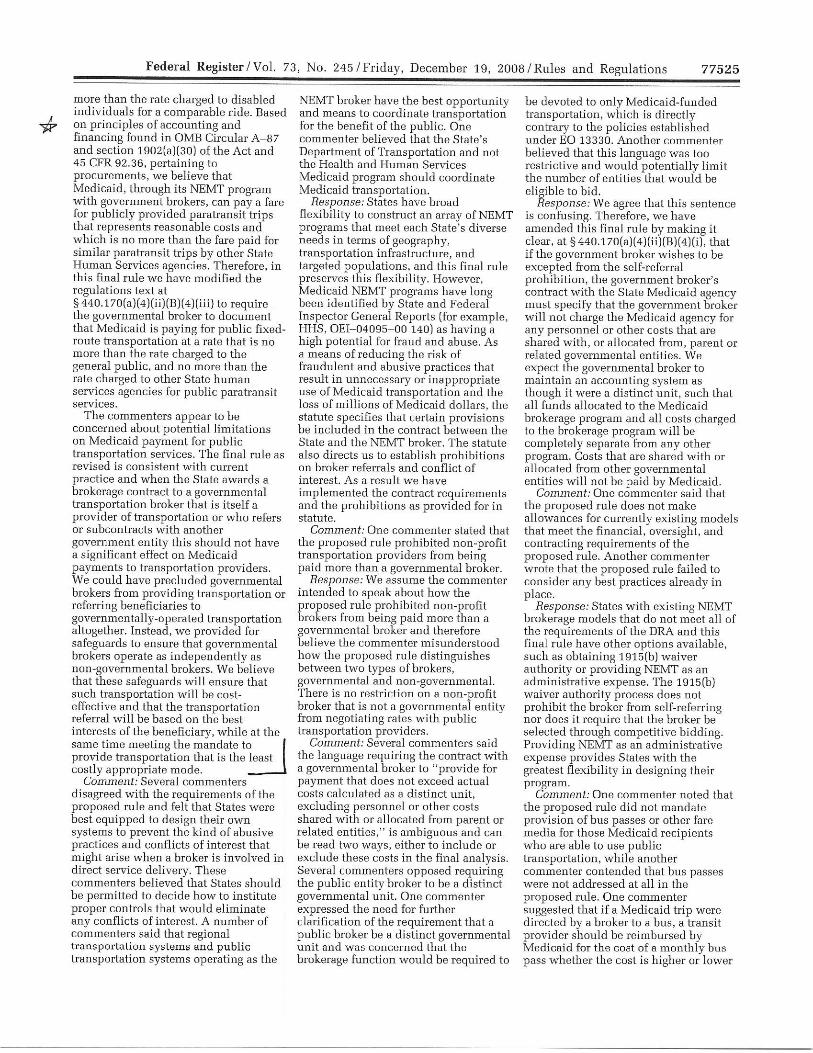
Medicaid Brokerage Final Rule Excerpt The next two pages show the discussion regarding public paratransit reimbursement.
Federal Register. (2008, December 19). Vol. 73 No. 245 p. 77254. Medicaid Program: State Option to Establish Non-Emergency Medical Transportation Program. Final Rule.

Tri-County | Mobility Management Strategies Michigan Livable Communities Demonstration Project
Smart Growth America | D-1
Supplement D: Standard Practice for Calculating the Cost of a Ride Standard practice for calculating the cost of a ride requires developing a cost allocation model. This requires a budget or statement of operating funds, the miles of service, and hours of service for a year.
As an example, the cost allocation model for a transit agency we recently worked with is summarized by the following equation from the costs and associated categories in the agency’s budget.
2012 Operating Cost = 1.45 ( $34.90 x
# of Hours in Service
+ $0.87 x # of Miles in Service)
The cost of providing transportation could vary between different organizations if one organization has higher overhead or driver salary costs than another. Such cost variations could result from differences in overall organizational efficiency. Any other significant difference would likely result from accounting practices that do not capture the full cost of the ride. Generally, staffing costs and overhead are more significant factors than fuel costs.
The cost allocation model shown above follows a standard transportation cost allocation models and includes only operating costs. Values for the cost model are calculated as follows:
The average cost per hour of service is $72.31. The average cost per mile of service is $4.20.
When the hours and miles for a special service are estimated, these numbers can be plugged into the formula to estimate cost, which in turn can be used to negotiate contracts.
In addition to allowing an agency to know the true cost of the services provided, a fully allocated cost model also allows equal comparison of costs between varying types of service, such as a commuter service that covers a longer distance at a higher average

Tri-County | Mobility Management Strategies Michigan Livable Communities Demonstration Project
Smart Growth America | D-2
speed, and an in-town route that travels at a lower average speed with more stops. When combined with ridership, this establishes a baseline for developing a fair contract for service, or multi-agency fare structure.
The cost of providing transportation could vary between different organizations if one organization has higher overhead or driver salary costs than another. Such cost variations could result from differences in overall organizational efficiency. Any other significant difference would likely result from accounting practices that do not capture the full cost of the ride. Generally, staffing costs per hour and overhead are more significant factors than fuel efficiency.
Shared Ride Allocation Cost allocation for shared ride demand response is not yet established in standard practice. Whenever two or more customers are being transported in a vehicle at the same time and those customers are sponsored by different funding sources, each sponsoring organization is obligated to ensure that it only pays for its share of the service and that it is not subsidizing the transportation of the other riders. This requirement starts at the federal level, according to 42 CFR Part 440.170.
Many recognize that a shared seat allocation, which can be based on time or miles, is an equitable cost allocation methodology. This also happens to be the most complicated methodology to implement and automate, and a major subject of research for the Washington Federal Opportunities Workgroup.

Tri-County | Mobility Management Strategies Michigan Livable Communities Demonstration Project
Smart Growth America | E-1
Supplement E: Medicaid Transportation in Other States The following is a summary of the status of coordination between public transportation and Medicaid transportation in other states. The examples from other states are primarily derived from (Agency Council on Coordinated Transportation, 2011) supplemented by interviews with key Washington stakeholders (Chartock, Rural and Coordinated Transportation Administrator, Public Transportation Division of WSDOT, 2013), (Carlson, 2013). They illustrate different models for a holistic approach to -managing NEMT services. However, the interview subjects reported increasing challenges working with state-level people with Medicaid in Washington, and the outlook for success has diminished significantly since these examples were documented in 2010.
Washington Example Funding Option The state has opted to fund NEMT transportation statewide using the Deficit Reduction Act option.
Cost Allocation For NEMT trips, brokers pay transportation provider’s based on a pre-negotiated rate, which may include mileage, time, a flat fee, or other factors. The costs are allocated equitably to the clients’ specific medical program account codes. There are currently over 90 program account codes that are used to allocate costs for NEMT trips.
When arranging for shared trips, each funder is invoiced for their rider’s portion of the trip. These trip costs may include reduced shared ride rates that transportation providers include in their negotiated rates.
Coordination – Brokerages Operated by Non-Profit Organizations (12 of 13 regions) or Brokerage Operated by Council of Government (1 region) By design, the Washington State transportation brokerage system is a mechanism to share trips among various funders. They arrange for the lowest cost, most appropriate method of transportation, which can include public transit bus passes, gas vouchers, client and volunteer mileage reimbursement, taxi, cabulance, ferry, commercial bus, and air.
Since 1989, Washington’s NEMT services have been managed by transportation brokers for the state’s 13 transportation service regions. Washington’s Department of Social and Health Services contracts with the transportation brokers, which are selected through a competitive procurement process.
In addition to brokering NEMT trips for Medicaid eligible clients, NEMT brokers also can and do contract with other programs to arrange for transportation, such as seniors, veterans, students, and employment transportation. When appropriate, these trips can be shared and costs allocated by trip, miles, service hours and/or a combination of all methods.

Tri-County | Mobility Management Strategies Michigan Livable Communities Demonstration Project
Smart Growth America | E-2
NEMT brokers or their providers who arrange trips for multiple programs typically assign grouped or shared ride trips only if the assigned group or shared ride trip is more cost effective to the funding source than it would be in comparison to providing separate individual trips, or when it is not possible to provide separate trips.
We interviewed the Director and another management level staff member at People for People – a non-profit organization that operates one of Washington’s regional brokerages out of Yakima. As a model for a holistic approach to brokering, People for People stands out for a number of reasons:
• Their brokerage is operated out of the regional 2-1-1 call center to fully integrate coordination of these two important services.
• A number of years ago, they developed software for brokering Medicaid NEMT because nothing else that was available met eligibility requirements. Since developing the software, they have continued to refine and improve it, and have also shared it with others around the state.
• In addition to operating the brokerage, for the last 12 years the organization has provided facilitation and leadership for a consortium of human services providers created to plan and implement regional coordination. They have been successful at getting agencies to consolidate rides and coordinate scheduling (times and days) of appointments and other activities. The consortium includes the office on aging, tribal transit, the vocational rehab department, hospitals, sheltered workshops, Head Start, school districts, and public transportation providers. Most of People for People’s funding is from state and federal transportation dollars and the contract for operating the brokerage is a key part of their funding structure.
Recent Updates from the Council Administrator Don Chartock | ACCT Administrator; Rural and Coordinated Transportation Administrator | Washington State Department of Transportation | 360-705-7928 | [email protected] The state of Washington has been particularly successful at achieving well-coordinated, cost-efficient NEMT services, but in spite of this success they report increasing service reductions and unmet needs due to changes in Medicaid policies. In an interview, the Intercity and Rural Specialist at the Washington DOT Agency Council on Coordinated Transportation stated that dropping reimbursement rates combined with increased paperwork due to greatly increased federal oversight requirements are resulting in significant service cuts by both non-profit and government operated NEMT providers. These impacts are particularly acute in rural area but are starting to affect suburban areas as well. Increasingly, instead of providing door to door service to medical facilities, the NEMT providers are transferring riders to fixed routes. While fixed routes offer much higher cost efficiency and should be used as the preferred alternative whenever possible, when fixed routes become the only alternative, a significant percentage of riders who are unable to use fixed route buses are left with no transportation options.
In the two years since the FOW Final Report was published in February 2011, the federal Centers for Medicare and Medicaid Services (CMS) have been reluctant to provide written direction and backing, leaving state Medicaid officials unwilling to participate with the ACCT. As a result, the

Tri-County | Mobility Management Strategies Michigan Livable Communities Demonstration Project
Smart Growth America | E-3
three proposed pilot projects have not been initiated. ACCT is now working through their Congressional delegation to try to get policy clarification and collaboration from CMS.
Chartock reported that the increasing difficulty of working with Medicaid is also impacting the states and regions that were presented as positive examples in the 2011 FOW report. Even in 2010 when the report was being developed, most regions around the country that were successfully sharing rides and allocating costs were generally unwilling to discuss the details of their models out of concern that these details would raise concerns with Medicaid officials, resulting in Medicaid pulling out of their coordinated NEMT systems. As a result, it was difficult to gather even the summary information included in the FOW report. Since then Oregon, Florida and Pennsylvania – all of which are featured examples in the report – have been pulling back on their ride sharing and cost allocation approaches.
In the meantime, ACCT has been focusing on researching and quantifying the problem with riders who qualify for both Medicaid and ADA paratransit service, where the farebox rate is limited to no more than twice that on fixed route public transportation.
Perspective from a Non-Profit Broker Madelyn Carlson | Chief Executive Officer | People for People | Central Washington | (509) 248-6726 | [email protected] | http://www.pfp.org/pfp/pfp/AboutUs.aspx People for People is a non-profit 501(c)3 organization committed to serving people in Washington State since 1965. The organization provides transportation services for the general public and special needs population, employment and training services, and 2-1-1 Information Referral Services. They also broker Medicaid and transportation services.”
Brokerage Medicaid has been changing in Washington. As a broker, monitoring responsibilities have become a “nightmare” with extensive scrutiny required. As part of brokering she purchases tokens/passes on public transportation for Medicaid clients. The brokerage is operated through the 211 call center.
Coordination For 12 years People for People provides facilitation and leadership for regional coordination for a consortium of human services providers. They have been successful at getting agencies to consolidate rides and coordinate scheduling (times and days) of appointments and other activities. They have been able to get stakeholders to coordinate without having to extensive number crunching by conducting a fairly simple analysis showing that they would get more passengers on fewer trips. However, they serve very rural areas with long trips, so the benefits are fairly obvious because of the significant mileage involved. Carlson feels that as resources have become more limited over the 12 years, motivation for coordination has increased. The consortium of providers includes: office on aging, tribal transit, vocational rehab dept., hospitals, sheltered workshops, head start, school districts, and public transportation providers.
Tri-County | Mobility Management Strategies Michigan Livable Communities Demonstration Project
Smart Growth America | E-4
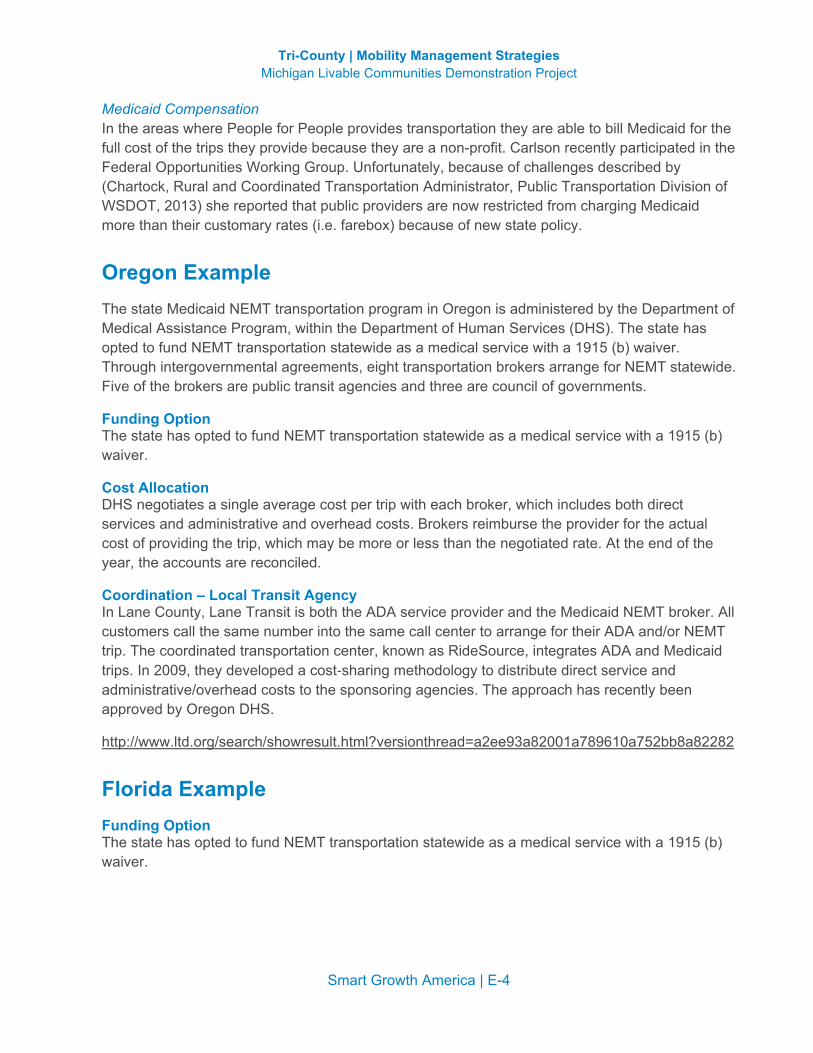
Medicaid Compensation In the areas where People for People provides transportation they are able to bill Medicaid for the full cost of the trips they provide because they are a non-profit. Carlson recently participated in the Federal Opportunities Working Group. Unfortunately, because of challenges described by (Chartock, Rural and Coordinated Transportation Administrator, Public Transportation Division of WSDOT, 2013) she reported that public providers are now restricted from charging Medicaid more than their customary rates (i.e. farebox) because of new state policy.
Oregon Example The state Medicaid NEMT transportation program in Oregon is administered by the Department of Medical Assistance Program, within the Department of Human Services (DHS). The state has opted to fund NEMT transportation statewide as a medical service with a 1915 (b) waiver. Through intergovernmental agreements, eight transportation brokers arrange for NEMT statewide. Five of the brokers are public transit agencies and three are council of governments.
Funding Option The state has opted to fund NEMT transportation statewide as a medical service with a 1915 (b) waiver.
Cost Allocation DHS negotiates a single average cost per trip with each broker, which includes both direct services and administrative and overhead costs. Brokers reimburse the provider for the actual cost of providing the trip, which may be more or less than the negotiated rate. At the end of the year, the accounts are reconciled.
Coordination – Local Transit Agency In Lane County, Lane Transit is both the ADA service provider and the Medicaid NEMT broker. All customers call the same number into the same call center to arrange for their ADA and/or NEMT trip. The coordinated transportation center, known as RideSource, integrates ADA and Medicaid trips. In 2009, they developed a cost-‐sharing methodology to distribute direct service and administrative/overhead costs to the sponsoring agencies. The approach has recently been approved by Oregon DHS.
http://www.ltd.org/search/showresult.html?versionthread=a2ee93a82001a789610a752bb8a82282
Florida Example Funding Option The state has opted to fund NEMT transportation statewide as a medical service with a 1915 (b) waiver.

Tri-County | Mobility Management Strategies Michigan Livable Communities Demonstration Project
Smart Growth America | E-5
Cost Allocation The state Medicaid NEMT transportation program in Florida is administered by the Transportation Disadvantaged Commission (TD) per an interagency MOU between the TD commission and the agency responsible for Medicaid NEMT services.
The TD commission’s statewide cost allocation method/model is based on grant accounting principles used in the TD Program. The method is built upon three years of both historical and projected budget data, and provides fully allocated rates with local ability to adjust rates in mid-‐period.
Coordination – Local Transit Agency In Orlando and three surrounding counties, Lynx transit agency is the region’s Community Transportation Coordinator and retains a contractor to operate its coordinated paratransit services. In this system, Medicaid NEMT trips are shared with ADA trips, as well as other agency-‐funded trips. The rates charged to Medicaid and the other funding agencies are based on the TD’s statewide cost allocation and rate methodology.
North Carolina Example Funding Option The state has opted to fund NEMT transportation in some regions as an administrative service, and in some regions as a medical service with a 1915 (b) waiver.
Cost Allocation The statewide cost allocation method/model is based on grant accounting principles used for the CTPs, and is built upon historical data (from an analysis of service) and projected budget data. This end product is a fully allocated per trip rate for demand responsive service, noting that the locals have the ability to adjust the rate based on subsidy considerations.
Coordination – Local Transit Agency In North Carolina, the local county-‐based Medicaid offices are directed to utilize the predominantly county-‐based Community Transportation Program (CTP) for NEMT needs, per Executive Order and interagency MOU.
The Winston Salem Transit Authority (WSTA) provides countywide fixed route and paratransit service in a large urbanized area (Forsyth County, NC – 330,000 pop; 410 sq. mi). The paratransit service includes ADA paratransit, Medicaid NEMT, and senior transportation funded by Title III-‐B.
The paratransit service is operated by WSTA, augmented by overflow taxi vendors. The paratransit service is completely integrated: ADA paratransit, Medicaid trips and senior trips are shared when it is lowest cost and most appropriate. Client eligibility is determined by Forsythe County Department of Social Services (DSS), which is electronically submitted to WSTA. Rates are annually negotiated between the City (Winston-‐Salem) and Forsythe County DSS. Per trip rates are based on fully allocated cost of paratransit service, using the statewide model.

Tri-County | Mobility Management Strategies Michigan Livable Communities Demonstration Project
Smart Growth America | E-6
Pennsylvania Example Funding Option The state has opted to fund its NEMT transportation as an administrative service.
Cost Allocation For all but three high volume programs, agency sponsors are charged the zone-‐to-zone fare, which is based on fully-‐allocated historic costs of the brokerage as a whole. In the case of three high volume sponsors (including Medicaid), a statistically relevant number of trips are selected and costed out. This process considers the degree to which trip is or isn’t shared, the time in which those trips are shared, and the carriers’ hourly rate. These costs are then averaged to calculate an average cost per trip for each of the three sponsoring agencies. This cost, plus their share of the fixed administrative cost, becomes the rate for the ensuing 6 months, when the process is repeated.
Coordination – Private broker sponsored by public transportation provider ACCESS is sponsored by Port Authority of Allegheny County and is operated by ACCESS Transportation Systems, Inc., a subsidiary of Veolia Transportation: http://www.veoliatransportation.com/index
Pittsburg ACCESS is a brokerage that manages Americans with Disabilities Act (ADA) paratransit service and a senior shared-‐ride program, on behalf of the Port Authority of Allegheny County (the local transit provider). ACCESS has entered into sponsorship agreements with over 120 different human service agencies, including the State’s Medical Assistance Transportation Program – the NEMT service.
ACCESS Transportation Systems and Port Authority of Allegheny County, Pennsylvania receive a 2005 United We Ride Leadership Award featured on the United We Ride website: http://www.unitedweride.gov/1_865_ENG_HTML.htm
California Examples Some brokerages do not broker Medicaid rides at all. Two examples are Wheels, which is the public transportation system in the Livermore Amador Valley and brokers ADA services to private operators; and FACT, which operates in San Diego and brokers Above and Beyond senior services.