Language Testing - Semantic Scholar · Construct validation of analytic rating scales in a speaking...
37
http://ltj.sagepub.com Language Testing DOI: 10.1177/0265532207077205 2007; 24; 355 Language Testing Yasuyo Sawaki Reporting a score profile and a composite Construct validation of analytic rating scales in a speaking assessment: http://ltj.sagepub.com/cgi/content/abstract/24/3/355 The online version of this article can be found at: Published by: http://www.sagepublications.com can be found at: Language Testing Additional services and information for http://ltj.sagepub.com/cgi/alerts Email Alerts: http://ltj.sagepub.com/subscriptions Subscriptions: http://www.sagepub.com/journalsReprints.nav Reprints: http://www.sagepub.com/journalsPermissions.nav Permissions: http://ltj.sagepub.com/cgi/content/refs/24/3/355 SAGE Journals Online and HighWire Press platforms): (this article cites 35 articles hosted on the Citations © 2007 SAGE Publications. All rights reserved. Not for commercial use or unauthorized distribution. at PENNSYLVANIA STATE UNIV on April 12, 2008 http://ltj.sagepub.com Downloaded from
Transcript of Language Testing - Semantic Scholar · Construct validation of analytic rating scales in a speaking...

http://ltj.sagepub.com
Language Testing
DOI: 10.1177/0265532207077205 2007; 24; 355 Language Testing
Yasuyo Sawaki Reporting a score profile and a composite
Construct validation of analytic rating scales in a speaking assessment:
http://ltj.sagepub.com/cgi/content/abstract/24/3/355 The online version of this article can be found at:
Published by:
http://www.sagepublications.com
can be found at:Language Testing Additional services and information for
http://ltj.sagepub.com/cgi/alerts Email Alerts:
http://ltj.sagepub.com/subscriptions Subscriptions:
http://www.sagepub.com/journalsReprints.navReprints:
http://www.sagepub.com/journalsPermissions.navPermissions:
http://ltj.sagepub.com/cgi/content/refs/24/3/355SAGE Journals Online and HighWire Press platforms):
(this article cites 35 articles hosted on the Citations
© 2007 SAGE Publications. All rights reserved. Not for commercial use or unauthorized distribution. at PENNSYLVANIA STATE UNIV on April 12, 2008 http://ltj.sagepub.comDownloaded from

Construct validation of analytic rating scales in a speakingassessment: Reporting a score profile and a compositeYasuyo Sawaki Educational Testing Service, Princeton
This is a construct validation study of a second language speaking assessmentthat reported a language profile based on analytic rating scales and a compos-ite score. The study addressed three key issues: score dependability, conver-gent/discriminant validity of analytic rating scales and the weighting of ana-lytic ratings in the composite score. Confirmatory factor analysis (CFA) andmultivariate generalizability theory (G theory) were combined to analyze theresponses of 214 admits to a study-abroad program to two role-play speakingtasks in a Spanish speaking assessment designed for student placement anddiagnosis. The CFA and G theory approaches provided complementary infor-mation, which generally confirmed the key features of the assessment design:(1) the multicomponential and yet highly correlated nature of the five analyticrating scales: Pronunciation, Vocabulary, Cohesion, Organization andGrammar, (2) the high dependability of the ratings and the resulting place-ment decisions appropriate for the high-stakes decision-making context basedon these analytic rating scales and the composite score, and (3) the largestcontribution of Grammar to the composite score variance, which was consis-tent with the intention of program faculty members to reflect in the test designthe relative importance of knowledge of grammar for students’ academic suc-cess in the study-abroad program.
I Introduction
In second language performance assessment, analytic rating scalesare often used to assess candidates’ language ability within a singlemodality (e.g., speaking). Rationales in the literature for adoptinganalytic over holistic rating scales include the availability of richinformation about examinees’ language ability (Brown & Bailey,1984; Pollitt & Hutchinson, 1987; Kondo-Brown, 2002; Bachman,Lynch & Mason, 1995); increased accuracy of ratings by drawing
Language Testing 2007 24 (3) 355–390 10.1177/0265532207077205 © 2007 SAGE (Publications)
Address for correspondence: Dr. Yasuyo Sawaki, Center for Validity Research, MS 10-R,Educational Testing Service, Rosedale Road, Princeton, NJ 08541, USA; email: [email protected]
© 2007 SAGE Publications. All rights reserved. Not for commercial use or unauthorized distribution. at PENNSYLVANIA STATE UNIV on April 12, 2008 http://ltj.sagepub.comDownloaded from

judges’ attention to specific criteria (Brown & Bailey, 1984); and con-sistency with the current multicomponential definition of languageability (Bachman, Lynch & Mason, 1995). Scores based on analyticrating scales can be reported in various forms. Multiple scores fromindividual scales can be reported separately as a language profile. Theycan also be accompanied by some sort of an overall score, which canbe an additional rating obtained on an overall scale (e.g., Elder, 1993;McNamara, 1990, 1996); or a composite score obtained by averagingor summing across the scores on analytic scales by weighting all com-ponents equally (e.g., Brown & Bailey, 1984; Kondo-Brown, 2002) ordifferentially (e.g., Jacobs et al., 1981; Weigle, 1998).
In order for multiple scores reported within a language modalitybased on analytic rating scales to be useful for an intended purpose,empirical evidence must support the test design in three ways. First,empirical interrelationships among analytic rating scales must showthat the scales are related to one another (convergent validity), andalso distinct enough so that each scale provides information about aunique aspect of a candidate’s language ability (discriminant validity).Second, when an overall score is reported in addition to analytic rat-ings, the empirical relationship of the analytic scales to the overallscore, i.e., the weighting of individual analytic rating scales in anoverall score, should be congruent with the relative importance ofdifferent aspects of language ability for a given purpose of assess-ment in a particular context. Finally, ratings provided by ratersshould be reliable, and decisions made based on such ratings shouldbe dependable for analytic ratings as well as an overall score.
In reference to these three key issues, a number of previous studieshave addressed score dependability, while only a few have examinedconvergent/discriminant validity, and relationships between analyticratings and an overall score. As an attempt to narrow this gap, thepresent study investigated these issues for a Spanish speaking assess-ment by combining confirmatory factor analysis (CFA) and multi-variate generalizability theory (G theory).
II Review of literature
The validation issue that has received the most attention in previousresearch into L2 performance assessments based on analytic ratingscales is score dependability. Previous researchers addressed thistopic extensively by employing G theory (Cronbach, Gleser, Nanda &Rajaratnam, 1972; Shavelson & Webb, 1991) and item response the-
356 Construct validation of analytic rating scales
© 2007 SAGE Publications. All rights reserved. Not for commercial use or unauthorized distribution. at PENNSYLVANIA STATE UNIV on April 12, 2008 http://ltj.sagepub.comDownloaded from
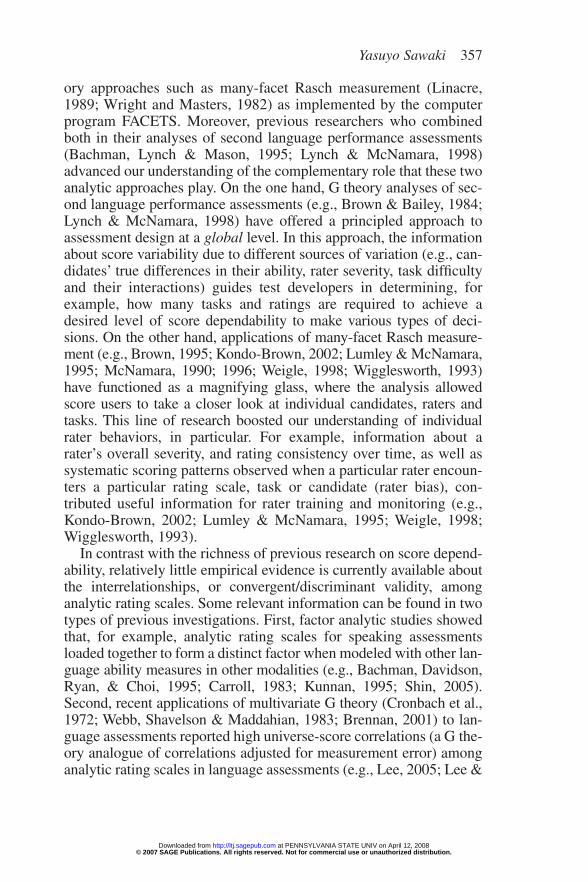
ory approaches such as many-facet Rasch measurement (Linacre,1989; Wright and Masters, 1982) as implemented by the computerprogram FACETS. Moreover, previous researchers who combinedboth in their analyses of second language performance assessments(Bachman, Lynch & Mason, 1995; Lynch & McNamara, 1998)advanced our understanding of the complementary role that these twoanalytic approaches play. On the one hand, G theory analyses of sec-ond language performance assessments (e.g., Brown & Bailey, 1984;Lynch & McNamara, 1998) have offered a principled approach toassessment design at a global level. In this approach, the informationabout score variability due to different sources of variation (e.g., can-didates’ true differences in their ability, rater severity, task difficultyand their interactions) guides test developers in determining, forexample, how many tasks and ratings are required to achieve adesired level of score dependability to make various types of deci-sions. On the other hand, applications of many-facet Rasch measure-ment (e.g., Brown, 1995; Kondo-Brown, 2002; Lumley & McNamara,1995; McNamara, 1990; 1996; Weigle, 1998; Wigglesworth, 1993)have functioned as a magnifying glass, where the analysis allowedscore users to take a closer look at individual candidates, raters andtasks. This line of research boosted our understanding of individualrater behaviors, in particular. For example, information about arater’s overall severity, and rating consistency over time, as well assystematic scoring patterns observed when a particular rater encoun-ters a particular rating scale, task or candidate (rater bias), con-tributed useful information for rater training and monitoring (e.g.,Kondo-Brown, 2002; Lumley & McNamara, 1995; Weigle, 1998;Wigglesworth, 1993).
In contrast with the richness of previous research on score depend-ability, relatively little empirical evidence is currently available aboutthe interrelationships, or convergent/discriminant validity, amonganalytic rating scales. Some relevant information can be found in twotypes of previous investigations. First, factor analytic studies showedthat, for example, analytic rating scales for speaking assessmentsloaded together to form a distinct factor when modeled with other lan-guage ability measures in other modalities (e.g., Bachman, Davidson,Ryan, & Choi, 1995; Carroll, 1983; Kunnan, 1995; Shin, 2005).Second, recent applications of multivariate G theory (Cronbach et al.,1972; Webb, Shavelson & Maddahian, 1983; Brennan, 2001) to lan-guage assessments reported high universe-score correlations (a G the-ory analogue of correlations adjusted for measurement error) amonganalytic rating scales in language assessments (e.g., Lee, 2005; Lee &
Yasuyo Sawaki 357
© 2007 SAGE Publications. All rights reserved. Not for commercial use or unauthorized distribution. at PENNSYLVANIA STATE UNIV on April 12, 2008 http://ltj.sagepub.comDownloaded from

Kantor, 2005; Sawaki, 2003, 2005; Xi, 2003). However, previousstudies did not systematically attempt to falsify alternative explana-tions about interrelationships among analytic rating scales within asingle modality, either because it was not the focus of a given inves-tigation or because the analytic approach employed did not allow aclose investigation of this issue.
With regard to the relationship of analytic rating scales to anoverall score, even less information is available. Two studies byMcNamara (1990) and Elder (1993) touched upon this in contextswhere a separate overall rating and analytic ratings for differentaspects of language ability were obtained. For example, in hisFACETS analysis of the analytic scales in the Speaking and Writingsections of the Occupational English Test (OET) in Australia,McNamara (1990) identified an unexpected interdependencebetween two rating scales, Overall Effectiveness (overall ratingscale) and Resources of Grammar and Expression (one of the ana-lytic rating scales), by inspecting the fit measures for the scales.McNamara (1990) speculated that this finding might be explained byan overriding role that the grammar scale played in the raters’ judg-ments on the overall scale. A multiple regression analysis showedthat as much as 68–70% of the total variances on the overall ratingsfor both the Speaking and Writing sections were accounted for by theperformance on the grammar rating scale devised in each section,confirming McNamara’s hypothesis. In a similar vein, Elder (1993)also conducted a stepwise multiple regression analysis on the ratingsgiven by content specialist vs. ESL specialist rating groups regardingEnglish language behaviors of math teacher trainees in a classroomobservation schedule and found that the two rater groups weighteddifferent analytic scales differentially.
Besides the two studies above, there are few other recent languageassessment studies that address the empirical relationship of analyticrating scales to an overall score. Some previous studies indicated howdifferent analytic rating scales were weighted for obtaining a com-posite score. For example, Weigle (1998) reported the use of differ-ential weighting of components in an ESL writing placement exam,where the score on one dimension (Language) was doubled before itwas combined with two other ratings (Content and Rhetorical Control)to obtain a composite. Note, however, that these are nominal weights,or the weights that are used for calculating a composite score.Although nominal weights often represent the test developer’s desiredweights, reflecting the relative importance of different components,for example, the nominal weights are not necessarily the same as
358 Construct validation of analytic rating scales
© 2007 SAGE Publications. All rights reserved. Not for commercial use or unauthorized distribution. at PENNSYLVANIA STATE UNIV on April 12, 2008 http://ltj.sagepub.comDownloaded from

effective weights (Wang & Stanley, 1970), namely, the degree towhich individual rating scales empirically contribute information to acomposite. Wang and Stanley (1970) pointed out that a common mis-conception is that nominal weights are equal to effective weights. Theeffective weight of a given rating scale is a function of three things:(1) the nominal weight given to the scale; (2) the variance of the scale;and (3) the covariances of the scale with the others (Bachman, 2005;Peterson, Kolen, & Hoover, 1988; Wang & Stanley, 1970). An impor-tant implication of this argument is that assigning a larger nominalweight to a given rating scale may not necessarily lead to a greaterweighting of that scale than the others when (1) the variance of thescale is small, (2) the covariances of the scale with the others aresmall, or both. Accordingly, the empirical contribution of individualrating scales to a composite score should be monitored throughouttest development and validation. Previous empirical studies in otherfields addressed the issue of how best to weight different componentsto achieve optimum reliability or to maximize the degree of matchbetween actual vs. desired weighting of different components in acomposite as defined in test specifications (e.g., Jarjoura & Brennan,1982, 1983; Li, 1990; Kane & Case, 2004; Marcoulides, 1994).However, it is perhaps fair to say that this important topic has notreceived the attention that it deserves in the language assessment lit-erature so far.
Considering the critical importance of investigation into conver-gent/discriminant validity and the interrelationships among analyticrating scales and a composite, the dearth of empirical studies thataddress effective weights of analytic rating scales is quite puzzling.A primary reason for this may be that previous investigations of L2performance assessments have made extensive use of univariate ana-lytic approaches that do not offer the full machinery to address thisissue. Univariate analytic approaches such as univariate G theory andunidimensional IRT models (e.g., many-facet Rash measurement)assume, by definition, the presence of a single construct of interest.For this reason, in a typical FACETS analysis, for example, a singleability estimate is obtained per examinee, while analytic rating scalesthemselves are specified as a facet of measurement (i.e., part of thetest method). This conceptualization of analytic rating scales doesnot seem to be fruitful, however, because what one is communicat-ing loud and clear by employing such scales is the presence of morethan one ability of interest. Multivariate analytic approaches allownot only specification of multiple constructs but also an investigationof convergent/discriminant validity among analytic rating scales,
Yasuyo Sawaki 359
© 2007 SAGE Publications. All rights reserved. Not for commercial use or unauthorized distribution. at PENNSYLVANIA STATE UNIV on April 12, 2008 http://ltj.sagepub.comDownloaded from
which in turn serves as the basis for exploring the relationships of thescales to a composite score.
III The language ability assessment system (LAAS) Spanish test
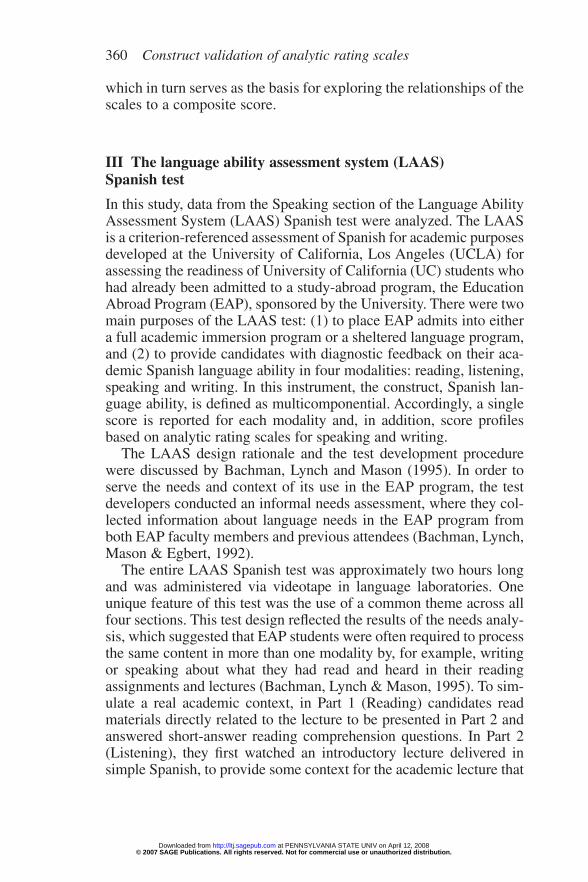
In this study, data from the Speaking section of the Language AbilityAssessment System (LAAS) Spanish test were analyzed. The LAASis a criterion-referenced assessment of Spanish for academic purposesdeveloped at the University of California, Los Angeles (UCLA) forassessing the readiness of University of California (UC) students whohad already been admitted to a study-abroad program, the EducationAbroad Program (EAP), sponsored by the University. There were twomain purposes of the LAAS test: (1) to place EAP admits into eithera full academic immersion program or a sheltered language program,and (2) to provide candidates with diagnostic feedback on their aca-demic Spanish language ability in four modalities: reading, listening,speaking and writing. In this instrument, the construct, Spanish lan-guage ability, is defined as multicomponential. Accordingly, a singlescore is reported for each modality and, in addition, score profilesbased on analytic rating scales for speaking and writing.
The LAAS design rationale and the test development procedurewere discussed by Bachman, Lynch and Mason (1995). In order toserve the needs and context of its use in the EAP program, the testdevelopers conducted an informal needs assessment, where they col-lected information about language needs in the EAP program fromboth EAP faculty members and previous attendees (Bachman, Lynch,Mason & Egbert, 1992).
The entire LAAS Spanish test was approximately two hours longand was administered via videotape in language laboratories. Oneunique feature of this test was the use of a common theme across allfour sections. This test design reflected the results of the needs analy-sis, which suggested that EAP students were often required to processthe same content in more than one modality by, for example, writingor speaking about what they had read and heard in their readingassignments and lectures (Bachman, Lynch & Mason, 1995). To sim-ulate a real academic context, in Part 1 (Reading) candidates readmaterials directly related to the lecture to be presented in Part 2 andanswered short-answer reading comprehension questions. In Part 2(Listening), they first watched an introductory lecture delivered insimple Spanish, to provide some context for the academic lecture that
360 Construct validation of analytic rating scales
© 2007 SAGE Publications. All rights reserved. Not for commercial use or unauthorized distribution. at PENNSYLVANIA STATE UNIV on April 12, 2008 http://ltj.sagepub.comDownloaded from

followed. After that, candidates watched a 10–12 minute segment ofan actual academic lecture videotaped at an institution abroad andthen responded to short-answer listening comprehension questions. InPart 3 (Speaking), candidates completed two speaking tasks based onthe content of the academic lecture given in Part 2. Finally, in Part 4(Writing), candidates had an opportunity to write an essay, whichrequired them to integrate what they had read in the Reading sectionand what they had heard in the Listening section, and relate the infor-mation to their major field of study or their personal life.
The Speaking section consisted of two role-play tasks. Candidateswere instructed to imagine that they were visiting the professor whodelivered the introductory lecture in Part 2 and that the professorwould ask them to first, summarize the lecture in their own words,and second, to elaborate on a point discussed in the lecture by relat-ing it to their own experiences. For each of the speaking tasks, can-didates were given one minute for preparation and three minutes torespond to the task. The candidates spoke into tape recorders torecord their speech samples.
Reflecting the multicomponential definition of speaking ability in theLAAS, the scoring rubric for the Speaking section consisted of five ana-lytic rating scales: Pronunciation, Vocabulary, Cohesion, Organizationand Grammar (see Appendix A for the rating scales). Among the five rat-ing scales, all except Grammar were rated on a 4-point scale, rangingfrom 1 (“no evidence”) to 4 (“good”). In contrast, Grammar was on a 7-point scale, ranging from 1 (“no systematic evidence of range and con-trol of few or no structures; errors of all or most possible are frequent”)to 7 (“complete range and no systematic error, just lapses”).
Two independent ratings were obtained on the five analytic ratingscales for each candidate’s response to each of the two speakingtasks. When a discrepancy was observed between the two ratings onany examinee response, another rating was provided by a third rater,and the closest two scores out of the three were used for score report-ing. Six scores were reported to candidates for the speaking section.Each candidate received separate scores for the five rating scales,each of which was the mean across the four ratings after the adjudi-cation (two independent ratings for each of the two speaking tasks).A composite score, which was the grand mean across all the 20 rat-ings, was reported as the Overall Speaking score as well.
The placement decisions were made in a non-compensatorymanner. The test developers suggested cut scores of 3 (“moderate”) forPronunciation, Vocabulary, Cohesion and Organization and 4 (“large,but not complete range and control of some structures used, but with
Yasuyo Sawaki 361
© 2007 SAGE Publications. All rights reserved. Not for commercial use or unauthorized distribution. at PENNSYLVANIA STATE UNIV on April 12, 2008 http://ltj.sagepub.comDownloaded from
many error types”) for Grammar for entering a full immersion EAP.Individual EAP program advisors from each UC campus placed can-didates into either sheltered language courses or full immersion pro-grams based on the lowest score on any of the five rating scales,along with any other information. The LAAS placement decisions wererather high stakes. Since sheltered language programs were not avail-able at some hosting institutions, differential placements sometimesmeant that students had to move to different universities.
One point to note in this rating scale design is the use of theincreased score points for Grammar compared to the others. A primaryreason for the test developers’ decision to do so was to adequatelydifferentiate among different levels of grammar knowledge. Anotherimportant reason was to reflect the EAP Spanish instructors’ percep-tion of the relative importance of grammar knowledge for EAPadmits’ success in the program (Bachman, personal communication,2006). Despite this, the intended effective weights of the analytic rat-ing scales in the Overall Speaking score were not specified duringthe test development process. This is perhaps because the actualplacement decisions were based not on the Overall Speaking scorebut on the analytic rating scales. However, investigating the effectiveweights of the analytic rating scales in the composite is still crucialfor monitoring the functioning of the analytic rating scales in relationto the composite score.
Given the design rationale for the LAAS Spanish speaking sectionabove, it is important to empirically investigate the three key issuesidentified above. Thus, the present study addressed the followingresearch questions:
1) Is the underlying multicomponential trait factor structure assumedin the LAAS Spanish speaking test design supported?
2) How reliable are the LAAS Spanish speaking ratings?3) How dependable are the high-stakes placement decisions based
on the LAAS Spanish speaking test?4) Do the empirical contributions of each of the LAAS ratings
scales to the composite score variance differ?
V Method
1 Participants
The data for the speaking section of the LAAS Spanish test obtainedfrom 214 EAP admits who participated in the operational Spring
362 Construct validation of analytic rating scales
© 2007 SAGE Publications. All rights reserved. Not for commercial use or unauthorized distribution. at PENNSYLVANIA STATE UNIV on April 12, 2008 http://ltj.sagepub.comDownloaded from

1993 administration were analyzed in the present study. Most ofthe participants were sophomores from eight UC campuses, whereabout 75% of them were going to attend the study-abroad programin Spain, and the remaining 25% in Mexico. This is essentiallythe same data analyzed by Bachman, Lynch and Mason (1995).However, whereas those researchers analyzed only the Grammar rat-ing scale, the present study included all five of the analytic scales forthe Speaking section. Since the data from the third ratings were notavailable to this study, only the first two ratings were included in theanalyses.
2 Raters
The raters were 15 graduate students and faculty members at theDepartment of TESL/Applied Linguistics and the Department ofSpanish and Portuguese at UCLA. All of them were native or near-native speakers of Spanish. Bachman et al. (1992) described therater training process employed for the speaking portion. The train-ing began with raters familiarizing themselves with the project andthe rating scales, which included reviewing the test procedure anddirections as well as studying and discussing the rating scales. Thiswas followed by norming of the raters, where each of them inde-pendently rated six speaking tapes at home and then reconvened todiscuss the rating scales further. Each rater then rated four addi-tional tapes for discussion at the final norming session for thespeaking section.
3 Data analysis methods
Two multivariate analytic approaches—confirmatory factor analy-sis (CFA) and multivariate G theory—were combined in this studyin order to address the research questions above. First, CFA wasemployed in order to test relative goodness of fit of CFA modelsthat offer competing explanations of the structural relationshipsamong the five rating scales. In this study, a special type of CFAmodel for multitrait-multimethod (MTMM) analysis (Jöreskog,1974; Marsh, 1988, 1989; Marsh & Grayson, 1995; Widaman, 1985)was employed. The CFA approach to MTMM, which was alsoapplied to language assessment by Bachman and Palmer (1981,1982), Llosa (2005) and Sawaki (2003) is currently the most com-monly used alternative to Campbell and Fiske’s (1959) original
Yasuyo Sawaki 363
© 2007 SAGE Publications. All rights reserved. Not for commercial use or unauthorized distribution. at PENNSYLVANIA STATE UNIV on April 12, 2008 http://ltj.sagepub.comDownloaded from

MTMM analysis based on an inspection of an observed correlationmatrix for a set of measures.
The second approach employed was multivariate G theory (Cronbachet al., 1972; Brennan, 2001). As a broad analytic framework that sub-sumes the univariate theory previously applied to language assessmentstudies, a multivariate G theory analysis yields all the information thatis available in a univariate analysis, including variance componentestimates for different sources of score variation and various summa-ry indices of score dependability. The additional information availablein multivariate G theory that is particularly relevant to this study is theinterrelationships among a set of analytic rating scales as well as acomprehensive composite score analysis. In conventional approachesnot based on G theory (e.g., Wang & Stanley, 1970), effective weightsare obtained to investigate the extent to which individual measuresaccount for the observed composite score variance, which containsboth true-score and error variances. However, the particular advan-tage of the multivariate G theory approach to the composite scoreanalysis is that the effective weights of analytic rating scales can beobtained separately for the parts of the composite score variancecontributing to the true score variance (composite universe-scorevariance) and different types of measurement error (e.g., compositeabsolute-error variance for a criterion-related score interpretation;see Brennan 2001, pp. 305–306). Thus, for example, effective weightsof analytic rating scales for a composite true-score variance tell ushow much information they contribute to differentiate among exam-inees based on their true differences in a given ability represented bya composite.
In a sense, CFA and multivariate G theory yield overlappinginformation associated with the research questions. However, com-bining the two approaches is advantageous for this study becauseof the strengths of these approaches in different areas. First, withregard to the investigation of convergent/discriminant validity,CFA offers a sequential model testing framework for explicitlysupporting or rejecting competing explanations about the relation-ships among analytic rating scales, while multivariate G theoryonly allows “eyeballing” of the universe-score correlations amonganalytic rating scales. Second, because the primary interest of thisstudy is a criterion-referenced interpretation of the LAAS Spanishspeaking test for the EAP admits, it is useful to have informationavailable about the score dependability estimates for absolute deci-sions applicable to criterion-referenced assessment in multivariate
364 Construct validation of analytic rating scales
© 2007 SAGE Publications. All rights reserved. Not for commercial use or unauthorized distribution. at PENNSYLVANIA STATE UNIV on April 12, 2008 http://ltj.sagepub.comDownloaded from

G theory. Finally, the comprehensive composite score analysisavailable in multivariate G theory adequately addresses the empir-ical weighting of the LAAS analytic rating scales in a compositescore.
In the CFA-based MTMM analysis in this study, the covariancematrix for the 20 scores obtained for each EAP Spanish examinee(scores on two tasks rated by two raters on each of the five ratingscales) was analyzed. Each CFA model included five latent (unob-servable) factors associated with the five analytic rating scales(Pronunciation, Vocabulary, Cohesion, Organization and Grammar)and four latent factors related to the measurement design: two forthe two ratings, and two for the two speaking tasks. A series ofmodels that depicted different relationships among these latent fac-tors were tested to primarily address Research Questions 1 and 2.Following the procedure suggested by Rindskopf and Rose (1988),this sequential testing proceeded from least restrictive to morerestrictive models. Maximum-likelihood (ML) was used as themodel parameter estimation method. Multiple criteria below wereemployed in order to assess the overall goodness of fit of the CFAmodels:
• Model chi-square statistic: A statistically non-significant modelchi-square statistic indicates an adequate model fit.
• The ratio of model chi-square to model degrees of freedom(χ2
S-B/df ): Because the model chi-square statistic is sensitive tosample size, this ratio is often used as a model fit criterion. In thisstudy the ratio of 1.5 or below was considered as an indication ofgood model fit.
• Three incremental fit indices, which compare relative improve-ment in the explanation of the covariations among the measuresin the target model against the baseline model that assumes thatthe measures are completely uncorrelated (Hu & Bentler, 1995).In this study, the comparative fit index (CFI), Bentler-Bonnetnormed fit index (NFI), and the Bentler-Bonnet non-normed fitindex (NNFI) of .90 or above were used as indicators of adequatemodel fit.
• Two goodness-of-fit indices that address model parsimony:Akaike Information Criterion (AIC) and Consistent Version ofthis Statistic (CAIC). AIC adjusts for the number of parametersestimated, while CAIC takes account of both the number ofparameters estimated and sample size (Kline, 1998). The lower
Yasuyo Sawaki 365
© 2007 SAGE Publications. All rights reserved. Not for commercial use or unauthorized distribution. at PENNSYLVANIA STATE UNIV on April 12, 2008 http://ltj.sagepub.comDownloaded from

the value, the better the model fit given by the complexity of themodel.
• Root Mean Square Error of Association (RMSEA): A RMSEAindicates the extent to which the model approximates the data,taking into account the model complexity. A RMSEA of .05 orbelow is considered as an indication of good model fit.
All the CFA analyses were conducted using EQS 6.0 Beta (Bentler,1985–2002).
The multivariate G theory analysis was conducted primarily toaddress Research Questions 2, 3 and 4. Persons were treated as theobjects of measurement (a G theory term for the target of measure-ment). The five LAAS analytic rating scales were modeled as thefixed facet. Representing the five Spanish speaking abilities of pri-mary interest, the rating scales were not exchangeable with others.Each rating scale was associated with a two-facet crossed design(denoted as p x r x t), where persons (p) were completely crossedwith ratings (r) and tasks (t), i.e., each person completed both tasksand were rated twice. The ratings were treated as a random facetbecause the two ratings were considered as samples from a universeof admissible observations, i.e., interchangeable ratings provided byEAP raters, who had similar backgrounds as applied linguists andcompleted the same EAP rater training. The tasks were also treatedas a random facet. Conceptually, treating this facet as fixed may bemore appropriate because the two speaking tasks were different innature. However, the results from this two-facet crossed design arereported here because the results for the mixed effects design thatspecifies the tasks as the fixed facet can be obtained from the resultsof the present fully-crossed design. Furthermore, the results of themixed effect design were almost identical to those of the completely-crossed design.
As a first step, a generalizability study (G study) was conducted inorder to estimate the relative contribution of seven sources of scorevariation in the LAAS ratings for the present G study design (Personability, Rating severity, Task difficulty, Person by Rating interaction,Person by Task interaction, Rating by Task interaction, and residual)for a situation where only one rater and one task are used for assess-ment on each rating scale. Then, a decision study (D study) was con-ducted by setting the numbers of ratings and tasks to two each in orderto reflect the actual LAAS test design. In the D study the observedvariances and covariances among the five analytic rating scales weredecomposed into different parts called variance-covariance component
366 Construct validation of analytic rating scales
© 2007 SAGE Publications. All rights reserved. Not for commercial use or unauthorized distribution. at PENNSYLVANIA STATE UNIV on April 12, 2008 http://ltj.sagepub.comDownloaded from

estimates. The key measures among them were (1) the universe-scorevariance-covariance component estimates, which represent the partof the observed score variances and covariances attributable to the trueability differences among the persons, and (2) the absolute-errorvariance-covariance component estimates, which represent the partattributable to all the sources of score variation contributing to theabsolute error (Appendix B). These results served as the basis for theanalyses of score dependability for the LAAS analytic rating scales andthe composite score analysis discussed below. Throughout the compos-ite score analysis, equal weights were assigned to the analytic ratingscales (0.2 for all, so that the sum equals 1) to conform to the nominalweights actually used for the calculation of the Overall Speaking scorein the operational LAAS. The computer program mGENOVA(Brennan, 1999) was used for the multivariate G theory analyses.
4 Outliers, missing scores and normality of distributions
Out of the 214 examinees, seven who did not complete the entire testand thus had missing ratings for the speaking section were deletedlist-wise. Another case had one missing score for an Organizationrating that was imputed by using the EM (estimation maximization)algorithm and retained in the subsequent analyses. None of theremaining 207 cases was found to be a univariate outlier on the 20LAAS ratings, while two were identified as multivariate outliersbased on Mahalanobis distance. The listwise deletion of these twocases resulted in a final sample size of 205. An investigation ofrandomly-selected scatterplots on various combinations of the rat-ings suggested that the variables were roughly linearly related.Inspection of the histograms as well as standardized skewness andkurtosis values showed that all the distributions were univariatenormal except for the four Pronunciation ratings, which were signif-icantly negatively skewed. Bachman et al. (1992) reported the rel-atively high mean ratings that examinees obtained for thePronunciation rating scale in an earlier LAAS pilot study as well.Unfortunately, the language background information of the EAPadmits in the present sample and the pilot study sample were notavailable to this study. One possible explanation, given the largeSpanish-speaking population in California, is that the EAP admitsinvolved in the pilot test and the 1993 operational test administrationmight have represented heritage Spanish speakers and/or learners ofSpanish who had developed good pronunciation skills with frequentexposure to the Spanish language.1
Yasuyo Sawaki 367
© 2007 SAGE Publications. All rights reserved. Not for commercial use or unauthorized distribution. at PENNSYLVANIA STATE UNIV on April 12, 2008 http://ltj.sagepub.comDownloaded from
Multivariate normality of the score distribution for all the 20 rat-ings was examined by the normalized Mardia’s coefficient. The valueof 17.62 suggested considerable non-normality of the multivariatescore distribution. This non-normality of the data was accommodatedin the CFA analysis by using the robust statistics available in EQS.Moreover, chi-square difference tests conducted to statistically com-pare relative fit of competing models were also based on the Satorra-Bentler Scaled chi-square statistic (Satorra & Bentler, 1999). In themultivariate G theory analyses, a regular MANOVA-based procedurefor variance-covariance component estimation, as implemented inmGENOVA, was used due to its robustness to nonnormality of scoredistributions (Brennan, 2001).2
VI Results
1 Research Question 1: Is the underlying multicomponential traitfactor structure assumed in the LAAS Spanish speaking test designsupported by empirical results?
Both the CFA and the multivariate G theory analysis yielded relevantinformation to address this research question. In the multivariate Gtheory analysis, the universe-score correlations, i.e., the G theory ana-logue of true-score correlations, of the five LAAS analytic ratingscales were obtained in the D study. As can be seen in Table 1, theuniverse-score correlations were extremely high, ranging from .85 to.98, especially those among Vocabulary, Cohesion and Grammar, sug-gesting that an examinee that scored high on one of these three ratingscales tended to score high on the other two as well. Although this
368 Construct validation of analytic rating scales
1Another possibility might be the relative leniency of the raters on the Pronunciation rating scale.However, this explanation is not straightforward because previous findings on rater behaviorregarding their harshness on rating of pronunciation are mixed. Earlier studies reported that ratingsthat involved pronunciation were not particularly harsh (e.g., McNamara, 1990), while others thatcompared rater groups with different backgrounds reported that rater harshness on this dimensiondepended on the rater background (e.g., Brown, 1995).2Previous authors (Jöreskog, 1974; Linn & Werts, 1979; Marcoulides, 1996, 2000; Raykov &Marcoulides, 2006) have indicated that some variance component estimates needed for G theoryanalyses can be obtained through a CFA, and Schoonen (2005) applied this approach to an analysisof a norm-referenced language assessment. However, the results based on the CFA approach are notreported in this paper due to technical difficulties associated with estimation of some variance-covariance components for sources of score variation not involving the objects of measurement.Although the use of the MANOVA-based approach as implemented in mGENOVA with the CFA inthis study makes the results from the two approaches look “disjoined,” the CFA and ANOVA-basedvariance-covariance component estimation produce essentially identical results (e.g. Linn & Werts,1979; Marcoulides, 1996, 2000).
© 2007 SAGE Publications. All rights reserved. Not for commercial use or unauthorized distribution. at PENNSYLVANIA STATE UNIV on April 12, 2008 http://ltj.sagepub.comDownloaded from

result demonstrates the high intercorrelations among the rating scales,multivariate G theory framework does not allow one to systematical-ly test the extent to which the convergent/discriminant validity of theLAAS rating scales was tenable. Thus, this issue was explored furtherwithin CFA.
In the CFA approach, relative goodness of fit of CFA models thatoffered competing explanations about the trait factor structure of theLAAS Spanish speaking section were compared. The path diagramfor the initial model (henceforth, Correlated Trait Factor Model, orCTF Model) is shown in Figure 1. This initial model depicted themulticomponential and yet correlated nature of the language abilityassessed in the LAAS Spanish speaking section assumed by the testdevelopers. The 20 rectangles in the center of Figure 1 represent the20 observed variables, i.e., the 20 LAAS ratings awarded to eachcandidate as all possible combinations of the five rating scales, tworatings and two tasks. The ovals in the diagram represent latent fac-tors that are hypothesized to predict examinees’ observed scores.The five ovals to the left are for the traits of interest: Pronunciation,Vocabulary, Cohesion, Organization and Grammar. The four ovalsto the right are for the latent factors associated with the test method:the two ratings and the two tasks. In this model, each of the 20observed variables was specified as related to one trait factor andtwo method factors. For example, the first observed variable was thePronunciation rating by Rater 1 on Task 1 (labeled as PROR1T1 in thefigure). That is, the rating on this variable can be predicted by a candi-date’s ability on the Pronunciation rating scale as well as the severityof Rating 1 and the difficulty of Task 1. These predictive relationshipsbetween the latent factors and the observed variable are thus indi-cated by the arrows in the figure and were estimated as path coeffi-cients. Another important feature of this model is the interrelationshipsspecified among the five trait factors. This was done to reflect the
Yasuyo Sawaki 369
Table 1 Universe-score correlations among the LAAS analytic rating scalesa
Rating scale Universe-score correlations
Pronunciation Vocabulary Cohesion Organization Grammar
Pronunciation 1.00Vocabulary 0.91 1.00Cohesion 0.91 0.98 1.00Organization 0.85 0.93 0.94 1.00Grammar 0.90 0.97 0.97 0.92 1.00
aBased on the D study for 2 ratings and 2 tasks.
© 2007 SAGE Publications. All rights reserved. Not for commercial use or unauthorized distribution. at PENNSYLVANIA STATE UNIV on April 12, 2008 http://ltj.sagepub.comDownloaded from

expected substantial correlations among the rating scales, which wasalso suggested by the universe-score correlations among the ratingscales mentioned above. The correlations among the trait factorsindicated by the curved two-headed arrows connecting pairs of thetrait factors were freely estimated.
The reader may notice that this model does not fully represent thesituation of the LAAS where a composite score and ratings on thefive rating scales are reported because a trait factor that representsthe Overall Speaking ability is “missing” from this diagram. A modelthat better corresponds to this situation is the Higher-order TraitFactor Model (or HTF for short) to be discussed in detail later in thissection. The ultimate goal is to demonstrate a satisfactory fit of that
370 Construct validation of analytic rating scales
Figure 1 Initial CFA model (Correlated Trait Factor Model)
© 2007 SAGE Publications. All rights reserved. Not for commercial use or unauthorized distribution. at PENNSYLVANIA STATE UNIV on April 12, 2008 http://ltj.sagepub.comDownloaded from

model; however, the CTF Model was introduced first in this studybecause a satisfactory fit of the CTF model was the prerequisite foran adequate fit of the more restrictive HTF model.
The obtained model fit indices based on the robust estimationfor the CTF Model are shown in Table 2. The Satorra-BentlerScaled chi-square statistic for the CTF Model was statistically sig-nificant (df � 120; χ2 � 203.89; p < .05), but this model showed anexcellent fit to the data. The obtained values of the CFI, NFI andNNFI met the pre-determined criteria of model fit laid out in SectionV, while the RMSEA and the ratio of the Satorra-Bentler Scaledchi-square to the degrees of freedom were slightly worse than thesuggested criteria. Thus, overall, this result supported the distinctand yet correlated nature of the traits as defined by the five ratingscales.
Although the satisfactory fit of the CTF Model partially supportsthe convergent/discriminant validity of the rating scales, a stronger testis needed to falsify alternative explanations for the underlying interre-lationships among the rating scales. For this reason, three alternativeCFA models with varying trait factor structures were developed, whilekeeping the method factor structure constant. The specifications of thethree alternative models, all being more restrictive versions of the CTFModel and nested with the CTF Model, are as follows:
Orthogonal Trait Factor (OTF) Model: This model specified thefive traits representing the rating scales as being uncorrelated with
Yasuyo Sawaki 371
Table 2 Assessment of CFA model fits
Model description Correlated Orthogonal Unitary Trait Higher-Order Trait Factor Trait Factor Factor Trait Factor (CTF) Model (OTF) Model (UTF) Model (HTF) Model
Model df 120 130 130 125Normal theory 232.01 668.08 406.39 237.44
chi-squareSatorra-Bentler 203.89 624.86 371.41 209.14
chi-squareS-B chi-square/df 1.70 4.81 2.86 1.67CFI 0.98 0.89 0.95 0.98NFI 0.96 0.87 0.92 0.96NNFI 0.97 0.84 0.92 0.97AIC �36.11 364.86 111.41 �40.86CAIC �554.87 �197.13 �450.58 �581.24RMSEA 0.06 0.14 0.10 0.06RMSEA CI .04–.07 .13–.15 .08–.11 .04–.07
Mardia’s normalized multivariate kurtosis: 17.62.
© 2007 SAGE Publications. All rights reserved. Not for commercial use or unauthorized distribution. at PENNSYLVANIA STATE UNIV on April 12, 2008 http://ltj.sagepub.comDownloaded from
one another. In order to demonstrate the convergent validity of theLAAS rating scales, the CTF model must fit significantly better thanthis model.
Unitary Trait Factor (UTF) Model: This model specified the fivetraits representing the rating scales as being essentially indistin-guishable from one another. In order to demonstrate the discriminantvalidity of the LAAS rating scales, the CTF model must show sig-nificantly better fit than this model.
Higher-Order Trait Factor (HTF) Model: In this model a higher-order factor structure was imposed on the correlations among thefive trait factors in the CTF Model. This model not only specifies thefive traits as being intercorrelated but also assumes the presence ofan underlying higher-order factor that can account for a commonvariance across the first-order trait factors representing the five rat-ing scales (Rindskopf & Rose, 1988). This trait factor structurereflects the assumption underlying the policy of reporting a singlecomposite score.
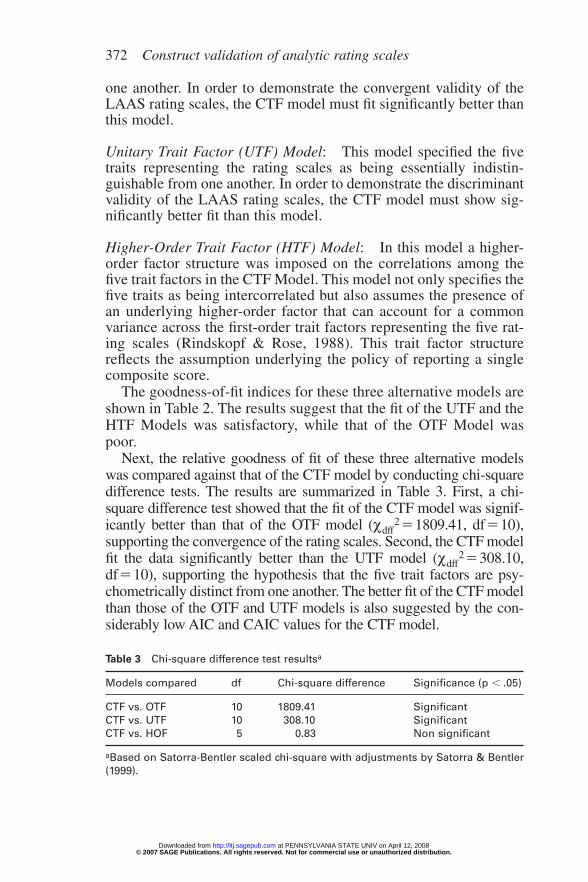
The goodness-of-fit indices for these three alternative models areshown in Table 2. The results suggest that the fit of the UTF and theHTF Models was satisfactory, while that of the OTF Model waspoor.
Next, the relative goodness of fit of these three alternative modelswas compared against that of the CTF model by conducting chi-squaredifference tests. The results are summarized in Table 3. First, a chi-square difference test showed that the fit of the CTF model was signif-icantly better than that of the OTF model (χdff
2�1809.41, df�10),supporting the convergence of the rating scales. Second, the CTF modelfit the data significantly better than the UTF model (χdff
2�308.10,df�10), supporting the hypothesis that the five trait factors are psy-chometrically distinct from one another. The better fit of the CTF modelthan those of the OTF and UTF models is also suggested by the con-siderably low AIC and CAIC values for the CTF model.
372 Construct validation of analytic rating scales
Table 3 Chi-square difference test resultsa
Models compared df Chi-square difference Significance (p � .05)
CTF vs. OTF 10 1809.41 SignificantCTF vs. UTF 10 308.10 SignificantCTF vs. HOF 5 0.83 Non significant
aBased on Satorra-Bentler scaled chi-square with adjustments by Satorra & Bentler(1999).
© 2007 SAGE Publications. All rights reserved. Not for commercial use or unauthorized distribution. at PENNSYLVANIA STATE UNIV on April 12, 2008 http://ltj.sagepub.comDownloaded from

Regarding the comparison of the CTF and the HTF models,although the chi-square difference test suggested that these models fitthe data equally well (χdff
2� .83, df�5), the lower AIC and CAIC val-ues for the HTF model indicated that, when model complexity is takeninto consideration, the HTF model fit better than the CTF model.Moreover, the HTF model was substantively more interpretable thanthe CTF model because the HTF model explicates the relationshipsamong the five rating scales and the overall construct represented bythe Overall speaking Score: Spanish speaking ability. For these rea-sons, the HTF model was selected as the final model (see Figure 2).
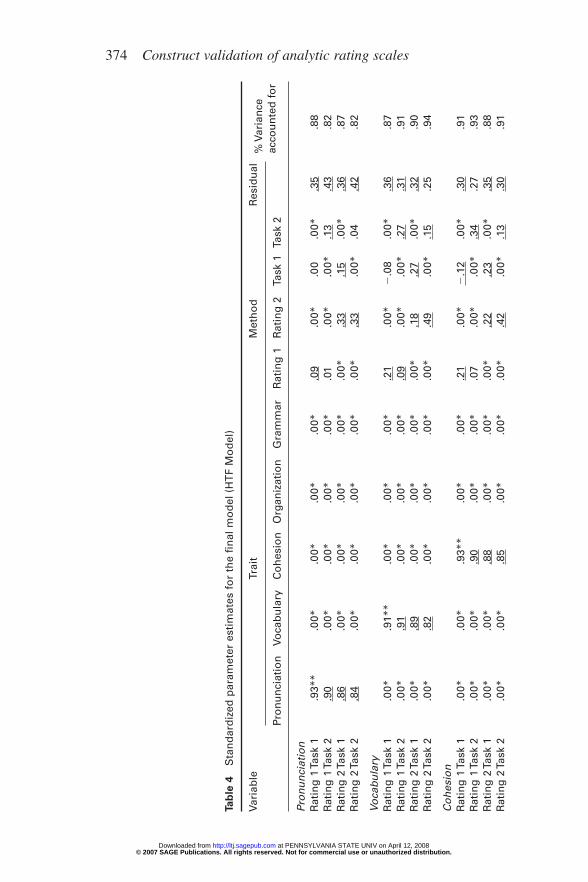
The standardized model parameter estimates for the final model(HTF Model) are presented in Table 4. Because they are adjusted for
Yasuyo Sawaki 373
Figure 2 Final CFA model (Higher-order Trait Factor model)
© 2007 SAGE Publications. All rights reserved. Not for commercial use or unauthorized distribution. at PENNSYLVANIA STATE UNIV on April 12, 2008 http://ltj.sagepub.comDownloaded from
374 Construct validation of analytic rating scales
Tab
le 4
Sta
nd
ard
ized
par
amet
er e
stim
ates
fo
r th
e fi
nal
mo
del
(H
TF
Mo
del
)
Vari
able
Trai
tM
eth
od
Res
idu
al%
Var
ian
ce
Pro
nu
nci
atio
nVo
cab
ula
ryC
oh
esio
nO
rgan
izat
ion
Gra
mm
arR
atin
g 1
Rat
ing
2Ta
sk 1
Task
2ac
cou
nte
d f
or
Pro
nu
nci
atio
nR
atin
g 1
Tas
k 1
.93*
*.0
0*.0
0*.0
0*.0
0*.0
9.0
0*.0
0.0
0*.3
5.8
8R
atin
g 1
Tas
k 2
.90
.00*
.00*
.00*
.00*
.01
.00*
.00*
.13
.43
.82
Rat
ing
2 T
ask
1.8
6.0
0*.0
0*.0
0*.0
0*.0
0*.3
3.1
5.0
0*.3
6.8
7R
atin
g 2
Tas
k 2
.84
.00*
.00*
.00*
.00*
.00*
.33
.00*
.04
.42
.82
Voca
bu
lary
Rat
ing
1 T
ask
1.0
0*.9
1**
.00*
.00*
.00*
.21
.00*
�.0
8.0
0*.3
6.8
7R
atin
g 1
Tas
k 2
.00*
.91
.00*
.00*
.00*
.09
.00*
.00*
.27
.31
.91
Rat
ing
2 T
ask
1.0
0*.8
9.0
0*.0
0*.0
0*.0
0*.1
8.2
7.0
0*.3
2.9
0R
atin
g 2
Tas
k 2
.00*
.82
.00*
.00*
.00*
.00*
.49
.00*
.15
.25
.94
Co
hes
ion
Rat
ing
1 T
ask
1.0
0*.0
0*.9
3**
.00*
.00*
.21
.00*
�.1
2.0
0*.3
0.9
1R
atin
g 1
Tas
k 2
.00*
.00*
.90
.00*
.00*
.07
.00*
.00*
.34
.27
.93
Rat
ing
2 T
ask
1.0
0*.0
0*.8
8.0
0*.0
0*.0
0*.2
2.2
3.0
0*.3
5.8
8R
atin
g 2
Tas
k 2
.00*
.00*
.85
.00*
.00*
.00*
.42
.00*
.13
.30
.91
© 2007 SAGE Publications. All rights reserved. Not for commercial use or unauthorized distribution. at PENNSYLVANIA STATE UNIV on April 12, 2008 http://ltj.sagepub.comDownloaded from

Yasuyo Sawaki 375O
rgan
izat
ion
Rat
ing
1 T
ask
1.0
0*.0
0*.0
0*.8
6**
.00*
.20
.00*
�.0
2.0
0*.4
7.7
8R
atin
g 1
Tas
k 2
.00*
.00*
.00*
.88
.00*
.14
.00*
.00*
.22
.40
.84
Rat
ing
2 T
ask
1.0
0*.0
0*.0
0*.8
4.0
0*.0
0*.1
6.3
1.0
0*.4
2.8
2R
atin
g 2
Tas
k 2
.00*
.00*
.00*
.82
.00*
.00*
.34
.00*
.06
.47
.78
Gra
mm
arR
atin
g 1
Tas
k 1
.00*
.00*
.00*
.00*
.86*
*.4
8.0
0*.1
0.0
0*.1
5.9
8R
atin
g 1
Tas
k 2
.00*
.00*
.00*
.00*
.90
.24
.00*
.00*
.14
.28
.92
Rat
ing
2 T
ask
1.0
0*.0
0*.0
0*.0
0*.9
5.0
0*.1
2.1
6.0
0*.2
4.9
4R
atin
g 2
Tas
k 2
.00*
.00*
.00*
.00*
.95
.00*
.17
.00*
.03
.26
.93
Reg
ress
ion
fro
m h
igh
er-o
rder
to
low
er-o
rder
fac
tors
Sp
eaki
ng
Dis
turb
ance
% V
aria
nce
exp
lain
ed
Pro
nu
nci
atio
n.9
0.4
4.8
1Vo
cab
ula
ry.9
9.1
3.9
8C
oh
esio
n.9
9.1
5.9
8O
rgan
izat
ion
.94
.34
.89
Gra
mm
ar.9
6.3
0.9
1
*Fac
tor
load
ing
fixe
d t
o z
ero
.**
Fact
or
load
ing
fixe
d t
o o
ne
for
scal
e id
enti
fica
tio
n.
Sig
nifi
can
t fa
cto
r lo
adin
gs
are
un
der
sco
red
in t
he
tab
le.
© 2007 SAGE Publications. All rights reserved. Not for commercial use or unauthorized distribution. at PENNSYLVANIA STATE UNIV on April 12, 2008 http://ltj.sagepub.comDownloaded from

376 Construct validation of analytic rating scales
scale differences, the path coefficients are directly comparableamong themselves as indicators of the strengths of relationshipsbetween the factors and the observed variables as well as between thefirst-order factors and the higher-order factor. The path coefficientsof the observed ratings to the corresponding first-order trait factorspresented in the left half of the table were high and significantly dif-ferent from zero, ranging from .82 to .95. Moreover, the path coeffi-cients of the five first-order trait factors on the higher-order speakingfactor presented at the bottom right of Table 4 were extremely high,ranging from .90 to .99. These results indicate strong linear relation-ships between the first-order trait factors and the observed ratings,and between the higher-order factor and the first-order factors,respectively.
In summary, the multicomponential and yet highly correlatednature of the traits being assessed in the LAAS Spanish speaking testwas confirmed by the selection of the Higher-order Trait FactorModel. The final CFA model included a single higher-order factorstrongly associated with the five LAAS rating scales, suggesting thepresence of a substantial common underlying dimension. Moreover,the support for the final model that specified separate factors for theindividual rating scales provided support for the distinctness of thefive rating scales.
2 Research Question 2: How reliable are the LAAS Spanish speak-ing ratings?
a Reliability of the individual rating scales Three pieces of infor-mation from the CFA and the multivariate G theory analysis pro-vided empirical evidence on the reliability of the LAAS Spanishspeaking test for the individual rating scales. The first was the rela-tive magnitudes of the path coefficients for the trait factors asopposed to those for the method factors. As mentioned in the previ-ous section, the path coefficients of the observed variables for thefive first-order trait factors in the HTF model presented in Table 4were generally high, while those for the method factors presented inthe upper right half of Table 4 were low to moderate (�.12 to .49).This suggests that the observed LAAS ratings were strongly associ-ated with the trait factors, whereas their relationships with themethod factors were relatively weak. It is worth noting, however,that there was considerable variation in the magnitudes of the pathcoefficients for the method factors across the 20 LAAS ratings. Thatis, some of the path coefficients for the rating and task factors weresizable and statistically significantly different from zero (e.g., the
© 2007 SAGE Publications. All rights reserved. Not for commercial use or unauthorized distribution. at PENNSYLVANIA STATE UNIV on April 12, 2008 http://ltj.sagepub.comDownloaded from

rating path coefficient of .49 and the task path coefficient of .15 forRating 2 for Task 2 on Vocabulary), while others were not (e.g., therating path coefficient of .01 and the task path coefficient of .13 forRating 1 for Task 2 on Pronunciation). This indicates that the indi-vidual LAAS ratings were affected by the method factors to differentdegrees.
Second, the relative contribution of the different sources of scorevariation to the LAAS rating variability was examined by means ofthe D study variance component estimates for the individual analyt-ic rating scales obtained in the G theory analysis. As can be seen inTable 5, variance component estimates for the Persons were by farthe largest across the rating scales, with more than 88% of the pro-portions of the scale variances accounted for by the ability differ-ences among the persons. In contrast, the proportions of varianceaccounted for by the facets of measurement were uniformly verysmall: only those for the Person by Rating and Person by Task inter-actions, ranging from .2% to 7.1%, were of any size. In contrast, allthe others except the residual variance components were virtuallyzero across all the rating scales. The non-zero variance componentestimates for the Person by Rating and Person by Task interactionsshow that there were differences in the rank-orderings of the candidates
Yasuyo Sawaki 377
Table 5 Estimated variance components and proportion of variance accounted forby facets of measurementa
Source of Estimated variance componentvariation
Pronunciation Vocabulary Cohesion Organization Grammar
Person (p) 0.42 0.48 0.52 0.41 1.7988.0% 91.6% 91.5% 88.7% 93.2%
Rating (R) 0.00 0.00b 0.00 0.00 0.000.1% 0.0% 0.0% 0.0% 0.0%
Task (T) 0.00 0.00 0.00 0.00 0.000.1% 0.2% 0.3% 0.3% 0.2%
p � R 0.03 0.02 0.02 0.02 0.087.1% 3.1% 3.4% 4.0% 4.0%
p � T 0.01 0.00 0.00 0.00 0.011.1% 0.5% 0.8% 0.2% 0.5%
R � T 0.00b 0.00b 0.00 0.00b 0.00b
0.0% 0.0% 0.0% 0.0% 0.0%pRT,e 0.02 0.02 0.02 0.03 0.04
3.4% 4.7% 4.0% 6.7% 2.0%
aBased on the D study for 2 ratings and 2 tasks.bNegative variance component fixed to zero after calculation.
© 2007 SAGE Publications. All rights reserved. Not for commercial use or unauthorized distribution. at PENNSYLVANIA STATE UNIV on April 12, 2008 http://ltj.sagepub.comDownloaded from

across first and second ratings as well as across the tasks. The non-zero residual variance components across the rating scales suggestthe presence of (1) Person by Rating by Task interaction, (2) sourcesof variability due to error that was not captured by the present two-facet crossed D study design, or both.
Finally, two types of summary indices on the reliability of LAASanalytic ratings were obtained, each based on the CFA and the mul-tivariate G theory analysis (see Table 6). The first is the intraclassreliability coefficient (e.g., Bae & Bachman, 1998; Bagozzi, 1991;Werts, Linn & Jöreskog, 1974) obtained from the path coefficientsof the observed ratings for the trait and method factors in the finalCFA model. In general, high path coefficients for a trait factor asopposed to low path coefficients for method factors of observedvariables associated with a given trait factor resulted in a high intra-class reliability estimate for that trait factor. Overall, the intraclassreliability estimates were high, ranging from .83 to .89. Second, theindex of dependability (phi coefficient denoted as Φ; Brennan &Kane, 1977a, b), for the rating scales were obtained in the D studyin the multivariate G theory analysis. As can be seen in Table 6, thefive rating scales were ranked similarly by the two methods, whilethe dependability coefficients from the multivariate D study wereconsistently higher than the corresponding intraclass reliabilitycoefficients. In both types of coefficients, however, the estimatesfor the Grammar rating scale were the highest of all, while the esti-mates for the Pronunciation and Organization rating scales werethe lowest.
Taken together, the dependability of the individual LAAS ana-lytic rating scales was supported by the three pieces of evidence:(1) the relatively high path coefficients for the trait factors vs. therelatively low path coefficients for the method factors of theobserved ratings in the CFA analysis; (2) the large proportions ofvariances of the individual rating scales accounted for by thePerson effect in the multivariate G theory analysis; and (3) the gen-erally high intraclass reliability indices as well as the phi coeffi-cients for the rating scales.
378 Construct validation of analytic rating scales
Table 6 CFA intraclass reliability and multivariate G theory dependability estimates
Pronunciation Vocabulary Cohesion Organization Grammar
Intraclass rel. 0.85 0.86 0.87 0.83 0.89Phia 0.88 0.92 0.92 0.89 0.93
aBased on the D study for 2 ratings and 2 tasks.
© 2007 SAGE Publications. All rights reserved. Not for commercial use or unauthorized distribution. at PENNSYLVANIA STATE UNIV on April 12, 2008 http://ltj.sagepub.comDownloaded from

b Reliability of the composite score The composite score analy-sis based on the D study in the multivariate G theory analysisyielded the index of dependability (phi coefficient, Φ, for theLAAS Overall Speaking score) as well. The phi-coefficient for thecomposite score discussed here is an extension of the index ofdependability, which was applied to individual rating scales inaddressing Research Question 3, to the analysis of the compositescore, as described by Brennan (2001). It is a function of (1) thecomposite universe-score and absolute-error variances obtainedfrom the universe-score and absolute-error variance-covariancecomponents for the five rating scales and (2) the nominal weightsgiven to the rating scales (0.2 for all in this case). The obtainedcomposite universe-score and absolute-error variances with theequal nominal weights were .62 and .04, respectively. The phicoefficient for the composite, which is the ratio of the compositeuniverse-score variance to the sum of itself and the compositeabsolute-error variance was high (Φ�.95, i.e., .62/(.62�.04) �.95).This suggests that as much as 95% of the variance in the compos-ite was accounted for by the universe score variance, or the scorevariance due to the true differences among examinees in terms oftheir language ability.
3 Research question 3: How dependable are the placement deci-sions made based on the LAAS Spanish speaking test?
This research question was addressed by examining estimates ofphi-lambdas (Φλ) for the individual rating scales obtained in the Dstudy within the multivariate G theory analysis. A phi-lambda is anagreement index for the dependability of decisions made at a pre-determined cut score (Brennan & Kane, 1977a, b). The cut scoresrecommended by the test developers for the placement decision-making and the phi-lambda for each rating scale are presented inTable 7. As can be seen in the table, the phi-lambdas for the individualrating scales (.89 to .94) were generally high, suggesting the highdependability of decisions made at the cut scores on the ratingscales. Although still satisfactory, the relatively lower phi-lambda’s
Yasuyo Sawaki 379
Table 7 Dependability of decisions at predetermined cut scoresa
Pronunciation Vocabulary Cohesion Organization Grammar
Cut score 3 3 3 3 4Phi-lambda 0.89 0.92 0.91 0.89 0.94
aBased on the D study for 2 ratings and 2 tasks.
© 2007 SAGE Publications. All rights reserved. Not for commercial use or unauthorized distribution. at PENNSYLVANIA STATE UNIV on April 12, 2008 http://ltj.sagepub.comDownloaded from

for the Pronunciation and Organization rating scales correspond tothe relatively lower dependability of the rating scales associatedwith the large variance component estimate for Person by Ratinginteraction on the Pronunciation rating scale and the large variancecomponent estimate for residuals on the Organization rating scale,respectively.
4 Research Question 4: Do the empirical contributions of each ofthe LAAS rating scales to the composite score variance differ?
Effective weights of the individual rating scales were obtained sep-arately for the composite universe-score and absolute-error vari-ances as part of the D study in the multivariate G theory analysis.The effective weight of a given rating scale for the composite true-score (or absolute-error) variance is determined by (1) the nominalweight for the rating scale, (2) universe-score (or absolute-error)variance of the rating scale, and (3) the universe-score (or absolute-error) covariances of the rating scale with the others (Brennan,2001). Table 8 shows the effective weights of the five rating scalesfor the universe score variance and the absolute error variance. Theresults showed that the Grammar rating scale accounted for as muchas 33.63% of the composite universe-score variance, while the otherfour explained only 15.37% (Pronunciation) to 18.13% (Cohesion).The contribution of the Grammar rating scale to the compositeabsolute-error variance (29.20%) was the largest as well, whilethose of the others ranged from 16.91% (Pronunciation) to 18.40%(Organization). These results suggest that the Grammar rating scalecontributed relatively more information to both the compositeuniverse-score and absolute-error variances compared to the otherrating scales.
380 Construct validation of analytic rating scales
Table 8 Composite score analysis resultsa
Contributions to: Variance and covariance components
Pronunciation Vocabulary Cohesion Organization Grammar
a priori weights 0.20 0.20 0.20 0.20 0.20Effective weightscontributing to:
Universe score 15.37 17.37 18.13 15.49 33.63variance (%)
Absolute error 16.91 17.58 17.90 18.40 29.20variance (%)
aBased on the D study for 2 ratings and 2 tasks.
© 2007 SAGE Publications. All rights reserved. Not for commercial use or unauthorized distribution. at PENNSYLVANIA STATE UNIV on April 12, 2008 http://ltj.sagepub.comDownloaded from

VII Discussion and conclusions
The results of the CFA and the multivariate G theory analyses in thisstudy answered all the four research questions affirmatively. A fewpoints are worthy of more discussion.
First, the present study provided some empirical support for the viewthat the highly correlated and yet multicomponential nature of languageability is tenable not only for language abilities across differentmodalities, as found in previous factor analytic studies (e.g., Bachman,Davidson, Ryan & Choi, 1995; Bachman & Palmer, 1981, 1982; Bae& Bachman, 1998; Kunnan, 1995; Llosa, 2005; Shin, 2005), but alsofor language measures (analytic rating scales) within a single modality.One explanation for the extremely high intercorrelations among theLAAS analytic rating scales indicated in the multivariate G theoryanalysis is the overlap of the constructs across the analytic rating scalesas shown in the scoring rubrics given to the raters (See Appendix A).For instance, the universe score correlation between the Vocabulary andCohesion ratings (.98) was the highest of all. On the one hand, the cri-teria suggested to the raters for assigning Cohesion ratings were coor-dination, subordination, reference and topicalization, all of which arerealized by appropriate use of words in appropriate contexts. On theother hand, the rating guide for vocabulary draws the attention of ratersto three points: use of false cognates, code switching and sophisticationof lexical choice. Thus, a candidate who demonstrated sophisticationof lexical choice in marking cohesion and coherence, for example,might have received high ratings on both cohesion and vocabulary.
In addition, given that the raters were allowed to assign ratings for allfive rating scales at the same time in the LAAS rating process, we can-not rule out the possibility that the correlations among the scales werefurther inflated due to a halo effect. That is, the raters might have haddifficulty in differentiating among the abilities assessed by the ratingscales and thus awarded similar scores across them. Further revisionsof the subscales and/or a change in the rating design (e.g., allowingraters to provide only one rating at a time) might change the patterns ofinterrelationships among the subscales at least to some extent, provid-ed such a halo effect is in fact present in the LAAS ratings.
The complementary use of CFA in the present study allowed us tonot only confirm the convergent validity of the LAAS rating scalessuggested in the multivariate G theory analysis above, but also go astep further to examine the discriminant validity of the scales by thesequential testing of competing models that offered alternative expla-nations about the interrelationships among the scales. The adoption of
Yasuyo Sawaki 381
© 2007 SAGE Publications. All rights reserved. Not for commercial use or unauthorized distribution. at PENNSYLVANIA STATE UNIV on April 12, 2008 http://ltj.sagepub.comDownloaded from
the Higher-order Trait Factor model as the final model providedempirical support for the psychometric distinctness of the constructsassessed by the LAAS rating scales, despite the high correlationsamong themselves.
Second, the notable contribution of multivariate G theory was toexamine the relative weighting of analytic rating scales through com-posite score analysis. As mentioned above, one unique feature of theLAAS Spanish speaking assessment is the use of more score pointsfor the Grammar rating scale than those for the others. Because theuse of a longer Grammar rating scale may lead to a larger empiricalweight given to the scale, this decision may appear controversialwhen one considers the debate surrounding the role of grammar inspeaking performance assessments as exemplified by the criticismsof the ACTFL Oral Proficiency Interview (OPI) for placing undueweight on structural accuracy in the rating criteria (e.g., Bachman &Savignon 1986; Savignon, 1985) and the attempts to de-emphasizestructural accuracy in L2 speaking performance assessment design(McNamara, 1990, 1996). Moreover, in a recent needs analysis sur-vey given to U.S. undergraduate and graduate faculty and students onacademic English ability (Rosenfeld, Leung, & Oltman, 2001),structural accuracy of speaking while performing various academiclanguage use tasks received generally low ratings on its relativeimportance for successful completion of academic courses and theacademic success of nonnative speakers of English.
However, the LAAS rating scale design itself does not tell us thewhole story as to whether Grammar indeed played an overriding rolein the placement decisions. As mentioned above, the EAP staff adopteda non-compensatory placement approach. Because the decision basedon the lowest score point on any rating scale does not allow a highscore on one scale to compensate for a low score on another, this sys-tem itself does not take account of the relative importance of the fivecomponents. The decision to use the non-compensatory approach wasmade based on a criterion-group study with second-year EAP studentsand those who had just completed the program (Bachman, personalcommunication, 2006).
Alternatively, if EAP wants to explore ways for the placementdecisions to better reflect the relative importance of grammar knowl-edge as perceived by the EAP faculty members, a compensatoryapproach based on the Overall Speaking score can be pursued. In thiscase effective weights such as those obtained in the present studywould help EAP monitor the functioning of the analytic rating scales.If the current equal nominal weights for the five components are
382 Construct validation of analytic rating scales
© 2007 SAGE Publications. All rights reserved. Not for commercial use or unauthorized distribution. at PENNSYLVANIA STATE UNIV on April 12, 2008 http://ltj.sagepub.comDownloaded from

maintained, the program staff would know that the Grammar scaleaccounts for about 33% of the true-score variance of the OverallSpeaking score. Moreover, if EAP concludes that the effective weightof 33% for Grammar is too high or too low, new nominal weights thatallow them to obtain the desired effective weights of the five compo-nents could be calculated by using a weight re-adjustment proceduresuch as Bachman’s (2005).
The combined use of CFA and multivariate G theory in this studyallowed a focused investigation of some critical issues associated withthe construct validity of L2 speaking performance assessmentsinvolving analytic rating scales—score dependability, convergent/dis-criminant validity of analytic rating scales, and the empirical rela-tionship of analytic rating scales to a composite. While the LAASSpanish speaking test was in use in the EAP program in the early1990s and was discontinued afterwards, the use of analytic ratingscales for student placement and diagnosis in order to better linkassessment to instruction is well aligned with the current growinginterest in diagnostic language assessments (Alderson, 2005a, b;Alderson & Huhta, 2005). Accordingly, many validation issues sur-rounding the LAAS are applicable to various current and future L2performance assessments, and thus this line of investigation should bean integral part of the development as well as construct validation ofL2 speaking performance assessments.
Acknowledgements
An earlier version of this paper was presented at the 24th AnnualLanguage Testing Research Colloquium held in Hong Kong inDecember 2002. This study was completed while the author was adoctoral student at the University of California, Los Angeles. Specialthanks are due to Lyle F. Bachman, Noreen Webb and George A.Marcoulides for their guidance throughout the completion of thisstudy. In addition, the author thanks the three anonymous reviewers,as well as Lorena Llosa and Emily Midouhas, for their comments onearlier versions of the paper.
VIII References
Alderson, J.C. 2005a: The challenge of (diagnostic) testing: Do we know whatwe are measuring? Plenary paper presented at the 27th Annual LanguageTesting Research Colloquium. Ottawa, Canada, 20–22 July.
Yasuyo Sawaki 383
© 2007 SAGE Publications. All rights reserved. Not for commercial use or unauthorized distribution. at PENNSYLVANIA STATE UNIV on April 12, 2008 http://ltj.sagepub.comDownloaded from

—— 2005b: Diagnosing foreign language proficiency: The interface betweenlearning and assessment. London: Continuum.
Alderson, J.C. and Huhta, A. 2005: The development of a suite of computer-based diagnostic tests based on the Common European Framework.Language Testing 22, 301–20.
Bachman, L.F. 2005: Statistical analyses for language assessment. Cambridge:Cambridge University Press.
Bachman, L.F., Davidson, F., Ryan, K. and Choi, I.-C. 1995: An investiga-tion into the comparability of two tests of English as a foreign language:The Cambridge-TOEFL comparability study. Cambridge: CambridgeUniversity Press.
Bachman, L., Lynch, B. and Mason, M. 1995: Investigating variability intasks and rater judgments in a performance test of foreign languagespeaking. Language Testing 12, 238–57.
Bachman, L., Lynch, B., Mason, M. and Egbert, M. 1992: EAP LanguageAbility Assessment System: Interim report. Los Angeles: University ofCalifornia, Los Angeles, Department of TESL and Applied Linguistics.
Bachman, L.-F. and Palmer, A. 1981: The construct validation of the FSI oralinterview. Language Learning 31, 67–86.
—— 1982: The construct validation of some components of communicativeproficiency. TESOL Quarterly 16, 449–65.
Bachman, L.F. and Savignon, S.J. 1986: The evaluation of communicativelanguage proficiency: A critique of the ACTFL Oral Interview. TheModern Language Journal 70, 380–97.
Bae, J. and Bachman, L.F. 1998: A latent variable approach to listening andreading: Testing factorial invariance across two groups of children inthe Korean/English two-way immersion program. Language Testing 15,380–414.
Bagozzi, R.-P. 1991: Further thoughts on the validity of measures of elation, glad-ness and joy. Journal of Personality and Social Psychology 61, 98–104.
Bentler, P.-M. 1985–2002: EQS for Windows 6.0 Beta Build 94 Version.[Computer software]. Encino, CA: Multivariate Software, Inc.
Brennan, R.L. 1999: mGENOVA, Version 2.0. [Computer software].—— 2001: Generalizability theory. New York: Springer-Verlag.Brennan, R.L. and Kane, M.T. 1977a: An index of dependability for mastery
tests. Journal of Educational Measurement 14, 277–89.—— 1977b: Signal/noise ratios for domain-referenced tests. Psychometrika
42, 609–25.Brown, A. 1995: The effect of rater variables in the development of an
occupation-specific language performance test. Language Testing 12, 1–15.Brown, J.-D. and Bailey, K.M. 1984: A categorical instrument for scoring sec-
ond language writing skills. Language Learning 34, 21–42.Campbell, D.T. and Fiske, D.W. 1959: Convergent and discriminant valida-
tion by the multitrait-multimethod matrix. Psychological Bulletin 56,81–105.
Carroll, J.B. 1983: Psychometric theory and language testing. In Oller, J.W.,Jr., editor, Issues in language testing research, Rowley, MA: NewburyHouse, 80–107.
384 Construct validation of analytic rating scales
© 2007 SAGE Publications. All rights reserved. Not for commercial use or unauthorized distribution. at PENNSYLVANIA STATE UNIV on April 12, 2008 http://ltj.sagepub.comDownloaded from
Cronbach, L.J., Gleser, G.C., Nanda, H. and Rajaratnam, N. 1972: Thedependability of behavioral measurements: Theory of generalizability forscores and profiles. New York: Wiley.
Elder, C. 1993: How do subject specialists construe classroom language profi-ciency? Language Testing10, 235–54.
Hu, L. and Bentler, P.M. 1995: Evaluating model fit. In Hoyle, R.H., editor,Structural equation modeling: Concepts, issues, and applications.Thousand Oaks, CA: Sage Publications, 76–99.
Jacobs, H.L., Zinkgraf, S.A., Wormuth, D.R., Hartfiel, V.F. and Hughey,J.B. 1981: Testing ESL composition: A practical approach. Rowley, MA:Newbury House.
Jarjoura, D. and Brennan, R. 1982: A variance components model for mea-surement procedures associated with tables of specifications. AppliedPsychological Measurement 6, 161–71.
—— 1983: Multivariate generalizability models for tests developed from tables ofspecification. In Fyans, L.J., Jr., editor, Generalizability theory: Inferencesand practical applications, San Francisco, CA: Jossey-Bass, 83–101.
Jöreskog, K.G. 1974: Analyzing psychological data by structural analysis ofcovariance matrices. In Atkinson, R.C., Krantz, D.H., Luce, R.D. andSuppes, P., editors, Contemporary developments in mathematical psychol-ogy: Measurement, psycho-physics, and neural information processing(Vol. 2), San Francisco: Freeman, 1–56.
Kane, M. and Case, S.M. 2004: The reliability and validity of weighted com-posite scores. Applied Measurement in Education 17, 221–40.
Kline, R.B. 1998: Principles and practice of structural equation modeling.New York: Guilford Press.
Kondo-Brown, K. 2002: A FACETS analysis of rater bias in measuring Japa-nese second language writing performance. Language Testing 19, 3–31.
Kunnan, A.J. 1995: Test taker characteristics and test performance: A struc-tural modeling approach. Cambridge: Cambridge University Press.
Lee, Y.-W. 2005: Dependability of scores for a new ESL speaking test:Evaluating prototype tasks. (TOEFL Monograph Series, MS-28).Princeton, NJ: Educational Testing Service.
Lee. Y.-W. and Kantor, R. 2005: Dependability of new ESL writing testscores: Evaluating prototype tasks and alternative rating schemes.(TOEFL Monograph Series, MS-31). Princeton, NJ: Educational TestingService.
Li, W. 1990: Multivariate generalizability of hierarchical measurement.Unpublished doctoral dissertation, University of California, Los Angeles.
Linacre, J.M. 1989: Many-facet Rasch measurement. Chicago: MESA Press.Linn, R.L. and Werts, C.E. 1979: Covariance structures and their analysis.
In Traub, R., editor, New directions for testing and measurement:Methodological development (No. 4). San Francisco: Jossey-Bass 53–73.
Llosa, L. 2005: Building and supporting a validity argument for a standards-based classroom assessment of English proficiency. Unpublished PhDdissertation, University of California, Los Angeles.
Lumley, T. and McNamara, T. 1995: Rater characteristics and rater bias:Implications for training. Language Testing 12, 54–71.
Yasuyo Sawaki 385
© 2007 SAGE Publications. All rights reserved. Not for commercial use or unauthorized distribution. at PENNSYLVANIA STATE UNIV on April 12, 2008 http://ltj.sagepub.comDownloaded from

Lynch, B. and McNamara, T. 1998: Using G theory and Many-facet Raschmeasurement in the development of performance assessments of the ESLspeaking skills of immigrants. Language Testing 15, 158–80.
Marcoulides, G.A.1994: Selecting weighting schemes in multivariate general-izability studies. Educational and Psychological Measurement 54, 3–7.
—— 1996: Estimating variance components in generalizability theory: The covari-ance structure analysis approach. Structural Equation Modeling 3, 290–99.
—— 2000: Advances and new developments in G-theory: Applications ofstructural equation modeling. Workshop presented at the 22nd LanguageTesting Research Colloquium, Vancouver, Canada, March 8–11.
Marsh, H.W. 1988: Multitrait-multimethod analysis. In Keeves, J.P., editor,Educational research methodology, measurement, and evaluation: Aninternational handbook, Oxford: Pergamon, 570–80.
—— 1989: Confirmatory factor analysis of multitrait-multimethod data: Manyproblems and a few solutions. Applied Psychological Measurement 13,335–61.
Marsh, H.W. and Grayson, D. 1995: Latent variable models of multitrait-multimethod data. In Hoyle, R.H., editor, Structural equation modeling:Concepts, issues and applications, Thousand Oaks, CA: Sage, 177–98.
McNamara, T. 1990: Item response theory and the validation of an ESP testfor health professionals. Language Testing 7, 52–75.
—— 1996: Measuring second language proficiency. London: Longman.Petersen, N.S., Kolen, M.J. and Hoover, H.D. 1989: Scaling, norming, and
equating. In Linn, R.L., editor, Educational Measurement, third edition.New York: American Council on Education and Macmillan, 221–62.
Pollitt, A. and Hutchinson, C. 1987: Calibrating graded assessments: Rasch par-tial credit analysis of performance in writing. Language Testing 4, 72–92.
Raykov, T. and Marcoulides, G.A. 2006: Estimation of generalizability coeffi-cients via a structural equation modeling approach to scale reliability eval-uation. International Journal of Testing 6(1), 81–95.
Rindskopf, D. and Rose, T. 1988: Some theory and applications of confirmatorysecond-order factor analysis. Multivariate Behavioral Research 23, 51–67.
Rosenfeld, M., Leung, S. and Oltman, P.K. 2001: The reading, writing, speak-ing, and listening tasks important for academic success at the undergrad-uate and graduate levels. (TOEFL Monograph Series, MS-21). Princeton,NJ: Educational Testing Service.
Satorra, A. 1990: Robustness issues in structural equation modeling: A reviewof recent developments. Quality & Quantity 24, 367–86.
Satorra, A. and Bentler, P. 1999:. A scaled difference chi-square test statisticfor moment structure analysis. UCLA Statistics Series, No. 260,University of California, Los Angeles.
Savignon, S.J. 1985: Evaluation of communicative competence: The ACTFLProvisional Proficiency Guidelines. The Modern Language Journal 69,129–42.
Sawaki, Y. 2003: A comparison of summarization and free recall as readingcomprehension tasks in web-based assessment of Japanese as a foreignlanguage. Unpublished doctoral dissertation, University of California,Los Angeles.
386 Construct validation of analytic rating scales
© 2007 SAGE Publications. All rights reserved. Not for commercial use or unauthorized distribution. at PENNSYLVANIA STATE UNIV on April 12, 2008 http://ltj.sagepub.comDownloaded from

—— 2005: The generalizability of summarization and free recall ratings in L2reading assessment. JLTA Journal 7, 21–44.
Schoonen, R. 2005: Generalizability of writing scores: an application of struc-tural equation modeling. Language Testing 22, 1–30.
Shavelson, R.-J. and Webb, N.-M. 1991: Generalizability theory: A primer.Newbury Park, CA: Sage Publications.
Shin, S.-K. 2005: Did we take the same test? Examinee language proficiencyand the structure of language tests. Language Testing 22, 31–57.
Wang, M.W. and Stanley, J.C. 1970: Differential weighting: A review ofmethods and empirical studies. Review of Educational Research 4,663–705.
Webb, N.-M., Shavelson, R.-J. and Maddahian, E. 1983: Multivariate gener-alizability theory. In Fyans, L.J., Jr., editor, Generalizability theory:Inferences and practical applications, San Francisco, CA: Jossey-Bass,67–81.
Weigle, S.-C. 1998: Using FACETS to model rater training effects. LanguageTesting 15, 263–87.
Werts, C.E., Linn, R.L. and Jöreskog, K.G. 1974: Intraclass reliability esti-mates: Testing structural assumptions. Educational and PsychologicalMeasurement, 34, 25–33.
Widaman, K.F. 1985: Hierarchically nested covariance structure models for multitrait-multimethod data. Applied Psychological Measurement 9,1–26.
Wigglesworth, G. 1993: Exploring bias analysis as a tool for improving raterconsistency in assessing oral interaction. Language Testing 10, 305–335.
Wright, B.D. and Masters, G.N. 1982: Rating scale analysis. Chicago: MESAPress.
Xi, X. 2003: Investigating language performance on the graph description taskin a semi-direct oral test. Unpublished doctoral dissertation, Universityof California, Los Angeles.
Appendix A: LAAS Spanish speaking test: Ratings of languageability in speaking
Pronunciation
The pronunciation rating should reflect the subject’s accuracy of into-nation, stress, and segmental sounds and appropriateness of pace.
1. NO EVIDENCE: Pronunciation problems make speech virtuallyincomprehensible, or the subject speaks too little to judge.
2. POOR: Pronunciation problems are numerous and interfere withcomprehension.
3. MODERATE: Pronunciation problems sometimes interfere withcommunication.
Yasuyo Sawaki 387
© 2007 SAGE Publications. All rights reserved. Not for commercial use or unauthorized distribution. at PENNSYLVANIA STATE UNIV on April 12, 2008 http://ltj.sagepub.comDownloaded from

4. GOOD: Pronunciation may mark the subject as a non-nativespeaker, but does not interfere with communication.
Vocabulary
The vocabulary rating should reflect the subject’s range and accuracyof vocabulary used. Consideration should be given to the following:
Use of false cognatesCode switching (where not appropriate)Sophistication of lexical choice
[N.B. These specific elements may vary from language to language.]
1. NO EVIDENCE: Extremely limited vocabulary. Range: Vocabularylimited to a few words and set phrases; Communication: not pos-sible for subject to discuss topic due to limited vocabulary.
2. POOR: Small vocabulary. Range: Limited range of lexicon, evi-denced by frequent repetition of Spanish words; Accuracy:inaccurate usage of Spanish words and/or frequent use of falsecognates; Communication: difficult for subject to discuss topicbecause of vocabulary limitations.
3. MODERATE: Vocabulary of moderate size. Range: Some vari-ety of word choice; Accuracy: Some Spanish words may beinaccurately used; occasionally relies on false cognates and/orEnglish words; Communication: frequently misses or searchersfor Spanish words.
4. GOOD: Large vocabulary: Range: Uses a variety of lexical choic-es, demonstrating a wide range; Accuracy: choice almost alwaysappropriate; Communication: seldom misses or searches for words.
Cohesion
The cohesion rating will be made in terms of 1) inclusion of appropri-ate means for marking relationships among utterances and ideas and2) variety of appropriate means used. Means for marking relationshipsamong utterances include, but are not limited to, the following:
Coordination (e.g., English: and, but, also; Spanish: pero, y, o, que)Subordination (e.g., English: although, while, since; Spanish: cuan-do, donde, aunque, si, que)
Reference (e.g., English: these, this, those, such; Spanish: este, ese, aquel)Topicalization of information (passive, pseudo-cleft, etc.)
388 Construct validation of analytic rating scales
© 2007 SAGE Publications. All rights reserved. Not for commercial use or unauthorized distribution. at PENNSYLVANIA STATE UNIV on April 12, 2008 http://ltj.sagepub.comDownloaded from

[N.B. These specific elements may vary from language to language.]
Cohesion scale levels
1. NO EVIDENCE: Utterances completely disjoined, or the dis-course is too short to judge.
2. POOR: Connections between utterances not adequately marked;frequent confusing relationships among ideas.
3. MODERATE: Connections among utterances sometimes adequately marked; sometimes confusing relationships amongideas.
4. GOOD: Uses a variety of appropriate means for connectingutterances; hardly ever confusing relationship among ideas.
Organization
The organization rating will be made in terms of the inclusion,distinctness and appropriateness of sequencing of the followingparts:
A) Identification of topicB) Development of topic
i. Distinguishing of main pointsii. Appropriate sequencing of main pointsiii. Supporting details
C) Conclusion/closure
Organization scale levels
1. NO EVIDENCE of conscious attempt to organize presentation,or discourse too short to judge
2. POOR: Parts poorly developed; main points not clearly distin-guished and not appropriately sequenced.
3. MODERATE: Some parts appropriately developed; main pointssometimes clearly distinguished sometimes and appropriatelysequenced.
4. GOOD: Parts appropriately developed; main points clearly dis-tinguished and appropriately sequenced.
Grammar
The grammar rating should reflect both the morphological and syn-tactic structures used by the subject. The levels of grammatical com-petence are defined in terms of two aspects:
Yasuyo Sawaki 389
© 2007 SAGE Publications. All rights reserved. Not for commercial use or unauthorized distribution. at PENNSYLVANIA STATE UNIV on April 12, 2008 http://ltj.sagepub.comDownloaded from

Appendix B: D study universe-score and absolute-errorvariance-covariance component estimatesa
1) RANGE of morphologic and syntactic structures and2) ACCURACY or degree of control of morphological and syntac-
tic structures.
Grammar scale levels
390 Construct validation of analytic rating scales
RANGE ACCURACY
1 No systematic AND Control of few or no structures;evidence errors of all or most possible are frequent.
2 Limited range, but with AND Control of few or no structures;systematic evidence errors of all or most possible are frequent.
3 Limited range, but with AND Control of some structure used;systematic evidence with many error types.
4 Large, but not AND Control of some structure used; complete range but with many error types.
5 Large, but not AND Control of most structure used, with few complete range error types.
6 Complete range AND Control of most structure used, with fewerror types.
7 Complete range AND No systematic errors, just lapses.
NB: If you feel the candidate’s grammatical range and accuracy are split across lev-els more than accommodated in the above ratings, give an “s” rating, and indicatethe split. For example, if the candidate is a “2” in range and “4” in accuracy, youwould give a rating of “3s” and indicate that the split is “2/4”.
Source of Variance and covariance componentsvariation
Universe score Pronunciation Vocabulary Cohesion Organization GrammarPronunciation .416Vocabulary .404 .476Cohesion .421 .487 .519Organization .351 .412 .434 .408Grammar .776 .898 .935 .784 1.791
Absolute error Pronunciation Vocabulary Cohesion Organization GrammarPronunciation .056Vocabulary .024 .044Cohesion .022 .032 .048Organization .019 .023 .025 .051Grammar .024 .029 .028 .041 .130
aBased on the D study for 2 ratings and 2 tasks.
© 2007 SAGE Publications. All rights reserved. Not for commercial use or unauthorized distribution. at PENNSYLVANIA STATE UNIV on April 12, 2008 http://ltj.sagepub.comDownloaded from