LANGUAGE PROFICIENCY AND LABOUR MARKET …uctpb21/Cpapers/languageproficiency.pdf · Christian...
23
LANGUAGE PROFICIENCY AND LABOUR MARKET PERFORMANCE OF IMMIGRANTS IN THE UK* Christian Dustmann and Francesca Fabbri This paper uses two recent UK surveys to investigate the determinants of language proficiency and the effect of language on earnings and employment probabilities of non-white immigrants. We address the problem of endogenous choice of language acquisition and measurement error in language variables. Our results show that language acquisition, employment probabilities, as well as earnings differ widely across non-white immigrants, according to their ethnic origin. Language proficiency has a positive effect on employment probabilities, and lack of English fluency leads to earning losses. According to the 2000 Labour Force Survey, immigrants (defined as individuals who are born outside UK) account for around 9% of the working age population of Britain. Immigrants are heavily concentrated in Metropolitan areas. In 2000, London contained around 9% of the total population of the UK, but more than 40% of all immigrants. The ethnic origin of immigrants in the UK is diverse, with the largest group being born elsewhere in the European Union, followed by immigrants from India, the Old Commonwealth, Pakistan, and Africa; see Dust- mann et al. (2002) for more details. A number of recent studies analyse various aspects of labour market behavoiur of ethnic minorities, and compare outcomes with those of the majority population; see Blackaby et al. (1994, 1997) and Clark and Drinkwater (2000). In much of this literature, however, no attempt is made to distinguish between immigrant and British born minorities. But many important questions are specifically related to first generation immigrants, who constitute a significant fraction of minorities in the UK. The 2000 Labour Force Survey shows that about 66% of ethnic minorities of working age were born abroad (Dustmann et al., 2002). There are few papers that investigate the economic assimilation of immigrants. The earliest study is Chiswick (1980), who uses data from the 1972 General Household Survey (GHS). His main finding is that, while white immigrants have very similar earnings patterns to native-born individuals, earnings of immigrants from ethnic minority groups are about 25% lower, other things the same. This gap is not decreasing with time of residence in the UK. In a more recent paper, Bell (1997) uses also data from the GHS, but he pools waves between 1973 to 1992. Like Chiswick, he finds that white immigrants are doing well. While white immigrants have an initial wage advantage, compared to native workers, immigrants from the West Indies and India have an earnings disadvantage, but wage differentials be- tween this group and white natives decrease with the time spent in the UK. Shields * We are grateful to Barry Chiswick, Hide Ichimura, Costas Meghir, Ian Preston, and Arthur van Soest for comments on earlier drafts of this paper, and to Barbara Sianesi for making her programme for propensity score matching available to us. We would like to thank David De Meza and three referees for comments that helped to improve the paper. The dataset used for this paper is not available to the public. If you need more information please contact the authors. The Economic Journal, 113 (July), 695–717. Ó Royal Economic Society 2003. Published by Blackwell Publishing, 9600 Garsington Road, Oxford OX4 2DQ, UK and 350 Main Street, Malden, MA 02148, USA. [ 695 ]
Transcript of LANGUAGE PROFICIENCY AND LABOUR MARKET …uctpb21/Cpapers/languageproficiency.pdf · Christian...

LANGUAGE PROFICIENCY AND LABOUR MARKETPERFORMANCE OF IMMIGRANTS IN THE UK*
Christian Dustmann and Francesca Fabbri
This paper uses two recent UK surveys to investigate the determinants of language proficiencyand the effect of language on earnings and employment probabilities of non-white immigrants.We address the problem of endogenous choice of language acquisition and measurement errorin language variables. Our results show that language acquisition, employment probabilities, aswell as earnings differ widely across non-white immigrants, according to their ethnic origin.Language proficiency has a positive effect on employment probabilities, and lack of Englishfluency leads to earning losses.
According to the 2000 Labour Force Survey, immigrants (defined as individualswho are born outside UK) account for around 9% of the working age populationof Britain. Immigrants are heavily concentrated in Metropolitan areas. In 2000,London contained around 9% of the total population of the UK, but more than40% of all immigrants. The ethnic origin of immigrants in the UK is diverse, withthe largest group being born elsewhere in the European Union, followed byimmigrants from India, the Old Commonwealth, Pakistan, and Africa; see Dust-mann et al. (2002) for more details.
A number of recent studies analyse various aspects of labour market behavoiurof ethnic minorities, and compare outcomes with those of the majority population;see Blackaby et al. (1994, 1997) and Clark and Drinkwater (2000). In much of thisliterature, however, no attempt is made to distinguish between immigrant andBritish born minorities. But many important questions are specifically related tofirst generation immigrants, who constitute a significant fraction of minorities inthe UK. The 2000 Labour Force Survey shows that about 66% of ethnic minoritiesof working age were born abroad (Dustmann et al., 2002).
There are few papers that investigate the economic assimilation of immigrants.The earliest study is Chiswick (1980), who uses data from the 1972 GeneralHousehold Survey (GHS). His main finding is that, while white immigrants havevery similar earnings patterns to native-born individuals, earnings of immigrantsfrom ethnic minority groups are about 25% lower, other things the same. This gapis not decreasing with time of residence in the UK. In a more recent paper, Bell(1997) uses also data from the GHS, but he pools waves between 1973 to 1992. LikeChiswick, he finds that white immigrants are doing well. While white immigrantshave an initial wage advantage, compared to native workers, immigrants from theWest Indies and India have an earnings disadvantage, but wage differentials be-tween this group and white natives decrease with the time spent in the UK. Shields
* We are grateful to Barry Chiswick, Hide Ichimura, Costas Meghir, Ian Preston, and Arthur vanSoest for comments on earlier drafts of this paper, and to Barbara Sianesi for making her programmefor propensity score matching available to us. We would like to thank David De Meza and three refereesfor comments that helped to improve the paper. The dataset used for this paper is not available to thepublic. If you need more information please contact the authors.
The Economic Journal, 113 (July), 695–717. � Royal Economic Society 2003. Published by BlackwellPublishing, 9600 Garsington Road, Oxford OX4 2DQ, UK and 350 Main Street, Malden, MA 02148, USA.
[ 695 ]

and Wheatley Price (1998) use data from the British Labour Force Survey. Theyemphasise the different assimilation patterns between foreign and native bornminority individuals.
It may be in the interest of the host country to support the process of economicassimilation. To achieve this, it is important to understand the factors that deter-mine the economic performance of minority immigrants. In this paper, we con-centrate on one specific human capital factor, which is important not only forimmigrants’ economic assimilation, but also for their social integration: Profi-ciency in the host country language. Recent analyses for the US, Canada, Australia,Israel, and Germany show that fluency and literacy in the dominant host countrylanguage are important components for explaining immigrants’ labour marketsuccess; see, Rivera-Batiz (1990), Chiswick (1991), Dustmann (1994), Chiswick andMiller (1995), Chiswick et al. (1997), and Berman et al. (2000). Work by Shieldsand Wheatley Price (2001) indicates that language is also positively related tooccupational success of some immigrant groups in the UK.
We analyse the determinants of fluency and literacy in the host language forimmigrants belonging to ethnic minority groups, and on how it relates to theirlabour market performance. We first investigate factors influencing the acquisitionof the host country’s language by the immigrant, such as education, age and yearsof residence in the host country. We distinguish between education received in thehost and in the home countries.
We then analyse the extent to which language ability influences the labourmarket outcomes of immigrants. We focus on its effect on employment proba-bilities, and on the level of earnings. Estimates of language coefficients in straightforward regressions are bedeviled by two problems. First, as pointed out by Borjas(1994), the choice to acquire proficiency in a foreign language may be endog-enous. Second, as stressed by Dustmann and van Soest (2001), language measuresusually reported in survey data may suffer substantially from measurement error.The bias induced by these two problems points in opposite directions. We attemptto address both problems in this paper, and propose estimators which may help toreduce, or eliminate the bias. We combine an IV estimator that eliminates the biasdue to measurement error with a matching estimator that addresses the problemof endogenous choice of language acquisition. Our results suggest that measure-ment error leads to a downward bias in the estimates of language on employmentprobabilities and earnings, and that the true effects are larger than OLS estimatesreveal. These results are in line with findings for the other countries (Dustmannand van Soest, 2001).
Our best estimates suggest that fluency in English increases employment prob-abilities by about 22 percent points. This estimate is 5 percentage points higher thanthe OLS estimate. Furthermore, OLS estimates show that proficiency in English isassociated with 18–20% higher earnings. Again, our estimator that takes account ofboth measurement error and endogenous selection indicates that effects are larger,but estimates are not significant, probably due to the small sample sizes.
We base our analysis on data from two UK surveys on ethnic minorities: theFourth National Survey on Ethnic Minorities (FNSEM), which has been collectedbetween 1993 and 1994, and the Family and Working Lives Survey (FWLS), which
696 [ J U L YT H E E C O N O M I C J O U R N A L
� Royal Economic Society 2003

has been collected between 1994 and 1995. Both data sets consist of two sub-samples. The FWLS contains a main sample of the entire UK population and a‘boost’ sample of individuals belonging to the ethnic minorities. The FNSEMcontains a main sample of respondents belonging to ethnic minorities, and areference sample of individuals belonging to the white majority population. Bothsurveys include questions on social and economic conditions of the interviewees,and measures on language proficiency. Information in the two data sets is com-plementary. For instance, while the FNSEM only reports spoken language profi-ciency, the FWLS contains information also about reading and writing skills. TheFNSEM distinguishes between education acquired in home and host economy,information which is not available for the FWLS. Using two datasets allows us toconduct comparable analyses to check the robustness of the results obtained.
The data sources we use for this analysis are to our knowledge the only data setsfor the UK that contain information about immigrants’ language proficiency, aswell as information on employment status and earnings. They are restricted toethnic minority immigrants, and our results do therefore not necessarily generaliseto the overall population of immigrants in the UK. Furthermore, results have to beevaluated subject to our ability to address the endogenous choice of languageacquisition with the information available in the data, and the relatively smallsample sizes, in particular for the earnings analysis. Despite these limitations, ouranalysis provides interesting insight into the relationship between language andeconomic outcomes for a large group of the UK’s immigrant population.
The structure of the paper is as follows. Section 1 develops the estimationequations. Section 2 describes the data sets and gives some descriptive statistics.Section 3 investigates language determinants. Section 4 analyses how languageproficiency affects employment probabilities, and earnings. Section 5 summarisesthe results and concludes.
1. Language and Labour Market Outcomes
The literature on migrants’ earnings assimilation distinguishes between humancapital which is specific to the host country, human capital which is specific to thehome country, and human capital which is equally productive in both countries.Typically, immigrants enter the host country with skills which are only of limiteduse in the host economy, which results in an initial earnings disadvantage (Chis-wick, 1978). After immigration, migrants transfer home country specific humancapital into general or host country specific human capital, and acquire additionalskills which are specific to the host country economy. The intensity of this processdetermines the speed of economic assimilation.
Language capital is an important component of host country human capital. It isalso very specific to the host economy, since it is usually not transferable to themigrant’s home economy. Standard human capital models may serve as a basis forformulating empirical specifications explaining the determinants of languagecapital (Dustmann, 1999). In such models, human capital is produced by investingtime and other inputs. The cost of production equals forgone earnings, plus thecost of other input goods. A simple equilibrium condition states that investment in
2003] 697L A N G U A G E P R O F I C I E N C Y A N D L A B O U R M A R K E T
� Royal Economic Society 2003

human capital production is set such that the marginal cost equals the marginalbenefit from the discounted future enhanced earnings potential. The productionpotential may differ across individuals according to their ability to acquire know-ledge and it may depend on the stock of human capital acquired in the past. Thebenefit of any acquisition of host country specific human capital depends, inaddition, on the length of the period over which it is productively put to use.
Investment in language capital should therefore depend on its potential futurebenefits, on the cost of acquisition, and on the individual’s efficiency in producingit. Chiswick and Miller (1995) provide an extensive discussion on the variableswhich represent these factors. Variables which measure the immigrant’s efficiencyin acquiring language capital are the level of education upon immigration and theage at immigration (since the learning potential may deteriorate over the lifecycle). The cost of acquiring the host country language depends on the distance ofthe migrant’s mother tongue from the dominant majority language, which may becaptured by country of origin dummies. Clearly, this last variable picks up a varietyof other factors which affect language proficiency, like different degrees ofimmigrant selection across countries (Borjas, 1985, 1987). Assuming that allmigrations are permanent, the time period over which language capital is pro-ductive depends on the migrant’s age at entry. Accordingly, those who migrate atyounger age should have a higher incentive to acquire language capital. Itsacquisition may, in addition, depend on the extent to which individuals are ex-posed to the language of the majority population. As noted by Chiswick and Miller(1995), a variable which measures exposure is the time of residence abroad.
1.1. Language, Earnings, and Employment Probabilities
When analysing the effect of language on labour market outcomes, two problemsmay occur. First, the choice of learning the host country language may be endog-enous, and related to variables which affect outcomes. This may lead to an upwardbias of estimated language effects on economic outcomes. Second, unsystematicmeasurement error may lead to a downward bias of the effect of language onearnings. Numbers presented in Dustmann and van Soest (2001) on repeatedlanguage information for the same individual suggest that measurement error issubstantial in self-reported language measures. In fact, in their data, more than halfof the within individual variation in language responses is due to measurementerror. Their results suggest that the downward bias induced by measurement errorovercompensates the upward bias induced by unobserved heterogeneity.
To give a causal interpretation to the language coefficient, we need to deal withboth sources of bias. We first discuss the problem of the endogenous choice oflanguage acquisition. Assume for the moment that the language variable ismeasured without error. Then the problem is that those individuals who havechosen to obtain proficiency in the English language may differ from those indi-viduals who have chosen not to do so. If these differences affect outcomes (in ourcase, employment or earnings) other than through language, a comparison inoutcomes of the two groups does not produce an unbiased estimate of the causaleffect of language proficiency.
698 [ J U L YT H E E C O N O M I C J O U R N A L
� Royal Economic Society 2003

We define the parameter we would like to obtain as the difference in outcomesfor an individual of being proficient and non-proficient, after having made thechoice of acquiring language proficiency.1 Denoting these two potential outcomesby y1
i and y0i , and proficiency in English by li ¼ 1, where i is an index for individ-
uals, this parameter is given by
Eðy1i � y0
i jli ¼ 1Þ:
This mean effect of language proficiency on outcomes for those who have decidedto learn the foreign language is often referred to as the effect of ‘treatment on thetreated’; see Heckman et al. (1998). The problem we face in retrieving thisparameter is that we do not observe individuals who decided to learn the hostcountry language, but then refrained from doing so. In other words, thecounterfactual Eðy0
i jli ¼ 1Þ is not observed. What we observe instead isEðy0
i jli ¼ 0Þ. If individuals who have, and who have not chosen to learn thelanguage differ in characteristics related to outcomes, Eðy1
i � y0i jli ¼ 1Þ 6¼
Eðy1i jli ¼ 1Þ �Eðy0
i jli ¼ 0Þ:To estimate the mean effect of language on outcomes for those who have
chosen to learn the language, we use a matching type approach. Suppose that weobserve a vector of conditioning variables xi, sufficient to control for the endog-enous choice of learning the English language. Then the expectation of the out-come with no language proficiency is conditionally independent of the decision tolearn the language, i.e. Eðy0
i jxi ; li ¼ 0Þ ¼ Eðy0i jxi ; li ¼ 1Þ: Under this conditional
independence assumption, we can use the outcome of those who are not profi-cient in the English language to estimate the counterfactual outcome of those whoare proficient, were they not proficient. The parameter of interest is then given byEðy1
i jli ¼ 1; xiÞ � Eðy0i jli ¼ 0; xiÞ; which can be obtained from the data.
If xi is multi-dimensional, this amounts to comparing individuals with the samecell distribution in terms of the variables in xi. This requires large data sets, anddiscretisation of continuous variables in x. Rosenbaum and Rubin (1983) showthat, if the conditional independence assumption is fulfilled, then it suffices tomatch on the propensity score P(li ¼ 1|xi) ¼ P(xi) (the probability of being pro-ficient in English, conditional on characteristics xi), which reduces the matchingindex to one dimension.
It is important to ensure that individuals are only matched for those xi com-monly observed for proficient, and non-proficient individuals (i.e. who have acommon support in x). If, for instance, there are values of xi where only proficientindividuals are observed – in other words, P(xi) ¼ 1 for some values of xi – theconditional expectation of Eðy0
i jli ¼ 0; xiÞ is not defined. Heckman et al. (1997)show that, if the common support condition is not fulfilled, then the matchingapproach may lead to seriously biased estimates.
We use a propensity score estimator, which ensures that the support conditionsare fulfilled. We estimate the propensity score for being proficient in the English
1 An alternative parameter of interest is the difference in outcomes of being proficient and non-proficient in the English language for individuals who have chosen not to learn the language. SeeDearden et al. (2000) for a discussion of the two parameters.
2003] 699L A N G U A G E P R O F I C I E N C Y A N D L A B O U R M A R K E T
� Royal Economic Society 2003

language using a simple logit model. We estimate the conditional expectation ofthe counterfactual using a Gaussian kernel, and match observations by nearestneighbour matching, based on the propensity score. We disregard individuals forwhich the absolute difference in the propensity score to the nearest neighbour inthe control sample is not small enough. We then compute the mean differencebetween the treatment group and the constructed counterfactual. We estimatecM ¼
REfy1
i � E½y0i jPðxiÞ; li ¼ 0 j li ¼ 1g dF ½PðxÞ, where E½y0
i jPðxiÞ; li ¼ 0 isestimated using a Gaussian Kernel on those who are not proficient in the Englishlanguage. Finally, we compute standard errors by bootstrap, using 500 repetitions.
A second problem we face is that there is measurement error in the self-reportedlanguage indicator. To address the measurement error problem, we use a two stageapproach, which is based on the following idea. Suppose we had an instrument Ii,which has the properties that (i) it is independent of the outcome, conditional onxi and li and (ii) it explains variation in li (in other words, E(li|Ii ¼ r) is a non-trivialfunction of r, where r is in the support of I ). These conditions correspond to therank and order conditions for instrumental variable estimation. Let the instrumentIi be binary (in our case, another measure of language). Then an estimator whichcorrects for individual heterogeneity (using the matching approach) and meas-urement error (using an IV argument) is given by
cMI ¼ Eðyi jIi ¼ 1; xiÞ � Eðyi jIi ¼ 0; xiÞProbð~lli ¼ 1jIi ¼ 1; xiÞ � Probð~lli ¼ 1jIi ¼ 0; xiÞ
; ð1Þ
where ~lli is the measured binary language variable. To estimate this parameter, weproceed in two stages. In the first stage, we compute the numerator of (1) bypropensity score matching, using the binary instrument Ii (which is the interviewlanguage) instead of the language variable. In a second step, we re-scale thisparameter. We compute the denominator as the difference in the predictedprobabilities of our language measure (using a linear probability model) for thetwo outcomes of the instrument.2 We then compute the ratio of the two to obtainan estimate of the effect of language on outcomes, which takes account of bothendogenous choice and measurement error. To compute the standard errors, weuse bootstrapping.
The matching approach is based on the idea that the observable characteristicsare sufficient to explain any relationship the choice of learning the language hason the outcome if non-proficient in English. In both data sets, we observe indi-vidual specific characteristics (like education, age, origin) and minority concen-tration in the area. Education should be correlated with otherwise unobserveddeterminants of the choice to acquiring language proficiency, like innate ability.In the two data sets, some information about family and household characteristics
2 The intuition is as follows. The numerator is the change in the outcome variable if the instrumentswitches from zero to one; the denominator is the change in the probability of being proficient if theinstrument switches from zero to one. It is easy to show that the expression in the denominator is equalto the change in the probability of being proficient in the true language measure if the instrumentswitches from zero to one, as long as the instrument is not correlated with the measurement error. Theratio of the two is then the change in the outcome variable if the true language variable switches fromzero to one. See Heckman (1997) for a discussion of similar estimators.
700 [ J U L YT H E E C O N O M I C J O U R N A L
� Royal Economic Society 2003

is available. For the FNSEM, we include marital status, number of children, andpartner characteristics. In the FWLS, we only observe marital status and number ofchildren, but we have information on some self-assessed abilities, like mentalarithmetic, and finding an address on a map.
2. The Data
The Family and Working Lives Survey (FWLS) was collected in 1994 and 1995. It isa retrospective survey on adults aged between 16 and 69, including 9,000respondents and their partners. It contains a ‘boost’ sample of about 2,000 indi-viduals belonging to four racial minority groups: Black Caribbeans, Indians,Pakistanis and Bangladeshis. The data provide information on earnings, educa-tion, nationality, language skills and other background characteristics. Of the2,388 people forming the minority sample in the main and ‘boost’ sample, 68%(1,639) are foreign born.
The Fourth National Survey on Ethnic Minorities (FNSEM) is also a cross- sec-tional survey, which has been carried out between 1993 and 1994. Individualsincluded are aged 16 or more, and of Caribbean, Indian, Pakistani, Bangladeshi,and/or Chinese origin. There are 5,196 observations in the minority sample, and2,867 observations in the independent comparison sample of white individuals.Similarly to the FWLS, more than 77% (4,019) of the individuals in the ethnicminority sample are foreign born.
The FWLS identifies the ward where the individual lives.3 It is therefore possibleto match this data set with the 1991 Population Census to construct a variable onthe ethnic concentration on ward level.4 The FNSEM does not contain geo-graphical identifiers; therefore, matching with the Census data is not possible.However, it contains grouped information on ethnic concentration at ward level,obtained by the authors of the survey from the 1991 Census.
Both data sets provide information on earnings. The FWLS reports weekly gross(before tax) earnings, while the FNSEM reports grouped gross weekly earnings.Both data sets report the main activity of the individual (e.g. full-time or part-timepaid work, full-time education, unemployed, etc.).
The sample design of the two surveys differs substantially. The ethnic minoritysample of the FWLS was selected by screening addresses in areas where theethnic minority population, according to the 1991 Census, was more than 3% ofthe local population. The selection in the FNSEM was more complex, consid-ering wards with any percentage of ethnic minorities on the population andoversampling Bangladeshis to obtain a sufficient sample size. For more details,see Appendix 1 in Modood and Berthoud (1997), and Smith and Prior (1996).
Table 1 shows the percentage of immigrants belonging to ethnic minorities withrespect to the overall population in the UK (column 1), and the ethnic compo-sition within the group of ethnic immigrants. Numbers are based on the 1991
3 In the UK, a ward is the smallest geographical area identified in the Population Census, themean population within a ward is 5,459 individuals, and the median is 4,518.
4 We define ethnic concentration as the ratio of the number of individuals belonging to ethnicminorities over the total population living in the ward. See footnote to Table 3 for details.
2003] 701L A N G U A G E P R O F I C I E N C Y A N D L A B O U R M A R K E T
� Royal Economic Society 2003

Census. Table 2 gives the ethnic composition of the two surveys. Both surveys donot include Black African immigrants, and the FWLS does not include the Chineseminority. In the last column of Table 1, we report respective numbers in thecensus, excluding Africans. Comparing the two Tables, it appears that both surveystend to oversample the South Asian groups (Indians, Pakistanis and Bangladeshis).Also, the two surveys differ in the ethnic composition of the respondents: Bang-ladeshis amount to 31% in the FWLS and 14% in the FNSEM, Indians to 19% inFWLS and 24% in the FNSEM and African Asians to 8% in the FWLS and 17% inthe FNSEM.
Both surveys contain information on language. In the FWLS, language ability isself-assessed. The individual is first asked whether English is his/her mother ton-gue. If not, the individual is asked to self-assess proficiency in speaking, readingand writing English on a 5 point scale. The FNSEM contains two variables whichare related to language proficiency: first, the interviewer’s evaluation of the indi-vidual’s spoken language ability, on a 4 point scale. Second, information aboutwhat fraction of the interview was held in English. In all areas with a minoritydensity above 0.5% (which includes 97% of the sample individuals), there was aninitial screening interview with the interviewee. In the case of poor fluency, theinterviewers were chosen to be fluent in the language of the respondents. Duringthe interview, interviewers decided about the extent to which English could beused in the interview, and we have information as to whether the interview was
Table 2
Ethnic Immigrant Composition in Survey Data
FWLS FNSEM
No. % No. % %
Black Caribbean 265 16.17 698 18.20 17.37Indian 314 19.16 971 25.32 24.17Afro-Asian 123 7.50 656 17.11 16.32Bangladeshi 512 31.24 550 14.34 13.68Pakistani 425 25.93 960 25.05 23.89Chinese – – 184 – 4.58
Total 1,639 100 4,019 100 100
Table 1
Ethnic Immigrant Composition in the UK (Census 1991)
Immigrants %of UK Pop. Ethnic composition
Ethnic compositionwithout Africans
Caribbean 0.56 18.19 23.41Indian 0.84 27.57 35.49African 0.68 22.31 –Bangladeshi 0.22 7.09 9.13Pakistani 0.47 15.46 18.89South East Asian 0.29 9.37 12.06
Total 3.06 100 100
702 [ J U L YT H E E C O N O M I C J O U R N A L
� Royal Economic Society 2003

held wholly in English, partly in English, or wholly in the individual’s mothertongue.
In Table A1 we display the responses to self-assessed (FWLS) or interviewerassessed (FNSEM) language questions for the two data sets, broken downaccording to ethnic origin. The general pattern is similar for the two data sets.
For the empirical analysis, we re-defined the language indicators in the twosurveys as dichotomous variables. For the FWLS, the variable assumes the value 1 ifthe individual reports language fluency or literacy as ‘quite well’ or ‘very well’, orreports English as a first language. For the FNSEM, it is equal to 1 if individuals fallin the categories ‘fairly’ or ‘fluently’. We use the information on the interviewlanguage in the FNSEM as an instrument for measurement error. Our instrumentis equal to one if the interview was done in English only.
Table 3 explains the variable used for the analysis, and presents summary sta-tistics. The mean values on language indicate that the percentage of individualswho speak the English language at least fairly (or quite well) is very similar in thetwo samples. Percentages for reading and writing in English (available in theFWLS) are slightly lower.
About 51% (FWLS) and 56% (FNSEM) of the sample populations are in thelabour force. Of these, 70% (FWLS) and 75% (FNSEM) are employed. Thesenumbers are remarkably similar for the two data sets.
Table 3
Variables Description and Sample Characteristics
Variable
FWLS FNSEM
DescriptionMean S.D Mean S.D
speak 0.709 0.454 0.691 0.462 Dummy ¼ 1 if spoken English is good or very goodread 0.671 0.469 – – Dummy ¼ 1 if read English is good or very goodwrite 0.641 0.479 – – Dummy ¼ 1 if written English is good or very goodLabFo 0.511 0.500 0.559 0.469 Dummy ¼ 1 if in labour forceempl 0.703 0.457 0.749 0.433 Dummy ¼ 1 if employed (conditional on LabFo ¼ 1)Wgearn 239.175 432.809 240.049 – Weekly gross earningsSex 0.468 0.499 0.505 0.500 Dummy ¼ 1 if maleage 38.347 13.588 42.604 14.407 Ageyearstay 20.404 10.313 21.367 10.001 Years of residence in the UKmarried 0.726 0.446 0.776 0.417 Dummy ¼ 1 if marriednchild 1.937 1.793 1.654 1.761 Number of children in householdDegree* 0.072 0.258 0.127 0.333 Dummy ¼ 1 if university degreeAlev* 0.129 0.335 0.109 0.312 Dummy ¼ 1 if A Levels or higher vocational
qualificationOlevCSE* 0.231 0.422 0.230 0.421 Dummy ¼ 1 if O Levels, medium or lower vocational
qualificationnoqual 0.568 0.495 0.533 0.499 Dummy ¼ 1 if no qualificationethcon 0.168 0.153 0.166 0.189 Ward ethnic minority concentration**carib 0.1620 0.369 0.178 0.383 Dummy ¼ 1 if Black Caribbeanindian 0.186 0.389 0.245 0.429 Dummy ¼ 1 if Indianafroas 0.0838 0.277 0.169 0.375 Dummy ¼ 1 if African Asianpakista 0.255 0.436 0.218 0.413 Dummy ¼ 1 if Pakistanichinese – – 0.048 0.214 Dummy ¼ 1 if Chinesebangla 0.318 0.466 0.142 0.349 Dummy ¼ 1 if Bangladeshi
*Definitions follow Dearden (1999). **Defined as the ratio of ethnic minority individuals over the totalpopulation.
2003] 703L A N G U A G E P R O F I C I E N C Y A N D L A B O U R M A R K E T
� Royal Economic Society 2003

The mean value of weekly wages in the FLWS is £239.17, considering both partand full-time workers. Mean weekly wages are reported in the FNSEM as a groupedvariable. The mean weekly gross wage is £240, which is similar to the mean wage inthe FWLS.5
The average education level is slightly higher in the FNSEM than in the FWLS,with 12.7% graduates in the former sample, and only 7.2% in the later sample.Furthermore, there is a slightly higher percentage of individuals with no qualifi-cation in the FWLS (56.8%) than in the FNSEM (53.3%).6
The average ethnic minority concentration at ward level amounts, in bothsamples, to more than 16% (the average ward concentration in the FNSEM isobtained by taking the average of the mid-point values of the grouped variable,since the information is available only in intervals). The considerable difference inthe sample designs is reflected only by the larger standard deviation indicated inthe FNSEM.
In Table A2, we break down means of the age at immigration, year of immi-gration and the age of the various ethnic groups. In the FWLS, individuals are onaverage four years younger than in the FNSEM and have immigrated at a youngerage. The immigration patterns for the various ethnic groups are similar in bothdata sets and correspond to the migration patterns indicated by Bell (1997) andHatton and Wheatley Price (1999): Black Caribbeans arrivals are concentrated inthe late 1950s and early 1960s, whereas Indians, African Asians and Pakistanisarrived mainly during the 1970s and Bangladeshis towards the end of the 1970s.Consistent with their shorter stay, Bangladeshis are the youngest group, whereasBlack Caribbeans are the oldest on average.
3. Language Determinants
After eliminating all the observations with missing values in the variables ofinterest, we are left with 1,589 observations in the FWLS sample, and 3,732observations in the FNSEM sample.
Table 4 reports coefficient estimates and robust standard errors from linearprobability models, where the indicator variable equals one if the individual isproficient in the respective language component.7 Comparing results on spokenlanguage for the two data sets shows that the signs of regressors are equal for bothsamples in most cases, and the sizes of the coefficients are likewise similar (al-though the coding of the fluency variables differs slightly). Males have a signifi-cantly higher probability to be fluent in the majority language. The effect of age(which corresponds to the effect of age at entry, since we condition on years ofresidence) is negative and strongly significant. Years of residence has the expected
5 Information on earnings is grouped in the FNSEM. To obtain this number, we estimate agrouped regression model on a constant, and compute the mean of the prediction (Stewart, 1983).
6 We construct the education variables, following a classification by Dearden (1999): the variableDegree defines University degree or post-graduate diploma; the variable Alev stands for A-Levels or highervocational degree; the variable OlevCSE includes O-levels, middle or lower vocational degrees andmiscellaneous qualifications.
7 We have also estimated probit models. Marginal effects, evaluated at the sample means, are almostidentical to the coefficients we report in the Tables.
704 [ J U L YT H E E C O N O M I C J O U R N A L
� Royal Economic Society 2003

positive effect, which decreases with time in the host country. All these results areconsistent with findings for other countries. For the FWLS, the effect of thesevariables is similar for all three components of language capital.
The effect of the education variables is quite strong for fluency (the comparisongroup are individuals who report to have no qualification). For instance, for theFWLS (FNSEM) individuals with O-levels or equivalent have a 29 (22) percentagepoints higher probability of being fluent in English.
Speaking fluency may largely be acquired by exposure to the host country lan-guage, while writing and reading in a foreign language is a skill which is moredifficult to obtain. Acquisition requires a more systematic way of learning, and thegeneral level of schooling obtained may enhance the efficiency of acquiring thiscomponent of language capital. This is reflected by our results, which indicate thateducational background variables have larger coefficients for reading and writingskills.
Table 4
Language Determinants, Linear Probability Models
FWLS FNSEM
Speaking Reading Writing Speaking
AllQualifications UK/nonUK Q
Variable Coeff StdE Coeff StdE Coeff StdE Coeff StdE Coeff StdE
Const 0.616** 0.083 0.639** 0.084 0.640** 0.085 0.778** 0.053 0.872** 0.055male 0.105** 0.019 0.109** 0.019 0.082** 0.019 0.144** 0.012 0.152** 0.012age )0.013** 0.004 )0.014** 0.004 )0.018** 0.004 )0.024** 0.002 )0.030** 0.002age2/100 0.010* 0.005 0.010* 0.005 0.016** 0.005 0.014** 0.002 0.019** 0.002yearstay 0.021** 0.003 0.012** 0.004 0.012** 0.004 0.023** 0.002 0.027** 0.002yearst2/100 )0.036** 0.010 )0.014 0.010 )0.018** 0.010 )0.027** 0.005 )0.034** 0.006Degree 0.308** 0.037 0.415** 0.038 0.457** 0.038 0.400** 0.019 – –Alev 0.303** 0.028 0.362** 0.029 0.421** 0.029 0.275** 0.019 – –OlevCSE 0.299** 0.023 0.337** 0.023 0.380** 0.023 0.223** 0.015 – –Edegree – – – – – – – – – –EAlev – – – – – – – – 0.190** 0.023EOlevCSE – – – – – – – – 0.182** 0.019Fdegree – – – – – – – – 0.461** 0.023FAlev – – – – – – – – 0.234** 0.029FOlevCSE – – – – – – – – 0.195** 0.018married )0.047* 0.023 )0.053* 0.024 )0.039 0.024 0.004 0.015 0.006 0.016nchild )0.016** 0.006 )0.012* 0.006 )0.018** 0.006 )0.005 0.003 )0.006* 0.003indian 0.249** 0.030 0.230** 0.030 0.223** 0.030 0.089** 0.021 0.087** 0.021afroas 0.241** 0.037 0.236** 0.038 0.215** 0.038 0.232** 0.022 0.258** 0.023pakista 0.137** 0.025 0.075** 0.025 0.074** 0.025 )0.021 0.019 )0.019 0.020carib 0.373** 0.036 0.396** 0.037 0.435** 0.037 0.454** 0.024 0.482** 0.025chinese – – – – – – 0.071* 0.031 0.069* 0.034ethcon )0.468** 0.091 )0.316** 0.093 )0.181 0.093 )0.208** 0.031 )0.215** 0.032
No. of Obs. 1,589 1,589 1,589 3,732 3,552Obs. Prob. 0.710 0.646 0.641 0.691 0.675
Base Category: no educational qualification, Bangladeshi. Ethnic concentration for FNSEM at mid-points. Robust standard errors are reported. *Significant at 5% level. **Significant at 1% level.
2003] 705L A N G U A G E P R O F I C I E N C Y A N D L A B O U R M A R K E T
� Royal Economic Society 2003

Education may be partly obtained in the host country. Since those who wish toenter the educational system in the UK are likely to have acquired some languageskills, this leads to a classical simultaneity bias.
The FNSEM allows us to distinguish between education obtained in the UK andabroad. We have re-estimated the language equation, distinguishing betweeneducation obtained overseas, and in the UK. Results are reported in the last col-umn of Table 4. We denote by F educational achievements obtained abroad, andby E educational achievements obtained in the UK.8 The effect of overseas qual-ifications on language fluency is very similar to the effect of education obtained inthe UK.
The variable nchild measures the number of children in the household. Chiswickand Miller (1995) suggest that children may have counteracting effects on lan-guage: first, they may act as a translator between the parent and the Englishspeaking community (thus reducing incentives to learn the foreign language).Second, they may enhance exposure to the majority population by forcing theparent to cope with institutional matters, like school and parents of native friendsof children. Our results indicate that children coefficients are negative for bothdata sets and for all language components.9
There are large differences in the level of language proficiency across differentethnic groups. Results of both data sets indicate that Bangladeshis, the base group,are dominated by nearly all other ethnic groups, except for Pakistanis in theFNSEM.
The variable ethcon measures ethnic concentration at ward level. It is stronglyassociated with language proficiency for both data sets. Results from the FWLSindicate that an increase in the ethnic density by 1 percentage point is associatedwith a 0.47 percentage point decrease in the probability to be fluent in thedominant language. The negative association with reading and writing skills isslightly smaller. Results from the FNSEM also indicate a negative association, butthe size of the coefficient is only half as large as that for the FWLS. These resultsare in line with findings for the US, Canada and Israel (Chiswick, 1994; Chiswickand Miller, 1995).
4. Language and Economic Outcomes
4.1. Employment Probabilities
Language proficiency is likely to be a decisive factor in determining employmentprobabilities. Language may help to acquire information about optimal job searchstrategies. Migrants who are not sufficiently proficient in the dominant languagemay have difficulties in convincing prospective employers of their qualifications.Also, many jobs, for instance in the service sector, require communication skills.
8 The variable Edegree predicts outcomes perfectly. Estimations are performed on the sample ofnon-degree holders.
9 We have also estimated models where we interact number of children with gender. The childrenvariable is positive (though insignificant) for males, but negative (and significant for the FWLS data) forfemales.
706 [ J U L YT H E E C O N O M I C J O U R N A L
� Royal Economic Society 2003

Likewise, literacy in the dominant language is a crucial prerequisite for manyunskilled occupations.
To understand the association between employment probabilities and language,we consider individuals who are in the labour force, and we distinguish betweenthose who are in work, and those who are not employed, but who are activelyseeking a job.10 Our samples consist of 839 individuals for the FWLS, and 2,100individuals for the FNSEM. Our dependent variable, EMPL, takes the value 0 if theindividual is unemployed and seeking a job or claiming benefits, and the value 1 ifthe individual works full or part-time. Explanatory variables are the demographicand human capital characteristics available in the two data sets, including a dummyvariable for the level of language proficiency. The results are reported in Table 5.For the FWLS, we report results conditioning on fluency only, and on fluency andwritten literacy.
Most coefficient estimates for the two data sets are very similar. Males have asignificantly lower probability of being employed (13 percentage points in theFWLS and 8 percentage points in the FNSEM). Being married increases employ-ment probabilities by about 18 (17) percentage points. On the other hand, havingchildren influences the employment probability negatively. These effects areconsistent with evidence for British (male) natives (Nickell, 1980).
For the FWLS, education coefficients are mostly insignificant. For the FNSEM,education coefficients are significant and of the expected order of magnitude. Inthe last columns of Table 5, we show regressions which distinguish between edu-cation levels acquired in the UK and in the home country. The coefficients on theUK educational degrees seem slightly larger than the coefficients on educationacquired at home. However, we can not reject the null hypothesis that the coef-ficients are equal (neither in isolation, nor jointly).
Age is positively associated with employment probabilities, and the age profile isconcave. Conditional on age, the time of residence in the UK does not have asignificant effect on employment probabilities, for both the FWLS and the FNSEM.Indians, Afro-Asians and Chinese have higher probabilities of being employedthan Pakistanis and Bangladeshis. Again, Bangladeshis seem to be the most dis-advantaged group.
The coefficients on the language variables are quite large, and similar for thetwo data sets. English fluency is associated with a 15 (17) percentage point higheremployment probability, using the FWLS (FNSEM) data. The coefficients arehighly significant.
The FWLS data distinguish between speaking, writing and reading abilities –information which is not available in most datasets on migrants’ language abilities.One may argue that proficiency in the spoken language alone is not sufficient toaffect labour market outcomes but that writing skills are likewise needed. Thepositive coefficient of the fluency variable may then simply reflect the correlationbetween these two components of language capital. To investigate this point, we
10 This follows the ILO definition of unemployment. According to the ILO definition, people areconsidered as unemployed if aged 15 years or older, without work, but available to start within the nexttwo weeks and have actively sought employment at some time during the previous four weeks.
2003] 707L A N G U A G E P R O F I C I E N C Y A N D L A B O U R M A R K E T
� Royal Economic Society 2003

Tab
le5
Em
ploy
men
tP
roba
bili
ties
,L
inea
rP
roba
bili
tyM
odel
s
FW
LS
FN
SEM
12
34
5
All
Qu
alifi
cati
on
sU
K/
no
nU
KQ
Var
iab
leC
oef
fSt
dE
Co
eff
Std
EC
oef
fSt
dE
Co
eff
Std
EC
oef
fSt
dE
Co
nst
)0.
052
0.16
9)
0.08
20.
169
)0.
087
0.16
90.
101
0.11
60.
105
0.11
8m
ale
)0.
128*
*0.
034
)0.
123*
*0.
034
)0.
125*
*0.
034
)0.
080*
*0.
019
)0.
079*
*0.
019
mar
ried
0.17
5**
0.04
20.
176*
*0.
041
0.17
8**
0.04
20.
167*
*0.
025
0.16
8**
0.02
5n
chil
d)
0.03
5**
0.01
1)
0.03
4**
0.01
1)
0.03
4**
0.01
1)
0.02
6**
0.00
6)
0.02
6**
0.00
6de
gree
0.04
70.
053
0.01
90.
055
0.01
80.
055
0.10
7**
0.02
6–
–A
lev
0.00
80.
045
)0.
016
0.04
7)
0.01
70.
047
0.12
1**
0.02
7–
–O
levC
SE)
0.06
40.
039
)0.
084*
0.04
0)
0.08
6*0.
040
0.07
1**
0.02
2–
–E
degr
ee–
––
––
––
–0.
103*
*0.
034
EA
lev
––
––
––
––
0.11
6**
0.03
0E
Ole
vCSE
––
––
––
––
0.06
9**
0.02
5Fd
egre
e–
––
––
––
–0.
082*
*0.
032
FAle
v–
––
––
––
–0.
067
0.04
0FO
levC
SE–
––
––
––
–0.
052*
0.02
5ag
e0.
029*
*0.
009
0.03
0**
0.00
90.
030*
*0.
009
0.01
6**
0.00
60.
016*
*0.
006
age2
/10
0)
0.03
9**
0.01
2)
0.04
0**
0.01
1)
0.04
0**
0.01
1)
0.02
4**
0.00
7)
0.02
4**
0.00
7ye
arst
ay0.
002
0.00
70.
004
0.00
60.
003
0.00
70.
003
0.00
40.
003
0.00
4ye
arst
2/
100
0.00
10.
017
)0.
000
0.01
7)
0.00
10.
017
)0.
004
0.01
0)
0.00
30.
010
blac
k0.
105
0.05
90.
094
0.05
90.
089
0.05
90.
126*
*0.
039
0.12
7**
0.03
9af
roas
0.12
8*0.
057
0.13
1*0.
057
0.12
5*0.
057
0.18
2**
0.03
50.
183*
*0.
035
indi
an0.
172*
*0.
049
0.17
3**
0.04
80.
166*
*0.
049
0.17
7**
0.03
30.
183*
*0.
033
paki
sta
0.06
40.
045
0.07
10.
045
0.06
60.
045
0.02
40.
033
0.02
90.
033
chin
ese
––
––
––
0.25
0**
0.04
60.
243*
*0.
047
spea
k0.
147*
*0.
046
––
0.04
90.
062
0.17
1**
0.02
50.
169*
*0.
025
wri
te–
–0.
164*
*0.
042
0.13
3*0.
057
––
––
No
.o
fO
bs.
839
839
839
2,10
02,
100
Bas
eC
ateg
ory
:n
oed
uca
tio
nal
qu
alifi
cati
on
,B
angl
ades
hi.
Ro
bu
stst
and
ard
erro
rsar
ere
po
rted
.*Si
gnifi
can
tat
5%le
vel.
**Si
gnifi
can
tat
1%le
vel.
708 [ J U L YT H E E C O N O M I C J O U R N A L
� Royal Economic Society 2003

have included an indicator for writing abilities (columns 2), and both speakingand writing variables (columns 3). The effect of writing proficiency (unconditionalon fluency) is slightly higher. When including both indicator variables, we findthat writing abilities are associated with a 13 percentage point increase inemployment probabilities, while speaking ability alone increases this probability byonly 5 percentage points. The latter effect is not significant. This suggests thatliteracy in the dominant majority language, in addition to fluency, is important toobtain a job.
4.2. Employment, Endogenous Choice and Measurement Error
The above results suggest that language proficiency has a positive impact onemployment probabilities. As we discussed above, however, the estimated coeffi-cients may be seriously biased due to endogenous choice and measurement error.Furthermore, the effect of language on employment may be different for malesand females. In this section, we address these issues. We estimate different models,addressing both these problems, and using the pooled sample, and males andfemales separately. We report the results in Table 6.
In the first row, we replicate our OLS results (based on the same specification asin Table 5), where we also report estimates for males and females separately. Forthe FNSEM data, the language coefficient is very similar for males and females, andsignificantly different from zero for both groups. For the FWLS, the coefficient formales is slightly larger than the coefficient for the pooled sample, while thecoefficient for females is practically zero.
The second row reports results using the propensity score matching estimator,as we have explained in Section 1. Coefficients decrease slightly, which is com-patible with unobserved ability being still present in the simple regression in row 1.
In the last row, we report results from implementing the two stage estimatorwhich takes account of measurement error (see (1) above). Coefficient estimatesincrease quite substantially. The results suggest that measurement error in thelanguage variable leads to a substantial downward bias in estimated parameters.
Table 6
Employment and Language
FNSEM FWLS
Specification All Males Females All Males Females
1: OLS Coeff 0.170 0.166 0.172 0.147 0.190 )0.007StdE 0.025 0.024 0.041 0.046 0.037 0.070
2: Prop. Match. Coeff 0.102 0.102 0.133 0.100 0.112 )0.140StdE 0.049 0.060 0.103 0.117 0.123 0.120
3: Prop. Match. Coeff 0.223 0.261 0.141 – – –Measurement Error StdE 0.071 0.094 0.113 – – –
Robust standard errors are reported for specification 1; bootstrapped standard errors (based on 500repetitions) are reported for specifications 2,3.
2003] 709L A N G U A G E P R O F I C I E N C Y A N D L A B O U R M A R K E T
� Royal Economic Society 2003

Altogether, these results indicate that measurement error and endogenouschoice bias the estimates of language effects in opposite directions. Our resultssuggest that the true effect of language on employment probabilities is substantial,and possibly larger than simple OLS estimates suggest. Overall, the results weobtain from the estimator which controls for measurement error suggest thatfluency increases the probability that a male individual is employed, given that helooks for a job, by around 26 percentage points. The estimate for females issmaller, and not significant.
4.3. Earnings
We now turn to the effect of language on weakly gross earnings. Neither sampleprovides information on the number of hours worked per week, and we thereforeconsider only individuals who are working full-time.
In the FWLS, the dependent variable is the natural logarithm of gross (beforetax) weekly earnings. The earnings variable in the FNSEM is gross weekly earnings,which is reported in categorical form (16 categories). In both samples there is aconsiderable percentage of working individuals who do not report their earnings(28% in the FNSEM and 45% in the FWLS).
To check the extent to which attrition is non-random, we compare the means ofthe language variables, origin dummies, the educational variables and otherindividual characteristics for individuals who do, and who do not report earnings.Results are presented in Table A3. We also report the t-statistics for testing whetherthe means of the variables are significantly different. In some cases, we reject thenull hypothesis of equal means, but there seems to be no systematic pattern ofattrition across the two data sets.
Our final sample sizes for the earnings analysis are 254 individuals for the FWLSdata, and 920 individuals for the FNSEM data. Results of straightforward log wageregressions are presented in Table 7, where we use the least squares estimator forthe FWLS, and the least squares estimator at the midpoints for the FNSEM.11
As regressors, we include the same set of variables as in the employmentregressions. Coefficient estimates on most variables are roughly similar for the twodata sets. Males have a significant earnings advantage, compared to females.Having a degree more than doubles earnings, compared to holding no qualifica-tion. O-levels (or equivalent) alone increase earnings by about 17 (FWLS) or 24%(FNSEM).12
In the last column, we again use the more detailed educational information inthe FNSEM, and decompose educational attainments into overseas and UK qual-ifications. We find that the coefficients on UK qualifications are larger thanoverseas ones, but the joint null hypothesis that degrees acquired abroad have asignificantly different effect on earnings from degrees acquired in the UK is
11 We have also estimated grouped regression models for the FNSEM (where the boundaries aretransformed by taking logs). Results are almost identical.
12 We compute here and in the following percentage differences in earnings as ðe b̂b � 1Þ � 100,where b̂b is the estimated parameter on the variable to which the discussion refers.
710 [ J U L YT H E E C O N O M I C J O U R N A L
� Royal Economic Society 2003

rejected at the 5% level. Coefficients are only significantly different for A levels orequivalent degrees.
The coefficients on the ethnicity dummies indicate significant wage differencesbetween ethnic groups. As in the language and employment equations, Bangla-deshis are the most disadvantaged group. Conditional on education, age and yearsof residence, their wages are 66% lower than those of the most successful group,the Chinese (FNSEM). In both data sets the earnings of Caribbeans are about 35%higher than Bangladeshis.
We find large and significant coefficients for the English fluency variables. Thepoint estimates in the FNSEM and FWLS are quite similar and indicate thatEnglish language proficiency is associated with about 21 (FNSEM) or 23% (FWLS)higher wages. Again, we use writing proficiency as an additional indicator forlanguage proficiency (see columns 2 and 3). Interestingly, and different fromthe employment equation, fluency seems to be more important for wages thanliteracy.
Table 7
Earnings Regressions
FWLS FNSEM
1 2 3 4 5
AllQualifications UK/nonUK Q
Variable Coeff StdE Coeff StdE Coeff StdE Coeff StdE Coeff StdE
Cons 3.551** 0.411 3.577** 0.412 3.546** 0.413 3.843** 0.243 3.809** 0.249male 0.238** 0.072 0.251** 0.071 0.238** 0.072 0.107** 0.039 0.115** 0.039married )0.010 0.088 )0.008 0.089 )0.008 0.089 0.176** 0.051 0.160** 0.051degree 0.786** 0.104 0.788** 0.106 0.781** 0.106 0.671** 0.048 – –Alev 0.206* 0.090 0.202* 0.093 0.201* 0.093 0.384** 0.051 – –OlevCSE 0.169 0.091 0.172 0.091 0.166 0.092 0.156** 0.043 – –Edegree – – – – – – – – 0.607** 0.056EAlev – – – – – – – – 0.351** 0.054EOlevCSE – – – – – – – – 0.120* 0.050Fdegree – – – – – – – – 0.504** 0.066FAlev – – – – – – – – 0.132 0.078FOlevCSE – – – – – – – – 0.094 0.050age 0.038 0.023 0.036 0.023 0.038 0.023 0.019 0.012 0.021 0.013agesq/100 )0.045 0.029 )0.042 0.029 )0.044 0.029 )0.022 0.015 )0.025 0.015yearst 0.026 0.015 0.030* 0.014 0.027 0.015 0.033** 0.007 0.032** 0.007yearst2/100 )0.050 0.035 )0.035 0.035 )0.050 0.036 )0.051** 0.019 0.050* 0.020carib 0.302* 0.132 0.327* 0.130 0.301* 0.132 0.279** 0.076 0.301** 0.077afroas 0.081 0.125 0.109 0.123 0.083 0.125 0.224** 0.068 0.259** 0.068indian 0.311** 0.113 0.329** 0.112 0.310** 0.113 0.157* 0.069 0.206** 0.069pakista 0.239* 0.118 0.251* 0.118 0.239* 0.119 0.025 0.072 0.066 0.073chinese – – – – – – 0.408** 0.083 0.416** 0.085speak 0.204 0.115 – – 0.171 0.161 0.180** 0.055 0.192** 0.055write – 0.149 0.103 0.040 0.145 – – – –
No. of Obs. 254 254 254 920 920
Base Category: no educational qualification, Bangladeshi. Robust standard errors are reported.*Significant at 5% level. **Significant at 1% level.
2003] 711L A N G U A G E P R O F I C I E N C Y A N D L A B O U R M A R K E T
� Royal Economic Society 2003

4.4. Earnings, Endogenous Choice and Measurement Error
Besides measurement error and endogenous choice of acquiring language profi-ciency, an additional difficulty with investigating earnings is non-random selectioninto the workforce. Non-participation is large among minority immigrants, in par-ticular among females. It is likely that participation is selective and correlated withthe choice to acquiring language proficiency, thus biasing parameter estimates.
The conventional way of addressing non-random selection is to model theselection process and the earnings equation simultaneously. A simple estimator is atwo step estimator which conditions earnings on the (generalised) residual fromthe first step auxiliary participation equation. To implement this approachrequires identifying assumptions. We experimented with a number of possibleexclusion restrictions. We are not confident about the validity of most exclusionrestrictions that are feasible given the information in our data.13
We therefore refrain from estimating a joint model. To the extent that theparticipation choice is due to observables, our matching approach takes care ofthis problem. For any remaining selection, our strategy is to interpret the coeffi-cients on the language variable as bounds, which is possible under some plausibleassumptions. As we have seen in the last Section, language has a positive effect onemployment probabilities, and simple regressions show that it has also a positiveeffect on participation. If we are willing to assume that unobservables, which affectthe participation probability, are positively correlated with unobservables whichaffect earnings, then the estimate of the language coefficient in an earningsregression on participants only is downward biased, compared to the hypotheticalcoefficient for the overall population. The intuition is simple: those individuals,who are not proficient in the English language but participate nevertheless, mustbe drawn from the upper part of the ability distribution to compensate for theirlanguage deficiencies, thus inducing a downward bias in the estimated languagecoefficient.14 Accordingly, we can interpret the coefficient estimates we obtain onthe sample of participants as lower bounds of the effect of language on earnings.
In Table 8, we report results for the pooled sample and for males and femalesseparately. Splitting the sample into males and females leads to very small samplesizes, in particular for the FWLS, and most of our estimates are quite imprecise. Weshould therefore interpret results with care.
13 For females, we considered to use variation in religious beliefs (conditional on origin) as aninstrument for participation. The idea is that some religions may impose a strict role behaviour onfemales more than others. Religion may thus explain variation in participation. The FNSEM datadistinguish between Sikh, Hindu, Muslim, Christian and no religion. These variables are jointly signi-ficant in an auxiliary first step participation regression. The generalised residual was not significant inthe earnings regression, and hardly changed the language coefficient.
14 More formally, suppose that the latent participation index p* is linear in l, withp�
i ¼ a0 þ ali þ ui , and that the individual participates if p�i > 0. Suppose that the outcome equation
is given by yi ¼ c0 + cli + vi, and assume that ui and vi are jointly normally distributed, with variances 1and r2
v and correlation coefficient q. Then selection could be accounted for by adding the generalisedresidual Eðvi jp�
i > 0Þ ¼ kðciÞ to the estimation equation, where k(ci) ¼ /(ci)/U(ci), with / and U beingthe density and distribution function of the standard normal, and ci ¼ a0 + ali. We obtain the estimationequation yi ¼ c0 + cli + rvqk(ci) + ei. Omission of k(ci) results in a biased estimate for c. The expectationof the error term when omitting k, conditional on li, is qrvE[k(ci)|li]. Since k decreases in ci, the bias isdownward for q > 0 and a > 0.
712 [ J U L YT H E E C O N O M I C J O U R N A L
� Royal Economic Society 2003

In the first row, we report the least squares results. While for the FWLS, coef-ficients for males and females are quite similar, the language coefficient using theFNSEM data is much larger for females than for males. Coefficient estimates forthe FWLS are however not significant, with large standard errors for the separatedsamples.
In the second row, we report results from the propensity score estimator.Coefficients for both males and females are larger relative to the simple OLSestimator. This seems to be contrary to what endogenous choice of languageacquisition would predict. However, as we discussed above, non-random partici-pation may lead to downward biased estimates of language coefficients. Thematching estimator corrects for participation selection, as long as it is on observ-ables, and may therefore reduce the downward bias due to selective participation.Sample sizes for the FWLS data when we distinguish between males and femalesbecame too small for this estimator, and we only report results for the FNSEM.
In row 3, we implement our estimator which accounts for measurement error inaddition. For females, the coefficient estimate becomes very large, and is estimatedwith very low precision. For males, coefficient estimates increase by factor 2, butthe coefficient is not significant at the 5% level. Sample sizes are too small to drawrobust conclusions from this evidence. We may however interpret the increase incoefficients when correcting for measurement error as evidence that measurementerror leads to downward biased estimates also here.
5. Summary and Discussion
Based on two recent UK surveys, we analyse the determinants of English languagefluency for ethnic minority immigrants in the UK and the effect of language onlabour market outcomes. We also investigate the effect of other characteristics onlanguage acquisition, and employment and earnings.
We find that in simple regressions, language proficiency is associated withhigher employment probabilities and with higher earnings. Language effects maybe under or overestimated, due to endogenous choice of learning the language,
Table 8
Earnings and Language
EstimationSpecification
FNSEM FWLS
All Males Females All Males Females
1: OLS Coeff 0.180 0.121 0.354 0.204 0.173 0.167StdE 0.055 0.063 0.120 0.115 0.180 0.121
2: Prop. Match. Coeff 0.281 0.238 0.463 0.101 – –StdE 0.108 0.103 0.186 0.174 – –
3: Prop. Match. Coeff 0.356 0.460 0.844 – – –Measurement Error StdE 0.324 0.272 0.844 – – –
Robust standard errors are reported for specifications 1; bootstrapped standard errors (based on 500repetitions) are reported for specifications 2,3.
2003] 713L A N G U A G E P R O F I C I E N C Y A N D L A B O U R M A R K E T
� Royal Economic Society 2003

and measurement error. We address both these issues. We use a matching esti-mator to address the endogenous choice of language acquisition. We combine ourmatching estimator with an IV type estimator to eliminate the downward bias dueto measurement error, using information about the interview language for iden-tification. Our results indicate that the bias induced by the two problems points inopposite directions, and that the effect of language on outcomes is larger thansuggested by simple regression estimators. While OLS estimates indicate thatlanguage fluency increases employment probabilities by 17 percentage points,estimates that address both selection and measurement error suggest an increaseby about 22 percentage points. Our analysis on earnings is less conclusive. OLSestimates suggest an earnings advantage of those who are proficient in English ofabout 18–20%. Estimates based on the estimator that addresses both endogenousselection and measurement error are insignificant.
The validity of our matching approach depends on our beliefs about whetherthe set of matching variables eliminates the problem of endogenous selection. Theset of conditioning variables available to us includes indicators that are likely to becorrelated with unobserved ability that sorts individuals into groups of those whodo and who do not acquire the host country language, like education, ability testsand partner information. However, if these variables do not fully account forunobserved factors that select individuals into the group of those who are profi-cient and non-proficient in the English language, language effects may still beupward biased.
Addressing the problem of endogenous language choice is difficult. Ideally, wewould like to observe immigrants who have had different access to languagefacilities and where the assignment to facilities is exogenous. One mechanism thatcould generate this are settlement policies that allocate immigrants to differentcommunities upon arrival. Schemes like this were in place in different countries.Future research could use these assignment mechanisms to address the problem ofendogenous language choice.
As we discussed in the Introduction, the data we use in this analysis do not coverthe entire immigrant population in the UK but only those immigrants who belongto ethnic minority communities. According to the Labour Force Survey (2000),immigrants from ethnic minority groups constitute only 49% of the total immi-grant population in the UK. Hence, our analysis covers only half of the immigrantpopulation. As shown by other research on UK immigrants (Chiswick, 1980; Bell,1997; Wheatley Price, 2001; Dustmann et al., 2002), the assimilation patterns ofethnic minority immigrants and white immigrants differ quite substantially. It islikely that effects of language proficiency on economic outcomes are also differentfor these groups. More comprehensive surveys are needed to allow investigatinglanguage effect for the entire immigrant population in the UK.
University College, London
Date of receipt of first submission: March 2000Date of receipt of final typescript: May 2002
714 [ J U L YT H E E C O N O M I C J O U R N A L
� Royal Economic Society 2003

Appendix
Table A1
Language Information
All groups Caribbean Indian Afroasian Pakistani Bangladeshi Chinese
Speaking, FWLSVery well 37.81 54.55 50.44 64.77 38.16 25.93 –Quite well 23.12 13.64 27.43 27.27 26.05 18.46 –Not well 20.12 18.18 18.14 5.68 21.32 22.82 –Hardly 11.69 13.64 3.54 2.27 10 18.46 –Not at all 7.26 – 0.44 – 4.47 14.32 –
Reading, FWLSVery well 34.64 40.91 48.67 61.36 33.16 24.07 –Quite well 21.12 18.18 23.89 26.14 21.58 18.67 –Not well 15.86 22.73 14.16 7.95 17.11 16.8 –Hardly 13.19 9.09 7.96 1.14 14.47 17.01 –Not at all 15.19 9.09 5.31 3.41 13.68 23.44 –
Writing, FWLSVery well 32.39 40.91 45.13 56.82 29.47 23.86 –Quite well 19.2 18.18 21.68 23.86 20.79 15.98 –Not well 16.61 22.73 15.49 13.64 18.16 16.18 –Hardly 21.77 4.55 11.06 2.27 13.68 15.15 –Not at all 19.03 13.64 6.44 3.41 17.89 28.84 –
Speaking, FNSEMFluent 48.73 86.95 39.98 65.63 25.56 25.97 56.59Fairly 20.4 9.62 24.37 19.2 25.56 23.02 12.64Slightly 21.2 – 25.84 11.76 32 34.25 18.13Not at all 9.67 – 9.81 3.41 16.88 16.76 12.64
Table A2
Age and Time Patterns
Ethnicity
Age Migration Year Age
FWLS FNSEM FWLS FNSEM FWLS FNSEM
Carib 19.460 20.379 1964.2 1963.435 49.755 50.927StdD 8.840 10.186 7.968 7.772 12.199 13.933Indian 18.971 23.892 1973.2 1972.431 40.299 45.145StdD 10.235 13.535 9.750 9.515 11.004 14.384AfroAsia 17.813 20.662 1974.1 1973.828 37.976 40.735StdD 10.320 12.702 7.035 7.221 10.393 13.026Pakista 18.167 20.424 1976.4 1974.207 35.870 39.672StdD 9.374 11.275 9.634 9.677 11.953 13.738Bangla 18.676 20.579 1979.6 1977.695 33.266 36.645StdD 9.374 10.545 9.046 9.637 13.985 14.156Chinese – 22.088 – 1976.35 – 39.641StdD – 11.860 – 8.670 – 12.532
All 18.663 21.418 1974.7 72.414 38.308 42.707StdD 10.084 11.918 1.402 9.944 13.587 14.572
2003] 715L A N G U A G E P R O F I C I E N C Y A N D L A B O U R M A R K E T
� Royal Economic Society 2003
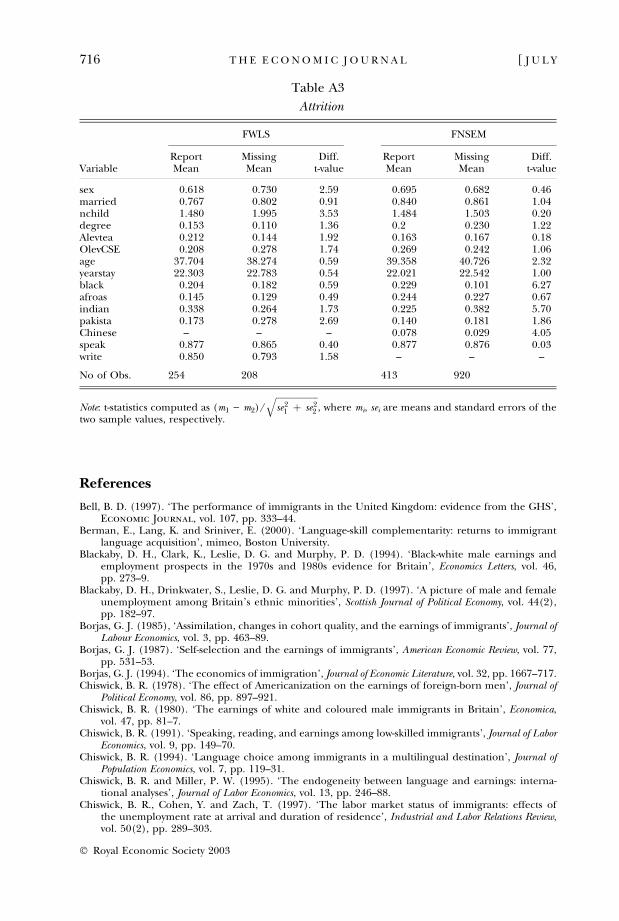
Table A3
Attrition
FWLS FNSEM
Report Missing Diff. Report Missing Diff.Variable Mean Mean t-value Mean Mean t-value
sex 0.618 0.730 2.59 0.695 0.682 0.46married 0.767 0.802 0.91 0.840 0.861 1.04nchild 1.480 1.995 3.53 1.484 1.503 0.20degree 0.153 0.110 1.36 0.2 0.230 1.22Alevtea 0.212 0.144 1.92 0.163 0.167 0.18OlevCSE 0.208 0.278 1.74 0.269 0.242 1.06age 37.704 38.274 0.59 39.358 40.726 2.32yearstay 22.303 22.783 0.54 22.021 22.542 1.00black 0.204 0.182 0.59 0.229 0.101 6.27afroas 0.145 0.129 0.49 0.244 0.227 0.67indian 0.338 0.264 1.73 0.225 0.382 5.70pakista 0.173 0.278 2.69 0.140 0.181 1.86Chinese – – – 0.078 0.029 4.05speak 0.877 0.865 0.40 0.877 0.876 0.03write 0.850 0.793 1.58 – – –
No of Obs. 254 208 413 920
Note: t-statistics computed as (m1 ) m2)/ffiffiffiffiffiffiffiffiffiffiffiffiffiffiffiffiffiffiffise2
1 þ se22
q, where mi, sei are means and standard errors of the
two sample values, respectively.
References
Bell, B. D. (1997). ‘The performance of immigrants in the United Kingdom: evidence from the GHS’,Economic Journal, vol. 107, pp. 333–44.
Berman, E., Lang, K. and Sriniver, E. (2000). ‘Language-skill complementarity: returns to immigrantlanguage acquisition’, mimeo, Boston University.
Blackaby, D. H., Clark, K., Leslie, D. G. and Murphy, P. D. (1994). ‘Black-white male earnings andemployment prospects in the 1970s and 1980s evidence for Britain’, Economics Letters, vol. 46,pp. 273–9.
Blackaby, D. H., Drinkwater, S., Leslie, D. G. and Murphy, P. D. (1997). ‘A picture of male and femaleunemployment among Britain’s ethnic minorities’, Scottish Journal of Political Economy, vol. 44(2),pp. 182–97.
Borjas, G. J. (1985), ‘Assimilation, changes in cohort quality, and the earnings of immigrants’, Journal ofLabour Economics, vol. 3, pp. 463–89.
Borjas, G. J. (1987). ‘Self-selection and the earnings of immigrants’, American Economic Review, vol. 77,pp. 531–53.
Borjas, G. J. (1994). ‘The economics of immigration’, Journal of Economic Literature, vol. 32, pp. 1667–717.Chiswick, B. R. (1978). ‘The effect of Americanization on the earnings of foreign-born men’, Journal of
Political Economy, vol. 86, pp. 897–921.Chiswick, B. R. (1980). ‘The earnings of white and coloured male immigrants in Britain’, Economica,
vol. 47, pp. 81–7.Chiswick, B. R. (1991). ‘Speaking, reading, and earnings among low-skilled immigrants’, Journal of Labor
Economics, vol. 9, pp. 149–70.Chiswick, B. R. (1994). ‘Language choice among immigrants in a multilingual destination’, Journal of
Population Economics, vol. 7, pp. 119–31.Chiswick, B. R. and Miller, P. W. (1995). ‘The endogeneity between language and earnings: interna-
tional analyses’, Journal of Labor Economics, vol. 13, pp. 246–88.Chiswick, B. R., Cohen, Y. and Zach, T. (1997). ‘The labor market status of immigrants: effects of
the unemployment rate at arrival and duration of residence’, Industrial and Labor Relations Review,vol. 50(2), pp. 289–303.
716 [ J U L YT H E E C O N O M I C J O U R N A L
� Royal Economic Society 2003

Clark, K. and Drinkwater, S. (2000). ‘Pushed out or pulled in? Self-employment among ethnicminorities in England and Wales’, Labour Economics, vol. 7, pp. 603–28.
Dearden, L. (1999). ‘Qualifications and earnings in Britain: how reliable are conventional OLS esti-mates of the returns to education?’, IFS working paper no. W99/7.
Dearden, L., Ferri, J. and Meghir, C. (2000) ‘The effect of school quality on educational attainment andwages’, forthcoming Review of Economics and Statistics.
Dustmann, C. (1994). ‘Speaking fluency, writing fluency and earnings of migrants’, Journal of PopulationEconomics, vol. 7, pp. 133–56.
Dustmann, C. (1999). ‘Temporary migration, human capital, and language fluency of migrants’,Scandinavian Journal of Economics, vol. 101, pp. 297–314.
Dustmann, C. and van Soest, A. (2001). ‘Language fluency and earnings estimation with misclassifiedlanguage indicators’, Review of Economic and Statistics, vol. 83, pp. 663–74.
Dustmann, C., Fabbri, F., Preston, I. and Wadsworth, J. (2002). ‘The performance of immigrants in theUK’, report for the Home Office at www.homeoffice.gov.uk/rds/pdfs2/rdsolr0505.pdf.
Hatton, T. J. and Wheatley Price, S. (1999). ‘Migration, migrants and policy in the United Kingdom’,IZA discussion paper no. 81.
Heckman, J. (1997). ‘Instrumental variables’, Journal of Human Resources, vol. 32, pp. 441–62.Heckman, J., Ichimura, H. and Todd, P. (1998). ‘Matching as an econometric evaluation estimator’,
Review of Economic Studies, vol. 65, pp. 261–94.Heckman, J., Ichimura, H., Smith, J. and Todd, P. (1997). ‘Matching as an econometric evaluation
estimator: evidence from evaluating a job training programme’, Review of Economic Studies, vol. 64,pp. 605–54.
Modood, T. and Berthoud, R. (1997). Ethnic Minorities in Britain, London: Policy Studies Institute.Nickell, S. J. (1980). ‘A picture of male unemployment in Britain’, Economic Journal, vol. 90,
pp. 776–94.Rivera-Batiz, F. L. (1990). ‘English language proficiency and the economic progress of immigrants’,
Economic Letters, vol. 34, pp. 295–300.Rosenbaum, P. and Rubin, D. B. (1983). ‘The central role of the propensity score in observational
studies for causal effects’, Biometrika, vol. 70, pp. 41–55.Shields, M. A. and Wheatley Price, S. (1998). ‘The earnings of male immigrants in England: evidence
from the quarterly LFS’, Applied Economics, vol. 30, pp. 1157–68.Shields, M. A. and Wheatley Price, S. (2002). ‘The English language fluency and occupational success
of ethnic minority immigrant men living in English metropolitan areas’, Journal of PopulationEconomics, vol. 15, pp. 137–6.
Smith, P. and Prior, G. (1996). The Fourth National Survey of Ethnic Minorities: Technical Report, London:Social and Community Planning Research.
Stewart, M. B. (1983). ‘On least squares estimation when the dependent variable is grouped’, Review ofEconomic Studies, vol. 50, pp. 737–53.
Wheatley Price, S. (2001). ‘The employment adjustment of male immigrants to the English labourmarket’, Journal of Population Economics, vol. 14, pp. 193–220.
2003] 717L A N G U A G E P R O F I C I E N C Y A N D L A B O U R M A R K E T
� Royal Economic Society 2003