Language Analysis Testing of Asylum Applicants · Language analysis (LA) involves the use of...
43
Language analysis testing of asylum applicants: Impacts and economic costs and benefits September 2011 REDACTED VERSION April 2012 A report prepared for the UK Border Agency: New Asylum Model team (NAM +) by Home Office Science: Migration and Border Analysis
Transcript of Language Analysis Testing of Asylum Applicants · Language analysis (LA) involves the use of...

Language analysis testing of asylum applicants: Impacts and economic costs and benefits
September 2011
REDACTED VERSION April 2012
A report prepared for the UK Border Agency: New Asylum Model team (NAM +) by Home Office Science: Migration and Border Analysis

Home Office Science: Migration and Borders Analysis 1
Contents List of figures and tables 2 Executive summary 3 1. Introduction 4 2. Background 5
2.1 Legal issues 7 3. Data and trends: Asylum, nationalities and language analysis 8
3.1 Total asylum applications 8 3.2 Asylum data by nationality 8 3.3 Nationalities for LA tests 10
4. Analysis of the impacts of language analysis tests 12
4.1 Impacts of LA tests: UKBA case decisions and outcomes 13 4.2 Impacts of LA on abusive asylum claims and nationality swapping 28
5. Costs and benefits of language analysis 30
5.1 Costs and benefits of LA in asylum decision making 30 5.2 Costs and benefits of LA in deterring abusive asylum applicants 32
Glossary 33 References 34 Annexes 36 Annex A Asylum statistics by nationality, 2001 to 2010 Q1(P) 36 Annex B Key elements of the new asylum model 37 Annex C Illustrative cost modelling 38

Home Office Science: Migration and Borders Analysis 2
List of figures and tables Figures
Figure 1: Main applicant asylum applications in the UK, 2001 to 2010 8 Figure 2 Total grant rate (from initial decisions and appeals), 2008
and 2009 18 Annex figures
Annex B Key elements of the new asylum approach 37
Tables Table 1: Asylum statistics, by nationality, 2001 to 2010 9 Table 2: LA tests, by top ten nationality of claim, main applicants,
1 April to 30 September, 2008 and 2009 10 Table 3: Outcomes from the language analysis pilot, February 2008
to March 2010 15 Table 4: Comparison of initial decision outcomes of non-LA cases
with LA cases, main applicants only, by nationality, 2008 and 2009 17
Table 5: Comparison of appeal outcomes for non-LA cases and LA cases, main applicants only by nationality, 2008 and 2009 17
Table 6 Comparison of outcomes from initial decision and appeal outcomes for non-LA cases and LA cases, by nationality, 2008 and 2009 18
Table 7: Volumes, median time (days) and the 90th percentile to each stage of the process, 2008 and 2009 20
Table 8: Comparison of initial decision outcomes of non-LA cases with initial outcomes of LA cases (nationality dispute cases only), 2008 and 2009 23
Table 9: Comparison of appeal outcomes of non-LA cases and of LA cases (nationality dispute cases only), 2008 and 2009 24
Table 10: Time to each stage of the process (nationality dispute cases only), 2008 and 2009 25
Table 11: Intake comparison of LA tested nationalities, 1 April 2008 to 30 September 2008 against 1 April), 2009 to 30 September 2009, and pre-2008 trend 28
Annex tables
Annex A Asylum statistics, by nationality, 2001 to 2011 Q1(P) 36 Table C1 Assumptions for costs applied across all cases) 39 Table C2 Illustrative cost model results, by nationality, ultimately
granted or refused 42 Note: <REDACTED> indicates a Table or Figure has been redacted. xxxxx indicates that a word has been redacted. xx indicates that a number has been redacted. The redactions are necessary to protect UK Border Agency operational processes.

Home Office Science: Migration and Borders Analysis 3
Executive summary <REDACTED> This paper presents the evidence on language analysis (LA) testing and asylum outcomes in the UK, based mainly on a study of two periods in 2008 and 2009.
In these periods LA was applied in only a small proportion of asylum cases, around 5 per cent of intake. LA is best suited to cases of suspected nationality swapping between nationalities with a linguistic link.1 Five claimed nationalities (Afghans, Eritreans, Kuwaitis, Palestinians and Somalis) accounted for 90 per cent of LA tests, with over one-half of LA tested applicants claiming to be Somalis.
Where LA is applied, candidates are not chosen randomly, and have to consent, so the results of the study have to be interpreted with care.
Caseworkers report that LA is a valuable tool to inform their initial asylum decision and as a piece of robust evidence to present at an appeal hearing.
Across the range of nationalities represented, the use of LA generally corresponded to a xxxxx xxxxx in the proportion of applications that were xxxxx. This suggests that LA has a detection effect on abusive asylum intake.
For those claiming to be xxxxx the ultimate grant rate, including initial decision and appeal, was xx per cent for LA cases but xx per cent for non-LA cases, so xx times the proportion of xx applications were ultimately unsuccessful. For xxxxx and those claiming xxxxx xxxxx, there was no statistically significant difference between LA and non-LA cases.
Within the study, there was no statistically significant link between LA and the likelihood of success at appeal. However, appeal courts did not give substantial weight to LA until a court judgment in favour of it in September 2010. Therefore, LA may reduce the number of successful appeals, and deter unfounded appeals, from September 2010 onwards.
The illustrative modelling suggests that for some nationalities LA unit costs are less than non-LA unit costs, particularly for granted cases. It is difficult to estimate the total net costs and benefits to the UK Border Agency, because some benefits are difficult to quantify in monetary terms and the overall evidence is mixed on decision and appeal times and support costs.
The main LA nationalities are associated with a 21 per cent fall in asylum intake compared with an 11 per cent reduction for all nationalities, but there is no evidence that LA has or has not had a deterrence effect on abusive asylum intake, as any distinct effect LA has cannot be easily separated from other factors.
1 For example, where there is doubt over the claimed nationality of origin and where their alleged true
nationality may also use a language or dialect that is similar to that of the claimed nationality, for example, Somalis and Kenyan Bajuni (Kibajuni).

Home Office Science: Migration and Borders Analysis 4
1. Introduction The UK Border Agency Immigration Group, New Asylum Model (NAM+) team requested Home Office Science: Migration and Borders Analysis to set out the evidence on the impacts, and where possible the costs and benefits of language analysis (LA). This report introduces the background to LA. The data and trends in asylum by nationality are set out and compared with levels and rates of LA across nationalities in section 3. The impact analysis section (section 4) firstly aims to set out what potential impact LA has on asylum case initial decisions, case outcomes, appeals and the time taken to reach the various stages in the asylum process. This is repeated for ‗nationality dispute‘ cases. Secondly, the analysis attempts to identify whether LA has had any impact on abusive claims by deterring nationality swapping. The cost-benefit analysis (section 5) uses the evidence available to set out what key monetised and non-monetised costs and benefits arise from the use of LA in asylum decisions to determine if the benefits (help to inform the decision about whether an applicant is from their claimed country of nationality) outweigh the costs (of the LA analysis). The main costs and benefits of LA are summarised and an illustrative cost model is set out in Annex C to show the possible difference in case and asylum support costs between LA and non-LA cases, based on a number of basic assumptions. A glossary, references and other annexes giving asylum statistics and the key elements of the asylum approach are included at the end of the report. Migration and Border Analysis gratefully acknowledges the co-operation of the UK Border Agency: New Asylum Model team (NAM +), Asylum Screening Unit (ASU), Centre for Applied Science and Technology (CAST), Central Appeals and Litigation (CAL), Migration Statistics, Performance and Change Unit (PCU) and the UK Border Agency Scotland and Northern Ireland region. Any errors or omissions remain the responsibility of the authors.

Home Office Science: Migration and Borders Analysis 5
2. Background Language analysis (LA) involves the use of experts to analyse an individual‘s speech to determine if they are likely or unlikely to be of the nationality that they claim to be. LA examines two separate components of speech:
Form, the analysis of the elemental parts of speech; that is phonology and grammar.
Content; the specific knowledge about local activities, places, customs and habits that a national from that area might have knowledge of.
Wittgenstein stated that, philosophically, language should not be analysed without its landmarks and context (Wittgenstein, 1953). LA is a recent branch of applied linguists. ―The basic assumption underlying such language analysis, one that would not be disputed by linguists, is that the way a person speaks contains clues about their origin‖, Eades (2005). Singler (2004) shows ―the system is reliable‖. In 2004 the Language and National Origin Group published guidelines for the use of LA in determining the country of origin in refugee cases. These include:
linguists advise and governments make nationality decisions;
LA provides a basis for further probing of evidence from an applicant, and not on its own evidence for a substantive decision;
LA is used to determine socialisation (where an individual has learned to speak in that form);
LA is carried out by qualified linguists;
linguists make qualitative not quantitative judgements on the likelihood of socialisation; and
linguists provide specific evidence of their qualification, experience and remain anonymous.
LA has been in use since the 1990s by governments and their agencies (mainly for determining the country of origin of asylum seekers). For example, the Swedish Immigration Authority introduced LA in 1993 and was one of the first countries to use it on a regular basis. The UK Border Agency has similar guidance to that above. In the UK, LA has been used where there is strong suspicion of someone claiming to be a specific nationality and that their alleged true nationality may also use a language or dialect that is similar to that of the claimed nationality, for example, Somalis and Kenyan Bajuni (Kibajuni) or Eritreans and Ethiopians (Amharic). The UK Border Agency uses LA for two purposes: to assist in establishing whether an asylum applicant is from their claimed country of nationality in cases of doubt; and to deter individuals from making fraudulent claims purely because particular countries have a perceived advantage – such as a high grant rate for asylum or humanitarian protection. In the course of piloting LA in the UK, LA was routinely permitted for applicants claiming to be Afghan, Eritrean, Kuwaiti, Palestinian and Somali, for whom Removal and Return Agreements (RRA) were available (but only where there was no Eurodac hit).2 Other nationalities were language tested, but only where it was strongly suspected the applicant had claimed a false identity (and there was no
2 Eurodac is a large database of fingerprints of applicants for asylum and illegal immigrants found within the EU.

Home Office Science: Migration and Borders Analysis 6
Eurodac hit). Such suspicions might arise from the individual providing contradictory documentation, statements or evidence, where they cannot speak the primary language (or are inconsistent in that tongue) and if they have a lack of knowledge about their claimed nationality. Independent pilots on LA were also conducted by Greece, Ireland, Malta and Turkey. The UK Border Agency used LA as part of a range of tools to combat those who seek to abuse the asylum system, so decisions are not based only on LA. An asylum instruction (UK Border Agency, 2011c), details the following:
which cases may be appropriate for LA;
how LA should be arranged;
how to handle LA issues during substantive asylum interviews, in refusal letters and during any appeal.
However a decision will not rely solely on the direct LA report or an applicant‘s failure or refusal to undergo LA. The case owner guidance states that the nationality of an applicant must be assessed by weighing up all of the available evidence, including their interview evidence and any written statement submitted (especially relating to their country knowledge), documentary evidence and any expert reports, as well as the direct LA report. LA has historically been carried out for the UK Border Agency by Sprakab, a Swedish company that has carried out over 40,000 LA reports in ten years of existence. The interview is carried out over the telephone with a Sprakab analyst who speaks the language of the country for which the applicant claims to be a national. The 20- to 30-minute interview is recorded and the applicant is asked a variety of questions designed to obtain information that will help the analyst make a judgement. A preliminary result is communicated to the UK Border Agency within 15 minutes and a written report and transliteration is available at a later date (usually in electronic form within 72 hours with a hard copy to follow). The language report will include a detailed analysis of phonological, morphological and lexical phenomena. If there are doubts about the country of origin a second linguist will review the interview. The analyst‘s experience and qualifications are also included in the report. The final report from Sprakab gives five possible outcomes relating to the country/area the applicant claims to be from.
Applicant speaks language X found with certainty not in the country/area they claim to be from.
Applicant speaks language X found with certainty in the country/area.
Applicant speaks language X found most likely in the country/area.
Applicant speaks language X found likely in the country/area.
Applicant speaks language X found possibly in the country/area. The report will also state the extent of the applicant‘s knowledge of the country, culture and habits. The next stage of the process is the substantive interview with the applicant where any inconsistencies in the LA are put to them and applicants have an opportunity to explain these. This aids the case owner to make an initial decision and LA may be used in any appeals that are made later on.

Home Office Science: Migration and Borders Analysis 7
2.1 Legal issues The risk of legal challenge succeeding over using LA has been considered to be low following the case RB (Linguistic Evidence – Sprakab) Somalia v. Secretary of State for the Home Department (2010) UKUT 329 (IAC) United Kingdom: Upper Tribunal (Immigration and Asylum Chamber), see UNHCR (2010). This case demonstrated the following.
Linguistic analysis reports from Sprakab are entitled to considerable weight. That conclusion derives from the data available to Sprakab and the process it uses. These reports should not be treated as infallible but evidence opposing them will need to address the particular factors identified in a particular report.
Recordings of all material derived from the appellant and used as material for LA should be made available to all parties if the analysis is to be relied on in a tribunal.
Sprakab linguists and analysts are not to be required to give their names (as distinct from their identifiers, experience and qualifications).
The use of LA, from September 2010 onwards, is considered to be robust evidence that is widely acceptable in tribunals and courts. However, there is an extant legal challenge to the Court of Appeal against this decision. The value of LA has been illustrated in the previous testing of sub-Saharan nationalities. Given the current (2011) geopolitical situation in some parts of the Middle East there is a risk that a growing number of asylum seekers may move across Europe towards the UK. Having LA available if this happens could act as a useful tool for case owners to use in cases where an applicant‘s nationality is believed to be in question, and may also help to identify or deter nationality swapping. The following sections aim to set out the evidence base on the monetised and non-monetised impacts and costs and benefits of using LA, and whether it has any potential impacts on abusive claims (by discouraging asylum seekers who may consider participating in nationality swapping).

Home Office Science: Migration and Borders Analysis 8
3. Data and trends: Asylum, nationalities and language analysis Introduction Data on main applicant asylum seekers from 2001 to 2010 are taken from the Home Office, Control of Immigration Statistics. All data are rounded. 3.1 Total asylum applications Main applicant asylum applications peaked at 84,000 in 2002, and have been in almost steady decline since then as demonstrated in Figure 1. In 2010 there were 17,800 asylum applications. Figure 1: Main applicant asylum applications in the UK, 2001 to 2010
71,025
84,130
49,405
33,960
25,71023,610 23,430
25,930 24,485
17,790
0
10,000
20,000
30,000
40,000
50,000
60,000
70,000
80,000
90,000
2001 2002 2003 2004 2005 2006 2007 2008 2009
(P)
2010
(P)
Source: Home Office, Control of Immigration Statistics 2001 to 2010.
Changes to asylum intake over time are not easily explained as they can depend on a number of different and sometimes interrelated drivers. One of the biggest explanatory factors will be geopolitical factors in the source countries. Asylum policy in the destination country and competing destination countries can also affect the propensity to which asylum seekers flow to different countries. For more analysis of asylum and potential drivers, see the Home Office research report: Understanding the Decision Making of Asylum Seekers, (Home Office, 2002). It is also important to note that the drivers of asylum are likely to vary significantly across nationality, ethnic group, religious group and other characteristics of applicants. 3.2 Asylum data by nationality Table 1 below sets out the nationalities of asylum intake where it is equal to one per cent or more of total intake from 2001 to 2010, and the annual volumes and changes for 2009 and 2010.

Home Office Science: Migration and Borders Analysis 9
Table 1: Asylum statistics, by nationality, 2001 to 2010
Total Total Average 2009 2009 2010 2010
(numbers) 2001 to 2010
(%) per year Volume Change on 2008
Volume Change on 2009
Afghanistan 34,720 9 3,472 3,330 -175 1,605 -1,725
Iraq 34,205 9 3,421 845 -1,005 365 -480
Zimbabwe 29,855 8 2,986 5,600 2,435 1,410 -4,190
Somalia 28,720 8 2,872 930 -415 590 -340
Iran 26,090 7 2,609 1,835 -435 1,870 35
China 21,235 6 2,124 1,185 -210 1,000 -185
Pakistan 15,960 4 1,596 1,300 70 1,400 100
Sri Lanka 15,535 4 1,554 1,115 -360 1,360 245
Eritrea 14,325 4 1,433 1,350 -905 710 -640
Turkey 12,070 3 1,207 185 -10 150 -35
India 11,390 3 1,139 615 -100 520 -95
DR Congo 9,340 2 934 205 -130 180 -25
Nigeria 8,910 2 891 680 -140 780 100
Serbia and Montenegro 7,033 2 703 32 -48 26 -6
Sudan 6,220 2 622 215 -50 575 360
Bangladesh 5,225 1 523 440 -15 450 10
Vietnam 4,890 1 489 465 235 440 -25
Algeria 4,830 1 483 235 -110 270 35
Jamaica 4,690 1 469 200 -40 215 15
Sierra Leone 4,265 1 427 80 25 80 0
Angola 4,195 1 420 45 -35 50 5
Albania 4,140 1 414 210 50 170 -40
Romania 3,666 1 367 5 4 5 0
Ethiopia 3,495 1 350 105 -25 95 -10
Palestinian Authority 3,330 1 333 255 -35 185 -70
Uganda 3,305 1 331 155 25 215 60
Cameroon 2,860 1 286 90 -25 85 -5
Burundi 2,420 1 242 20 5 10 -10
Czech Republic 2,289 1 229 0 -1 1 1
Ghana 2,070 1 207 140 0 165 25
Liberia 2,025 1 203 15 -5 15 0
Moldova 2,025 1 203 15 -5 5 -10
Ivory Coast 1,900 1 190 50 -20 40 -10
Kuwait 935 0.2 94 105 -105 100 -5
Unknown nationality (a) 1,065 0.3 107 110 35 210 100
All nationalities 379,475 100 37,948 24,485 1,445 17,800 -6,695 Source: Home Office, Control of Immigration Statistics 2001 to 2010. Note: (a) This includes those who are stateless, British overseas citizens and those whose nationality is unknown.
Key nationalities between 2001 and 2010 include: Afghanistan, Iraq, Zimbabwe, Somalia and Iran, although in 2009 and 2010, intake from Iraq and Somalia was relatively low compared with the long-run average. Intake from Sri Lanka, Pakistan and China was relatively high in both 2009 and 2010. Nationalities where asylum was growing significantly in 2010 include:
Sri Lanka, up 22 per cent from 1,115 to 1,360;
Sudan, up 167 per cent from 215 to 575; and
Uganda, up 39 per cent from 155 to 215. No single identifiable factor explains why asylum intake has increased so much for these nationalities. It is important to note there have been over 1,000 ‗unknown

Home Office Science: Migration and Borders Analysis 10
nationality‘ cases between 2001 and 2010 where the UK Border Agency needs to determine the applicant‘s identity and nationality before making an asylum decision. The number of ‗unknown nationality‘ cases rose by 91 per cent from 110 in 2009 to 210 in 2010. Nationalities for which there are 1,000 or more claimants per year in at least seven out of the ten years include:
Afghanistan (in every year);
Iraq;
Zimbabwe (in every year);
Somalia;
Iran (in every year);
China (in every year);
Pakistan (in nine out of the ten years); and
Eritrea. 3.3 Nationalities for LA tests Between 2006 and March 2010 there were over 2,000 language analysis (LA) tests to support asylum decisions. Table 2 presents the top ten claimed nationalities where LA has been applied since 2008, based on a sample of main applicants between April and September in 2008 and in 2009. All other nationalities where LA has been applied are included in the ‗other‘ category, including the category ‗unknown nationality‘. Table 2: LA tests, by top ten nationality of claim, main applicants,(a) 1 April to 30 September, 2008 and 2009(b) <REDACTED>
Nationality of asylum claim
Number of LA tests(b)
LA tests(b) as % of asylum applications
Asylum grant rate(b)
(%)
2008 period
2009 period
2008 period
2009 period
2008 period
2009 period
Somalia 324 283 xx xx xx xx Afghanistan 23 98 xx xx xx xx Eritrea 81 16 xx xx xx xx Kuwait 10 30 xx xx xx xx Palestinian Authority 7 28 xx xx xx xx Iran 4 11 xx xx xx xx
Zimbabwe 3 11 xx xx xx xx Iraq 3 9 xx xx xx xx Kenya 10 1 xx xx xx xx Sudan 4 4 xx xx xx xx
Unknown nationality(c) 3 15 xx xx xx xx Other 15 49 xx xx xx xx
Total 487 555 4 5 25 20 Source: Analysis of UKBA Management Information. These figures are based on management information. This
information has not been quality assured under National Statistics protocols, is subject to change, and should be treated as provisional.
Note: (a) The data refer to main applicants only and exclude dependants. (b) The sample period refers to 1
April 2008 to 30 September 2008 and the same period in 2009. The
proportion of asylum applications and grant rate refers to this time period only, not the whole year. (c) Includes ‗refugee-other‘ cases only.
Table 2 shows that in 2008 and 2009, LA was applied mainly to cases involving claims to be from Somalia and, to a lesser extent, Afghanistan and Eritrea. In

Home Office Science: Migration and Borders Analysis 11
addition, a relatively high share of cases claiming to be from Kuwait and Palestine involved LA, compared with their overall asylum intake. xxxxx xxxxx generally had xxxxx grant rates than the average for all countries, with grant rates xxxxx xx per cent for xxxxx and xxxxx in both 2008 and 2009, compared with between 20 per cent and 25 per cent for all applicants. In the periods analysed, just five countries accounted for 90 per cent of all LA tests, with Somalia having a dominant share. LA has also been applied to nationals of a number of other countries but the numbers are relatively small and represent only a very small proportion of their asylum applications overall. In the 2008 period, just six countries accounted for 95 per cent of all LA tests and in the 2009 period, the top six countries accounted for 84 per cent of all tests. The nationalities where LA has been applied can be broken down into high intake nationalities and low intake but high LA tested nationalities. Key high intake nationalities where LA tests have been applied include:
Somalia (intake of 1,092 with xx LA cases in the sample);
Afghanistan (intake of 3,288 with xx LA cases in the sample);
Eritrea (intake of 1,774 with xx LA cases in the sample);
Iran (intake of 1,931 with only xx LA cases in the sample);
Zimbabwe (intake of 3,752 with only xx LA cases in the sample)); and
Iraq (intake of 1,031 with only xx LA cases in the sample.
In addition, LA has been applied to certain low intake nationalities:
Kuwait (intake of 121 with xx LA cases in the sample);
Palestine (intake of 204 with xx LA cases in the sample); and
‗unknown nationality‘ (intake of 78 with xx LA cases in the sample). Overall, LA was applied in only a small proportion of asylum cases (around five per cent of intake), and it was applied to only a small number of nationalities.

Home Office Science: Migration and Borders Analysis 12
4. Analysis of the impacts of language analysis tests The key elements of the asylum system are set out in Annex B. These include the process to an initial decision, the Asylum and Immigration Tribunal (AIT) appeals, and onward appeals to higher courts. Each case should result in either integration (asylum grant) or removal. Language analysis (LA) is an option in the process to an initial decision. To understand the impact of LA testing, it is important to look at two separate effects that could arise from applying LA tests.
The impact of LA tests on asylum decisions – there should be additional information that assists case owners to come to an initial decision. This should increase the quality of decision about whether an applicant is from their claimed country of nationality in cases of doubt, potentially reducing the number of sustained appeals.
The impact of LA tests on asylum applicant behaviour – the deterrence associated with LA tests is either that: potentially deceptive applicants are deterred from applying altogether or, if applicants continue to apply, they do not attempt to claim to be from a different nationality.
The first effect can be analysed by comparing, for the same nationality, the decision outcomes of cases where LA tests have been applied with cases where LA has not been applied. This will inform both the costs of LA testing (the cost of the test itself plus any increase in decision-making time) against the benefits of applying LA tests, either through a better informed decision (which may be a grant or a refusal), an earlier decision, or a higher rate of dismissed appeals (if it can be shown that LA results helped to inform the appeal decision). This paper aims to set out both the quantitative and qualitative evidence of the impacts of LA on asylum decision making. The second effect is more complicated to quantify analytically, mainly because the counterfactual for asylum intake is difficult to construct. As discussed above, asylum intake is driven by a number of complicated factors, and analysis of whether LA tests affect an applicant‘s decision to fraudulently apply for asylum (if such an effect exists at all) will be difficult to isolate from other factors across key intake nationalities. In addition, such analysis cannot take into account any behavioural change by applicants outside LA testing that could influence abusive intake. This paper aims to provide some quantitative data analysis that explores the relationships between LA testing and asylum intake. There is an assessment of what the benefits would be from any deterrence effect on abusive claims, based on an illustrative cost model. The rest of this section considers the available evidence pertaining to each of these two effects.

Home Office Science: Migration and Borders Analysis 13
4.1 Impacts of LA tests: UKBA case decisions and outcomes Section 4.1 covers two areas of information regarding LA. Firstly it highlights evidence gathered from two pilots around the effectiveness of LA tests at identifying whether an applicant is from their claimed country of nationality in cases of doubt. Secondly, it sets out the differences in case outcomes by nationality for LA and non-LA cases for all asylum cases and for nationality dispute cases (which may or may not be more complex). A summary of this evidence is provided at the end of this section. When interpreting the analyses in this and the following sections two issues need to be considered.
Changes to asylum intake over time are not easy to explain. They can depend on a number of different and sometimes interrelated drivers, especially geopolitical factors in the source countries, asylum policy in the destination country and in competing destination countries. The drivers of asylum can vary across different groups of claimants so both LA and non-LA cases are affected by these factors. It is very difficult to isolate the impact of one factor on changes in asylum intake.
Tribunals and courts did not give significant weight to LA until a court judgment in favour of it in September 2010. This may mean that LA will in all likelihood have a greater effect on decisions and appeals from September 2010 onwards compared with the period of data analysis in 2008 and in 2009.
Cases can therefore be complex regardless of whether LA is used or not. Cases can take longer to come to an initial decision or may go to an appeal due to a variety of factors, not just the use of LA. 4.1.1. Evidence from LA test pilots on the effectiveness of LA 2007 LA pilot The 2007 pilot covered the period 7 May 2007 to 16 September 2007. In this pilot, 102 applicants purporting to be Somalis participated in LA tests. The analysis suggests the following origins, with just over one-half not from Somalia:
Kenya (51%);
southern Somalia (30%);
northern Somalia (9%);
central Somalia (4%);
Somalia (not specified) (4%); and
Yemen (3%). Of all the Swahili speakers who claimed they were Kibajuni speakers and who participated in LA tests, all of them were found to be Kenyan and not Somalis. This implies that in the previous 12 months, out of 280 Somali applications for asylum, perhaps 16 per cent were actually Kenyans. The pilot also indicated that in the previous 12 months, of the Arabic speaking Somali applications, approximately 32 Yemenis (2%) were claiming to be Somalis.

Home Office Science: Migration and Borders Analysis 14
In addition, 37 Eritreans undertook LA and were found to be probably:
Ethiopian (60%); and
Eritrean (40%). The 2007 pilot found that Amharic speaking Eritrean claimants had the greatest proportion of results suggesting that they were Ethiopian rather than Eritrean. Therefore, half way through the testing period Tigre and Tigrinya speaking claimants were excluded as they mostly proved to be Eritrean. Once this switch was made all Amharic speakers were found to be or found likely to be Ethiopian rather than Eritrean. This pilot indicated that LA is a useful tool in establishing the linguistic source of claimants where it is applied to specific nationalities who claim to speak a particular language. 2008 to 2010 LA pilot During the period 28 February 2008 to 31 March 2010 LA was used in the UK, funded by the Foreign and Commonwealth Office (FCO). As at March 2008, LA testing was routinely permitted for those claiming to be Somalis, Afghans and Kuwaitis. Palestinians were tested from January 2009 whilst other nationalities were tested on a case-by-case basis (where there were strong doubts as to the applicant‘s nationality). The main outcomes were compared against the targets (the key success indicators as stated by the FCO) for this pilot and are set out in Table 3. One of the unplanned outcomes of the project was that LA testing was instrumental in identifying a previously unknown high rate of nationality swapping. The proportion of applicants claiming to be Palestinians but confirmed as Egyptians dropped from 77 per cent to 58 per cent and the proportion of applicants claiming to be Kuwaitis but confirmed as Egyptians dropped from 42 per cent to 22 per cent. This result led to the targeting of these and several other nationalities to combat nationality swapping. It appears that LA had an important impact on informing the decision of whether an applicant is from their claimed country of nationality in cases where doubt existed. The results from the 2008 to 2010 pilot reinforced those from the 2007 pilot, and provided evidence to support the use of LA as a tool to help inform asylum decisions for particular nationality cases. 4.1.2. Comparison between 2008 and 2009 LA case outcomes The pilots appeared to provide a clear benefit of LA testing in terms of the additional insight into individual applications for asylum where there were concerns over the genuineness of the claimed nationality. It is noted, however, that LA is only one of several tools used by decision makers.

Home Office Science: Migration and Borders Analysis 15
Table 3 Outcomes from the language analysis pilot, February 2008 to March 2010
Outputs Key success indicator as stated by the FCO
End result – outcomes
Number of LA reports 2,500 LA reports 2,700 LA reports produced
Proportion of applications failing following LA tests, and subsequent removals and removal activity commenced
Between 9% and 15% 31% (850) cases were found to be not from the claimed country of origin
Number selected for LA 400 individuals tested 540 tests carried out (and 40 new nationalities were tested)
Amount of removal activities started, including redocumentation
Target not quantified in proposal
Difficult to quantify because LA is only ever part of the decision-making process
Lower unit costs and increased knowledge for the UK Border Agency
£320 + 25% VAT (Swedish) for each analysis, plus the cost of a transliteration when required
Costs remained the same –no transfer of knowledge was possible because the work is highly specialised
Good practice produced regarding the roll-out of LA to a wider range of claimed nationalities
No current in-house knowledge regarding the effectiveness and the difficulties of extending LA to other nationalities
LA was opened up to all nationalities at the beginning of 2009
New baseline details on nationality swapping
Data from the 2007 pilot suggested that nationality swapping for Kenyans claiming to be Somali was ‗significant‘ and stood at over 50% of the Somali applicants tested
The proportion of Somalis identified as likely to be Kenyan – at the end of the project was 17%; 100% of Amharic speaking Eritreans were likely to be Ethiopian; 3% of Afghans were likely to be Pakistani; 58% of Palestinians and 23% of Kuwaitis were likely to be Egyptian; and 69% of Sudanese were likely to be from Darfur (western Sudan).
Source: Analysis of UKBA LA pilot outcomes 2010. These figures are based on management information. This information has not been quality assured under National Statistics protocols, is subject to change, and should be treated as provisional.
To supplement the evidence on the potential benefits of LA in the decision-making process, case outcomes were compared for cases from the same nationality where LA was and was not used to inform the asylum decision. This comparison will not provide a full picture as it was not able to take into account other differences in case types that could affect asylum case outcomes, but it does allow for an initial comparison of the LA cohort against a suitable control group. If the two groups can be considered similar in terms of characteristics, any difference in case outcomes could indicate the impact of LA (all else being equal).

Home Office Science: Migration and Borders Analysis 16
Section 4.1.3 focuses on comparing the outcomes for all asylum cases, which will include a mix of both straightforward and more complex cases. The subsequent section focuses on comparing outcomes for a smaller cohort of ‗nationality dispute‘ cases, which may or may not be more complex cases, and may provide a better means to control for the complexity of cases in which LA is applied. 4.1.3 Analysis of all asylum cases LA versus non-LA outcomes Dataset and issues The data that were provided for this analysis was extracted from the UK Border Agency casework information database (CID) for the period 1 April 2008 to 30 September 2008 and the same period in 2009, covering main applicants claiming asylum at ports, the Asylum Screening Unit (ASU), or at Local Enforcement Offices (LEOs). The data are split into two main groups.
Those claimants who were LA tested (1,042 cases, approximately 5% of all cases).
Claimants who did not undergo LA (22,279 cases, approximately 95% of all cases).
A comparison of case outcomes is possible but the results could be skewed. One important possible cause of this would be bias within the group. Bias may be caused by self-selection and also by similar characteristics and attributes being present in the types of case that prompt the application of LA. It is not clear how other factors affect the outcomes. Given these factors it is difficult to make comparisons so any findings should be treated as indicative, especially with subgroups where the sample sizes are very small. Table 2 (in section 3.3 above), presents the primary claimed nationalities that were tested during the period. These were Somalis, Eritreans, Afghans, Kuwaitis and Palestinians (note: the use of LA for Eritreans was suspended part way through the pilot, which is reflected in the smaller number of tests on Eritreans in the 2009 period). Overall, LA only covered a small proportion (around 5%) of overall asylum applications over the period of the sample. Case outcomes Table 4 shows a comparison of initial decision outcomes for non-LA cases and LA cases by nationality in the dataset for the sample period in 2008 and in 2009. There are a number of possible initial outcomes for asylum cases; for the purposes of the analysis in this report, the outcomes have been grouped into categories of ‗granted‘, ‗refused‘, ‗withdrawn‘ and ‗other‘. A significantly larger share of non-LA cases (21%) compared with LA cases (5%) fell under either ‗withdrawn‘ or ‗other‘. This is likely to be because LA is more appropriate for substantive cases and less likely to be used in cases where a refusal is made on ‗other‘ grounds or because of administrative non-compliance, where case outcomes are included in the ‗other‘ category.

Home Office Science: Migration and Borders Analysis 16
Table 4 Comparison of initial decision outcomes of non-LA cases with LA cases, main applicants only, by nationality, 2008 and 2009 <REDACTED>
All decisions (a) xxxxx xxxxx xxxxx xxxxx xxxxx xxxxx xxxxx
Non-LA LA Non-LA LA Non-LA LA Non-LA LA Non-LA LA Non-LA LA Non-LA LA
All applications 3,167 xx 1,677 xx 81 xx 169 xx 485 xx 78 xx 16,622 xx Granted xx% xx% xx% xx% xx% xx% xx% xx% xx% xx% xx% xx% xx% xx% Refused xx% xx% xx% xx% xx% xx% xx% xx% xx% xx% xx% xx% xx% xx% Withdrawn 15% 6% 4% 2% 10% 3% 26% 6% 8% 2% 9% 0% 14% 4% Other 17% 1% 26% 6% 4% 0% 15% 0% 13% 1% 5% 0% 4% 0% No initial decision 4% 4% 3% 0% 0% 8% 8% 3% 10% 3% 0% 0% 5% 6%
All grant and refusal decisions only
Grant or Refusal decision 2,023 xx 1,125 xx 70 xx 87 xx 331 xx 67 xx 12,786 xx Granted xx% xx% xx% xx% xx% xx% xx% xx% xx% xx% xx% xx% xx% xx% Refused xx% xx% xx% xx% xx% xx% xx% xx% xx% xx% xx% xx% xx% xx%
Chi Square statistic 0.4434 16.7903 9.4909 4.1500 46.533 0.0093 0.2993
P-value (b) 0.5055 0.0000 0.0021 0.0416 0.0000 0.9233 0.5843 Source: Analysis of UKBA management information. These figures are based on management information. This information has not been quality assured under National Statistics protocols, is subject to change, and should be treated as provisional. Note: (a) The grouping of initial decisions used here is taken from the New Asylum Model team (NAM +) advice. The initial decision category ‗other‘ groups those grant or refusal decisions that clearly are not
based upon extensive investigation of a claimant‘s nationality. (b) The results that are statistically significant at the five per cent level or below (as indicated by the p-value) are in bold using a Chi Square test on the actual values, comparing observed and expected
values.
Table 5 Comparison of appeal outcomes for non-LA cases and LA cases, main applicants only by nationality, 2008 and 2009 <REDACTED>
All decisions(a)
xxxxx xxxxx xxxxx xxxxx xxxxx xxxxx xxxxx
Non-LA LA Non-LA LA Non-LA LA Non-LA LA Non-LA LA Non-LA LA Non-LA LA
Appeal rate (against all decisions) 33% 46% 16% 39% 32% 62% 38% 79% 28% 54% 22% 28% 53% 68%
Any appeal outcome 1,006 xx 254 xx 26 xx 59 xx 120 xx 17 xx 8,295 xx
Dismissed xx% xx% xx% xx% xx% xx% xx% xx% xx% xx% xx% xx% xx% xx%
Allowed xx% xx% xx% xx% xx% xx% xx% xx% xx% xx% xx% xx% xx% xx%
Chi Square statistic 0.0296 0.0013 1.6252 0.0726 0.0014 0.9733 3.5068
P-value (b) 0.8633 0.9712 0.2024 0.7876 0.9703 0.3239 0.0611
Source: Analysis of UKBA Management Information. These figures are based on management information. This information has not been quality assured under National Statistics protocols, is subject to change, and should be treated as provisional. Note: (a) The grouping of appeal outcomes used here is taken from NAM + advice and excludes cases that are referred, abandoned or struck out. (b) The results that are statistically significant at the five per cent level or below (as indicated by the p-value) are in bold using a Chi Square test on the actual values, comparing
observed and expected values.

Home Office Science: Migration and Borders Analysis 17
Table 4 sets out case outcomes both for all cases where there is a decision outcome, and also for cases where the initial outcome is either ‗refused‘ or ‗granted‘ by nationality. In the case of xxxxx, xxxxx, xxxxx and xxxxx, the use of LA was associated with statistically significantly xxxxx grant rates. There is no evidence to support any statistically significant difference for xxxxx, xxxxx xxxxx and xxxxx xxxxx xxxxx nationalities. It should be noted from Table 4 that xxxxx xxxxx had a xxxxx xxxxx grant rate, regardless of whether they were an LA case or not and that xxxxx xxxxx xxxxx xxxxx had a xxxxx xxxxx refusal rate. One potential explanation for the results is that LA helps to inform decisions in cases where the applicant‘s nationality is confirmed as being from some other origin but not that which is claimed. Alternatively, the results could be due to unobservable characteristics associated with LA cases. It is not possible to say with certainty which factor accounts for the difference or whether it is due to a combination of factors. Where a grant is appropriate, any time saved in making the decision has a positive cost implication for the UK Border Agency. Similarly, refusing an abusive claim would result in a saving to the UK Border Agency. Table 5 sets out the difference between LA cases and non-LA case outcomes at appeal by nationality. The appeal rate against the initial decisions in 2008 and 2009 was 54 per cent (500) for LA cases and 46 per cent (9,800) for non-LA cases. All of the appeals had a clear appeal outcome (i.e. the appeal was decided rather than being withdrawn or void). While there were notable differences in appeal success rates between nationalities there were no significant differences between LA and non-LA cases. LA does not seem to be associated with any difference in appeal outcomes. None of the main LA tested nationalities demonstrated any statistically significant difference. As there are many other factors that affect the appeal outcome it is unlikely that LA has any real impact on appeal outcomes. During the period of the analysis, courts did not always give LA significant weight and it was not until September 2010 that LA was considerably strengthened as evidence before the courts (see UNHCR, 2010). This may be one explanatory factor as to why LA had no statistically significant impact on appeal outcomes. However, other factors may affect appeal cases especially if, in general, they are more complex. Table 6 presents the outcomes for both ‗initial decisions‘ and ‗appeal outcomes‘ summed together. The ‗grant/allowed appeal‘ and the ‗refused/dismissed appeal‘ are presented as a proportion of the initial decisions. Cases where the initial decision resulted in some other outcome and where the appeal did not reach a conclusion are excluded from this analysis. For xxxxx, xxxxx and xxxxx the differences are statistically highly significant. For xxxxx they are statistically significant at the five per cent level. Thus, if the results of the appeals are taken into account, the association of LA with xxxxx grant rates holds for virtually all the nationalities considered. It may be that other factors explain these changes and it is

Home Office Science: Migration and Borders Analysis 18
not possible to say with certainty that LA is responsible for them. Where nationality is not known the grant rate is xxxxx xxxxx but it is not statistically significant. Table 6 Comparison of outcomes from initial decision and appeal outcomes for non-LA cases and LA cases, by nationality, 2008 and 2009 <REDACTED>
All decisions(a) xxxxx xxxxx xxxxx xxxxx
Non-LA LA Non-LA LA Non-LA LA Non-LA LA
Cases initially ‘granted’ or ‘refused’ 2,023 xx 1,125 xx 70 xx 87 xx
Ultimately granted (b) xx% xx% xx% xx% xx% xx% xx% xx%
Ultimately refused (b xx% xx% xx% xx% xx% xx% xx% xx%
Chi Square statistic 0.3024 6.8924 12.2496 3.7224 P-value (c) 0.5824 0.0087 0.0005 0.0537
All decisions(a) xxxxx xxxxx xxxxx
Non-LA LA Non-LA LA Non-LA LA
Cases initially ‘granted’ or ‘refused’ 331 xx 67 xx 12,786 xx
Ultimately granted (b) xx% xx% xx% xx% xx% xx%
Ultimately refused (b) xx% xx% xx% xx% xx% xx%
Chi Square statistic 10.5867 0.9000 5.3220
P-value (c) 0.0011 0.3428 0.0211 Source: Analysis of UKBA Management Information. These figures are based on management information. This information has not been quality assured under National Statistics protocols, is subject to change, and should be treated as provisional. Note: (a) The grouping of initial decisions used here is taken from NAM + advice. The initial decision category ‗other‘ groups
are those grant or refusal decisions that clearly are not based upon extensive investigation of a claimant‘s nationality. (b) Ultimately granted‘ cases are those that were either initially granted or that were successful at appeal. ‗Ultimately
refused‘ cases were initially refused and not subsequently successfully appealed. (c) ‗The results that are statistically significant at the five per cent level or below (as indicated by the p-value) are in bold
using a Chi Square test on the actual values, comparing observed and expected values.
Figure 2 Total grant rate (from initial decisions and appeals), 2008 and 2009 <REDACTED>
Figure 2 has been redacted
Source: Analysis of UKBA Management Information. These figures are based on management information. This information has not been quality assured under National Statistics protocols, is subject to change, and should be treated as provisional.
For those nationalities that demonstrate statistical significance at the five per cent level, generally xxxxx LA cases are ‗ultimately granted‘ compared with non-LA

Home Office Science: Migration and Borders Analysis 19
cases. This is demonstrated clearly in Figure 2. Similarly, xxxxx LA cases are ‗refused‘ or ‗dismissed‘ for this group. Again, it is not possible to identify a causal relationship between the two groups and the decision to ‗granted/allowed‘ compared with ‗refused/dismissed‘. For xxxxx and those of xxxxx the non-LA and LA proportions are relatively similar and do not show any statistically significant difference. Timing between asylum process stages Table 7 sets out the time taken to reach various asylum case decision points and how this varies between non-LA cases and LA cases. This is done for the main LA tested nationalities using the median and 90th percentile. The median value is the measure of central tendency that occupies the middle position in a rank order of values, so that 50 per cent of cases are processed by the median time. The 90th percentile value states that at least 90 per cent of the values in the sample are less than or equal to this value. For those groups where grant decisions are made more quickly for LA cases, there may be some savings to the UK Border Agency stemming from reduced asylum support costs for such cases. In addition, there may be further benefits if the case owner spends less time on the decision (as the LA test helps reduce their decision-making time). The 90th percentile results do not always follow the pattern of the medians. In general terms non-LA cases tended to be quicker but the exception was for xxxxx, where LA cases were xxxxx (except ‗removal‘). This is probably explained by other factors or case complexity causing case delays. For all except the xxxxx group, the reported 90th percentiles were based on a very small number of extreme cases and therefore should not be regarded as robust figures; for xxxxx, however, it can be concluded that LA is associated not just with xxxxx xxxxx in typical decision times but also with xxxxx xxxxx in the more extended times. The pattern for times at appeal stage was even more mixed and did not allow any overall conclusion to be reached. For xxxxx, xxxxx xxxxx xxxxx xxxxx xxxxx xxxxx xxxxx, median appeal times were not materially affected by whether or not they were LA cases, in contrast with the very clear association with initial decision times. For the later stages in the asylum process, such as appeal rights exhausted (ARE) and removal, the results indicated that LA cases took longer than non-LA cases. The only nationalities that did not show this pattern include:
Eritreans, non-LA removal was 157 days compared with 147 for LA; and
Palestinians, ARE was 257 days for non-LA compared with 161 for LA. These exceptions aside, this could potentially lead to higher downstream processing (difficulties in getting the relevant documents, etc.) and asylum support costs that need to be balanced against any upfront savings from increased grants and the associated reduction in processing and support costs for those cases. The overall impact on UKBA costs is discussed in section 5.

Home Office Science: Migration and Borders Analysis 20
Table 7: Volumes, median time (days) and the 90th percentile to each stage of the process, 2008 and 2009 <REDACTED>
xxxxx
Number reaching this stage Median time, days
90th percentile, days
Non-LA LA Non-LA LA Non-LA LA
Any initial decision (a)
xx xx xx xx xx xx
'Grant' xx xx xx xx xx xx
'Refusal' xx xx xx xx xx xx
Any appeal outcome xx xx xx xx xx xx
Allowed xx xx xx xx xx xx
Dismissed xx xx xx xx xx xx
Appeal rights exhausted 574 29 196 251 432 665
Removal 663 5 69 179 510 536
xxxxx
Number reaching this stage Median time, days
90th percentile, days
Non-LA LA Non-LA LA Non-LA LA
Any initial decision (a)
xx xx xx xx xx xx
'Grant' xx xx xx xx xx xx
'Refusal' xx xx xx xx xx xx
Any appeal outcome xx xx xx xx xx xx
Allowed xx xx xx xx xx xx
Dismissed xx xx xx xx xx xx
Appeal rights exhausted 166 25 169 201 459 494
Removal 238 7 157 147 482 637
xxxxx
Number reaching this stage Median time, days
90th percentile, days
Non-LA LA Non-LA LA Non-LA LA
Any initial decision (a)
xx xx xx xx xx xx
'Grant' xx xx xx xx xx xx
'Refusal' xx xx xx xx xx xx
Any appeal outcome xx xx xx xx xx xx
Allowed xx xx xx xx xx xx
Dismissed xx xx xx xx xx xx
Appeal rights exhausted 16 16 210 223 459 494
Removal 4 0 86 - 482 637
xxxxx
Number reaching this stage Median time, days
90th percentile, days
Non-LA LA Non-LA LA Non-LA LA
Any initial decision (a)
xx xx xx xx xx xx
'Grant' xx xx xx xx xx xx
'Refusal' xx xx xx xx xx xx
Any appeal outcome xx xx xx xx xx xx
Allowed xx xx xx xx xx xx
Dismissed xx xx xx xx xx xx
Appeal rights exhausted 42 20 257 161 509 424
Removal 26 1 73 242 581 242 Source: Analysis of UKBA Management Information. These figures are based on management information. This information
has not been quality assured under National Statistics protocols, is subject to change, and should be treated as provisional
Note: (a) ‘Any initial decision‘ excludes decisions made on an earlier date than or on the same date as the application. The recorded dates of these decisions are assumed to be void. The grouping of initial decisions used here is taken from NAM + advice.

Home Office Science: Migration and Borders Analysis 21
Table 7 (continued): Volumes, median time (days) and the 90th percentile to each stage of the process, 2008 and 2009 <REDACTED>
xxxxx
Number reaching this stage Median time, days
90th percentile, days
Non-LA LA Non-LA LA Non-LA LA
Any initial decision (a)
xx xx xx xx xx xx
'Grant' xx xx xx xx xx xx
'Refusal' xx xx xx xx xx xx
Any appeal outcome xx xx xx xx xx xx
Allowed xx xx xx xx xx xx
Dismissed xx xx xx xx xx xx
Appeal rights exhausted 82 160 204 211 414 410
Removal 38 3 107 336 433 460
xxxxx
Number reaching this stage Median time, days
90th percentile, days
Non-LA LA Non-LA LA Non-LA LA
Any initial decision (a)
xx xx xx xx xx xx
'Grant' xx xx xx xx xx xx
'Refusal' xx xx xx xx xx xx
Any appeal outcome xx xx xx xx xx xx
Allowed xx xx xx xx xx xx
Dismissed xx xx xx xx xx xx
Appeal rights exhausted 14 1 233 406 347 406
Removal 4 0 104 - 171 -
xxxxx
Number reaching this stage Median time, days
90th percentile, days
Non-LA LA Non-LA LA Non-LA LA
Any initial decision (a)
xx xx xx xx xx xx
'Grant' xx xx xx xx xx xx
'Refusal' xx xx xx xx xx xx
Any appeal outcome xx xx xx xx xx xx
Allowed xx xx xx xx xx xx
Dismissed xx xx xx xx xx xx
Appeal rights exhausted 5,094 61 174 196 381 333
Removal 2,960 17 103 202 380 304 Source: Analysis of UKBA Management Information. These figures are based on management information. This information
has not been quality assured under National Statistics protocols, is subject to change, and should be treated as provisional
Note: (a) ‘Any initial decision‘ excludes decisions made on the same day as the application. These are assumed to be void. The grouping of initial decisions used here is taken from NAM + advice.

Home Office Science: Migration and Borders Analysis 22
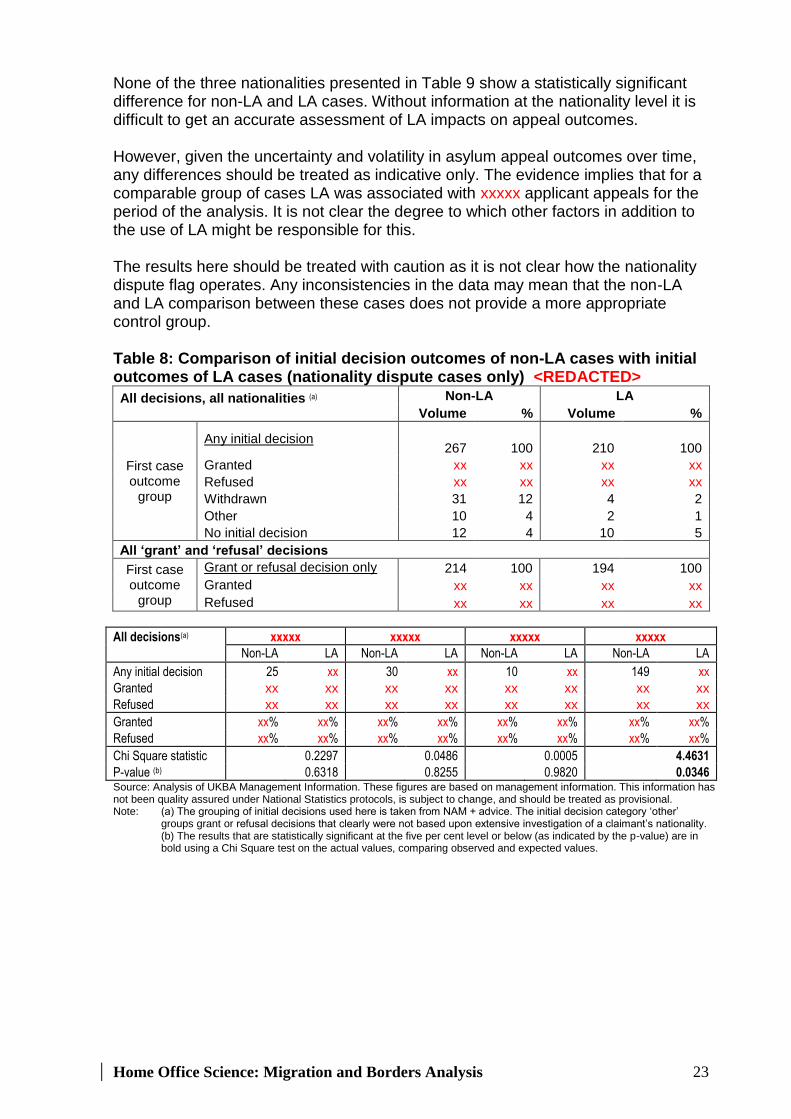
Analysis of nationality dispute cases Using the same dataset, it is possible to compare outcomes of non-LA and LA cases that are termed ‗nationality dispute‘. As there are smaller volumes in the nationality dispute category the results for ‗all nationalities‘ are given. In Tables 8 and 9 results for Afghans, Eritreans and Somalis only are presented. Family cases are more likely to be complex even though LA is applied only to the main applicant. There are some minor issues with regard to the recording of nationality dispute cases in casework systems, as these can change over time. The nationality dispute sample is significantly smaller than the overall sample: a total of 451 nationality dispute cases in the sample; of which 199 used LA and 252 did not use LA. Nevertheless, these data allow the analysis of differences in case outcomes between LA and non-LA cases and provide some indicative findings based on cases that should be broadly more comparable. Case outcomes Table 8 shows a comparison of initial decision outcomes for nationality dispute non-LA cases and LA cases for three nationality groups and for xxxxx. As in Table 4 (all cases), the proportion of cases with ‗withdrawn‘ and ‗other‘ initial decisions was higher for non-LA cases (16%) than for LA cases (3%). The analysis of cases that had a ‗granted‘ or ‗refused‘ decision only showed that the grant rate for nationality dispute cases was xxxxx for LA cases (xx%) than for non-LA cases (xx%). This is similar to the findings for most of the main LA tested nationalities in Table 4. Accordingly, the refusal rate is xxxxx for LA cases (xx%) compared with non-LA cases (xx%). Again, it is difficult to infer a causal relationship between LA and decision outcomes for the nationality dispute cases. There may be other factors that contribute to the result, for example, these cases may be complex regardless of whether LA was used or not. It was possible to analyse initial decision outcomes for only three nationalities, but there was insufficient data for nationality dispute cases at the nationality level to allow a complete analysis, so the full disaggregation presented in the previous tables is not provided here. Table 9 shows a comparison of appeal rates and outcomes for nationality dispute non-LA cases and LA cases. A higher proportion of LA cases (78%) than non-LA cases (61%) went to appeal. This may be because a higher proportion of LA cases were refused over this period and this led to more appeals, or there may be other unexplained factors driving this. However, in the absence of other information, it appears the use of LA in this period for nationality dispute cases tended to lead to more applicants appealing against the initial decisions. In terms of appeal outcomes, a xxxxx proportion of appeals were allowed in LA cases (xx%) compared with non-LA cases (xx%). This may be due to the relative lack of weight given to LA by the courts during this period. Conversely, a xxxxx proportion of cases were dismissed on appeal for LA cases (xx%) compared with non-LA cases (xx%).
Home Office Science: Migration and Borders Analysis 23
None of the three nationalities presented in Table 9 show a statistically significant difference for non-LA and LA cases. Without information at the nationality level it is difficult to get an accurate assessment of LA impacts on appeal outcomes. However, given the uncertainty and volatility in asylum appeal outcomes over time, any differences should be treated as indicative only. The evidence implies that for a comparable group of cases LA was associated with xxxxx applicant appeals for the period of the analysis. It is not clear the degree to which other factors in addition to the use of LA might be responsible for this. The results here should be treated with caution as it is not clear how the nationality dispute flag operates. Any inconsistencies in the data may mean that the non-LA and LA comparison between these cases does not provide a more appropriate control group. Table 8: Comparison of initial decision outcomes of non-LA cases with initial outcomes of LA cases (nationality dispute cases only) <REDACTED>
All decisions, all nationalities (a)
Non-LA LA
Volume % Volume %
First case outcome
group
Any initial decision 267 100 210 100
Granted xx xx xx xx
Refused xx xx xx xx
Withdrawn 31 12 4 2
Other 10 4 2 1
No initial decision 12 4 10 5
All ‘grant’ and ‘refusal’ decisions
First case outcome
group
Grant or refusal decision only 214 100 194 100
Granted xx xx xx xx
Refused xx xx xx xx
All decisions(a) xxxxx xxxxx xxxxx xxxxx
Non-LA LA Non-LA LA Non-LA LA Non-LA LA
Any initial decision 25 xx 30 xx 10 xx 149 xx
Granted xx xx xx xx xx xx xx xx
Refused xx xx xx xx xx xx xx xx
Granted xx% xx% xx% xx% xx% xx% xx% xx%
Refused xx% xx% xx% xx% xx% xx% xx% xx%
Chi Square statistic 0.2297 0.0486 0.0005 4.4631
P-value (b) 0.6318 0.8255 0.9820 0.0346 Source: Analysis of UKBA Management Information. These figures are based on management information. This information has not been quality assured under National Statistics protocols, is subject to change, and should be treated as provisional. Note: (a) The grouping of initial decisions used here is taken from NAM + advice. The initial decision category ‗other‘
groups grant or refusal decisions that clearly were not based upon extensive investigation of a claimant‘s nationality. (b) The results that are statistically significant at the five per cent level or below (as indicated by the p-value) are in bold using a Chi Square test on the actual values, comparing observed and expected values.

Home Office Science: Migration and Borders Analysis 24
Table 9 Comparison of appeal outcomes of non-LA cases and of LA cases (nationality dispute cases only), 2008 and 2009 <REDACTED>
Appeal rate and outcome (a)
Non-LA LA
Volume % Volume %
Appeal Appeal rate (against all decisions) - 61 - 78
Appeal outcome
Any clear appeal outcome 154 100 155 100
Allowed xx xx xx xx
Dismissed xx xx xx xx
xxxxx xxxxx xxxxx xxxxx
non-LA LA non-LA LA non-LA LA non-LA LA
Any appeal outcome 19 xx 18 xx 8 xx 109 xx
Allowed xx% xx% xx% xx% xx% xx% xx% xx%
Dismissed xx% xx% xx% xx% xx% xx% xx% xx%
Chi Square statistic 0.6716 0.2030 1.9446 0.2506
P-value(b)
0.4125 0.6523 0.1632 0.6167 Source: Analysis of UKBA Management Information. These figures are based on management information. This information
has not been quality assured under National Statistics protocols, is subject to change, and should be treated as provisional.
Note: (a) The grouping of appeal outcomes used here is taken from NAM + advice and excludes cases that are referred, abandoned or struck out.
(b) The results that are statistically significant at the five per cent level or below (as indicated by the p-value) are in bold using a Chi Square test on the actual values, comparing observed and expected values.
Timing between asylum process stages (nationality dispute cases only) Table 10 sets out the difference in timings to reach various asylum case decision points between non-LA cases and LA cases for nationality dispute cases only. As in Table 7 the time is given as the median and the 90th percentile, days to outcome results. The outcome of the initial decision (‗granted‘ or ‗refused‘) for xxxxx and xxxxx was xxxxx for LA cases than for non-LA cases. For xxxxx the decision time was xxxxx for LA appeals. The results were mixed for xxxxx at both initial decision and appeal. The results for xxxxx indicated that LA cases were generally xxxxx. However, given the small volumes involved it is difficult to obtain robust results and these should be treated with caution. Overall, it appears that for nationality dispute cases, LA cases had faster outcomes than non-LA cases at the initial decision stage, with little difference in outcomes at appeal or further downstream. This indicates LA may be having a positive impact on asylum initial decision performance, and could lead to process and asylum support savings as a result. The overall impact on the UK Border Agency resource costs is discussed in section 5.

Home Office Science: Migration and Borders Analysis 25
Table 10: Time to each stage of the process (nationality dispute cases only), 2008 and 2009 <REDACTED>
xxxxx Decision stage
Volume Median time (days) 90th percentile (days)
non-LA LA non-LA LA non-LA LA
Any initial decision (a) xx xx xx xx xx xx
Granted xx xx xx xx xx xx
Refused xx xx xx xx xx xx
Any appeal outcome xx xx xx xx xx xx
Allowed xx xx xx xx xx xx
Dismissed xx xx xx xx xx xx
Appeal rights exhausted 11 5 239 251 747 649
Removal 1 0 743 - 743 -
xxxxx Decision stage
Volume Median time (days) 90th percentile (days)
non-LA LA non-LA LA non-LA LA
Any initial decision (a) xx xx xx xx xx xx
Granted xx xx xx xx xx xx
Refused xx xx xx xx xx xx
Any appeal outcome xx xx xx xx xx xx
Allowed xx xx xx xx xx xx
Dismissed xx xx xx xx xx xx
Appeal rights exhausted 11 12 123 207 225 441
Removal 3 1 240 37 346 37
xxxxx Decision stage
Volume Median time (days) 90th percentile (days)
non-LA LA non-LA LA non-LA LA
Any initial decision (a) xx xx xx xx xx xx
Granted xx xx xx xx xx xx
Refused xx xx xx xx xx xx
Any appeal outcome xx xx xx xx xx xx
Allowed xx xx xx xx xx xx
Dismissed xx xx xx xx xx xx
Appeal rights exhausted 1 11 732 191 732 314
Removal 0 0 - - - -
xxxxx Decision stage
Volume Median time (days) 90th percentile (days)
non-LA LA non-LA LA non-LA LA
Any initial decision (a) xx xx xx xx xx xx
Granted xx xx xx xx xx xx
Refused xx xx xx xx xx xx
Any appeal outcome xx xx xx xx xx xx
Allowed xx xx xx xx xx xx
Dismissed xx xx xx xx xx xx
Appeal rights exhausted 7 14 132 161 222 362
Removal 2 1 72 242 75 242 Source: Analysis of UKBA Management Information. These figures are based on management information. This information
has not been quality assured under National Statistics protocols, is subject to change, and should be treated as provisional.
Note: (a) ‘Any initial decision‘ excludes decisions made on the same day as the application. These are assumed to be void. The grouping of initial decisions used here is taken from NAM + advice.

Home Office Science: Migration and Borders Analysis 26
Table 10 (continued): Time to each stage of the process (nationality dispute cases only), 2008 and 2009 <REDACTED>
xxxxx Decision stage
Volume Median time (days) 90th percentile (days)
non-LA LA non-LA LA non-LA LA
Any initial decision (a) xx xx xx xx xx xx
Granted xx xx xx xx xx xx
Refused xx xx xx xx xx xx
Any appeal outcome xx xx xx xx xx xx
Allowed xx xx xx xx xx xx
Dismissed xx xx xx xx xx xx
Appeal rights exhausted 7 34 243 158 298 371
Removal 0 0 - - - -
xxxxx Decision stage
Volume Median time (days) 90th percentile (days)
non-LA LA non-LA LA non-LA LA
Any initial decision (a) xx xx xx xx xx xx
Granted xx xx xx xx xx xx
Refused xx xx xx xx xx xx
Any appeal outcome xx xx xx xx xx xx
Allowed xx xx xx xx xx xx
Dismissed xx xx xx xx xx xx
Appeal rights exhausted 67 25 217 214 525 383
Removal 14 8 207 190 587 347 Source: Analysis of UKBA Management Information. These figures are based on management information. This information
has not been quality assured under National Statistics protocols, is subject to change, and should be treated as provisional.
Note: (a) ‘Any initial decision‘ excludes decisions made on the same day as the application. These are assumed to be void. The grouping of initial decisions used here is taken from NAM + advice.

Home Office Science: Migration and Borders Analysis 27
4.1.4 Summary It is clear from the previous sections that LA is only applied to a small number of cases (around 5%) and to a small number of nationalities. Also, asylum intake is driven by a number of factors, some of which are interrelated. It is difficult to draw strong conclusions from the case analysis since testing is on a voluntary basis and LA is just one factor affecting the progress of an application. This leads to the problem that this is a self-selection process and the sample may have some bias that is difficult to control for. Other factors may drive the outcomes, not LA itself. It is not in general possible to make a definitive causal link that LA alone improves or worsens case outcomes or timings, even if the data demonstrate an association. The evidence for most LA tested nationalities demonstrates that LA cases are associated with statistically significant xxxxx grant rates than non-LA cases, both initially and after the effects of appeals are included. At the appeal stage itself, there is no statistically significant difference between the success of LA and non-LA cases. It is also important to note that tribunals and courts did not give significant weight to LA until a court judgment in favour of it in 2010 (UNHCR, 2010), which could mean that the ‗dismissed‘ appeals rate could rise in the future for LA cases. This may help to improve the quality and sustainability of the initial decision. The evidence on times (median days) to each stage of the asylum process for the main LA tested nationalities is mixed but, for the majority of nationality groups, typical LA cases appear to reach an initial decision xxxxx xxxxx than non-LA cases. Generally, for ARE and removals, LA is associated with longer time periods. It is difficult to come to any firm conclusions with regard to nationality dispute cases because there are smaller volumes of cases in this category. There may also be an issue with the way the nationality dispute flag operates, which may have resulted in some inconsistencies in the data. It is not clear if the overall effects are attributable to LA or not, because LA cases tend to be more complex and may xxxxx xxxxx with or without LA.

Home Office Science: Migration and Borders Analysis 28
4.2 Impacts of LA on abusive asylum claims and nationality swapping LA may provide deterrence of fraudulent applications which, if realised, would save the UK Border Agency the full costs of asylum support for the duration of the application, as well as associated case processing and potential appeal costs. However, this is very difficult to quantify because it is difficult to isolate any impact that LA has on the number of abusive asylum applications. A reduction in asylum applications where LA has been applied could be caused by a number of factors. It is also difficult to forecast asylum intake and to identify the causal effect of individual factors on asylum applications. It is possible to look at trends in asylum intake across LA and non-LA tested nationalities before and after LA tests were introduced to see if there is a significant difference in the trends. However, it is important to note that in most cases LA only applies to a small proportion of applicants from an individual nationality and so the ability to quantify the impact of the introduction of LA in isolation is difficult. Further, it is unclear how the introduction of LA in the asylum process would affect the decision of individual applicants in their country of origin to come to the UK and claim in a false nationality. It is likely to be a minor factor among genuine asylum claimants (see Home Office, 2002) with many other factors influencing that decision. However, for applicants who make abusive claims the use of LA may have a different but unknown impact on their decision. Any of the drivers of the asylum decision could have been affected by other factors over the period in which LA was employed. Table 11 presents the data for all nationalities that undertook LA, the nationality intake in 2008 and 2009, and the three-year trend in intake for each nationality. Table 11: Intake comparison of LA tested nationalities, 1 April 2008 to 30 September 2008 against 1 April 2009 to 30 September 2009, and pre-2008 trend
Nationality 2008 period
LA tests
2008 period intake
numbers
2009 period intake
numbers
2008 to 2009: reduction/increase
numbers
2008 to 2009:
reduction /increase as % of 2008
period intake
Pre-2008
three-year
average change
All nationalities 487 12,325 10,996 -1,329 -11% -11%
Main LA nationalities during 2008
455 3,688 2,918 -770 -21% 5%
Somali 324 642 450 -192 -30% -13%
Eritrean 81 1,104 670 -434 -39% 25%
Afghan 23 1,675 1,613 -62 -4% 23%
Kenyan 10 71 56 -15 -21% -5%
Kuwaiti 10 79 42 -37 -47% 103%
Palestinian 7 117 87 -30 -26% 5%
Other known nationalities
29 8,576 8,043 -533 -6% -15%
Unknown nationality 3 61 35 -26 -43% 13%
Source: Home Office, Control of Immigration Statistics, 2010. Analysis of UKBA Management Information. These figures are based on management information. This information has not been quality assured under National Statistics protocols, is subject to change, and should be treated as provisional.
Note: Data are for main applicants only and exclude all dependants.

Home Office Science: Migration and Borders Analysis 29
For the main LA tested nationalities between 2008 and 2009, asylum intake declined by 21 per cent compared with a general decline of approximately 11 per cent in total asylum intake. However, there is no evidence that LA has or has not had a deterrence effect on abusive asylum intake, as any distinct effect LA has cannot be easily separated from other factors. There is a considerable difference between 21 per cent and 11 per cent so LA may have contributed to reducing fraudulent applications, but it is not possible to state this with any certainty. These changes could be influenced by previous trends in intake or other factors in the source countries and in the UK, for example, the policy stance. It is important to recognise that country- and time-specific political, economic and social events can have a considerable impact on the changing profile of asylum claims, regardless of whether LA is used (see section 3 on general changes in asylum data and trends). The LA tested nationalities that experienced the largest decline in intake between 2008 and 2009 included: Kuwaitis (-47%), Eritreans (-39%) and Somalis (-30%). For these countries, there are considerable differences in the asylum intake three-year trend before 2008 (pre-LA), from increases of 25 per cent for Eritrean and 23 per cent for Afghani applications to falls of 13 per cent for Somali applications. The main LA tested nationalities in 2008 accounted for more than one-quarter of the intake in 2008–09 but contributed to over one-half the reduction in asylum intake. 4.2.1 Summary In summary, the main LA tested nationalities are associated with a 21 per cent fall in asylum intake compared with an 11 per cent reduction for all nationalities. However, there is no evidence that LA has or has not had a deterrence effect on abusive asylum intake, as any distinct effect LA has cannot be easily separated from other factors. It may be that LA reduces abusive claims through a deterrent effect, but it is not possible to identify this effect. Other factors are more likely to impact on declining asylum intake and for genuine asylum claims LA will be a minor consideration for the applicant. If adopting LA provided some deterrent effect then for each fraudulent claim, this could save the UK Border Agency the full costs of asylum support for the duration of the application, as well as associated case processing and potential appeal costs. However, there is no evidence that LA has, or has not had a deterrent effect on the volume of abusive asylum applications. It is not possible to determine whether LA has led to a reduction in nationality swapping. Although there may be some situations where abusive asylum intake has fallen for the nationalities where LA is applied, this does not provide evidence that nationality swapping is reducing as it may be some other factor or combination of factors that produce this result. In the Foreign and Commonwealth Office (FCO) 2007 pilot, LA provided an indication that a greater degree of nationality swapping was taking place than had been previously assumed.

Home Office Science: Migration and Borders Analysis 30
5. Costs and benefits of language analysis As set out below (see section 5.1.1), it is possible to assess accurately the costs of language analysis (LA) tests but there is less certainty around the costs and benefits of LA tests to the UK Border Agency processes. 5.1 Costs and benefits of LA in asylum decision making 5.1.1 Costs The main costs of LA in the 2008 and 2009 pilots are discussed below. Monetised costs
In cases where transliteration took place LA cost around £700 per test. A study (National Audit Office, 2009b) suggested asylum case work costs varied between £500 and £2,000 depending on the profile of the asylum applicant. The use of LA may increase the costs of deciding some cases.
When seeking asylum it is logical for applicants to try to exhaust the process even though their initial decision is a refusal. The sample data analysis suggests there is no statistically significant difference for most LA tested nationalities for appeal rates. For xxxxx and xxxxx the appeal grant rate is close to xx per cent. For these cases and for the high ‗dismissed‘ appeal rate for xxxxx and xxxxx this increases both the costs of appeals to the UK Border Agency (around £970 per case) and the costs of providing asylum support to the appellant until the appeal outcome is reached.
Non-monetised costs
There is no blanket policy for LA testing. Therefore testing can only be applied on a voluntary basis and where there is a strong suspicion that the individual is not the nationality that they claim. There may be some abusive cases that go undetected.
Even if LA helps to inform the initial decision and subsequent decisions (at appeal where the UK Border Agency decision is upheld) a support tribunal is not necessarily bound by the Asylum and Immigration Tribunal‘s decision.
LA is associated with a xxxxx appeal time for xxxxx and xxxxx. It is also associated with a xxxxx ‗dismissed‘ appeal time for xxxxx, xxxxx and for xxxxx. LA is associated with xxxxx ‗allowed‘ appeals for xxxxx, xxxxx and xxxxx. xxxxx LA cases have xxxxx appeal times. Applicants can obtain independent LA and this generally lengthens the process. This mix suggests that for some LA cases the UK Border Agency will incur higher costs for appeal and support, but for those with shorter appeal times, LA cases will be more cost-effective than non-LA cases.

Home Office Science: Migration and Borders Analysis 31
5.1.2 Benefits of LA As set out previously, it is difficult to provide rigorous quantitative evidence of LA impacts on asylum decision making. It is therefore important to set out both the monetised and non-monetised benefits of LA. Monetised benefits
In some cases LA speeds up the decision of either granting or refusing asylum status. In other cases it does not affect the timescales. If decisions are made more quickly and applicants are removed from asylum support, there may be significant savings to the UK Border Agency of up to £140 per week per person in asylum support.
In addition, LA may reduce the burden of work a caseworker undertakes. Using estimates from the NAO (National Audit Office, 2009b), the unit costs of asylum case work vary between £500 and £2,000 depending on the profile of the applicant, for example, family cases or non-compliant applicants incur higher costs than a single adult granted asylum at first decision. Any reduction in these costs would reduce overall operational costs to the UK Border Agency.
There may be other downstream savings in terms of detention costs if decisions are made faster. The average detention cost is £120 per night. Any reduction in case times that reduce the time in detention could therefore have significant resource savings to the UK Border Agency, or could free up detention space for other use. If, however, LA prolongs the process then this benefit will not be realised and this could be an additional cost to the UK Border Agency.
Non-monetised benefits
LA is now widely accepted by tribunals and courts as a substantial contribution in coming to a decision about whether an applicant is from their claimed country of nationality.
LA is considered by caseworkers to be a valuable tool to help to inform their decision in cases where there is doubt over the claimed nationality and in helping to inform the decision to grant asylum status or not.
In case law, a judgment was given in favour of LA in September 2010 showing it to be robust and therefore strengthening and widening its acceptability as evidence in court (UNHCR, 2010).
LA is given appropriate weight in the courts and any evidence offered against it must address the substantive points resulting from the LA.
In some cases LA speeds up the decision of either granting or refusing asylum status. In other cases it does not affect the timescales.
LA is useful when combined with contextual information (about places, habits, customs and local culture).

Home Office Science: Migration and Borders Analysis 32
LA provides a standardised form of report that can be interpreted without difficulty.
Overall, while there are a number of non-monetised benefits of using LA tests, the main operational benefit arises from quicker decisions leading to reduced costs of asylum support. Given the evidence, it is not clear whether the scale of potential resource savings from quicker case decisions would cover the additional resource costs of carrying out LA. An illustrative cost model is set out at Annex C. This is set out by the main LA tested nationalities for ‗granted‘ and ‗refused‘ LA and non-LA cases. It takes account of the time (using median days) to the initial decision, the appeal rate and the time to the appeal outcome and the time taken to reach the appeal rights exhausted (ARE) stage. The main variables are the time taken to reach each stage and the appeal rate. Based on the data analysis in this report, and on assumptions around asylum process and support costs, this model suggests that ‗granted‘ LA cases for xxxxx, xxxxx, xxxxx and those of xxxxx have a xxxxx unit cost than non-LA cases. This is also true for ‗refused‘ LA cases for xxxxx and those of xxxxx. For all other groups, the non-LA cases have a xxxxx unit cost. Although there are some uncertainties around the precise effects, this suggests the use of LA in particular cases could lead to savings in support costs for the UK Border Agency. The difference in favour of LA cases ranges from £xx for xxxxx to £ xx for those of xxxxx. For the largest group undertaking LA (xxxxx – xx LA tests out of xx, or xx %), the unit cost difference is £ xx for granted cases and -£ xx for ‗refused‘ cases. 5.2 Costs and benefits of LA in deterring abusive asylum applicants As set out in section 4.2, it is difficult to isolate the effect of LA as a deterrent of abusive asylum claims when the drivers of asylum are complex and integrated. The evidence set out in this paper on LA as a deterrent is unclear and mixed, although there are some indications that the use of LA has been correlated with reduced abusive intake for specific nationalities. If LA does have a deterrent effect, the scale of benefits could be significant to the UK Border Agency. The NAO (National Audit Office, 2009b) set out the unit costs of asylum seekers ranging between around £5,000 and £25,000 depending on the characteristics of asylum seekers. Assuming the unit cost of an LA test is similar to previous tests (either £350 or £700, see Annex C) then if one fraudulent asylum application (nationality disputed) were deterred as a result of LA, this would cover the cost of the LA test (all else being equal). The UK Border Agency may benefit from savings where the unit cost of LA cases is lower than non-LA cases for specific nationalities.

Home Office Science: Migration and Borders Analysis 33
Glossary AIT Asylum and Immigration Tribunal ARE Appeal rights exhausted ASU Asylum Screening Unit CAL Central Appeals and Litigation CAST Centre for Applied Science and Technology CID Casework information database CMR Case management review CoS Court of Session CRD Case Resolution Directorate DPR Democratic People‘s Republic DR Democratic Republic of ECHR European Court of Human Rights FCO Foreign and Commonwealth Office FTT (IAC) First Tier Tribunal (Immigration and Asylum Chamber) HC House of Commons HO Home Office IAC Immigration and Asylum Chamber LA Language analysis LEO Local Enforcement Office NAM + New Asylum Model team NAO National Audit Office P Provisional PCU Performance and Change Unit Q Quarter RRA Removal and Return Agreement SSHD Secretary of State for the Home Department (Home Secretary) UK United Kingdom UNHCR United Nations High Commission for Refugees UT (IAC) Upper Tribunal (Immigration and Asylum Chamber) VfM Value for money

Home Office Science: Migration and Borders Analysis 34
References Brick, J. B. (2010) ‗Language Analysis for Determination of Origins, in light of the recent 2010 UK Upper Tribunal decision‘, The Researcher, 5 (3), pp4-10, Dublin: The Refugee Documentation Centre (Ireland). Eades, D. (2005) ‗Language Analysis in Asylum Seeker Cases‘, Applied Linguistics, 26 (4), pp 503-526, Oxford University Press, Oxford. Eades, D., Fraser, H., Siegel, J., McNamara, T. and Baker, B. (2003) ‗Linguistic Identification in the Determination of Nationality: a preliminary report‘, Language Policy 2, pp 179–199, Dordrecht, The Netherlands: Springer. Foreign and Commonwealth Office (2010) Language Analysis: PMD MF 200124, Project Completion Report, May 2010. London: Foreign and Commonwealth Office. Home Office (2002) Understanding the Decision Making of Asylum Seekers, Home Office Research Study 243. London: Home Office. Home Office (2008) Race Relations (Immigration and Asylum) (Language Analysis) (No.2) Authorisation 2008. London: Home Office. Language and National Origin Group (2004) ‗Guidelines for the Use of Language Analysis in Relation to Questions of National Origin in Refugee Cases‘, Speech, Language and the Law, 11(2) June, Birmingham: University of Birmingham Press. Available at <http://www.equinoxjournals.com/IJSLL/article/viewFile/555/1386> accessed 24 June 2011. National Audit Office (2005) Returning Failed Asylum Applicants, Report by the Comptroller and Auditor General, HC 76, Session 2005-2006, 19 July 2005, London: The Stationery Office. National Audit Office (2009a) The Home Office: Management of Asylum Applications by the UK Border Agency, January 2009, House of Commons Session 124, 2008—2009. London: National Audit Office. National Audit Office (2009b) National Audit Office – Asylum Value for Money Study Cost Model, 2007—2008. London: Accenture. Reath, A. (2004) ‗Language Analysis in the Context of the Asylum Process: Procedures, validity, and consequences‘, Language Assessment Quarterly 1–4, pp 209–233, Philadelphia: Routledge Publishing, Taylor and Francis Group. Singler, R. V. (2004) ‗The 'linguistic' asylum interview and the linguist's evaluation of it, with special reference to applicants for Liberian political asylum in Switzerland‘, International Journal of Speech Language and the Law, 11 (2), pp222-239, North America. Sprakab (2011) Language Analysis, Introduction and Forensic Services. Available at:<http://www.sprakab.se/Home.html > accessed 24 June 2011.

Home Office Science: Migration and Borders Analysis 35
UK Border Agency (2010) Guidance, Litigation and Advice Directorate: high level map: asylum, Tribunal Service – Immigration and Asylum Chamber, July 2010. London: UK Border Agency. UK Border Agency (2011a) Appeals Process: CRD and Asylum Team cases. London: UK Border Agency. UK Border Agency (2011b) Key Elements of the New Asylum Model. London: UK Border Agency. UK Border Agency (2011c) Language Analysis Guidance London: UK Border Agency. Available at: <http://www.ukba.homeoffice.gov.uk/sitecontent/documents/policyandlaw/asylumprocessguidance/miscellaneous/guidance/languageanalysis.pdf?view=Binary>accessed 24 June 2011. UNHCR (2010) RB (Linguistic evidence – Sprakab) Somalia v. Secretary of State for the Home Department, [2010] UKUT 329 (IAC). United Kingdom: Upper Tribunal (Immigration and Asylum Chamber), 10 September 2010. Available at: <http://www.unhcr.org/refworld/country,,GBR_UTIAC,CASELAW,SOM,,4ca36a1b2,0.html> accessed 24 June 2011. Wittgenstein, L. (1999) Philosophical Investigations 1953, London: Blackwell Publishing.
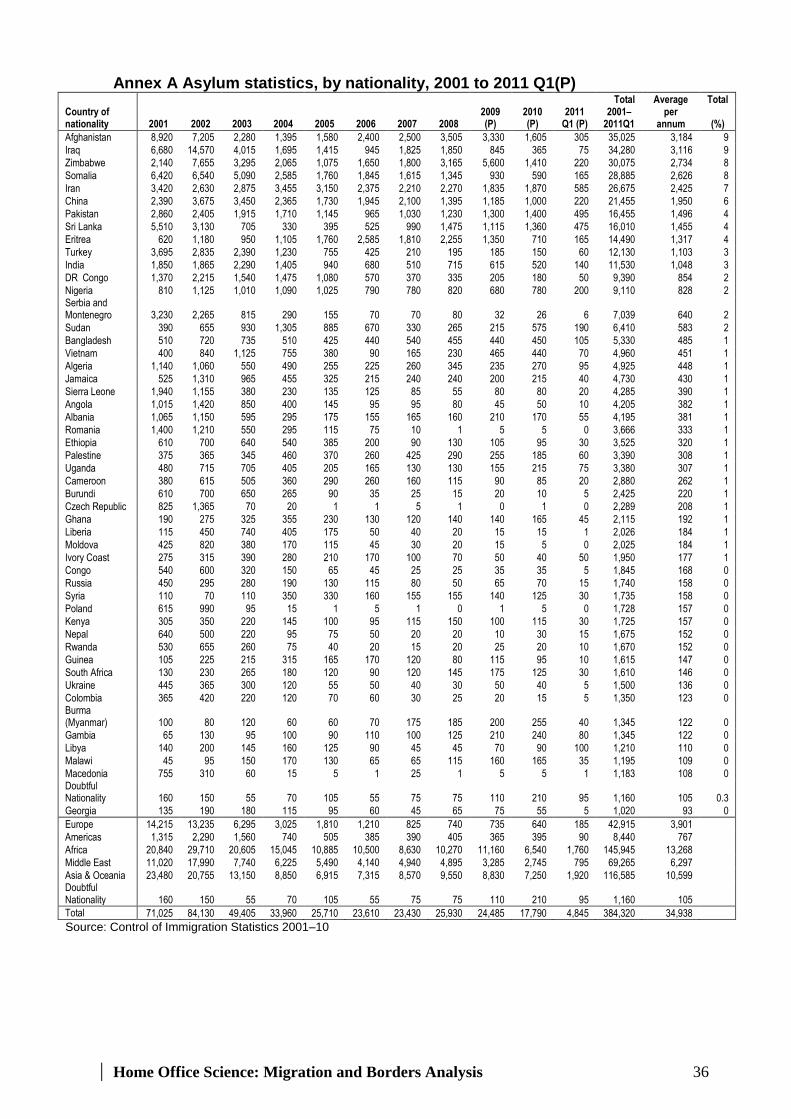
Home Office Science: Migration and Borders Analysis 36
Annex A Asylum statistics, by nationality, 2001 to 2011 Q1(P) Total Average Total
Country of nationality 2001 2002 2003 2004 2005 2006 2007 2008
2009 (P)
2010 (P)
2011 Q1 (P)
2001– 2011Q1
per annum (%)
Afghanistan 8,920 7,205 2,280 1,395 1,580 2,400 2,500 3,505 3,330 1,605 305 35,025 3,184 9
Iraq 6,680 14,570 4,015 1,695 1,415 945 1,825 1,850 845 365 75 34,280 3,116 9
Zimbabwe 2,140 7,655 3,295 2,065 1,075 1,650 1,800 3,165 5,600 1,410 220 30,075 2,734 8
Somalia 6,420 6,540 5,090 2,585 1,760 1,845 1,615 1,345 930 590 165 28,885 2,626 8
Iran 3,420 2,630 2,875 3,455 3,150 2,375 2,210 2,270 1,835 1,870 585 26,675 2,425 7
China 2,390 3,675 3,450 2,365 1,730 1,945 2,100 1,395 1,185 1,000 220 21,455 1,950 6
Pakistan 2,860 2,405 1,915 1,710 1,145 965 1,030 1,230 1,300 1,400 495 16,455 1,496 4
Sri Lanka 5,510 3,130 705 330 395 525 990 1,475 1,115 1,360 475 16,010 1,455 4
Eritrea 620 1,180 950 1,105 1,760 2,585 1,810 2,255 1,350 710 165 14,490 1,317 4
Turkey 3,695 2,835 2,390 1,230 755 425 210 195 185 150 60 12,130 1,103 3
India 1,850 1,865 2,290 1,405 940 680 510 715 615 520 140 11,530 1,048 3
DR Congo 1,370 2,215 1,540 1,475 1,080 570 370 335 205 180 50 9,390 854 2
Nigeria 810 1,125 1,010 1,090 1,025 790 780 820 680 780 200 9,110 828 2 Serbia and Montenegro 3,230 2,265 815 290 155 70 70 80 32 26 6 7,039 640 2
Sudan 390 655 930 1,305 885 670 330 265 215 575 190 6,410 583 2
Bangladesh 510 720 735 510 425 440 540 455 440 450 105 5,330 485 1
Vietnam 400 840 1,125 755 380 90 165 230 465 440 70 4,960 451 1
Algeria 1,140 1,060 550 490 255 225 260 345 235 270 95 4,925 448 1
Jamaica 525 1,310 965 455 325 215 240 240 200 215 40 4,730 430 1
Sierra Leone 1,940 1,155 380 230 135 125 85 55 80 80 20 4,285 390 1
Angola 1,015 1,420 850 400 145 95 95 80 45 50 10 4,205 382 1
Albania 1,065 1,150 595 295 175 155 165 160 210 170 55 4,195 381 1
Romania 1,400 1,210 550 295 115 75 10 1 5 5 0 3,666 333 1
Ethiopia 610 700 640 540 385 200 90 130 105 95 30 3,525 320 1
Palestine 375 365 345 460 370 260 425 290 255 185 60 3,390 308 1
Uganda 480 715 705 405 205 165 130 130 155 215 75 3,380 307 1
Cameroon 380 615 505 360 290 260 160 115 90 85 20 2,880 262 1
Burundi 610 700 650 265 90 35 25 15 20 10 5 2,425 220 1
Czech Republic 825 1,365 70 20 1 1 5 1 0 1 0 2,289 208 1
Ghana 190 275 325 355 230 130 120 140 140 165 45 2,115 192 1
Liberia 115 450 740 405 175 50 40 20 15 15 1 2,026 184 1
Moldova 425 820 380 170 115 45 30 20 15 5 0 2,025 184 1
Ivory Coast 275 315 390 280 210 170 100 70 50 40 50 1,950 177 1
Congo 540 600 320 150 65 45 25 25 35 35 5 1,845 168 0
Russia 450 295 280 190 130 115 80 50 65 70 15 1,740 158 0
Syria 110 70 110 350 330 160 155 155 140 125 30 1,735 158 0
Poland 615 990 95 15 1 5 1 0 1 5 0 1,728 157 0
Kenya 305 350 220 145 100 95 115 150 100 115 30 1,725 157 0
Nepal 640 500 220 95 75 50 20 20 10 30 15 1,675 152 0
Rwanda 530 655 260 75 40 20 15 20 25 20 10 1,670 152 0
Guinea 105 225 215 315 165 170 120 80 115 95 10 1,615 147 0
South Africa 130 230 265 180 120 90 120 145 175 125 30 1,610 146 0
Ukraine 445 365 300 120 55 50 40 30 50 40 5 1,500 136 0
Colombia 365 420 220 120 70 60 30 25 20 15 5 1,350 123 0 Burma (Myanmar) 100 80 120 60 60 70 175 185 200 255 40 1,345 122 0
Gambia 65 130 95 100 90 110 100 125 210 240 80 1,345 122 0
Libya 140 200 145 160 125 90 45 45 70 90 100 1,210 110 0
Malawi 45 95 150 170 130 65 65 115 160 165 35 1,195 109 0
Macedonia 755 310 60 15 5 1 25 1 5 5 1 1,183 108 0 Doubtful Nationality 160 150 55 70 105 55 75 75 110 210 95 1,160 105 0.3
Georgia 135 190 180 115 95 60 45 65 75 55 5 1,020 93 0
Europe 14,215 13,235 6,295 3,025 1,810 1,210 825 740 735 640 185 42,915 3,901
Americas 1,315 2,290 1,560 740 505 385 390 405 365 395 90 8,440 767
Africa 20,840 29,710 20,605 15,045 10,885 10,500 8,630 10,270 11,160 6,540 1,760 145,945 13,268
Middle East 11,020 17,990 7,740 6,225 5,490 4,140 4,940 4,895 3,285 2,745 795 69,265 6,297
Asia & Oceania 23,480 20,755 13,150 8,850 6,915 7,315 8,570 9,550 8,830 7,250 1,920 116,585 10,599 Doubtful Nationality 160 150 55 70 105 55 75 75 110 210 95 1,160 105
Total 71,025 84,130 49,405 33,960 25,710 23,610 23,430 25,930 24,485 17,790 4,845 384,320 34,938
Source: Control of Immigration Statistics 2001–10

Annex B Key elements of the new asylum approach These elements are illustrated to give an indication of the various steps in the asylum process model (a simplified model). This shows where LA is conducted to provide a piece of evidence in the asylum decision process. The top four boxes indicate the processes that are undertaken in order to arrive at a decision (grant or refusal), the first two appeal processes are taken as the appeal stages while the other appeals beyond this are termed ‗onward appeals‘ where the volumes are much smaller. All cases should end in either removal or integration.
Make claim and
screening
Language analysis
Substantive interview
Decision
First Tier Appeal
casework management review
Further appeal
(Upper Tribunal)
Court of Appeal
(Court of Session in Scotland)
European Court of
Human Rights appeal
Removal
Integration
Support Tribunal
(normally after appeal)
Supreme Court

Home Office Science: Migration and Borders Analysis 38
Annex C Illustrative cost modelling This annex sets out an illustrative cost model to show the difference in case process and asylum support costs between language analysis (LA) cases and non-LA cases based on the case outcome results set out in this paper. The modelling is applied by nationalities and is done separately for ‗grants‘ and ‗refusals‘. It is important to note that this only gives an indicative assessment of unit costs and any potential costs and benefits to the UK Border Agency for the use of LA with asylum cases. There are four key stages in the asylum decision process that affect UKBA processing costs.
1. Initial decision – there are case work costs, which are generally fixed per case (case work time costs include screening, evidence-gathering, interview, post-interview decision-making, and serving the decision); and asylum support costs, which vary and depend on the take-up of support (both accommodation and cash support) and the duration of support.
2. Appeal decision – for cases that go to appeal, there is a unit cost of appeal to the UK Border Agency to process the appeal that is generally fixed (estimated at around £970 in 2009/10); and there are asylum support costs, again which vary in line with take-up and duration of support.
3. Appeal rights exhausted (ARE) – for cases that have onward appeals until they reach ARE, there are further asylum support costs, which vary in line with take-up and duration of support.
4. Removal – for cases that are refused and removed there are removal costs, estimated at around £11,000 per removal based on National Audit Office (NAO) estimates for the financial year 2003-04, see National Audit Office (2005), although this will vary depending on whether the removal is enforced or voluntary.
Note: The actual asylum process and hence costs at each stage will vary
significantly depending on the applicant profiles, case owner resource and the complexity of the cases. This model, therefore, provides only an illustrative outcome of an example case type for a single adult main applicant only, and should not be seen as an estimate of the precise unit costs of the asylum system.
Modelling assumptions The key assumptions used in the model are presented below.
1. The process outcomes and costs are for main applicant asylum seekers only. 2. Initial decision process costs are around £1,000, based on the range (£600 to
£1,400) set out in the NAO report (National Audit Office, 2009b) for single adults granted at initial decision.
3. LA costs are £350 per test at initial decision stage, and a further £350 at appeal stage for transliteration.
4. Around 50 per cent of applicants claim asylum support at all stages of the process until ARE. Asylum support is estimated at a daily rate of around £6.40 (for cash) or £20 (for cash and accommodation). It should be noted that asylum support rates vary by applicant type and number of dependants, so these rates are illustrative only.
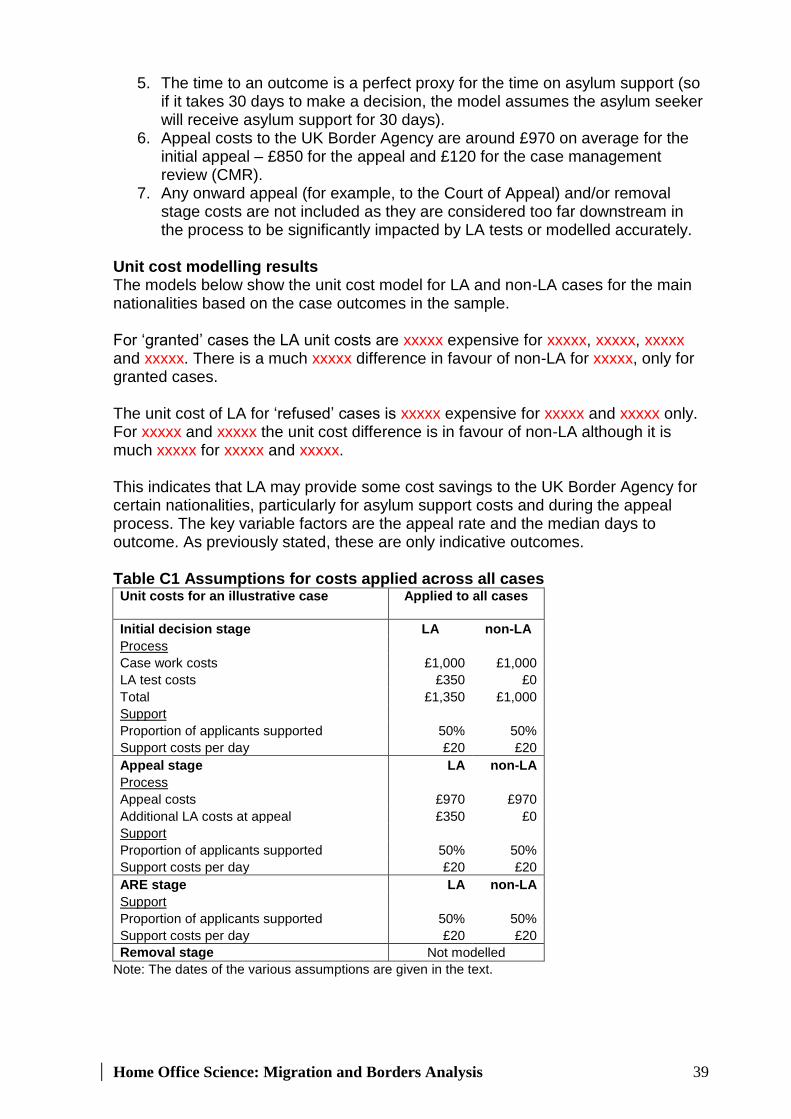
Home Office Science: Migration and Borders Analysis 39
5. The time to an outcome is a perfect proxy for the time on asylum support (so if it takes 30 days to make a decision, the model assumes the asylum seeker will receive asylum support for 30 days).
6. Appeal costs to the UK Border Agency are around £970 on average for the initial appeal – £850 for the appeal and £120 for the case management review (CMR).
7. Any onward appeal (for example, to the Court of Appeal) and/or removal stage costs are not included as they are considered too far downstream in the process to be significantly impacted by LA tests or modelled accurately.
Unit cost modelling results The models below show the unit cost model for LA and non-LA cases for the main nationalities based on the case outcomes in the sample. For ‗granted‘ cases the LA unit costs are xxxxx expensive for xxxxx, xxxxx, xxxxx and xxxxx. There is a much xxxxx difference in favour of non-LA for xxxxx, only for granted cases. The unit cost of LA for ‗refused‘ cases is xxxxx expensive for xxxxx and xxxxx only. For xxxxx and xxxxx the unit cost difference is in favour of non-LA although it is much xxxxx for xxxxx and xxxxx. This indicates that LA may provide some cost savings to the UK Border Agency for certain nationalities, particularly for asylum support costs and during the appeal process. The key variable factors are the appeal rate and the median days to outcome. As previously stated, these are only indicative outcomes. Table C1 Assumptions for costs applied across all cases Unit costs for an illustrative case
Applied to all cases
Initial decision stage LA non-LA
Process
Case work costs £1,000 £1,000
LA test costs £350 £0
Total £1,350 £1,000
Support
Proportion of applicants supported 50% 50%
Support costs per day £20 £20
Appeal stage LA non-LA
Process
Appeal costs £970 £970
Additional LA costs at appeal £350 £0
Support
Proportion of applicants supported 50% 50%
Support costs per day £20 £20
ARE stage LA non-LA
Support
Proportion of applicants supported 50% 50%
Support costs per day £20 £20
Removal stage Not modelled
Note: The dates of the various assumptions are given in the text.

Home Office Science: Migration and Borders Analysis 40
Notes and sensitivities 1. If asylum support levels or take-up rates were lower, the overall unit costs would
be lower (as overall asylum support costs would be smaller) and there would be less difference between the unit costs both for overall cases and nationality dispute cases, although LA cases would continue to be marginally more costly than non-LA cases. If LA and non-LA cases have different propensities to claim support, this would affect the relative unit costs. The data did not allow analysis of these differences, so the model assumes rates are identical across cases when considering all cases.
2. If onward appeal and removal costs were included in the modelling, the overall
unit costs would be higher for all case types. 3. For family cases, process, appeal and support costs would be higher than those
estimated above due to the additional volume of dependants who can appeal and claim support, and based on the cost estimates in National Audit Office 2009b. An indication of the range of costs is given below for single adults and for a family, excluding accommodation and support and including accommodation and support.
4. If the appeal rate for LA cases were in line with non-LA cases the overall unit
costs for LA would only be marginally more expensive than non-LA cases for all cases considered. If the appeal rate for LA cases were 10 per cent lower than non-LA cases the overall unit costs for LA would be cost neutral compared with non-LA cases, again considering all cases.
Cost assumptions for single adults and families, with and without accommodation and support costs are taken from National Audit Office (2009b) and presented below. This demonstrates the difficulty in estimating what the savings could potentially be. For more complex cases the savings could be considerable. Costs (£) Excluding accommodation
and support Including accommodation
and support Profile Lower Upper Lower Upper Single adult, granted asylum on first decision 600 1,400 2,700 5,000 Single adult, refused, enforced exit after ARE 8,100 17,800 12,900 26,400 Family, granted asylum on first decision 900 1,800 5,800 10,200 Family, refused, enforced exit after ARE 14,200 35,100 27,300 58,100 Source: National Audit Office (2009b) NAM profile costs profiles for the financial year 2007-08. Note: These costs are based on London and the south east.

Home Office Science: Migration and Borders Analysis 41
Table C2 Illustrative cost model results, by nationality, ultimately granted or refused <REDACTED> Granted case: Unit costs xxxxx xxxxx xxxxx xxxxx xxxxx xxxxx
Initial decision stage LA non-LA LA non-LA LA non-LA LA non-LA LA non-LA LA non-LA
Process costs £1,350 £1,000 £1,350 £1,000 £1,350 £1,000 £1,350 £1,000 £1,350 £1,000 £1,350 £1,000
Median days to decision xx xx xx xx xx xx xx xx xx xx xx xx
Support costs £xx £xx £xx £xx £xx £xx £xx £xx £xx £xx £xx £xx
Total initial decision costs £xx £xx £xx £xx £xx £xx £xx £xx £xx £xx £xx £xx
Appeal stage LA non-LA LA non-LA LA non-LA LA non-LA LA non-LA LA non-LA
Appeal rate xx % xx % xx % xx % xx % xx % xx % xx % xx % xx % xx % xx %
Appeal process costs £305 £200 £17 £39 £0 £0 £147 £0 £87 £33 £26 £0
Median time to appeal outcome xx xx xx xx xx xx xx xx xx xx xx xx
Support costs £xx £xx £xx £xx £xx £xx £xx £xx £xx £xx £xx £xx
Total appeal costs £xx £xx £xx £xx £xx £xx £xx £xx £xx £xx £xx £xx
Total cost comparison LA non-LA LA non-LA LA non-LA LA non-LA LA non-LA LA non-LA
Total unit cost £xx £xx £xx £xx £xx £xx £xx £xx £xx £xx £xx £xx
LA/Non-LA difference £xx -£xx -£xx £xx £xx £xx
Refused case: Unit costs
Initial decision stage LA non-LA LA non-LA LA non-LA LA non-LA LA non-LA LA non-LA
Process costs £1,350 £1,000 £1,350 £1,000 £1,350 £1,000 £1,350 £1,000 £1,350 £1,000 £1,350 £1,000
Median days to decision xx xx xx xx xx xx xx xx xx xx xx xx
Support costs £xx £xx £xx £xx £xx £xx £xx £xx £xx £xx £xx £xx
Total initial decision costs £xx £xx £xx £xx £xx £xx £xx £xx £xx £xx £xx £xx
Appeal stage LA non-LA LA non-LA LA non-LA LA non-LA LA non-LA LA non-LA
Appeal rate xx % xx % xx % xx % xx % xx % xx % xx % xx % xx % xx % xx %
Total appeal process costs £1,067 £862 £1,191 £871 £1,107 £797 £1,052 £814 £1,152 £893 £1,165 £970
Median time to appeal outcome xx xx xx xx xx xx xx xx xx xx xx xx
Support costs £xx £xx £xx £xx £xx £xx £xx £xx £xx £xx £xx £xx
Total appeal costs £xx £xx £xx £xx £xx £xx £xx £xx £xx £xx £xx £xx
ARE stage LA non-LA LA non-LA LA non-LA LA non-LA LA non-LA LA non-LA
Median time to ARE outcome xx xx xx xx xx xx xx xx xx xx xx xx
Total ARE costs £2,510 £1,960 £2,010 £1,690 £2,230 £2,100 £1,610 £2,570 £2,110 £2,040 £4,060 £2,330
Total unit cost £xx £xx £xx £xx £xx £xx £xx £xx £xx £xx £xx £xx
LA/Non-LA difference -£xx -£xx -£xx £xx -£xx £xx Note: A positive figure indicates that the LA case unit cost is less expensive than the non-LA unit cost.