Langston2020 LandO
45
1 1 Title: Modeling long-term salt marsh response to sea level rise in the sediment-deficient Plum 2 Island Estuary, MA 3 4 Authors: Amy K. Langston 1* , Orencio Durán Vinent 1, 2 , Ellen R. Herbert 1, 3 , Matthew L. Kirwan 1 5 1 Virginia Institute of Marine Science, William & Mary, PO Box 1346, Gloucester Point, VA, 6 USA 23062 7 2 Department of Ocean Engineering, Texas A&M University, College Station, TX, USA 77843 8 3 Ducks Unlimited, Memphis, TN, USA 38129 9 10 Co-author emails: [email protected]; [email protected]; [email protected] 11 12 *corresponding author: (804) 684-7592; [email protected] 13 14 Running head: Salt marsh response to sea level rise 15 16 Keywords: accretion, elevation capital, low marsh, high marsh, suspended sediment 17 concentration 18
Transcript of Langston2020 LandO

1
1
Title: Modeling long-term salt marsh response to sea level rise in the sediment-deficient Plum 2
Island Estuary, MA3
4
Authors: Amy K. Langston1*, Orencio Durán Vinent1, 2, Ellen R. Herbert1, 3, Matthew L. Kirwan15
1Virginia Institute of Marine Science, William & Mary, PO Box 1346, Gloucester Point, VA,6
USA 230627
2Department of Ocean Engineering, Texas A&M University, College Station, TX, USA 778438
3Ducks Unlimited, Memphis, TN, USA 381299
10
Co-author emails: [email protected]; [email protected]; [email protected]
12
*corresponding author: (804) 684-7592; [email protected]
14
Running head: Salt marsh response to sea level rise15
16
Keywords: accretion, elevation capital, low marsh, high marsh, suspended sediment 17
concentration18

2
Abstract19
An accelerating global rate of sea level rise, coupled with direct human impacts to coastal 20
watersheds and shorelines, threatens the continued survival of salt marshes. We developed a new21
landscape-scale numerical model of salt marsh evolution and applied it to marshes in the Plum 22
Island Estuary (Massachusetts, USA), a sediment-deficient system bounded by steep uplands. To 23
capture complexities of vertical accretion across the marsh platform, we employed a novel 24
approach that incorporates spatially variable suspended sediment concentrations and biomass of 25
multiple plant species as functions of elevation and distance from sediment sources. The model 26
predicts a stable areal extent of Plum Island marshes for a variety of sea level rise scenarios27
through 2100, where limited marsh drowning is compensated by limited marsh migration into 28
adjacent uplands. Nevertheless, the model predicts widespread conversion of high marsh 29
vegetation to low marsh vegetation, and accretion deficits that indicate eventual marsh drowning. 30
Although sediment-deficient marshes bounded by steep uplands are considered extremely 31
vulnerable to sea level rise, our results highlight that marshes with high elevation capital can 32
maintain their areal extent for decades to centuries even under conditions in which they will 33
inevitably drown.34

3
Introduction35
Coastal salt marshes occupy a precarious position in the landscape, linking land and sea 36
in temperate latitudes along low-energy, gently-sloped coastlines. Within this setting they 37
sequester carbon, cycle nutrients, provide habitat, stabilize shorelines, and buffer waves and 38
storms (Zedler and Kercher 2005). Subject to hydrodynamics that dictate their geomorphology,39
salt marshes persist via biophysical feedbacks between sediment accumulation, primary 40
productivity, and sea level change (Redfield 1972; Friedrichs and Perry 2001; Morris et al. 41
2002). However, during the past century, the global mean rate of sea level rise (SLR) has 42
increased from 1.7 mm y-1 (1900-1990) to a current rate of 3.3 mm y-1 since 1993 (IPCC 2013; 43
Wright et al. 2019). Projected global increases may exceed 15 mm y-1 by the end of the century, 44
depending on future greenhouse gas emissions, and local rates in many regions may increase 45
even faster (IPCC 2013; Horton et al. 2014; Nerem et al. 2018; Bamber et al. 2019). While salt 46
marshes have largely survived changes in sea level over the past 4,000 years, an accelerating 47
global rate of SLR jeopardizes the ability of marshes to maintain dynamic equilibrium with sea 48
level (Kirwan and Megonigal 2013).49
Recent observations of marsh submergence have prompted concern for salt marsh 50
persistence worldwide (e.g.,(Reed 1995; FitzGerald et al. 2008; Kirwan and Megonigal 2013; 51
Crosby et al. 2016). Extensive marsh loss from subsidence, accretion deficits, and human 52
impacts has occurred in the world’s largest estuaries, including the Mississippi River Delta, 53
Yellow River Delta, and Venice Lagoon (Carniello et al. 2009; Murray et al. 2014; Jankowski et 54
al. 2017; Gu et al. 2018). However, several marshes in northwest Europe and North America55
have shown resilience to SLR (French 2006; Kirwan et al. 2016a). The global extent of marshes56
predicted by 2100 is widely variable: estimates range from 30% loss to 60% gain, depending on 57

4
available migration space (Schuerch et al. 2018; Rogers et al. 2019). Varying responses to SLR 58
create a need for predictive models that evaluate salt marsh outcomes based on local conditions 59
and under different SLR scenarios to inform strategies that can minimize future loss.60
Coastal salt marshes naturally maintain stability relative to sea level through non-linear 61
ecogeomorphic feedbacks that influence vertical accretion and landward transgression (Redfield 62
1972; Friedrichs and Perry 2001; Morris et al. 2002; Mudd et al. 2009; Fagherazzi et al. 2012; 63
Kirwan and Megonigal 2013; FitzGerald and Hughes 2019). Tidal flooding drives the 64
accumulation of mineral sediments and organic material that contribute to marsh elevation gain. 65
Tidal waters deliver mineral sediments to the marsh surface during periods of inundation. Marsh66
vegetation facilitates sediment deposition by slowing water velocities and trapping sediment, and 67
also supplies organic matter that contributes to elevation gain (Gleason et al. 1979; Nyman et al. 68
2006; Li and Yang 2009). Rates of sediment deposition and primary productivity vary spatially 69
across a marsh, depending on surface elevation relative to sea level and distance from tidal 70
channels delivering sediment (Kirwan and Guntenspergen 2012; Schalles et al. 2013; Swanson et 71
al. 2014; Roner et al. 2016). Because non-linear dynamics of mineral and organic accretion are 72
fundamental to marsh evolution and resilience, it is critical that predictive models incorporate 73
them when evaluating marsh response to SLR.74
Marsh accretion rates tend to increase with flooding frequency so that marshes generally 75
adapt to changes in SLR rates as long as surface elevations remain within the range required for 76
plant survival (Morris et al. 2002; Cadol et al. 2014; Kirwan et al. 2016a). Marsh loss is also 77
mitigated by lateral migration induced by SLR. Increased tidal inundation and salinity promote 78
landward marsh encroachment into upland areas unencumbered by topographic or anthropogenic 79
barriers (e.g., steep slopes, shoreline protection structures, urban development;(Kirwan et al. 80
5
2016a; b; Langston et al. 2017; Schieder et al. 2018; Borchert et al. 2018; Kirwan and Gedan 81
2019). For marshes unable to keep pace vertically with SLR, landward migration is essential for 82
survival (Schuerch et al. 2018). When upland marsh migration is restricted, marshes are 83
subjected to coastal squeeze where lateral erosion results in loss of marsh area (Torio and 84
Chmura 2013; Kirwan et al. 2016b; Thorne et al. 2018).85
Marsh loss is most dramatic in regions where natural feedbacks between vertical 86
accretion and SLR have been disrupted and/or landward transgression restricted (Kennish 2001; 87
Kearney et al. 2002; Gittman et al. 2015). Human disturbances, including the construction of 88
dams and reservoirs, afforestation, soil conservation, and agricultural sediment control practices 89
disrupt feedbacks between marsh elevation and sea level by reducing sediment delivery (Kennish 90
2001; Kirwan and Megonigal 2013; Weston 2014). Damming of rivers is a major cause of 91
reduced sediment supply to coastal marshes that has resulted in marsh loss worldwide (Syvitski 92
et al. 2005). Likewise, topographic and anthropogenic barriers cause marsh loss by limiting 93
landward retreat (Doody 2013; Torio and Chmura 2013; Kirwan et al. 2016b; Enwright et al. 94
2016). While much work has been done assessing general salt marsh responses to SLR, more 95
work is needed to evaluate whether marshes with reduced sediment inputs and limited room for 96
landward migration can survive SLR.97
Predicting responses of marshes to SLR is challenging because complex interactions 98
between tidal flooding, plant productivity, and sediment transport processes drive long-term 99
behavior of coastal salt marshes (Kirwan et al. 2010; Kirwan and Megonigal 2013). Spatially 100
resolved, landscape-scale models of salt marsh evolution tend to fall into one of two categories. 101
One category emphasizes ecogeomorphic connectivity between channels and the marsh platform102
(e.g.,(D’Alpaos et al. 2007; Kirwan and Murray 2007; Temmerman et al. 2007). These models 103

6
tend to be developed to explore general behavior or to make predictions for a single location, and 104
rely on relatively complex parameterizations for the flow of water and sediment across the model 105
domain. A second category of models emphasizes vertical accretion on the marsh platform itself106
(e.g.,(Swanson et al. 2014; Schile et al. 2014; Alizad et al. 2016a; Cadol et al. 2016; Wu et al. 107
2017; Thorne et al. 2018). These point-based models simplify spatial connectivity, and allow for 108
easier parameterization and application to multiple sites. The most prominent point-based models 109
(e.g. SLAMM, MEM, WARMER) can simulate the dynamic interaction between flooding 110
frequency and vertical accretion but neglect lateral sediment transport across the marsh111
(D’Alpaos and Marani, 2013), which leads to sediment deposition rates that depend only on 112
marsh elevation.113
Here, we propose a new, spatially resolved, landscape-scale model of salt marsh vertical 114
accretion that accounts for lateral suspended sediment transport, as well as organic matter 115
production of multiple plant species. We used the model to predict salt marsh response to SLR at 116
the Plum Island Ecosystems (PIE) Long-Term Ecological Research Site (LTER; MA, USA).117
This location is sediment-limited and bounded by steep uplands that limit marsh transgression. 118
Given these constraints, we expected PIE marshes would be especially vulnerable to drowning 119
under accelerated SLR but found that their initially high elevations allowed them to persist with 120
no loss in areal extent through 2100.121
Methods122
Study site123
The PIE LTER is a 60-km2 estuary that supports approximately 40 km2 of salt marsh, 124
making it the largest remaining area of intertidal salt marshes in the northeastern US (Kirwan et 125
al. 2011; Fig. 1). The marsh expanded rapidly during the 18th and 19th centuries when 126

7
deforestation increased sediment delivery to the coast following European settlement (Kirwan et 127
al. 2011). The estuary is macrotidal and has a tidal range of 2.9 m. External sediment is supplied 128
by the ocean and three major rivers: Parker, Ipswich, and Rowley, all of which are dammed. 129
Median suspended sediment concentration is approximately 15 mg L-1 and varies across the 130
estuary; at the head of the estuary it falls below 10 mg L-1 and reaches 40 mg L-1 at the mouth131
(Hopkinson et al. 2018). The majority of the PIE landscape is composed of high marsh (mean 132
elevation of 1.38 m above MSL) dominated by Spartina patens; low marsh (mean elevation of 133
0.98 m above MSL), dominated by tall form S. alterniflora, accounts for ~10% of total salt 134
marsh area (including ponds; Wilson et al. 2014). The local long-term (1921-2018) mean rate of 135
SLR is approximately 2.83 mm y-1, based on the sea level trend at the Boston tide station 136
(#8443970). In recent decades (1990-2018) the rate has increased to approximately 4.80 mm y-1.137
Marshes at PIE are currently in dynamic equilibrium with the long-term rate of SLR, manifested 138
by a cyclical pattern of pond formation and marsh recovery (Wilson et al. 2014), and mineral 139
accretion supplemented by sediment from channel edge erosion (Hopkinson et al. 2018).140
Model description141
We developed a landscape-scale numerical model that incorporates a spatially variable 142
suspended sediment concentration and calculates biomass for multiple plant species across the 143
marsh platform. The model domain comprised all areas of PIE (excluding ponds) within the 144
elevation range:145
( , , ) + (1)146
where Z(x,y,t) is the elevation (relative to MSL) of a location (x, y) at time t, z is the tidal range, 147
and Zmax is defined as z2/4. The domain included the entire elevational extent of marshes at PIE, 148
as well as areas of water and uplands within the elevation range. Elevations of water and uplands 149

8
within the domain were updated each time step relative to MSL. Marsh replaced water and 150
uplands when elevations were within marsh range. Accretion was only calculated in marsh. The 151
change in elevation in response to mineral and organic accretion (with rates Am and Ao,152
respectively) under a relative SLR of rate R, is given by the mass balance:153
= ( , , ) + ( , , ) (2)154
where Am is a function of elevation and distance from the nearest channel or mudflat, and Ao is a 155
function of elevation (Fig. 2). For simplicity, we assume no net mineral accretion within156
intertidal open waters, including ponds, and passive inundation of upland areas ( = ). 157
Mineral accretion model158
We employed a simplified 1D transport model (Vinent et al. 2019), in which the decrease 159
of mineral accretion rates (Am) with distance to the nearest channel/mudflat (Fig. 2a) can be 160
approximated by an exponential function:161
( , , ) = ( ) ( , )
(3)162
where is a reference accretion rate, and is a length characterizing the spatial decay of 163
mineral accretion. From mass conservation, the reference accretion rate is proportional to 164
the sediment concentration at the marsh edge ( ), an effective falling velocity and the 165
rescaled local inundation time (average fraction of time below water) ( ) = cos 1(2 / ):166
( ) = ( ) (4)167
where is the density of mineral sediments deposited on the marsh, and the fitting function 168
= 1 + 1 + /2 (with values between 0.5 and 1) represents the effect of sediment 169
inertia in the temporal decrease of suspended sediments during ebb flows.170

9
The decay length was found to scale with the ratio of tidal water discharge per unit 171
width and the effective falling velocity:172
= (5)173
where ( , ) is the length of the local drainage basin, T is the tidal period, ws is the settling 174
velocity, and = 1.5 is a fitting parameter. After calculating the distance ( , ) to the 175
channel/mudflat—defined by the MSL contour line ( ( , ) = 0)—we relate each point (x,y) to 176
the closer local maximum of the distance to the channel field. We then define the drainage length 177
( , ) associated with that point as the distance to the channel of that local maximum.178
Organic accretion model179
The organic accretion model incorporated biomass productivity for S. alterniflora and S.180
patens to account for differing contributions of organic material in low and high marsh181
environments. The rate of organic accretion (Ao) was determined by the following equation: 182
( , , ) = (6)183
where k is the recalcitrant fraction coefficient, assumed to be the lignin content of belowground 184
biomass (Benner et al. 1984), Bi is the ratio of below- to aboveground biomass for plant species 185
i, Pi is the aboveground biomass for species i, and is the density of organic sediments.186
Aboveground biomass is a function of elevation, following the parabolic relationship described 187
by Morris (2002):188
( , , ) = + + (7)189
where a, b, and c are coefficients that determine the upper and lower elevation limits of biomass190
for species i. To compute biomass corresponding with elevation Z at location (x,y), coefficient 191
= + / , in which is the maximum aboveground biomass for species192
i, and are minimum and maximum elevations at which aboveground biomass for 193

10
species i is calculated, and = /2 . Coefficient = / , and =194
/ .195
Biomass elevation ranges differed from elevation distributions of S. alterniflora and S.196
patens because elevation distributions did not overlap in the model (i.e., only one plant species 197
occurred at a given elevation). The elevation marking the transition from low to high marsh 198
(described below under Model parameterization) did not correspond with upper and lower199
elevation limits supporting biomass of S. alterniflora and S. patens, respectively. Rather, 200
biomass elevation limits for the two species overlapped (Fig. 2b). 201
Model parameterization202
To parameterize the model, we used spatial data, existing field measurements, and 203
literature on PIE (Table 1). Initial elevations for the model (2011) were defined by a vegetation-204
corrected digital elevation model (DEM) with a resolution of 1 m2, derived from 2011 LiDAR 205
(referenced to NAVD 88; Edwards 2016). The DEM was converted to a spatial resolution of 10 206
m2 before being applied to the model. The model converted the vertical datum to mean sea level 207
(MSL); unless otherwise stated, all reported elevations are relative to MSL. Initial land cover 208
was defined by a habitat raster for PIE based on the DEM and included four categories: water, 209
low marsh, high marsh, and upland (Edwards 2016). We used the DEM and habitat rasters to 210
create probability distributions of low and high marsh plants across elevation. We used these 211
distributions to assign the elevation limits for low and high marsh (0.109 m and 1.81 m, 212
respectively) and the transition elevation between low and high marsh (1.09 m), which 213
corresponded with elevations where the probability of S. alterniflora and S. patens occurrences 214
was approximately 50%. Since S. alterniflora can occur across the entire marsh elevation range, 215
the upper elevation limit for S. alterniflora biomass was the same as the high marsh upper 216

11
elevation limit (1.81 m). The lower elevation limit for S. patens biomass was 0.4 m. Biomass 217
elevation limits for both species were consistent with species elevation range limits previously 218
developed from ground-truthed spectral classifications and 2011 LiDAR (Edwards 2016).219
Elevations for peak biomass occurred at the midpoints of the biomass elevation ranges. 220
Maximum aboveground biomass for each species was estimated from field data (Morris and 221
Sundberg 2013a; b; Morris et al. 2013). Because reported ratios in the region vary widely 222
(Valiela et al. 1976; Deegan et al. 2012), below- to aboveground ratios for S. alterniflora (4.5) 223
and S. patens (1.8) were assigned that produced modeled accretion rates similar to observed 224
rates.225
Model validation226
We compared modeled initial accretion rates (t=1) under the historical rate of SLR (2.83227
mm y-1) to observed rates of elevation change from 11 surface elevation tables (SETs) installed 228
at PIE, as well as observed accretion rates from 1 SET and 3 210Pb cores for which elevation 229
change rates were not available (Wilson et al. 2014). Because the model treats accretion and 230
elevation change in the marsh as synonymous, we included both types of observed data in our 231
comparison. Modeled initial accretion rates closely matched observed data (Fig. 3; paired t = -232
0.295, df=14, p = 0.799). More than half (60%) of modeled rates were within 1 mm of observed 233
rates and all but 2 were within 2 mm. Mean modeled accretion rate among low marsh sites (n=6) 234
was 6.29 mm y-1 compared to a mean observed rate of 6.77 mm y-1. Mean modeled accretion rate 235
at high marsh sites (n=9) was 2.91 mm y-1 compared to a mean observed rate of 2.73 mm y-1.236
Model sensitivity and uncertainty237
To determine the sensitivity of modeled output to mineral and organic accretion 238
variables, we conducted a global sensitivity analysis using the Morris method (Morris 1991). We 239

12
tested model sensitivity to 8 variables we expected to have the most influence on modeled 240
accretion rates: , ws, Pi, Bi, k, and DEM elevation error (EDEM). The DEM elevation error was 241
included to account for potential discrepancies between the DEM and actual ground elevations. 242
We computed the mean elementary effect of each variable using UQLab v1.3 for Matlab based 243
on 20 combinations of input variable values randomly generated from uniform distributions 244
(requiring 180 model runs). Mean elementary effects (EE) indicated that accretion rates were 245
robust to input variables. Among mineral accretion parameters, had more influence than ws246
(mean EE = 0.09). Among organic accretion parameters, PSP and k had the most influence (mean 247
EE of 0.34 and 0.50, respectively) and the strongest interaction effects among all variables.248
Biomass ratios had no influence, and PSA had negligible influence (mean EE = 0.02). The 249
influence of EDEM was similar to PSP (mean EE = 0.32).250
We incorporated uncertainty into our model experiments to account for natural variation 251
and uncertainty of input parameters, informed by the sensitivity analysis. Model experiments252
(described below) included a range of input values for C0, PSA, PSP, and EDEM. Because the 253
sensitivity analysis indicated interaction effects between PSP and k, we included variation for PSA254
and PSP to represent uncertainty in organic accretion. Values were randomly generated from 255
uniform distributions; bounds for distributions were determined using literature and PIE field 256
data (Table 1). 257
Model experiments258
To evaluate the vulnerability of PIE marshes to SLR, we simulated accretion rates on an259
annual time step for 90 years (2011-2100) under three scenarios of projected SLR (historical, 260
medium, high). Rates of SLR were based on three emissions scenarios described in the IPCC 261
Fifth Assessment Report (IPCC 2013): historical (2.83 mm y-1), RCP 6.0 (medium; 8.72 mm y-1262

13
by 2100), and RCP 8.5 (high; 18.5 mm y-1 by 2100), and were adjusted for local subsidence 263
inferred from Boston, MA (1921-2018). We determined marsh vulnerability by examining 264
accretion rates, relative elevations, landscape composition, and areal extent of PIE marshes over 265
time and comparing results for 2100 to initial conditions in 2011. Results are reported as 266
means±1 SD computed from 300 model runs of each SLR scenario.267
To test whether reducing human impacts increased the threshold rate of SLR that PIE 268
marshes could survive, we compared maximum mineral accretion rates across the marsh 269
landscape using a suspended sediment concentration of 15 mg L-1, and a hypothetical increased 270
suspended sediment concentration of 30 mg L-1. Maximum accretion rates were calculated by 271
setting the elevation of every point on the marsh to the minimum low marsh elevation (i.e., the 272
minimum elevation at which S. alterniflora grows and the elevation at which maximum mineral 273
accretion occurs in the marsh). For this test, all input variables were fixed. We used the midpoint 274
values (1000 g m-2 and 1250 g m-2) from the uncertainty ranges for maximum aboveground 275
biomass for S. alterniflora and S. patens, respectively. We evaluated the distribution of mineral 276
deposition across the marsh landscape by comparing mineral accretion rates near tidal channels 277
and in the marsh interior under both suspended sediment concentration scenarios. The distance 278
defining marsh edge and marsh interior was based on a sediment transport length of 43.5 m 279
(Zhang et al. 2019).280
Results281
Vertical accretion282
The numerical model predicted high initial vertical accretion rates across PIE marshes283
relative to the historical rate of SLR. The mean initial vertical accretion rate from 300 model 284
runs was 3.45±0.83 mm y-1, with higher rates reaching 9.28±1.11 mm y-1 at lower elevations and 285

14
near channels. Accretion rates were dominated by organic accretion, which averaged 2.59 ±0.51286
mm y-1 and represented 75% of total accretion. The mean organic accretion rate was twice as fast 287
in low marsh (4.47±0.57 mm y-1) compared to high marsh (2.19±0.38 mm y-1), while the rate of288
mineral accretion, which averaged 0.86±0.37 mm y-1, was 5 times faster in low marsh (2.63±0.55289
mm y-1) compared to high marsh (0.52±0.28 mm y-1). Maximum mineral accretion occurred near 290
channels, reaching 7.59±1.49 mm y-1.291
Under the historical SLR scenario (2.83 mm y-1), vertical accretion rates equilibrated 292
toward the rate of SLR over time to 3.04±0.39 mm y-1 (Fig. 4a). Under higher SLR scenarios, 293
accretion rates increased through time (5.54 ±0.81 and 7.02±0.71 mm y-1 in 2100 for medium 294
and high SLR scenarios, respectively), but were slower than SLR rates, which resulted in 295
declining marsh elevations (Fig. 4b). Under the medium SLR scenario (8.72 mm y-1 by 2100),296
most of the marsh area was in an accretion deficit relative to the rate of SLR by 2100. Only in 297
low marsh along tidal channels and the Rowley River did accretion rates exceed the rate of SLR298
(reaching 9.27±1.13 mm y-1; Fig. 5). An accretion deficit occurred at every position on the marsh299
by 2100 under a high rate of SLR (18.5 mm y-1 by 2100). Accretion was fastest in low marsh 300
along tidal channels and the Rowley River. The maximum accretion rate (9.33±1.10 mm y-1) in 301
2100 was approximately half the rate of SLR.302
Elevation and MSL303
In 2011, modeled mean marsh elevation (excluding ponds) was 1.27±0.10 m above MSL304
(Fig. 4b). Under the historical rate of SLR, MSL increased 0.25 m by 2100 while mean marsh 305
elevation increased to 1.31±0.06 m above MSL. The distribution of marsh elevations in 2100 306
largely overlapped with elevations in 2011, but the frequency of higher elevations increased, 307
resulting in more high marsh (Fig. 6, Table 2). Mean sea level increased 0.60 m under the308

15
medium SLR scenario and marsh elevation decreased to 1.09±0.04 m (Fig. 4b). Mean elevation309
occurred at the transition elevation from low to high marsh, resulting in increased frequencies of 310
elevations within the low marsh range and near the lower elevation limit of high marsh by 2100311
(Fig. 6). Under the high SLR scenario, MSL increased 1.02 m and mean marsh elevation 312
dropped below the high marsh elevation range to 0.81±0.05 m (Fig. 4b). Little overlap remained 313
between 2011 and 2100 elevation distributions as elevations across the marsh shifted into the low 314
marsh range (Fig. 6).315
Marsh habitat316
In 2011, high marsh occupied 33.4±3.33 km2 and accounted for approximately 82% of 317
total marsh area (Table 2). Under the historical rate of SLR, high marsh occupied nearly all 318
(94%) of the total marsh area by 2100 as portions of adjacent uplands (1.7±0.19 km2) and low 319
marsh (4.9±2.51 km2) converted to high marsh (Fig. 7). Under a medium SLR scenario, high 320
marsh decreased in area (17.2±9.50 km2), and no longer dominated the landscape in 2100 321
(occupying 39% of total marsh area). Mean low marsh area more than tripled (26.4±9.65 km2), 322
due to the conversion of 20.3±7.0 km2 of high marsh to low marsh. Because mean marsh 323
elevation in 2100 occurred at the transition from low to high marsh, even small differences in 324
elevation between model runs created large variation in low and high marsh extents. Total marsh 325
area increased to 43.6±0.28 km2 as uplands (2.39±0.26 km2) converted to high marsh and low 326
marsh (0.24±0.13 km2) converted to open water. Under the high SLR scenario, PIE converted to327
a low marsh-dominated system by 2060 (Fig. 8). By 2100, all high marsh present in 2011 328
converted to low marsh. The conversion of uplands to marsh (3.7±0.25 km2) accounted for all 329
high marsh present in 2100 (8% of total marsh area). Approximately 1.19±0.28 km2 of low 330
marsh converted to open water, largely in low marsh areas along the Rowley River. Despite331

16
large-scale replacement of high marsh by low marsh, areal extent of PIE marshes increased to 332
44.2±0.28 km2.333
Dam removal334
Supposing dam removal doubled suspended sediment concentration, the maximum 335
mineral accretion rate would also approximately double near tidal channels and in the marsh 336
interior. Near tidal channels, maximum accretion would increase by 5.96±1.33 mm y-1 (spatial 337
mean) and by as much as 7.80 mm y-1. In the marsh interior, the mean maximum accretion rate 338
would increase by 4.10±0.96 mm y-1, and by as much as 6.80 mm y-1 (Fig. 9).339
Discussion340
Model assumptions and advances341
We created a model that incorporates spatially-variable nonlinear feedbacks characteristic 342
of process-based models into a relatively simple, easily parameterized numerical model. Within 343
the marsh, elevation change depended entirely on accretion rates because shallow subsidence at 344
Plum Island is negligible (Hopkinson et al. 2018). Ponds were treated as static features and 345
excluded from the model domain; though pond formation is cyclical, their extent is stable on the 346
time-scale simulated in our model. Consistent with other landscape models, we excluded erosion 347
as a driver of marsh area loss. Though an important source of internal sediment, marsh edge 348
erosion throughout the entire estuary currently accounts for <0.1% of total marsh area per year349
(Hopkinson et al. 2018). To maintain simplicity, the model also excluded processes that are not 350
direct results of SLR, including nutrient-induced channel widening, sediment displacement and 351
accumulation from ice rafting, and factors beyond SLR-driven geomorphic feedbacks that 352
contribute to pond formation (Deegan et al. 2012; Wilson et al. 2014). The focus was to advance353
landscape models by including dynamic, spatially variable mineral accretion rates that explicitly 354

17
relate marsh vulnerability to sediment availability across the marsh platform, and organic 355
accretion rates for multiple plant species that reflect rates specific to low and high marsh zones. 356
Therefore, at a given elevation in a marsh landscape, the model accounts for the range of 357
accretion rates that occur with respect to elevation, distance from the nearest channel, and local 358
drainage basin size (Fig. 2). The close approximation of modeled accretion rates to long-term 359
observed rates of elevation change and accretion spanning low and high marsh zones360
demonstrates the proficiency of the model in capturing on-the-ground vertical change (Fig. 3).361
Long-term responses of PIE marshes to SLR362
Model results suggest that PIE marshes will keep pace with the historical rate of SLR363
(2.83 mm y-1) through 2100, despite low sediment supply, high tidal range, and limited 364
opportunity for lateral retreat (Fig. 4, 5a). The initial mean accretion rate (3.45±0.83 mm y-1)365
exceeds the historical rate of SLR, implying that combined mineral and organic sediments are 366
sufficient to maintain elevation relative to MSL and preserve areal extents of low and high 367
marsh. Accretion is expected to decrease towards the rate of SLR over time, signaling that PIE368
marshes are in a state of dynamic equilibrium. This model prediction is consistent with other 369
research on PIE marshes. Previous numerical modeling of a generic marsh with conditions 370
similar to Plum Island suggested that PIE marshes could persist in meta-equilibrium under the 371
current rate of SLR despite having reduced sediment supply (Kirwan et al. 2011). Analysis of 372
historical imagery, sediment cores, and field experimentation likewise revealed the marshes are373
in dynamic equilibrium, evidenced by the cyclical dynamics of pond formation and recovery374
across the marsh platform (Wilson et al. 2014). Observed rates of elevation change and accretion 375
that currently enable PIE marshes to maintain equilibrium are comparable to initial modeled 376
accretion rates generated under the historical rate of SLR (Wilson et al. 2014).377
18
Model results, however, strongly suggest current sediment supply will be inadequate 378
under medium and high rates of SLR (Fig. 4a, 5b, 5c). While marsh areal extent remained stable, 379
slower accretion rates relative to medium and high rates of SLR drove elevation decline relative 380
to sea level (Fig. 4b, 6). In response, flood-tolerant S. alterniflora supplanted S. patens in areas 381
where elevation decreased below the range limit for S. patens (Fig. 7b, 8, Table 2). Spartina382
patens, which cannot tolerate anoxic soils typical of low marsh (Bertness 1991), was completely 383
replaced by S. alterniflora under a high rate of SLR as PIE converted to a low marsh system. 384
Plant productivity experiments at PIE have also indicated accelerated rates of SLR would lead to 385
eventual loss of S. patens (Morris et al. 2013). Predicted conversion to low marsh at PIE is 386
consistent with vegetation responses already underway in other New England marshes387
experiencing elevation declines relative to sea level (Watson et al. 2016). As the rate of SLR has 388
outpaced accretion rates at Headquarters Marsh in Little Narragansett Bay, CT, S. alterniflora389
and other low marsh plants have replaced S. patens over the past 50+ years (Warren and Niering 390
1993). In Narragansett Bay, RI, SLR-induced migration of S. alterniflora into high marsh has 391
been underway for at least 20 years (Donnelly and Bertness 2001). In regions where landward 392
migration is possible, new high marsh supporting S. patens can develop in adjacent uplands. At 393
PIE and other systems where room for migration is severely restricted, low marsh conversion 394
will be coupled with loss of S. patens and its attendant ecological functions, namely, fixing 395
nitrogen via mycorrhizae and providing habitat for nesting birds (Watson et al. 2016).396
Accelerated accretion rates tend to accompany high to low marsh conversion as increased 397
sediment delivery and contingent plant productivity accompany increased flooding. At PIE, 398
accretion rates at low marsh SET and core sites are approximately 2.5 times higher than high 399
marsh sites (Wilson et al. 2014). Model results predicted accretion rates would increase 61% and 400

19
103% by 2100 under medium and high rates of SLR, respectively, as the extent of low marsh 401
increases (Fig. 4). Typically, the feedback between accretion rates and MSL enables low marsh 402
elevations to stabilize relative to SLR (Kirwan et al. 2016a). For example, increased inundation403
led to increased mineral deposition on undisturbed marshes in Long Island, NY, driving higher 404
accretion rates and promoting marsh resilience (Kolker et al. 2010). When elevation decreases 405
within the range supporting peak productivity of low marsh plants, organic accretion and 406
increased carbon storage also enable marsh elevation to stabilize relative to sea level, as 407
demonstrated in New England marshes in Cape Cod, MA (Gonneea et al. 2019). However,408
similar to other sediment-poor, organic-rich New England marshes (Carey et al. 2017), our409
model predictions suggest reduced sediment availability at PIE will prevent marsh elevation 410
from stabilizing even as accretion rates increase across an expanding low marsh. Even if the 411
maximum accretion rate predicted in 2100 (9.33±1.10 mm y-1) occurred at every position of the 412
marsh platform, it would be insufficient to stabilize the elevation under a high rate of SLR.413
Human impacts increase marsh vulnerability to SLR by disrupting feedbacks that drive 414
vertical accretion and restricting lateral migration (Kennish 2001; Kirwan and Megonigal 2013).415
Plum Island marshes are restricted primarily by sediment availability, which is naturally low in 416
the region, and has been reduced further by human activities. Dams on the rivers feeding into 417
PIE as well as extensive freshwater marsh and forest upstream limit sediment delivery to <10% 418
of what is required for the marsh platform to maintain its elevation relative to sea level419
(Hopkinson et al. 2018). Consequently, marshes must depend on marsh edge erosion, the ocean, 420
and/or tidal flat erosion as primary sediment sources. Edge erosion potentially provides 31% of 421
sediment needed to maintain marsh elevation under the current rate of SLR; sediment mass 422
balance by Hopkinson et al. 2018 implies that the ocean and tidal flat erosion provide the 423

20
remaining sediment required for marsh accretion. Whether these sources can provide sufficient 424
sediment under accelerated rates of SLR may largely dictate long-term marsh survival.425
We considered a hypothetical case in which removing the dam on the Ipswich River 426
located at the head of tide doubled suspended sediment concentration to 30 mg L-1 (Fig. 9).427
Removal of this dam is an action under consideration by local officials that could increase 428
sediment loading and prolong salt marsh survival (Hopkinson et al. 2018). Such increases could 429
potentially enable mean vertical accretion to equilibrate to a medium rate of SLR (predicted to be 430
5.54±0.81 mm y-1 by 2100 under the current suspended sediment concentration) and reduce 431
marsh conversion under a high rate of SLR. Nevertheless, these are simplistic predictions 432
because we have not modeled how dam removal would actually change suspended sediment 433
concentrations.434
PIE vulnerability vs. elevation capital435
Salt marsh vulnerability to SLR is generally thought to depend on sediment availability, 436
tidal range, and opportunity for landward migration. Marshes with insufficient sediment supply 437
or unavailable surrounding uplands are frequently reported to be more susceptible to drowning 438
than marshes with adequate sediment and accessible uplands (Reed 1995; FitzGerald et al. 2008; 439
Kirwan et al. 2010; Day et al. 2011; Doody 2013). For example, sediment-deficient coastal 440
wetlands along the East and Gulf Coasts of the US fed by dammed rivers and subject to higher 441
rates of SLR are particularly vulnerable to drowning (Weston 2014). Previous numerical 442
modeling has emphasized vertical and lateral constraints on wetland adaptability. Tidal marshes 443
lacking available adjacent uplands in the San Francisco Bay Estuary were identified as less 444
resilient to accelerated rates of SLR than marshes with room to migrate landward according to 445
results from a MEM model (Schile et al. 2014). Likewise, marshes with low vertical accretion 446

21
and limited opportunity for migration along the US Pacific Coast face a high risk of drowning by 447
2110 based on WARMER model results (Thorne et al. 2018). Results of a Hydro-MEM model 448
also demonstrated that the portions of marshes in Florida most susceptible to drowning under 449
accelerated rates of SLR were in areas with limited room for migration (Alizad et al. 2016a; b).450
In contrast to previous work linking marsh vulnerability to sediment supply and landward 451
migration, we found that PIE marshes are not immediately vulnerable to drowning despite their 452
low sediment supply and migration potential. The areal extent of PIE was preserved even as 453
accretion rates failed to keep pace and marsh elevation decreased because marshes in the estuary 454
have high elevation capital. Elevation capital, or the vertical accumulation of material during 455
marsh development that contributes to marsh elevation, provides marshes with a vertical reserve 456
even when accretion rates cannot keep pace with SLR (Reed 2002; Cahoon and Guntenspergen 457
2010).458
The finding that elevation capital prolongs marsh survival is consistent with previous 459
work. For example, Cahoon et al. (2019) found that among marshes with the same sediment 460
source and subject to the same tidal range and rate of SLR in Jamaica Bay, NY, those with high 461
elevation capital maintained their relative elevation, while the low elevation marsh depleted its 462
vertical reserve and deteriorated. Marshes with elevation capital in southern New England were 463
also found to be more stable because they produced more belowground biomass than lower, 464
more frequently inundated marshes experiencing decline (Watson et al. 2017). However, 465
elevation capital does not always alleviate the risk of drowning. Marshes along the US Pacific 466
Coast were predicted to be highly susceptible to submergence due to low sediment supply and 467
restricted lateral movement, despite having high elevation capital (Thorne et al. 2018).468
22
For PIE marshes, high elevation capital does not eliminate the long-term threat of marsh 469
loss under accelerated SLR but slows the rate at which loss occurs. Our model predicts 470
widespread vegetation change, accretion deficits across the marsh, including in low marsh areas 471
near channels where mineral accretion is highest, and trajectories of decreasing elevation under 472
medium and high rates of SLR. Therefore, PIE marshes could eventually be vulnerable to 473
drowning, but on a timeline that extends beyond 2100. Although sediment-deficient marshes 474
with limited migration space are considered extremely vulnerable to SLR (Reed 1995; Kirwan et 475
al. 2016b; Raposa et al. 2017; Thorne et al. 2018), our results highlight that marshes with high 476
elevation capital can maintain their areal extent for decades to centuries even under conditions in 477
which they will inevitably drown.478
479
23
References480
Alizad, K., S. C. Hagen, J. T. Morris, P. Bacopoulos, M. V. Bilskie, J. F. Weishampel, and S. C. 481
Medeiros. 2016a. A coupled, two-dimensional hydrodynamic-marsh model with biological 482
feedback. Ecol. Modell. 327: 29–43, doi:10.1016/j.ecolmodel.2016.01.013483
Alizad, K., S. C. Hagen, J. T. Morris, S. C. Medeiros, M. V. Bilskie, and J. F. Weishampel. 484
2016b. Coastal wetland response to sea-level rise in a fluvial estuarine system. Earth’s 485
Futur. 4: 483–497, doi:10.1002/2016EF000385486
Bamber, J. L., M. Oppenheimer, R. E. Kopp, W. P. Aspinall, and R. M. Cooke. 2019. Ice sheet 487
contributions to future sea-level rise from structured expert judgment. Proc. Natl. Acad. Sci. 488
USA 116: 11195–11200, doi:10.1073/pnas.1817205116489
Benner, R., S. Y. Newell, A. E. Maccubbin, and R. E. Hodson. 1984. Relative contributions of 490
bacteria and fungi to rates of degradation of lignocellulosic detritus in salt-marsh sediments. 491
Appl. Environ. Microbiol. 48: 36–40.492
Bertness, M. D. 1991. Zonation of Spartina patens and Spartina alterniflora in New England salt 493
marsh. Ecology 72: 138–148, doi:10.2307/1938909494
Borchert, S. M., M. J. Osland, N. M. Enwright, and K. T. Griffith. 2018. Coastal wetland 495
adaptation to sea level rise: Quantifying potential for landward migration and coastal 496
squeeze. J. Appl. Ecol. 55: 2876–2887, doi:10.1111/1365-2664.13169497
Cadol, D., A. J. Elmore, S. M. Guinn, K. A. M. Engelhardt, and G. Sanders. 2016. Modeled 498
tradeoffs between developed land protection and tidal habitat maintenance during rising sea 499
levels. PLoS One 11: e0164875, doi:10.1371/journal.pone.0164875500
Cadol, D., K. Engelhardt, A. Elmore, and G. Sanders. 2014. Elevation-dependent surface 501
elevation gain in a tidal freshwater marsh and implications for marsh persistence. Limnol. 502

24
Oceanogr. 59: 1065–1080, doi:10.4319/lo.2014.59.3.1065503
Cahoon, D. R., and G. R. Guntenspergen. 2010. Climate change, sea-level rise, and coastal 504
wetlands. Natl. Wetl. Newsl. 32: 8–12.505
Cahoon, D. R., J. C. Lynch, C. T. Roman, J. P. Schmit, and D. E. Skidds. 2019. Evaluating the 506
relationship among wetland vertical development, elevation capital, sea-level rise, and tidal 507
marsh sustainability. Estuar. Coasts 42: 1–15, doi:10.1007/s12237-018-0448-x508
Carey, J. C., S. B. Moran, R. P. Kelly, A. S. Kolker, and R. W. Fulweiler. 2017. The declining 509
role of organic matter in New England salt marshes. Estuar. Coasts 40: 626–639,510
doi:10.1007/s12237-015-9971-1511
Carniello, L., A. Defina, and L. D’Alpaos. 2009. Morphological evolution of the Venice lagoon: 512
Evidence from the past and trend for the future. J. Geophys. Res. 114: F04002, 513
doi:10.1029/2008JF001157514
Crosby, S. C., D. F. Sax, M. E. Palmer, H. S. Booth, L. A. Deegan, M. D. Bertness, and H. M. 515
Leslie. 2016. Salt marsh persistence is threatened by predicted sea-level rise. Estuarine, 516
Coastal Shelf Sci. 181: 93–99, doi:10.1016/J.ECSS.2016.08.018517
D’Alpaos, A., S. Lanzoni, M. Marani, and A. Rinaldo. 2007. Landscape evolution in tidal 518
embayments: Modeling the interplay of erosion, sedimentation, and vegetation dynamics. J. 519
Geophys. Res. 112: F01008, doi:10.1029/2006JF000537520
Day, J. W., G. P. Kemp, D. J. Reed, D. R. Cahoon, R. M. Boumans, J. M. Suhayda, and R. 521
Gambrell. 2011. Vegetation death and rapid loss of surface elevation in two contrasting 522
Mississippi delta salt marshes: The role of sedimentation, autocompaction and sea-level 523
rise. Ecol. Eng. 37: 229–240, doi:10.1016/j.ecoleng.2010.11.021524
Deegan, L. A., D. S. Johnson, R. S. Warren, B. J. Peterson, J. W. Fleeger, S. Fagherazzi, and W. 525

25
M. Wollheim. 2012. Coastal eutrophication as a driver of salt marsh loss. Nature 490: 388–526
392, doi:10.1038/nature11533527
Donnelly, J. P., and M. D. Bertness. 2001. Rapid shoreward encroachment of salt marsh 528
cordgrass in response to accelerated sea-level rise. Proc. Natl. Acad. Sci. USA 98: 14218–529
14223, doi:10.1073/pnas.251209298530
Doody, J. P. 2013. Coastal squeeze and managed realignment in southeast England, does it tell 531
us anything about the future? Ocean Coast. Manag. 79: 34–41,532
doi:10.1016/j.ocecoaman.2012.05.008533
-scale 534
predictive models to local-scale biomass estimation. Master’s thesis. University of South 535
Carolina.536
Enwright, N. M., K. T. Griffith, and M. J. Osland. 2016. Barriers to and opportunities for 537
landward migration of coastal wetlands with sea-level rise. Front. Ecol. Environ. 14: 307–538
316, doi:10.1002/fee.1282539
Fagherazzi, S. and others. 2012. Numerical models of salt marsh evolution: Ecological, 540
geomorphic, and climatic factors. Rev. Geophys. 50: RG1002, doi:10.1029/2011RG000359541
FitzGerald, D. M., M. S. Fenster, B. A. Argow, and I. V. Buynevich. 2008. Coastal impacts due 542
to sea-level rise. Annu. Rev. Earth Planet. Sci. 36: 601–647,543
doi:10.1146/annurev.earth.35.031306.140139544
FitzGerald, D. M., and Z. Hughes. 2019. Marsh processes and their response to climate change 545
and sea-level rise. Annu. Rev. Earth Planet. Sci. 47: 481–517, doi:10.1146/annurev-earth-546
082517-010255547
French, J. 2006. Tidal marsh sedimentation and resilience to environmental change: Exploratory 548

26
modelling of tidal, sea-level and sediment supply forcing in predominantly allochthonous 549
systems. Mar. Geol. 235: 119–136, doi:10.1016/j.margeo.2006.10.009550
Friedrichs, C. T., and J. E. Perry. 2001. Tidal salt marsh morphodynamics: A synthesis. J. 551
Coastal Res. 27: 7–37.552
Gittman, R. K., F. J. Fodrie, A. M. Popowich, D. A. Keller, J. F. Bruno, C. A. Currin, C. H. 553
Peterson, and M. F. Piehler. 2015. Engineering away our natural defenses: An analysis of 554
shoreline hardening in the US. Front. Ecol. Environ. 13: 301–307, doi:10.1890/150065555
Gleason, M. L., D. A. Elmer, N. C. Pien, and J. S. Fisher. 1979. Effects of stem density upon 556
sediment retention by salt marsh cord grass, Spartina alterniflora Loisel. Estuaries 2: 271–557
273, doi:10.2307/1351574558
Gonneea, M. E. and others. 2019. Salt marsh ecosystem restructuring enhances elevation 559
resilience and carbon storage during accelerating relative sea-level rise. Estuarine, Coastal 560
Shelf Sci. 217: 56–68, doi:10.1016/j.ecss.2018.11.003561
Gu, J., M. Luo, X. Zhang, G. Christakos, S. Agusti, C. M. Duarte, and J. Wu. 2018. Losses of 562
salt marsh in China: Trends, threats and management. Estuarine, Coastal Shelf Sci. 214: 98–563
109, doi:10.1016/j.ecss.2018.09.015564
Hopkinson, C. S., J. T. Morris, S. Fagherazzi, W. M. Wollheim, and P. A. Raymond. 2018. 565
Lateral marsh edge erosion as a source of sediments for vertical marsh accretion. J. 566
Geophys. Res. Biogeosci. 123: 2444–2465, doi:10.1029/2017JG004358567
Horton, B. P., S. Rahmstorf, S. E. Engelhart, and A. C. Kemp. 2014. Expert assessment of sea-568
level rise by AD 2100 and AD 2300. Quat. Sci. Rev. 84: 1–6,569
doi:10.1016/j.quascirev.2013.11.002570
IPCC. 2013. Climate Change 2013: The Physical Science Basis. Contribution of Working Group 571

27
I to the Fifth Assessment Report of the Intergovernmental Panel on Climate Change In T.F. 572
Stocker et al. [eds.].doi:10.1017/CBO9781107415324573
Jankowski, K. L., T. E. Törnqvist, and A. M. Fernandes. 2017. Vulnerability of Louisiana’s574
coastal wetlands to present-day rates of relative sea-level rise. Nat. Commun. 8: 14792, 575
doi:10.1038/ncomms14792576
Kearney, M. S., A. S. Rogers, J. R. G. Townshend, E. Rizzo, D. Stutzer, J. C. Stevenson, and K. 577
Sundborg. 2002. Landsat imagery shows decline of coastal marshes in Chesapeake and 578
Delaware Bays. Eos, Trans. Am. Geophys. Union 83: 173–178,579
doi:10.1029/2002EO000112580
Kennish, M. J. 2001. Coastal salt marsh systems in the U.S.: A review of anthropogenic impacts. 581
J. Coastal Res. 17: 731–748.582
Kirwan, M. L., and K. B. Gedan. 2019. Sea-level driven land conversion and the formation of 583
ghost forests. Nat. Clim. Change 9: 450–457, doi:10.1038/s41558-019-0488-7584
Kirwan, M. L., and G. R. Guntenspergen. 2012. Feedbacks between inundation, root production, 585
and shoot growth in a rapidly submerging brackish marsh. J. Ecol. 100: 764–770,586
doi:10.1111/j.1365-2745.2012.01957.x587
Kirwan, M. L., G. R. Guntenspergen, A. D’Alpaos, J. T. Morris, S. M. Mudd, and S. 588
Temmerman. 2010. Limits on the adaptability of coastal marshes to rising sea level. 589
Geophys. Res. Lett. 37: L23401, doi:10.1029/2010GL045489590
Kirwan, M. L., and J. P. Megonigal. 2013. Tidal wetland stability in the face of human impacts 591
and sea-level rise. Nature 504: 53–60.592
Kirwan, M. L., and A. B. Murray. 2007. A coupled geomorphic and ecological model of tidal 593
marsh evolution. Proc. Natl. Acad. Sci. USA 104: 6118–6122,594

28
doi:10.1073/pnas.0700958104595
Kirwan, M. L., A. B. Murray, J. P. Donnelly, and D. R. Corbett. 2011. Rapid wetland expansion 596
during European settlement and its implication for marsh survival under modern sediment 597
delivery rates. Geology 39: 507–510, doi:10.1130/G31789.1598
Kirwan, M. L., S. Temmerman, E. E. Skeehan, G. R. Guntenspergen, and S. Fagherazzi. 2016a. 599
Overestimation of marsh vulnerability to sea level rise. Nat. Clim. Change 6: 253–260,600
doi:10.1038/nclimate2909601
Kirwan, M. L., D. C. Walters, W. G. Reay, and J. A. Carr. 2016b. Sea level driven marsh 602
expansion in a coupled model of marsh erosion and migration. Geophys. Res. Lett. 43: 603
4366–4373, doi:10.1002/2016GL068507604
Kolker, A. S., M. L. Kirwan, S. L. Goodbred, and J. K. Cochran. 2010. Global climate changes 605
recorded in coastal wetland sediments: Empirical observations linked to theoretical 606
predictions. Geophys. Res. Lett. 37: L14706, doi:10.1029/2010GL043874607
Langston, A. K., D. A. Kaplan, and F. E. Putz. 2017. A casualty of climate change? Loss of 608
freshwater forest islands on Florida’s Gulf Coast. Glob. Chang. Biol. 23: 5383–5397,609
doi:10.1111/gcb.13805610
Li, H., and S. L. Yang. 2009. Trapping effect of tidal marsh vegetation on suspended sediment, 611
Yangtze Delta. J. Coastal Res. 254: 915–924, doi:10.2112/08-1010.1612
Morris, J., and K. Sundberg. 2013a. Aboveground biomass data from control sites in a Spartina 613
alterniflora-dominated salt marsh at Law’s Point, Rowley River, Plum Island Ecosystem 614
LTER, MA. Environ. Data Initiat., doi:10.6073/pasta/f089bf982920061722a03ec3f73b55e7615
Morris, J., and K. Sundberg. 2013b. Aboveground biomass from control plots in a Spartina 616
patens-dominated salt marsh at Law’s Point, Rowley River, Plum Island Ecosystem LTER, 617

29
MA. Environ. Data Initiat., doi:10.6073/pasta/2f253e2853b65c8e096f9b77099717a0618
Morris, J. T. and others. 2016. Contributions of organic and inorganic matter to sediment volume 619
and accretion in tidal wetlands at steady state. Earth’s Futur. 4: 110–121,620
doi:10.1002/2015EF000334621
Morris, J. T., P. V. Sundareshwar, C. T. Nietch, B. Kjerfve, and D. R. Cahoon. 2002. Responses 622
of coastal wetlands to rising sea level. Ecology 83: 2869–2877, doi:10.1890/0012-623
9658(2002)083[2869:ROCWTR]2.0.CO;2624
Morris, J. T., K. Sundberg, and C. S. Hopkinson. 2013. Salt marsh primary production and its 625
responses to relative sea level and nutrients in estuaries at Plum Island, Massachusetts, and 626
North Inlet, South Carolina, USA. Oceanography 26: 78–84, doi:10.2307/24862067627
Morris, M. D. 1991. Factorial sampling plans for preliminary computational experiments. 628
Technometrics 33: 161–174, doi:10.1080/00401706.1991.10484804629
Mudd, S. M., S. M. Howell, and J. T. Morris. 2009. Impact of dynamic feedbacks between 630
sedimentation, sea-level rise, and biomass production on near-surface marsh stratigraphy 631
and carbon accumulation. Estuarine, Coastal Shelf Sci. 82: 377–389,632
doi:10.1016/j.ecss.2009.01.028633
Murray, N. J., R. S. Clemens, S. R. Phinn, H. P. Possingham, and R. A. Fuller. 2014. Tracking 634
the rapid loss of tidal wetlands in the Yellow Sea. Front. Ecol. Environ. 12: 267–272,635
doi:10.1890/130260636
Nerem, R. S., B. D. Beckley, J. T. Fasullo, B. D. Hamlington, D. Masters, and G. T. Mitchum. 637
2018. Climate-change-driven accelerated sea-level rise detected in the altimeter era. Proc. 638
Natl. Acad. Sci. USA 115: 2022–2025, doi:10.1073/pnas.1717312115639
Nyman, J. A., R. J. Walters, R. D. Delaune, and W. H. Patrick. 2006. Marsh vertical accretion 640

30
via vegetative growth. Estuarine, Coastal Shelf Sci. 69: 370–380,641
doi:10.1016/j.ecss.2006.05.041642
Raposa, K. B., R. L. J. Weber, M. C. Ekberg, and W. Ferguson. 2017. Vegetation dynamics in 643
Rhode Island salt marshes during a period of accelerating sea level rise and extreme sea 644
level events. Estuar. Coasts 40: 640–650, doi:10.1007/s12237-015-0018-4645
Redfield, A. C. 1972. Development of a New England salt marsh. Ecol. Monogr. 42: 201–237,646
doi:10.2307/1942263647
Reed, D. J. 1995. The response of coastal marshes to sea-level rise: Survival or submergence? 648
Earth Surf. Processes Landforms 20: 39–48, doi:10.1002/esp.3290200105649
Reed, D. J. 2002. Sea-level rise and coastal marsh sustainability: Geological and ecological 650
factors in the Mississippi delta plain. Geomorphology 48: 233–243, doi:10.1016/S0169-651
555X(02)00183-6652
Rogers, K. and others. 2019. Wetland carbon storage controlled by millennial-scale variation in 653
relative sea-level rise. Nature 567: 91–95, doi:10.1038/s41586-019-0951-7654
Roner, M., A. D’Alpaos, M. Ghinassi, M. Marani, S. Silvestri, E. Franceschinis, and N. Realdon. 655
2016. Spatial variation of salt-marsh organic and inorganic deposition and organic carbon 656
accumulation: Inferences from the Venice lagoon, Italy. Adv. Water Resour. 93: 276–287,657
doi:10.1016/J.ADVWATRES.2015.11.011658
Schalles, J. F., C. M. Hladik, A. A. Lynes, and S. C. Pennings. 2013. Landscape estimates of 659
habitat types, plant biomass, and invertebrate densities in a Georgia salt marsh. 660
Oceanography 26: 88–97, doi:10.2307/24862069661
Schieder, N. W., D. C. Walters, and M. L. Kirwan. 2018. Massive upland to wetland conversion 662
compensated for historical marsh loss in Chesapeake Bay, USA. Estuar. Coasts 41: 940–663

31
951, doi:10.1007/s12237-017-0336-9664
Schile, L. M., J. C. Callaway, J. T. Morris, D. Stralberg, V. T. Parker, and M. Kelly. 2014. 665
Modeling tidal marsh distribution with sea-level rise: Evaluating the role of vegetation, 666
sediment, and upland habitat in marsh resiliency. PLoS One 9: e88760, 667
doi:10.1371/journal.pone.0088760668
Schuerch, M. and others. 2018. Future response of global coastal wetlands to sea-level rise. 669
Nature 561: 231–234, doi:10.1038/s41586-018-0476-5670
Swanson, K. M., J. Z. Drexler, D. H. Schoellhamer, K. M. Thorne, M. L. Casazza, C. T. 671
Overton, J. C. Callaway, and J. Y. Takekawa. 2014. Wetland accretion rate model of672
ecosystem resilience (WARMER) and its application to habitat sustainability for 673
endangered species in the San Francisco Estuary. Estuar. Coasts 37: 476–492,674
doi:10.1007/s12237-013-9694-0675
Syvitski, J. P. M., C. J. Vörösmarty, A. J. Kettner, and P. Green. 2005. Impact of humans on the 676
flux of terrestrial sediment to the global coastal ocean. Science 308: 376–380, 677
doi:10.1126/science.1109454678
Temmerman, S., T. J. Bouma, G. Govers, Z. B. Wang, M. B. De Vries, and P. M. J. Herman. 679
2005. Impact of vegetation on flow routing and sedimentation patterns: Three-dimensional 680
modeling for a tidal marsh. J. Geophys. Res. Earth Surf. 110: F04019, 681
doi:10.1029/2005JF000301682
Temmerman, S., T. J. Bouma, J. Van de Koppel, D. Van der Wal, M. B. De Vries, and P. M. J. 683
Herman. 2007. Vegetation causes channel erosion in a tidal landscape. Geology 35: 631–684
634, doi:10.1130/G23502A.1685
Thorne, K. and others. 2018. U.S. Pacific coastal wetland resilience and vulnerability to sea-level 686
32
rise. Sci. Adv. 4: eaao3270, doi:10.1126/sciadv.aao3270687
Torio, D. D., and G. L. Chmura. 2013. Assessing coastal squeeze of tidal wetlands. J. Coastal 688
Res. 29: 1049–1061, doi:10.2112/JCOASTRES-D-12-00162.1689
Valiela, I., J. M. Teal, and N. Y. Persson. 1976. Production and dynamics of experimentally 690
enriched salt marsh vegetation: Belowground biomass1. Limnol. Oceanogr. 21: 245–252,691
doi:10.4319/lo.1976.21.2.0245692
Vinent, O. D., E. R. Herbert, and M. L. Kirwan. 2019. Lower threshold for marsh drowning 693
suggests loss of microtidal marshes regardless of sediment supply. EarthArXiv, 694
doi:10.31223/OSF.IO/CXVQ6695
Warren, R. S., and W. A. Niering. 1993. Vegetation change on a Northeast tidal marsh: 696
Interaction of sea-level rise and marsh accretion. Ecology 74: 96–103, doi:10.2307/1939504697
Watson, E. B., K. Szura, C. Wigand, K. B. Raposa, K. Blount, and M. Cencer. 2016. Sea level 698
rise, drought and the decline of Spartina patens in New England marshes. Biol. Conserv. 699
196: 173–181, doi:10.1016/J.BIOCON.2016.02.011700
Watson, E. B., C. Wigand, E. W. Davey, H. M. Andrews, J. Bishop, and K. B. Raposa. 2017. 701
Wetland loss patterns and inundation-productivity relationships prognosticate widespread 702
salt marsh loss for southern New England. Estuar. Coasts 40: 662–681,703
doi:10.1007/s12237-016-0069-1704
Weston, N. B. 2014. Declining sediments and rising seas: An unfortunate convergence for tidal 705
wetlands. Estuar. Coasts 37: 1–23, doi:10.1007/s12237-013-9654-8706
Wilson, C. A., Z. J. Hughes, D. M. FitzGerald, C. S. Hopkinson, V. Valentine, and A. S. Kolker. 707
2014. Saltmarsh pool and tidal creek morphodynamics: Dynamic equilibrium of northern 708
latitude saltmarshes? Geomorphology 213: 99–115, doi:10.1016/j.geomorph.2014.01.002709

33
Wright, L. D., J. P. M. Syvitski, and C. R. Nichols. 2019. Sea Level Rise: Recent Trends and 710
Future Projections, p. 47–57. In L. Wright and C. Nichols [eds.], Tomorrow’s Coasts: 711
Complex and Impermanent. Coastal Research Library vol. 27, Springer.712
Wu, W., P. Biber, and M. Bethel. 2017. Thresholds of sea-level rise rate and sea-level rise 713
acceleration rate in a vulnerable coastal wetland. Ecol. Evol. 7: 10890–10903,714
doi:10.1002/ece3.3550715
Zedler, J. B., and S. Kercher. 2005. Wetland resources: Status, trends, ecosystem services, and 716
restorability. Annu. Rev. Environ. Resour. 30: 39–74,717
doi:10.1146/annurev.energy.30.050504.144248718
Zhang, X., N. Leonardi, C. Donatelli, and S. Fagherazzi. 2019. Fate of cohesive sediments in a 719
marsh-dominated estuary. Adv. Water Resour. 125: 32–40,720
doi:10.1016/J.ADVWATRES.2019.01.003721
722

34
Acknowledgments723
Conversations with Anne Giblin and Jim Morris helped motivate this work. We thank Jim 724
Morris and James Edwards for providing the DEM and habitat base maps, and Hap Garritt and 725
Tyler Messerschmidt for helping locate public datasets. This work was supported by NSF 726
Coastal SEES (#1426981), NSF LTER (Plum Island Ecosystems #1637630 and Virginia Coast 727
Reserve #1832221), NSF GLD (#1529245), and NSF CAREER (#1654374). The authors have 728
no affiliations with any organizations with financial or non-financial interests in the subject 729
matter discussed in this manuscript and therefore declare no conflict of interest. This is 730
contribution no. 3888 of the Virginia Institute of Marine Science.731

35
Table 1. Model parameterization for computing mineral and organic accretion rates732
Parameter Description Value Reference
Mineral Accretion (Am)
C0 Suspended sediment concentration 10-20 mg L-1 Hopkinson et al. 2018
ws Settling velocity 1 x 10⁻⁴ m s-1 Temmerman et al. 2005 Temmerman et al. 2005
m Inorganic sediment density 1.99 x 10⁶ g m-3 Morris et al. 2016 (Morris et al. 2016)
Organic Accretion (Ao)
PSAmax S. alterniflora maximum biomass 500-1500 g m-2 Morris and Sundberg 2013a; b
PSPmax S. patens maximum biomass 750-1750 g m-2 Morris and Sundberg 2013a; b
BSA S. alterniflora biomass ratio 4.5
BSP S. patens biomass ratio 1.8
k Recalcitrant fraction coefficient 0.1 Benner et al. 1984
o Organic sediment density 8.5 x 10⁴ g m3 Morris et al. 2016
Elevation (Z)
EDEM Potential DEM error Z±0.2 m Edwards 2016
733
734

36
Table 2. Summary of habitat area (mean±1 SD) and percent change in habitat type between 2011 735
and 2100 under historical, medium, and high SLR scenarios (n=300 model runs per scenario)736
2011 Historical 2100 Medium 2100 High 2100
km2 km2 % change km2 % change km2 % change
Total marsh 40.7±0.48 42.4±0.28 +4 43.6±0.28 +7 44.2±0.28 +9
Low marsh 7.26±3.72 2.35±0.54 -68 26.4±9.65 +264 40.5±0.35 +458
High marsh 33.4±3.33 40.1±0.46 +20 17.2±9.50 -49 3.70±0.25 -89
Upland 2.40±0.26 2.02±0.13 -16 1.68±0.11 -30 1.33±0.09 -45
737
738
37
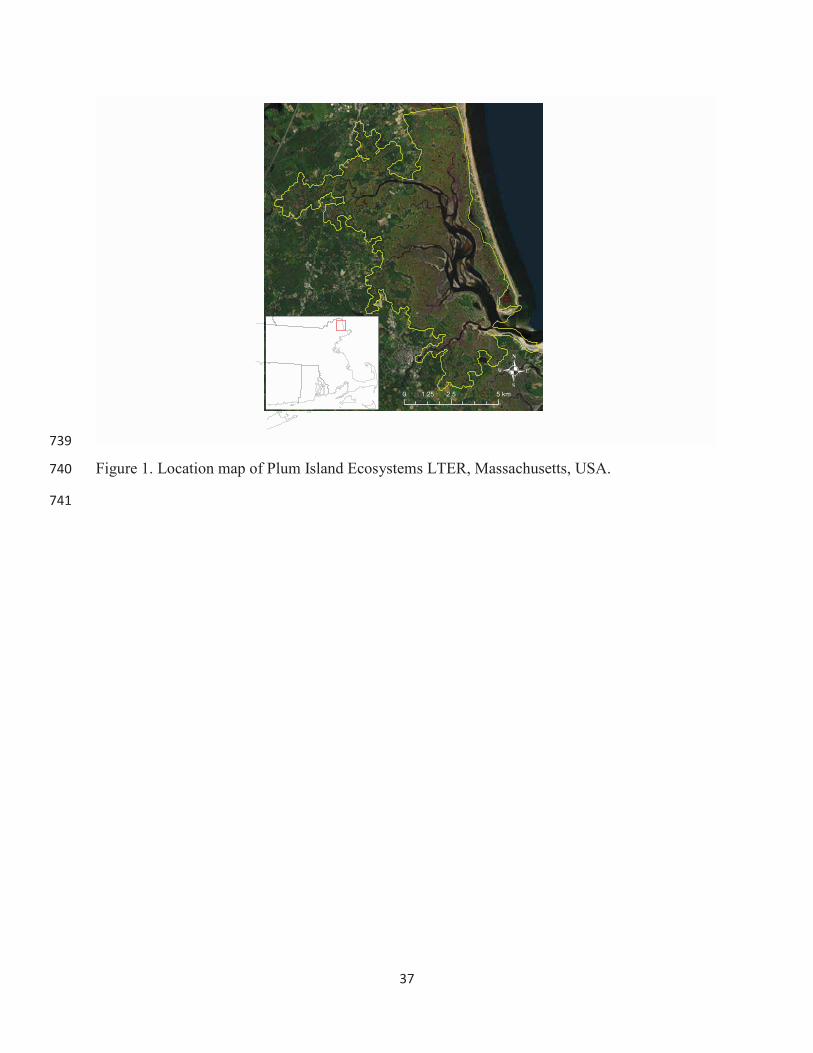
739
Figure 1. Location map of Plum Island Ecosystems LTER, Massachusetts, USA.740
741

38
742
Figure 2. Model design for mineral and organic accretion: a) mineral accretion rates (Am)743
decrease with distance from the nearest channel and vary depending on local drainage basin size, 744
illustrated using a constant elevation (z = 0.109 m) across the marsh (grid size: 10m2) and initial 745
accretion rates; b) aboveground biomass (Pi: blue) and organic accretion rates (Ao: green) for 746
Spartina alterniflora (below 1.09 m) and S. patens (above 1.09 m) depend on marsh elevation 747
(arrow marks low to high marsh transition; dotted curve is the portion of the biomass curve 748
outside modeled elevation range for each species); c) total, mineral and organic accretion rates 749
across elevation (At: black; Am: orange; Ao: green) at every position on the marsh under initial 750
conditions; for a given elevation, Am varies depending on distance from the nearest channel.751

39
752
Figure 3. Model comparison: a) accretion and elevation change rates across elevation (modeled 753
accretion rates: red circles; observed rates of elevation change: blue squares; observed accretion 754
rates: blue diamonds); b) locations of observed rates from SETs and 210Pb cores reported in 755
Wilson et al. 2014.756

40
757
Figure 4. Mean marsh accretion rates (±1 SD) over time a) under the historical, medium, and 758
high SLR scenarios (rate of SLR: blue line; At: solid orange; Am: dashed orange; Ao: dotted 759
orange), and b) mean elevation (orange lines; ±1 SD) and MSL (blue lines) over time for 760
historical (solid), medium (dashed), and high (dotted) SLR scenarios.761

41
762
Figure 5. Total (At) accretion rates in 2100 for a) historical, b) medium, and c) high SLR 763
scenarios. Inset highlights portion of PIE dominated by low marsh, where observed accretion and 764
elevation change rates are measured.765
766

42
767
Figure 6. Elevation change for each SLR scenario: elevation distribution across the marsh 768
platform in 2011 (black outline) and in 2100 for historical (yellow), medium (orange), and high 769
(red) SLR scenarios.770

43
771
Figure 7. Mean habitat area (±1 SD) over time (total marsh: solid black line; high marsh: dashed 772
green; low marsh: dash-dot yellow; upland: dotted brown) and spatial distribution of habitat in 773
2100 (high marsh: green; low marsh: yellow; water: blue; upland: brown) for a) historical and b) 774
medium SLR scenarios. Note that white patches are ponds and high elevation areas outside the 775
model domain.776

44
777
Figure 8. Habitat changes under the high SLR scenario in a) mean area over time (±1 SD; total 778
marsh: solid black line; high marsh: dashed green; low marsh: dash-dot yellow; upland: dotted 779
brown), and b) spatial distribution in 2011, 2040, 2070, and 2100 (high marsh: green; low marsh: 780
yellow; water: blue; upland: brown). 781

45
782
Figure 9. Comparison of maximum mineral accretion rates under a) the current median783
suspended sediment concentration of 15 mg L-1 and b) a hypothetical suspended sediment 784
concentration of 30 mg L-1; elevation in each scenario was set to a uniform depth of 0.109 m 785
above MSL.786
787