
Langley Holdings plc Sheetfed manrolandsheetfed.com Manroland Sheetfed is a leading producer of...
99
20 17 langleyholdings.com Langley Holdings plc Annual Report & Accounts 2017 17
Transcript of Langley Holdings plc Sheetfed manrolandsheetfed.com Manroland Sheetfed is a leading producer of...

2017langleyholdings.com
Langley Holdings plcAnnual Report & Accounts 2017
Annual R
eport & A
ccounts 2017Langley H
oldings plc 17

ContentsGroup Profile
Group 2
Manroland Sheetfed 4
Piller 6
ARO 8
Claudius Peters 10
Other Businesses 12
Global Locations 14
IFRS Annual Report and Accounts 2017
Company Information 16
Key Highlights 17
Chairman’s Review 18
Geographical Distribution 29
Directors’ Report 30
Strategic Report 32
Independent Auditor’s Report to the Member 34
Consolidated Income Statement 37
Consolidated Statement of Comprehensive Income 38
Consolidated Statement of Financial Position 39
Consolidated Statement of Changes in Equity 40
Company Statement of Financial Position 41
Company Statement of Changes in Equity 42
Consolidated Statement of Cash Flows 43
Company Statement of Cash Flows 44
Notes to the Accounts 45 1

Competitive sailing at the highest level is very much in line with Langley business culture
Langley and Ainslie: eyes on the America’s Cup
2

Langley Holdings plc is a diverse, globally operating engineering group headquartered in the United Kingdom.
The group comprises 5 divisions based principally in Germany, France and the United Kingdom, with a substantial presence in the United States and more than 80 subsidiaries worldwide.
Established in 1975 by the current Chairman and CEO, Mr Tony Langley, the Langley group is financially independent and remains under family ownership. The group employed around 4,300 people world wide in 2017.
Group
Competitive sailing at the highest level is very much in line with Langley business culture and towards the end of 2017 the group agreed to partner with Sir Ben Ainslie’s Land Rover BAR programme, in support of his challenge for the 36th America’s Cup.
3
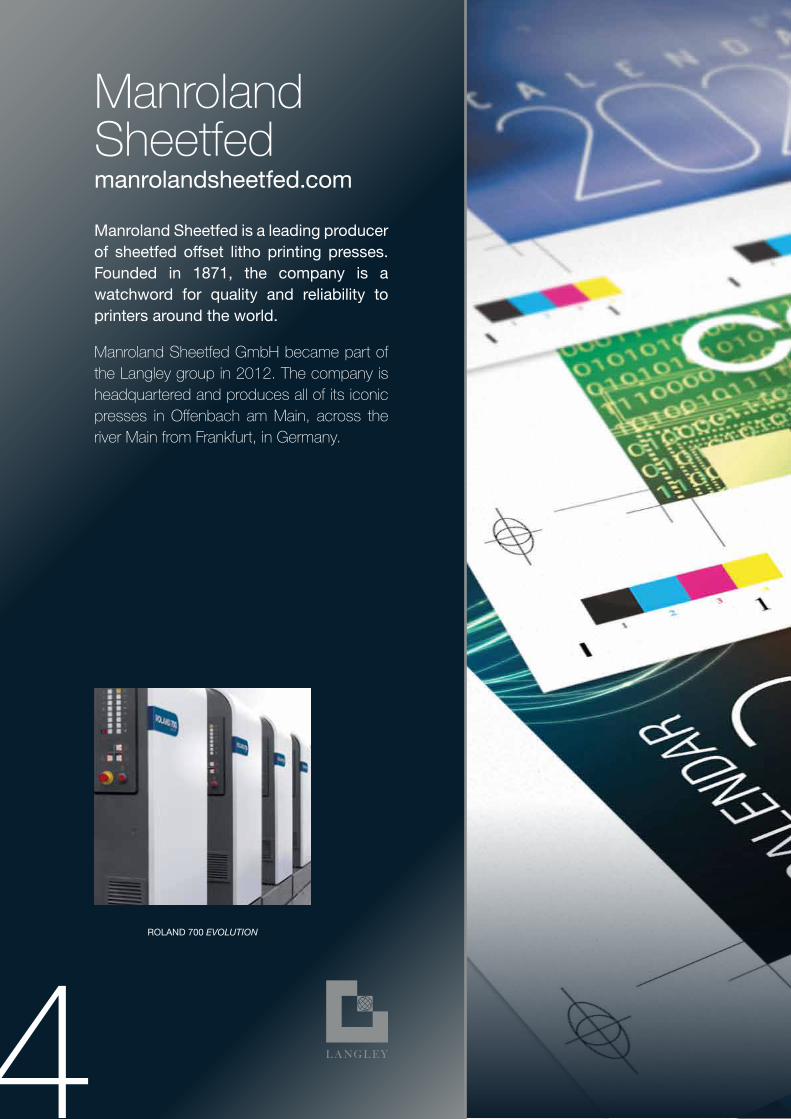
Manroland Sheetfedmanrolandsheetfed.com
Manroland Sheetfed is a leading producer of sheetfed offset litho printing presses. Founded in 1871, the company is a watchword for quality and reliability to printers around the world.
Manroland Sheetfed GmbH became part of the Langley group in 2012. The company is headquartered and produces all of its iconic presses in Offenbach am Main, across the river Main from Frankfurt, in Germany.
ROLAND 700 EVOLUTION
4

Location: Germany
Activity: Printing press builder
Revenue 2017: €286.3m
Employees: 1,545
a watchword for quality andreliability to printers worldwide5
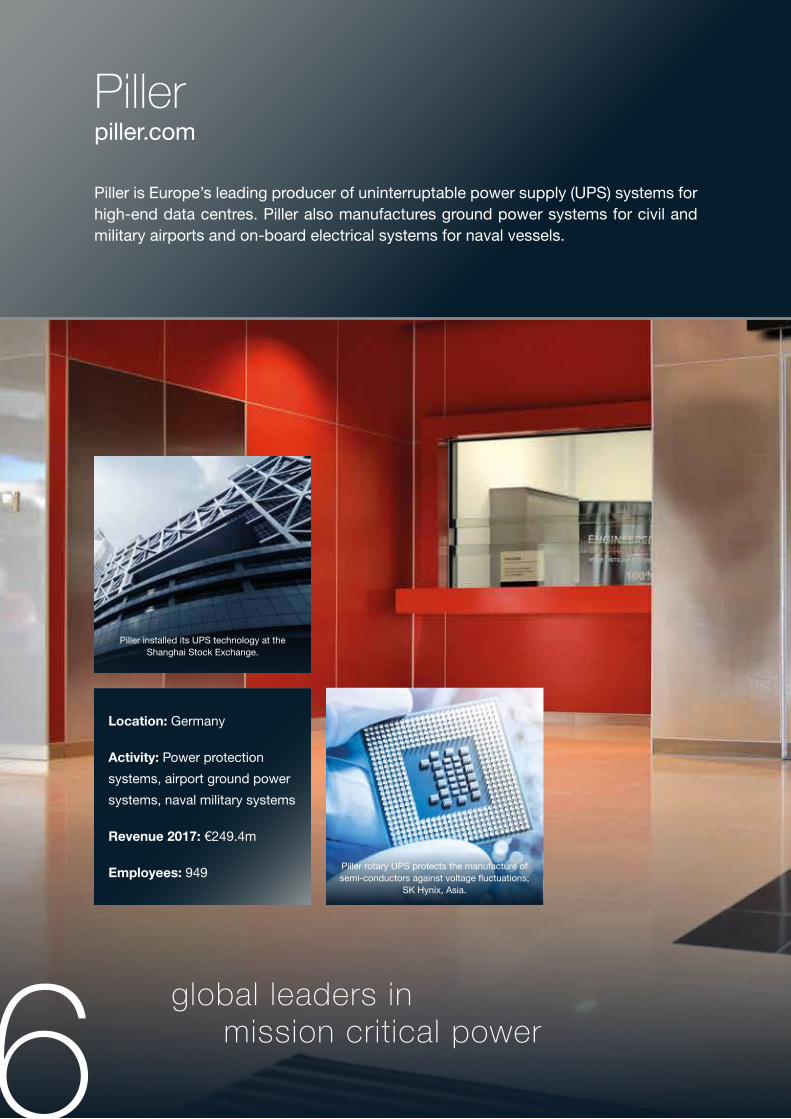
Pillerpiller.com
Piller is Europe’s leading producer of uninterruptable power supply (UPS) systems for high-end data centres. Piller also manufactures ground power systems for civil and military airports and on-board electrical systems for naval vessels.
Location: Germany
Activity: Power protection
systems, airport ground power
systems, naval military systems
Revenue 2017: €249.4m
Employees: 949
global leaders in mission critical power
Piller installed its UPS technology at the Shanghai Stock Exchange.
Piller rotary UPS protects the manufacture of semi-conductors against voltage fluctuations;
SK Hynix, Asia.
6

The company was founded in 1909 and acquired by Langley in 2004. Piller is headquartered at Osterode am Harz, near Hanover, in Germany.
In 2016, Piller acquired the business and assets of Texas based Active Power Inc. the kinetic energy storage specialist.
A world first: Tier IV Design & Construction Certification of a Piller
IP-Bus system was awarded in 2017 to colocation provider NEXTDC
in Australia, for its B2 data centre in Brisbane. 7

Location: France
Activity: Welding technology
Revenue 2017: €145.6m
Employees: 548
world leaders in automotive welding technology8

ARO is widely regarded as the world leader in resistance welding to the automotive industry.
The company was founded in 1949 and acquired by Langley in 2006.
The ARO group is headquartered between Tours and Le Mans, in the Loire region of France. The company also produces in the US, in Detroit, and Wuhan, China.
Reduced new model development times, increasingly complex structures and the use of aluminium in car production to reduce weight have all led to strong demand for ARO’s products.
ARO’s success is driven by a strong and
growing demand for resistance welding
solutions from the world’s automotive
giants where performance, reliability,
and competitiveness are key factors.
AROarotechnologies.com
ARO 3G robotic gun technology employed at a Jaguar Land Rover plant in the UK.
9

Claudius Petersclaudiuspeters.com
For more than a century Claudius Peters has produced innovative materials handling and processing systems for the global cement, gypsum, steel and alumina industries.
The company’s aerospace division manufactures aircraft stringers, several kilometres of which are found in every Airbus aircraft ever built.
Established in 1906, Claudius Peters is headquartered near Hamburg, in Germany and was acquired by Langley in 2001.
Claudius Peters, our plant machinery
specialist, produces equipment for
cement plants.
Claudius Peters Limestone Bridge Reclaimer, North Africa
10

Location: Germany
Activity: Plant machinery,
aerospace components
Revenue 2017: €95.6m
Employees: 535
process technology for cement, gypsum, steel and alumina 11

• print chemicals• food packaging• specialist handling
equipment
Other Businesseslangleyholdings.com
Other businesses operating at locations in Germany, the UK and USA, are Druck Chemie, a printing chemicals manufacturer, Bradman Lake, a food packaging machinery specialist;
Druck Chemie Clarke ChapmanBradman Lake
12

• cement products• house building
Reader Cement Products, a blender and packer of cement and cement products; Clarke Chapman a specialist materials handling equipment company and; Oakdale Homes a small new houses builder.
Location: Germany, UK,
USA & various.
Activity: Diverse capital
equipment, Construction,
Chemicals
Revenue 2017: €126.6m
Employees: 755
Oakdale HomesReader Cement Products
13

circa 4,300 employees...80 subsidiaries,
...5 divisions, more than
14

• ARGENTINA BUENOS AIRES • ASIA
PACIFIC SINGAPORE • AUSTRALIA SYDNEY
• AUSTRIA WIENER NEUDORF • BELGIUM
BRUSSELS, WEMMEL • BRAZIL SÃO PAULO
• BULGARIA SOFIA • CANADA TORONTO
• CHILE SANTIAGO • CHINA BEIJING,
CHENGDU, GUANGZHOU, HONG KONG,
SHANGHAI, SHENZHEN, WUHAN • COLUMBIA
BOGOTA • CROATIA ZAGREB • CZECH
REPUBLIC PRAGUE, KUŘIM • DENMARK
BALLERUP • FINLAND VANTAA • FRANCE
LE MANS, MULHOUSE, PARIS, SOPPE LE
BAS • GERMANY FRANKFURT, HAMBURG,
HANOVER, AUGSBURG, STUTTGART •
HUNGARY BUDAPEST • INDIA MUMBAI
INDONESIA JAKARTA • IRELAND DUBLIN •
ITALY BERGAMO, MILAN • JAPAN SAITAMA
• MALAYSIA SELANGOR • MEXICO PUEBLO
• NETHERLANDS AMSTERDAM, HELMOND •
PERU LIMA • POLAND NADARZYN, GNIEZNO •
PORTUGAL SINTRA • ROMANIA BUCHAREST,
SIBIU • RUSSIA MOSCOW • SLOVAKIA
BRATISLAVA • SLOVENIA LJUBLJANA • SOUTH
AFRICA CAPE TOWN • SPAIN BARCELONA,
MADRID • SWEDEN FJÄRÅS, TROLLHÄTTAN
• SWITZERLAND KIRCHBERG, ROGGLISWIL
• TAIWAN NEW TAIPEI CITY • THAILAND
BANGKOK • UNITED KINGDOM VARIOUS
LOCATIONS • USA DALLAS, DETROIT, NEW
YORK, ROCK HILL (SOUTH CAROLINA),
WESTMONT • VENEZUELA CARACAS
Global Locations
15
16 IFRS Annual Report & Accounts 2017
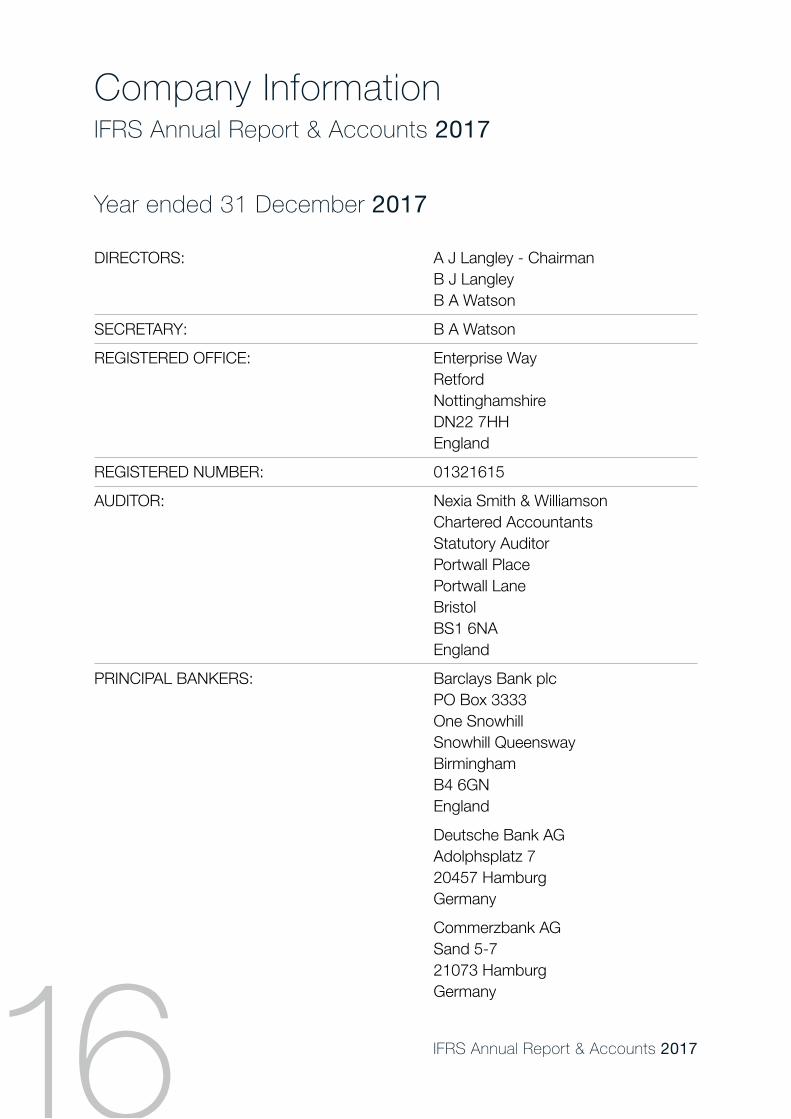
Year ended 31 December 2017
Company InformationIFRS Annual Report & Accounts 2017
DIRECTORS: A J Langley - Chairman B J Langley B A Watson
SECRETARY: B A Watson
REGISTERED OFFICE: Enterprise Way Retford Nottinghamshire DN22 7HH England
REGISTERED NUMBER: 01321615
AUDITOR: Nexia Smith & Williamson Chartered Accountants Statutory Auditor Portwall Place Portwall Lane Bristol BS1 6NA England
PRINCIPAL BANKERS: Barclays Bank plc PO Box 3333 One Snowhill Snowhill Queensway Birmingham B4 6GN England
Deutsche Bank AG Adolphsplatz 7 20457 Hamburg Germany
Commerzbank AG Sand 5-7 21073 Hamburg Germany

17IFRS Annual Report & Accounts 2017
Year ended 31 December 2017
Key Highlights
Year ended Year ended 31 December 31 December 2017 2016 €’000 €’000
REVENUE 903,529 900,925 OPERATING PROFIT 110,274 121,472 PROFIT BEFORE TAXATION 111,808 122,730 NET ASSETS 647,350 587,377 CASH AND CASH EQUIVALENTS 323,036 296,923 ORDERS ON HAND 275,841 288,589
No. No.EMPLOYEES 4,332 4,320

Another remarkably successful year for
the groupAnthony J Langley
Chairman
19IFRS Annual Report & Accounts 2017
Year ended 31 December 2017
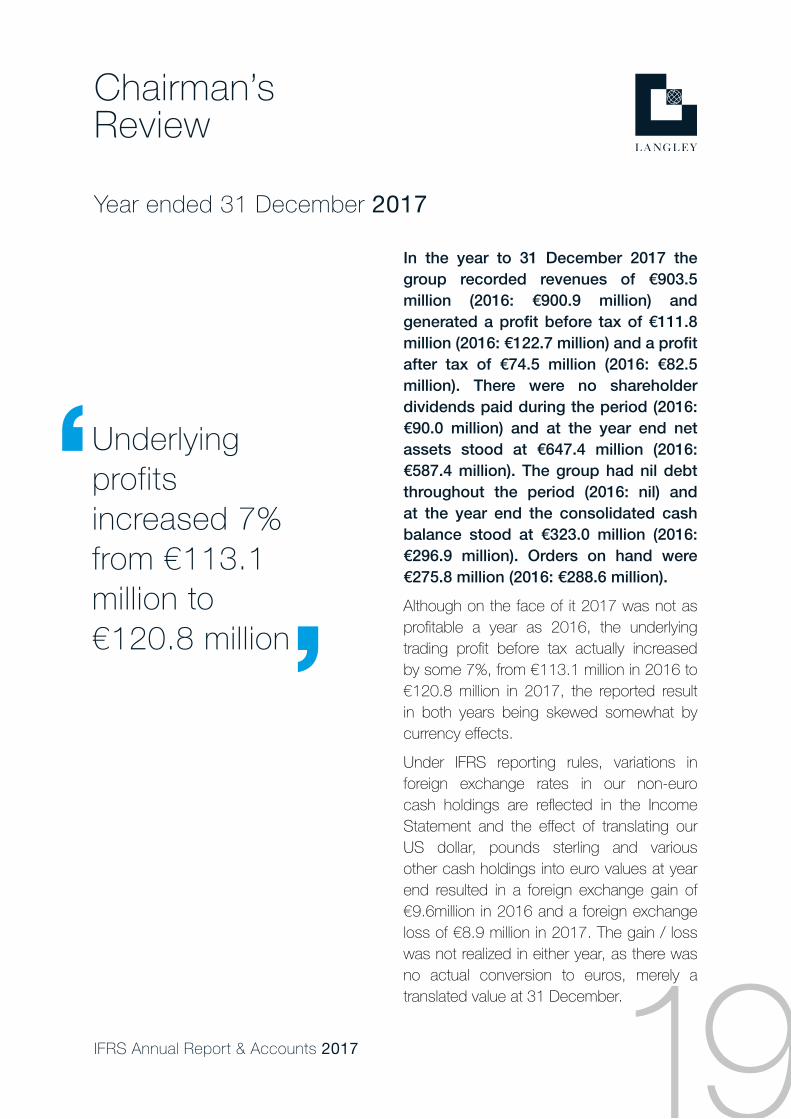
In the year to 31 December 2017 the group recorded revenues of €903.5 million (2016: €900.9 million) and generated a profit before tax of €111.8 million (2016: €122.7 million) and a profit after tax of €74.5 million (2016: €82.5 million). There were no shareholder dividends paid during the period (2016: €90.0 million) and at the year end net assets stood at €647.4 million (2016: €587.4 million). The group had nil debt throughout the period (2016: nil) and at the year end the consolidated cash balance stood at €323.0 million (2016: €296.9 million). Orders on hand were €275.8 million (2016: €288.6 million).
Although on the face of it 2017 was not as profitable a year as 2016, the underlying trading profit before tax actually increased by some 7%, from €113.1 million in 2016 to €120.8 million in 2017, the reported result in both years being skewed somewhat by currency effects.
Under IFRS reporting rules, variations in foreign exchange rates in our non-euro cash holdings are reflected in the Income Statement and the effect of translating our US dollar, pounds sterling and various other cash holdings into euro values at year end resulted in a foreign exchange gain of €9.6million in 2016 and a foreign exchange loss of €8.9 million in 2017. The gain / loss was not realized in either year, as there was no actual conversion to euros, merely a translated value at 31 December.
Underlying profits increased 7% from €113.1 million to €120.8 million
Chairman’sReview

20 IFRS Annual Report & Accounts 2017
Year ended 31 December 2017
The trading divisions have performed largely in line with expectations since my half year review and overall substantially ahead of the budgeted profit for the year, meaning that 2017 was another remarkably successful year for the group.
MANROLAND SHEETFED DIVISION
Revenue: €286.3m. (2016: €314.8m). Orders on hand: €41.3m. (2016: €52.8m). Headquarters: Germany. Employees: 1,545.
In terms of revenue and employee numbers Manroland Sheetfed GmbH, the German builder of printing presses acquired six years ago, is the largest of our operating divisions and accounts for almost a third of group revenues.
Within the first five of these six years the business steadily returned our investment in full and continues to contribute positively to the overall result. However, although contributing positively in 2017 and every year prior, that contribution is below par when comparing percentage profit on revenue to our other operating divisions. The reason for this is that the facility in Offenbach am Main, situated across the Main river from Frankfurt and with a manufacturing footprint of over a million square feet, although modern and efficient, is substantially under-utilized. Despite satellite locations having been closed and the operations consolidated onto a single site, volumes are still a way short of the optimum and as the facility is now fully integrated, no further rationalization is possible.
The printing industry is still very much in a state of flux and through the course of 2017, the division underwent something of a roller coaster of order intake with a very good first quarter, only to be followed by a very weak second quarter. The second half of the year started strongly but lost momentum in late summer and the volatile pattern continued in the last quarter of 2017, only to see a new record high for order intake, during our six-year tenure, in January 2018.
New products continued to be developed and the Roland 700 Evolution Ultima® was announced to the market towards the end of the year. This was a further progression of the Roland 700 Evolution platform, itself developed in record time under our stewardship, which offers multiple specialist coatings and foils in a single pass of the press.
During the period an agreement was made to sell off several acres of surplus land for redevelopment as data centres. Offenbach is on the “Fibre Backbone”, one of the major arteries
Chairman’sReview
Investment recouped in first five of six year ownership...continued positive contribution in 2017
21IFRS Annual Report & Accounts 2017
Year ended 31 December 2017
Chairman’sReview
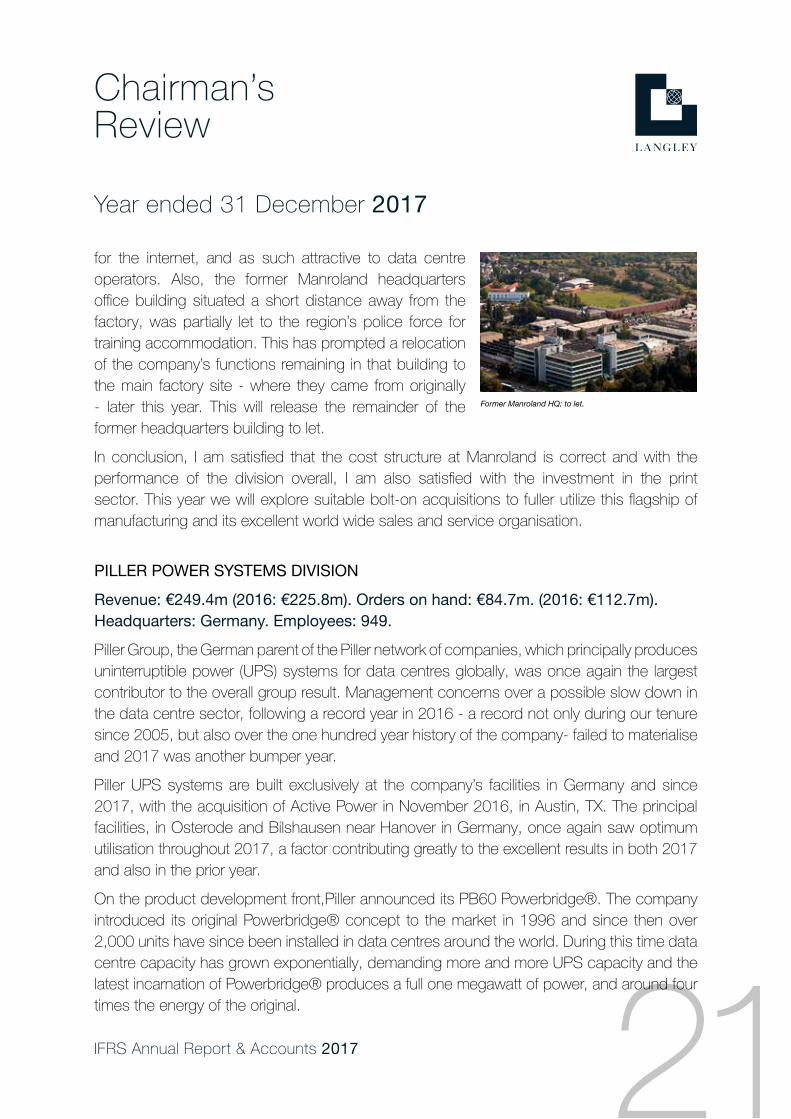
for the internet, and as such attractive to data centre operators. Also, the former Manroland headquarters office building situated a short distance away from the factory, was partially let to the region’s police force for training accommodation. This has prompted a relocation of the company’s functions remaining in that building to the main factory site - where they came from originally - later this year. This will release the remainder of the former headquarters building to let.
In conclusion, I am satisfied that the cost structure at Manroland is correct and with the performance of the division overall, I am also satisfied with the investment in the print sector. This year we will explore suitable bolt-on acquisitions to fuller utilize this flagship of manufacturing and its excellent world wide sales and service organisation.
PILLER POWER SYSTEMS DIVISION
Revenue: €249.4m (2016: €225.8m). Orders on hand: €84.7m. (2016: €112.7m). Headquarters: Germany. Employees: 949.
Piller Group, the German parent of the Piller network of companies, which principally produces uninterruptible power (UPS) systems for data centres globally, was once again the largest contributor to the overall group result. Management concerns over a possible slow down in the data centre sector, following a record year in 2016 - a record not only during our tenure since 2005, but also over the one hundred year history of the company- failed to materialise and 2017 was another bumper year.
Piller UPS systems are built exclusively at the company’s facilities in Germany and since 2017, with the acquisition of Active Power in November 2016, in Austin, TX. The principal facilities, in Osterode and Bilshausen near Hanover in Germany, once again saw optimum utilisation throughout 2017, a factor contributing greatly to the excellent results in both 2017 and also in the prior year.
On the product development front,Piller announced its PB60 Powerbridge®. The company introduced its original Powerbridge® concept to the market in 1996 and since then over 2,000 units have since been installed in data centres around the world. During this time data centre capacity has grown exponentially, demanding more and more UPS capacity and the latest incarnation of Powerbridge® produces a full one megawatt of power, and around four times the energy of the original.
Former Manroland HQ: to let.

22 IFRS Annual Report & Accounts 2017
Year ended 31 December 2017
Chairman’sReview
Demand for Piller systems was strong across all major territories, particularly the United States. The Far East and Europe were also buoyant, although less so the UK, whereas Piller Australia experienced continued record demand from its burgeoning data centre sector. In other relatively undeveloped data centre markets such as South America and India, Piller now has an established presence and continues to develop China, as yet a virtually untapped market save for a cornerstone installation at the Shanghai Stock Exchange. Meanwhile, Piller’s aircraft ground power and military business made a solid contribution to an excellent overall result.
Active Power
Active Power, the kinetic energy storage business, acquired by Piller in late 2016, had its first full year under our stewardship. The freehold of Active Power’s operating facilities in Austin, Texas, was acquired by the group during the period and the company, now a subsidiary of Piller Power Systems Inc, completed its reorganisation in the first quarter. Under Piller management, the former NASDAQ business made a profit for the first time since its IPO in 2001.
ARO WELDING TECHNOLOGIES DIVISION
Revenue: €145.6m. (2016: €120.9m). Orders on hand: €37.8m. (2016: €44.0m). Headquarters: France. Employees: 548.
The ARO Welding Technologies Division, headquartered between Tours and Le Mans in the Loire region of central France, recorded a new all-time record high in both revenue and profit terms in 2017.
Demand for the company’s state-of-the-art automotive welding technology continued unabated in 2017 as European, US and Chinese car makers alike continued to boom. ARO’s principal manufacturing facilities in France and the United States reported exceptionally high utilization throughout the period. Global car and light commercial vehicle production came close to 100 million units in 2017 and over 90%, of those vehicles were produced from steel using resistance welding technology, of which ARO is widely regarded the technological
Active Power: freehold acquired by the group
Active Power - integrated and profitable
23IFRS Annual Report & Accounts 2017
Year ended 31 December 2017
Chairman’sReview
leader. The company estimates that at least 20% of all cars produced world-wide are welded using ARO equipment.
Notably, ARO’s success to date is without any business from Japanese car makers, that sector of the market effectively closed to non-Japanese producers due to protectionism.
Although the market has now been booming for over five years, it is prudent to remember that the automotive sector was among the hardest hit following the Financial Crisis a decade ago and continued growth should not be taken for granted. With this in mind, ARO
operates flexible manufacturing and is capable of adjusting its production down, should it be necessary, without major cost impact.
Development wise, the industry is continually striving to save weight in cars and the use of lightweight composites is currently applicable only to the very high end of the market, due to cost constraints. Similarly aluminium, although less expensive than composites, is still more expensive to use than steel and is notoriously difficult to weld with satisfactorily quality in the volumes required.
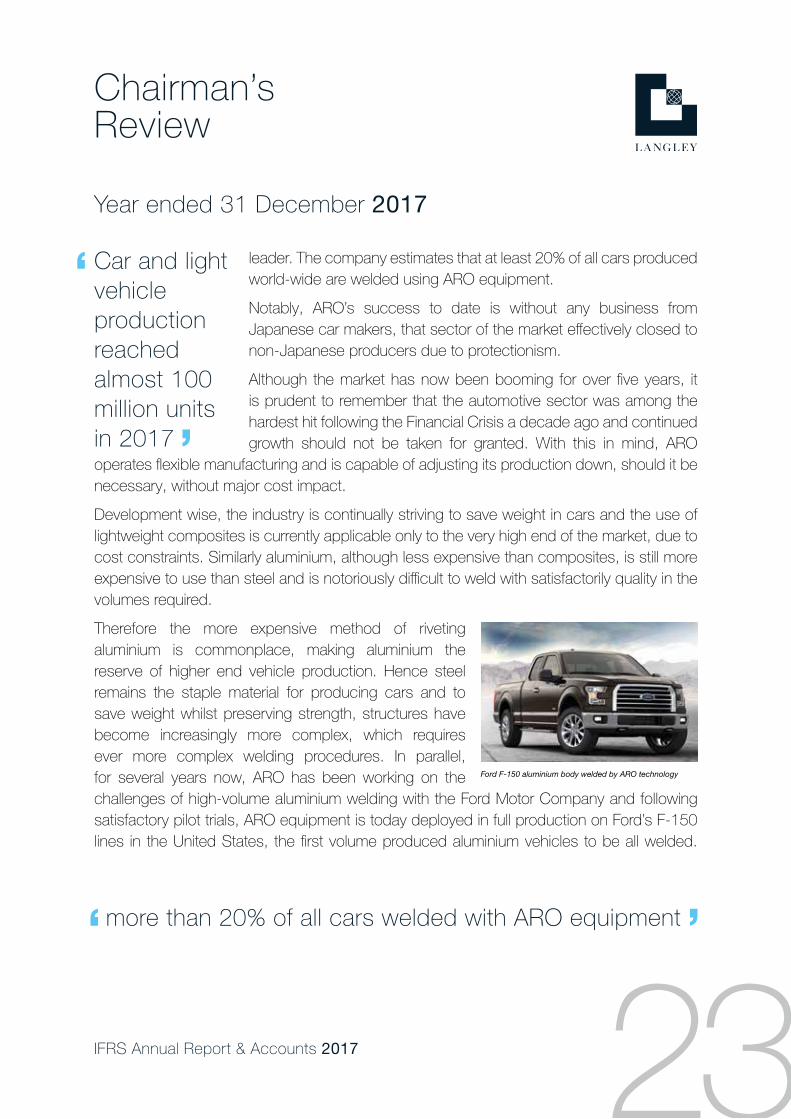
Therefore the more expensive method of riveting aluminium is commonplace, making aluminium the reserve of higher end vehicle production. Hence steel remains the staple material for producing cars and to save weight whilst preserving strength, structures have become increasingly more complex, which requires ever more complex welding procedures. In parallel, for several years now, ARO has been working on the challenges of high-volume aluminium welding with the Ford Motor Company and following satisfactory pilot trials, ARO equipment is today deployed in full production on Ford’s F-150 lines in the United States, the first volume produced aluminium vehicles to be all welded.
Ford F-150 aluminium body welded by ARO technology
Car and light vehicle production reached almost 100 million units in 2017
more than 20% of all cars welded with ARO equipment

24 IFRS Annual Report & Accounts 2017
Year ended 31 December 2017
Chairman’sReview
CLAUDIUS PETERS DIVISION
Revenue: €95.6m (2016: €106.3m). Orders on hand: €81.8m (2016: €50.3m). Headquarters: Germany. Employees: 535.
Claudius Peters, our plant machinery specialist based in Buxtehude, near Hamburg, in northern Germany, had a disappointing year.
However, the business, which supplies materials handling equipment and machinery, principally to the cement and gypsum industry, was profitable although the problem being very low volumes at the headquarters in Germany.
Subsidiaries in France, the United States and China all performed in line with expectations. Despite slightly lower revenue, they achieved or exceeded budgeted profitability; as did the smaller outposts in Spain, Italy, the United Kingdom and Romania, only Brazil posting a loss due to exceptional reasons. The aerospace division, which manufactures components for Airbus, also performed satisfactorily and in line with expectations.
It would be convenient to explain the underperformance by citing a still subdued cement and gypsum sector. However, despite the market being depressed, there were missed opportunities which would have transformed the outcome and therefore management changes have been made.
On a positive note, Claudius Peters came into 2018 with a much healthier order book than previously, and I expect 2018 will see a significant improvement on 2017.
OTHER BUSINESSES DIVISION
Revenue: €126.6m. (2016: €133.1m). Orders on hand: €30.2m. (2016: €28.8m). Located: United Kingdom, Europe & United States. Employees: 755.
Druck Chemie (DC), our German print chemicals business, had another satisfactory year, its third since we acquired the business at the end of 2014. Germany and France were the main drivers, whereas the small DC subsidiary in the UK posted a loss, although contributed positively to the overall result with margin on inter-company purchases. Subsidiaries in Belgium, Italy, Switzerland, the Czech Republic, Brazil and Poland all contributed positively to an acceptable overall result.
overseas subsidiaries and aircraft components profitable as expected

25IFRS Annual Report & Accounts 2017
Year ended 31 December 2017
Chairman’sReview
Bradman Lake, the food packaging machinery business, celebrated ten years of Langley stewardship in October and once again performed satisfactorily. The US operation returned an acceptable result following management changes.
In the U.K., Ibonhart Ltd, a specialist in bakery machinery was acquired and relocated to Bradman Lake’s Beccles facility, thereby broadening Bradman Lake’s offering to the bakery sector. At the other UK facility, in Bristol, delays in relocating to new premises, acquired by the group just over a year ago, were finally overcome and the move is now underway.
Clarke Chapman, the specialist materials handler, also had a very satisfactory year with contracts for nuclear handling equipment for Sellafield, the nuclear fuel reprocessing and nuclear decommissioning site, and an operating contract for rail delivery systems originally provided by the company to the UK railways authority, securing work into 2018 and beyond.
Reader Cement Products, with my son William at the helm for the second year, had its first full year of production at the six acre facility we acquired two years ago and invested in state-of-the-art plant, producing almost 100,000 tonnes of packed cement and cement products from bulk. It was a very satisfactory trading year for Reader with more potential still to be realised.
Oakdale Homes, the small local house builder, which has been part of the group since 1985, ticked over steadily working through its land bank, which will take several years at current build rates. The business made a small operating loss in the period, although this should be recovered as margin in work in progress unwinds.
Finally, whist reviewing other businesses, I should just mention our property holding activities. Over the years,the group has taken every opportunity to acquire the freeholds to its principal operating locations and today over 98% of the freehold operating locations are owned by the group. The majority of these locations around the world are held in group owned holding entities with our operating companies as arms-length tenants.
Reader’s state of the art production facility
Reader: new plant comeson stream 100,000 tonnes produced

26 IFRS Annual Report & Accounts 2017
Year ended 31 December 2017
Chairman’sReview
Additionally, the group is developing and holding either as an investment or selling property surplus to existing and foreseeable operating requirements. Under development at the moment is surplus land at the Clarke Chapman site in Gateshead, UK. The former Manroland headquarters, now only partly occupied by the company, is being vacated and the business relocated. The entire building is offered to let, following the securing of an anchor tenant during the period.
In 2017 the total group rental income was €7.5 million.
OUR PEOPLE
As is customary, no review would be complete without mention of our employees, at year end numbering 4,332 worldwide and I would like to take this opportunity to welcome any newcomers to our family of businesses. It is the hard work and diligence of all our employees, that makes the group the success it is today. The results produced by our companies, often substantially exceeding corporate and private equity owned peers, are no accident. They come about by our community knowing that the Langley culture is forged not from short-term profits, or from creating ‘shareholder value’ by buying and selling companies, but from long-term development of our businesses. I believe that this not only gives our people the will to excel, but also fosters confidence amongst our many customers, suppliers and other stakeholders.
In 2015 we introduced a policy whereby the group equally matches any charitable donations made by employees. Last year I extended the match funding to include money raised for charity by the immediate family of our employees. During the year the company matched €86,828 of employee donations to a variety of causes.
Over 98% of all operating locations now owned by the group

27IFRS Annual Report & Accounts 2017
Year ended 31 December 2017
Chairman’sReview
BRITISH AMERICA'S CUP CHALLENGE
For some years now the group has sponsored the Gladiator sailing programme. Competitive sailing at the highest level is very much in line with Langley business culture and towards the end of 2017 the group agreed to partner with Sir Ben Ainslie’s Land Rover BAR programme, in support of his challenge for the 36th America's Cup.
In 2018 Sir Ben Ainslie, the most successful Olympic sailor in history, and his team will join the core Gladiator team to campaign in the TP52 Super Series, the world’s foremost yacht racing circuit and other events as a precursor to the 36th America's Cup, to be held in Auckland in January 2021.
CONCLUSION & OUTLOOK
2017 was, once again, an outstandingly good year for the group. Ignoring currency effects, operating performance surpassed 2016, itself a record performance and the group continued to strengthen an already robust balance sheet and cash position. The main drivers in 2016 and 2017 were our Piller and ARO divisions, themselves achieving new records in both years. The performance of both these divisions is way above my expectations, not only a few years ago but inconceivable more than a decade earlier, when these businesses were acquired, barely breaking even.
The group goes into 2018 with healthy order books across all divisions and whereas I expect 2018 will be another successful year, clear visibility more than a few months beyond the next quarter is notoriously difficult in our businesses - hence my Interim Review at the half year.
The outstandingly good performance of recent years is not something that should be taken for granted or expected as the norm. The only thing that can be relied on is that nothing stays the same and when businesses do as well as most of ours are doing and keep doing, it is easily possible to be lulled into thinking that this is the new normal. Experience tells me that is not the case, evidenced by Claudius Peters, our strongest performing division in 2012 being the weakest in 2017. Rest assured that I always have a weather eye to a possible downturn in any of our businesses and management are prepared to respond as and when necessary.
Langley and Ainslie: eyes on the America's Cup

28 IFRS Annual Report & Accounts 2017
Year ended 31 December 2017
Chairman’sReview
In the meantime with my eldest son Bernard, five years in the business and on the main board for two of those years, younger son William two years cutting his teeth in our Reader operating company and daughter Charlotte set to join Piller on the west coast of the USA this year, the next generation of family is now firmly established in the business and I continue to eye the future with confidence as we continue to seek out opportunities to develop the group still further for the long term.
Although no major acquisitions were made in 2017 a number of possible opportunities were reviewed and efforts to find more opportunities were re-doubled. Like my resolve, our reserves available for such transactions have only strengthened in the meantime.
Anthony J Langley
Chairman
8 February 2018

29IFRS Annual Report & Accounts 2017
Year ended 31 December 2017
Geographical Distribution
REVENUE BY DIVISION
MANROLAND 32%
OTHER BUSINESSES 7%
ARO 16%
CLAUDIUS PETERS 10%
DRUCKCHEMIE 7%
PILLER 28%
0 5 10 15 20 25 30 35
SITU OF FIXED ASSETS
GERMANY 54%
FRANCE 4%
OTHER EU 2%
USA 11%
REST OF WORLD 1%
UK 28%
0 10 20 30 40 50 60
REVENUE BY ORIGIN
EU 53%
REST OF WORLD 19%
UK 9%
USA 19%
0 10 20 30 40 50 60
REVENUE BY DESTINATION
EU 44%
REST OF WORLD 24%
UK 9%
USA 23%
0 10 20 30 40 50

30 IFRS Annual Report & Accounts 2017
Year ended 31 December 2017
The Directors present their report together with the audited Accounts of the Group for the year ended 31 December 2017.
PRINCIPAL ACTIVITY
The principal activity of the Company continued to be that of a managing and parent company for a number of trading subsidiaries organised in divisions and business units engaged principally in the design, manufacture, supply and servicing of capital equipment. The specific activities of the subsidiary undertakings are as disclosed in note 13 to the Accounts.
RESULTS AND DIVIDENDS
The results of the Group for the year are set out on page 37. The profit attributable to the shareholder for the financial year was €74,448,000 (2016 - €82,502,000).
Dividends of €nil were paid to the ordinary shareholder during the year (2016 - €90,000,000). No final dividend was proposed at the year end.
Financial risk management, research and development and the Group's employment policy is considered within the Strategic Report.
POLICY ON THE PAYMENT OF CREDITORS
The Group seeks to maintain good relations with all of its trading partners. In particular, it is the Group's policy to abide by the terms of payment agreed with each of its suppliers. The average number of days' purchases included within trade creditors for the Group at the year end was 24 days (2016 - 24 days).
DIRECTORS' INTERESTS
The Directors of the Company in office during the year and up to the date of signature of the accounts and their beneficial interests in the issued share capital of the Company were as follows:
At 31 Dec 2017 At 31 Dec 2016
Ordinary shares Ordinary shares
of £1 each of £1 each
A J Langley (Chairman) 60,100,010 60,100,010
B J Langley - -
B A Watson - -
The shareholding of Mr A J Langley represents 100% of the issued share capital of the Company.
DISCLOSURE OF INFORMATION TO AUDITORS
In the case of each person who was a Director at the time this report was approved:
• so far as that Director was aware there was no relevant available information of which the Company's auditors were unaware; and
• that Director had taken all steps that the Director ought to have taken as a Director to make himself or herself aware of any relevant audit information and to establish that the Company's auditors were aware of that information.
This confirmation is given and should be interpreted in accordance with the provision of s418 of the Companies Act 2006.
Directors’ Report

31IFRS Annual Report & Accounts 2017
Year ended 31 December 2017
STATEMENT OF DIRECTORS' RESPONSIBILITIES
The Directors are responsible for preparing the Strategic Report, the Directors' Report, the Chairman’s Review and the Accounts in accordance with applicable law and regulations.
Company law requires the directors to prepare Accounts for each financial year. Under that law the Directors have elected to prepare the Group and Parent Company Accounts in accordance with applicable law and International Financial Reporting Standards (IFRSs) as adopted by the European Union, and as regards the Parent Company Accounts, as applied in accordance with the provisions of the Companies Act 2006. Under company law the Directors must not approve the Accounts unless they are satisfied that they give a true and fair view of the state of affairs of the Company and of the Group and of the profit or loss of the Group for that period.
In preparing these Accounts, the directors are required to:
• select suitable accounting policies and then apply them consistently;
• make judgements and accounting estimates that are reasonable and prudent;
• state whether applicable IFRSs as adopted by the European Union have been followed subject to any material departures disclosed and explained in the Accounts; and
• prepare the Accounts on the going concern basis unless it is inappropriate to presume that the Group will continue in business.
The Directors are responsible for keeping adequate accounting records that are sufficient to show and explain the Company's transactions and disclose with reasonable accuracy at any time the financial position of the Company and enable them to ensure that the Accounts comply with the Companies Act 2006. They are also responsible for safeguarding the assets of the Company and the Group and hence for taking reasonable steps for the prevention and detection of fraud and other irregularities.
The Directors are responsible for the maintenance and integrity of the corporate and financial information included on the Group's website. Legislation in the United Kingdom governing the preparation and dissemination of accounts may differ from legislation in other jurisdictions.
By order of the Board
B A WATSON
Company Secretary
Langley Holdings plc
Registered in England and Wales
Company number 01321615
8 February 2018
Directors’ Report(continued)

32 IFRS Annual Report & Accounts 2017
Year ended 31 December 2017
The Directors present their Strategic Report for the year ended 31 December 2017 to provide a review of the Group's business, principal risks and uncertainties and performance and position alongside key performance indicators.
(a) Development performance and position
The Directors are satisfied with the trading results of the Group for the year. The Chairman's Review on pages 18 to 28 contains an analysis of the development and performance of the Group during the year and its position at the end of the year.
(b) Principal risks and uncertainties
There are a number of risks and uncertainties which may affect the Group's performance. A risk assessment process is in place and is designed to identify, manage and mitigate business risks. However it is recognised that to identify, manage and mitigate risks is not the same as to eliminate them entirely. The Group ensures that it limits its exposure to any downturn in its traditional trading sector by continuing to diversify its activities, identifying opportunities for existing product offerings into new markets and for new products for all markets. The Group has a wide range of customers which limits exposure to any material loss of revenue. The Group's exposure to the volatility of exchange rates is mitigated through its geographical spread of operations.
(c) Going Concern
The Group's business activities, together with the factors likely to affect its future development, performance and position are set out in the Chairman's Review on pages 18 to 28. The financial position of the Group, its cash flows and liquidity position are also described in the Chairman's Review. In addition, note 29 to the Accounts includes the Group's policies and processes for managing its capital; its financial risk management objectives; details of its financial instruments, and its exposures to credit risk and interest rate risk.
The Group's subsidiaries are for the most part either market leaders or niche operators in their particular field and operate across numerous different geographic areas and industries. None of the subsidiaries are reliant on any individual supplier or customer and the Group has considerable financial resources. Consequently, the Directors believe that the Group is well placed to manage its business risks successfully and thus they continue to adopt the going concern basis of accounting in preparing the annual Accounts.
(d) Financial Risk Management
Prudent liquidity risk management implies maintaining sufficient cash on deposit and the availability of funding through an adequate amount of committed credit facilities. The Directors are satisfied that cash levels retained in the business, committed credit facilities and surety lines are more than adequate for future foreseeable requirements. Further details are set out in note 29 to the Accounts.
Strategic Report

33IFRS Annual Report & Accounts 2017
Year ended 31 December 2017
(e) Key performance indicators (KPI's)
The Board uses a number of tools to monitor the Group's performance including a review of key performance indicators (KPI's) on a regular and consistent basis across the Group. Examples of KPI's currently used include:
Targets
• Regular monthly monitoring of sold and developed contract margins
• Orders on hand
• Cash held 2017 2016 €'000 €'000
Orders on hand 275,841 288,589Cash held 323,036 296,923
The Board also considers the following non-financial key performance indicator:
• Staff turnover
These are reviewed monthly through information provided to the Board and details are shown on page 17.
(f) Research and development
The Group is committed to innovation and technical excellence. The Group, through its divisions, maintains a programme of research and development to ensure that it remains at the forefront of respective technologies in its key sectors.
(g) Employment Policy
The Group is committed to a policy of recruitment and promotion on the basis of aptitude and ability, without discrimination of any kind, and to training for the existing and likely needs of the business.
It is the Group's policy to keep its employees informed on matters affecting them and actively encourage their involvement in the performance of the Group.
By order of the Board
B A WATSON
Company Secretary
Langley Holdings plc
Registered in England and Wales
Company number 01321615
8 February 2018
Strategic Report(continued)

34 IFRS Annual Report & Accounts 2017
Year ended 31 December 2017
Opinion
We have audited the accounts of Langley Holdings plc (the 'parent company') and its subsidiaries (the 'group') for the year ended 31 December 2017 which comprise the Consolidated Income Statement, the Consolidated Statement of Comprehensive Income, the Consolidated and Parent Company Statements of Financial Position, the Consolidated and Parent Company Statements of Changes in Equity, the Consolidated and Parent Company Statements of Cash Flows and the notes to the accounts, including a summary of significant accounting policies. The financial reporting framework that has been applied in their preparation is applicable law and International Financial Reporting Standards (IFRSs) as adopted by the European Union and, as regards the parent company accounts, as applied in accordance with the provisions of the Companies Act 2006.
This report is made solely to the parent company's member, in accordance with Chapter 3 of Part 16 of the Companies Act 2006. Our audit work has been undertaken so that we might state to the parent company's member those matters we are required to state to them in an auditor's report and for no other purpose. To the fullest extent permitted by law, we do not accept or assume responsibility to anyone other than the parent company and the parent company's member, for our audit work, for this report, or for the opinions we have formed.
In our opinion:
• the accounts give a true and fair view of the state of the group's and of the parent company's affairs as at 31 December 2017 and of the group's profit for the year then ended;
• the group accounts have been properly prepared in accordance with IFRSs as adopted by the European Union;
• the parent company accounts have been properly prepared in accordance with IFRSs as adopted by the European Union and as applied in accordance with the provisions of the Companies Act 2006; and
• the accounts have been prepared in accordance with the requirements of the Companies Act 2006.
Basis for opinion
We conducted our audit in accordance with International Standards on Auditing (UK) (ISAs (UK)) and applicable law. Our responsibilities under those standards are further described in the Auditor's responsibilities for the audit of the accounts section of our report. We are independent of the group and parent company in accordance with the ethical requirements that are relevant to our audit of the accounts in the UK, including the FRC's Ethical Standard, and we have fulfilled our other ethical responsibilities in accordance with these requirements. We believe that the audit evidence we have obtained is sufficient and appropriate to provide a basis for our opinion.
Conclusions relating to going concern
We have nothing to report in respect of the following matters in relation to which the ISAs (UK) require us to report to you where:
• the directors' use of the going concern basis of accounting in the preparation of the accounts is not appropriate; or
• the directors have not disclosed in the accounts any identified material uncertainties that may cast significant doubt about the group's or the parent company's ability to continue to adopt the going concern basis of accounting for a period of at least twelve months from the date when the accounts are authorised for issue.
Independent Auditor’s Report to the Member

35IFRS Annual Report & Accounts 2017
Year ended 31 December 2017
Other information
The other information comprises the information included in the Annual Report and Accounts, other than the accounts and our auditor's report thereon. The directors are responsible for the other information. Our opinion on the accounts does not cover the other information and, except to the extent otherwise explicitly stated in our report, we do not express any form of assurance conclusion thereon.
In connection with our audit of the accounts, our responsibility is to read the other information and, in doing so, consider whether the other information is materially inconsistent with the accounts or our knowledge obtained in the audit or otherwise appears to be materially misstated. If we identify such material inconsistencies or apparent material misstatements, we are required to determine whether there is a material misstatement in the accounts or a material misstatement of the other information. If, based on the work we have performed, we conclude that there is a material misstatement of this other information, we are required to report that fact.
We have nothing to report in this regard.
Opinion on other matters prescribed by the Companies Act 2006
In our opinion, based on the work undertaken in the course of the audit:
• the information given in the strategic report and the directors' report for the financial year for which the accounts are prepared is consistent with the accounts; and
• the strategic report and the directors' report have been prepared in accordance with applicable legal requirements.
Matters on which we are required to report by exception
In the light of the knowledge and understanding of the group and the parent company and their environment obtained in the course of the audit, we have not identified material misstatements in the strategic report, the directors' report or the chairman's review.
We have nothing to report in respect of the following matters where the Companies Act 2006 requires us to report to you if, in our opinion:
• adequate accounting records have not been kept by the parent company, or returns adequate for our audit have not been received from branches not visited by us; or
• the parent company accounts are not in agreement with the accounting records and returns; or
• certain disclosures of directors' remuneration specified by law are not made; or
• we have not received all the information and explanations we require for our audit.
Responsibilities of directors
As explained more fully in the statement of directors' responsibilities set out on page 31, the directors are responsible for the preparation of the accounts and for being satisfied that they give a true and fair view, and for such internal control as the directors determine is necessary to enable the preparation of accounts that are free from material misstatement, whether due to fraud or error.
In preparing the accounts, the directors are responsible for assessing the group's and the parent company's ability to continue as a going concern, disclosing, as applicable, matters related to going concern and using the going concern basis of accounting unless the directors either intend to liquidate the group or the parent company or to cease operations, or have no realistic alternative but to do so.
Independent Auditor’s Report to the Member(Continued)

36 IFRS Annual Report & Accounts 2017
Year ended 31 December 2017
Auditor's responsibilities for the audit of the accounts
Our objectives are to obtain reasonable assurance about whether the accounts as a whole are free from material misstatement, whether due to fraud or error, and to issue an auditor's report that includes our opinion. Reasonable assurance is a high level of assurance, but is not a guarantee that an audit conducted in accordance with ISAs (UK) will always detect a material misstatement when it exists. Misstatements can arise from fraud or error and are considered material if, individually or in the aggregate, they could reasonably be expected to influence the economic decisions of users taken on the basis of these accounts.
A further description of our responsibilities for the audit of the accounts is located on the Financial Reporting Council's website at: www.frc.org.uk/auditorsresponsibilities. This description forms part of our auditor's report.
Fiona Westwood Senior Statutory Auditor, for and on behalf of Portwall Place Nexia Smith & Williamson Portwall Lane Statutory Auditor Bristol Chartered Accountants BS1 6NA
8 February 2018
Independent Auditor’s Report to the Member(Continued)

37IFRS Annual Report & Accounts 2017
Year ended 31 December 2017
2017 2016 Note €'000 €'000REVENUE 2 903,529 900,925
Cost of sales (593,513) (587,673)
GROSS PROFIT 310,016 313,252
Net operating expenses 3 (199,742) (191,780)
OPERATING PROFIT 4 110,274 121,472
Finance income 5 1,582 1,502
Finance costs 6 (48) (244)
PROFIT BEFORE TAXATION 111,808 122,730
Income tax expense 10 (37,360) (40,228)
PROFIT FOR THE YEAR 74,448 82,502
Profit for the year is attributable to the Equity holder of the Parent Company.
The notes on pages 45 to 95 form part of these accounts
Consolidated Income Statement
38 IFRS Annual Report & Accounts 2017
Year ended 31 December 2017
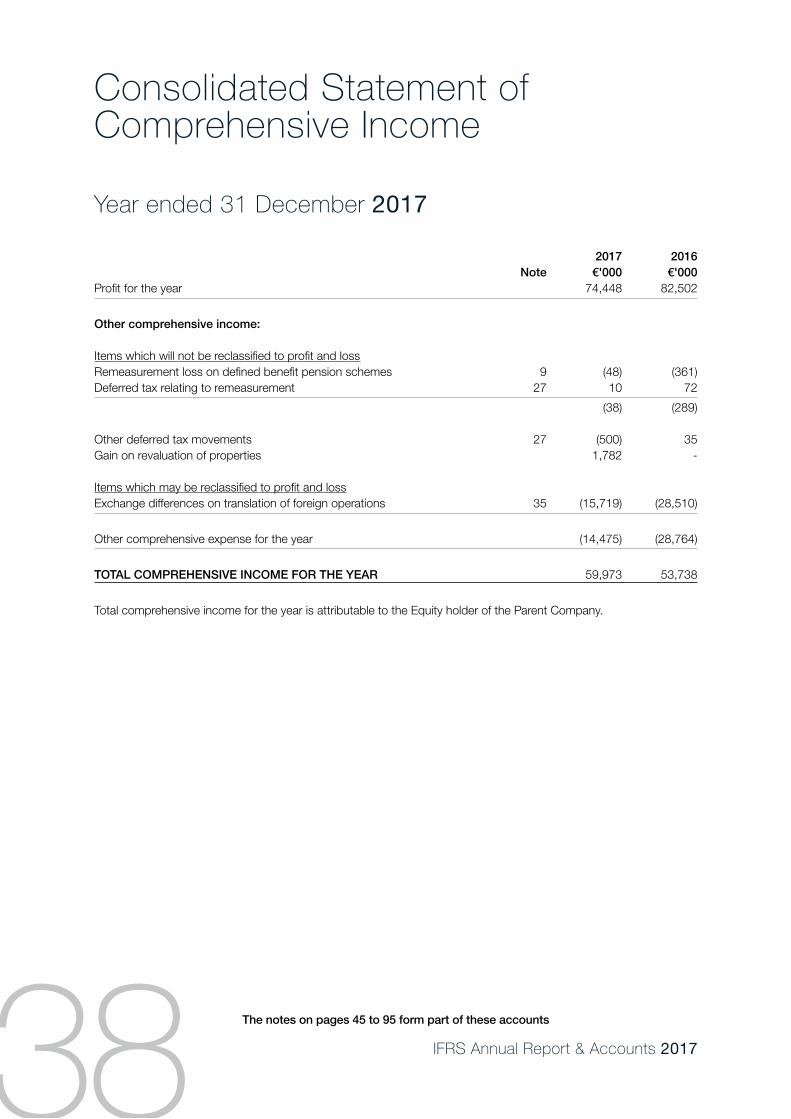
2017 2016 Note €'000 €'000Profit for the year 74,448 82,502
Other comprehensive income:
Items which will not be reclassified to profit and lossRemeasurement loss on defined benefit pension schemes 9 (48) (361)Deferred tax relating to remeasurement 27 10 72
(38) (289)
Other deferred tax movements 27 (500) 35Gain on revaluation of properties 1,782 -
Items which may be reclassified to profit and lossExchange differences on translation of foreign operations 35 (15,719) (28,510)
Other comprehensive expense for the year (14,475) (28,764)
TOTAL COMPREHENSIVE INCOME FOR THE YEAR 59,973 53,738
Total comprehensive income for the year is attributable to the Equity holder of the Parent Company.
The notes on pages 45 to 95 form part of these accounts
Consolidated Statement of Comprehensive Income

39IFRS Annual Report & Accounts 2017
As at 31 December 2017
2017 2016 Note €'000 €'000 €'000 €'000NON-CURRENT ASSETSIntangible assets 11 2,985 3,255Property, plant and equipment 12 206,863 200,894Investments 13 14 14Trade and other receivables 14 3,724 3,041Deferred income tax assets 27 16,483 23,781
230,069 230,985CURRENT ASSETS Inventories 15 163,720 160,973 Trade and other receivables 17 177,961 182,120 Cash and cash equivalents 18 323,036 296,923 Current income tax recoverable 19 7,437 4,827
672,154 644,843
CURRENT LIABILITIES Current portion of long term borrowings 23 54 86 Current income tax liabilities 22 7,892 10,375 Trade and other payables 20 180,831 204,721 Provisions 21 17,565 27,168
206,342 242,350
NET CURRENT ASSETS 465,812 402,493
Total assets less current liabilities 695,881 633,478NON-CURRENT LIABILITIESProvisions 21 1,633 2,426 Long term borrowings 24 39 91 Trade and other payables 25 17,350 13,214 Retirement benefit obligations 26 11,970 13,021 Deferred income tax liabilities 27 17,539 17,349
48,531 46,101
NET ASSETS 647,350 587,377
EQUITYShare capital 32 71,227 71,227Merger reserve 33 4,491 4,491Revaluation reserve 34 4,935 3,768Retained earnings 35 566,697 507,891
TOTAL EQUITY 647,350 587,377
Approved and authorised for issue by the Board of Directors on 8 February 2018 and signed on its behalf by
A J LANGLEY B J LANGLEYDirector Director
Consolidated Statement of Financial Position
The notes on pages 45 to 95 form part of these accounts

40 IFRS Annual Report & Accounts 2017
Year ended 31 December 2017
Share Merger Revaluation Retained Capital Reserve Reserve Earnings* Total €'000 €'000 €'000 €'000 €'000
AT 1 JANUARY 2016 71,227 4,491 3,849 544,072 623,639
Profit for the year - - - 82,502 82,502Depreciation transfer - - (81) 116 35Currency exchange difference - - - (28,510) (28,540) arising on retranslationRemeasurement of defined benefit - - - (289) (289) schemes net of deferred tax
TOTAL COMPREHENSIVE INCOME - - (81) 53,819 53,738Dividends paid - - - (90,000) (90,000)
AT 31 DECEMBER 2016 71,227 4,491 3,768 507,891 587,377
Profit for the year - - - 74,448 74,448Depreciation transfer - - (80) 115 35Currency exchange differencearising on retranslation - - - (15,719) (15,719)Remeasurement of defined benefit - - - (38) (38)schemes net of deferred taxRevaluation gain net of deferred tax - - 1,247 - 1,247
TOTAL COMPREHENSIVE INCOME - - 1,167 58,806 59,973
AT 31 DECEMBER 2017 71,227 4,491 4,935 566,697 647,350
* Movements in foreign currency translation reserves are detailed in note 35.
Consolidated Statement of Changes in Equity
The notes on pages 45 to 95 form part of these accounts

41IFRS Annual Report & Accounts 2017
As at 31 December 2017
2017 2016 Note €'000 €'000 €'000 €'000NON-CURRENT ASSETSProperty, plant and equipment 12 27,315 27,215Investments 13 76,475 79,520
103,790 106,735CURRENT ASSETSInventories 15 9 4Trade and other receivables 17 129,382 145,680Cash and cash equivalents 18 177,381 117,139Current income tax recoverable 19 1,539 60
308,311 262,883
CURRENT LIABILITIESCurrent income tax liabilities 22 - 1,599Trade and other payables 20 3,955 3,255
3,955 4,854
NET CURRENT ASSETS 304,356 258,029
Total assets less current liabilities 408,146 364,764
NON-CURRENT LIABILITIES Deferred income tax liabilities 27 189 141
NET ASSETS 407,957 364,623
EQUITYShare capital 32 71,227 71,227Merger reserve 33 4,491 4,491Retained earnings 35 332,239 288,905
TOTAL EQUITY 407,957 364,623
During the year ended 31 December 2017, the Company generated a profit of €54,126,000 (2016 - €66,126,000).
Approved and authorised for issue by the Board of Directors on 8 February 2018 and signed on its behalf by
A J LANGLEY B J LANGLEY
Director Director
Company Statement of Financial Position
The notes on pages 45 to 95 form part of these accounts

42 IFRS Annual Report & Accounts 2017
As at 31 December 2017
Share Merger Retained* Total capital reserve earnings €'000 €'000 €'000 €'000
AT 1 JANUARY 2016 71,227 4,491 352,912 428,630
Profit for the year - - 66,126 66,126Currency exchange differences arising on retranslation - - (40,133) (40,133)
TOTAL COMPREHENSIVE INCOME - - 25,993 25,993Dividends paid - - (90,000) (90,000)
AT 31 DECEMBER 2016 71,227 4,491 288,905 364,623
Profit for the year - - 54,126 54,126
Currency exchange differences arising on retranslation - - (10,792) (10,792)
TOTAL COMPREHENSIVE INCOME - - 43,334 43,334
AT 31 DECEMBER 2017 71,227 4,491 332,239 407,957
* Movements in foreign currency translation reserves are detailed in note 35.
Company Statement of Changes in Equity
The notes on pages 45 to 95 form part of these accounts

43IFRS Annual Report & Accounts 2017
Year ended 31 December 2017
2017 2016 Note €'000 €'000 €'000 €'000CASH FLOWS FROM OPERATING ACTIVITIES
Cash generated from operations 37 95,927 134,430Bank and loan interest paid (48) (244)Interest received 1,582 1,502Income taxes paid (36,259) (39,641)
NET CASH FROM OPERATING ACTIVITIES 61,202 96,047
CASH FLOWS FROM INVESTING ACTIVITIES
Cash acquired on business combinations - 2,229 Purchase of intangible assets (800) (202) Purchase of property, plant and equipment (24,536) (19,964) Proceeds from sale of intangible assets - 81 Proceeds from sale of property, plant and equipment 975 623
NET CASH USED IN INVESTING ACTIVITIES (24,361) (17,233)
CASH FLOWS FROM FINANCING ACTIVITIES
Repayment of amounts borrowed (84) (125) Dividends paid to the shareholder - (90,000)
NET CASH USED IN FINANCING ACTIVITIES (84) (90,125)
Net increase/(decrease) in cash and cash equivalents 36,757 (11,311)
Cash and cash equivalents at 1 January 2017 296,923 329,634Effects of exchange rate changes on cash and cashequivalents (10,644) (21,400)
Cash and cash equivalents at 31 December 2017 323,036 296,923
CASH AND CASH EQUIVALENTS CONSISTS OF: Cash in hand, at bank and short term deposits 18 323,036 296,923
Consolidated Statement of Cash Flows
The notes on pages 45 to 95 form part of these accounts

44 IFRS Annual Report & Accounts 2017
Year ended 31 December 2017
The notes on pages 45 to 95 form part of these accounts
2017 2016 Note €'000 €'000 €'000 €'000CASH FLOWS FROM OPERATING ACTIVITIESCash generated from operations 37 1,000 11,995Interest received 5,680 5,921Income taxes received/(paid) 110 (3,409)
NET CASH FROM OPERATING ACTIVITIES 6,790 14,507
CASH FLOWS FROM INVESTING ACTIVITIES
Dividends received 66,192 54,902 Purchase of property, plant and equipment (2,971) (8,738) Proceeds from sale of property, plant and equipment 163 26
NET CASH GENERATED BY INVESTING ACTIVITIES 63,384 46,190
CASH FLOWS FROM FINANCING ACTIVITIES
Dividends paid to the shareholder - (90,000)
NET CASH USED IN FINANCING ACTIVITIES - (90,000)
Net increase/(decrease) in cash and cash equivalents 70,174 (29,303)
Cash and cash equivalents at 1 January 2017 117,139 162,969
Effects of exchange rate changes on cash and cash equivalents (9,932) (16,527)
Cash and cash equivalents at 31 December 2017 177,381 117,139
CASH AND CASH EQUIVALENTS CONSISTS OF:Cash in hand, at bank and short term deposits 18 177,381 117,139
Company Statement of Cash Flows

45IFRS Annual Report & Accounts 2017
Year ended 31 December 2017
1 ACCOUNTING POLICIES
a Basis of preparation
Langley Holdings plc (registered number 01321615) is a public limited company incorporated in the United Kingdom and limited by shares. The address of its registered office is Enterprise Way, Retford, Nottingham, DN22 7HH.
The Accounts have been prepared in accordance with International Financial Reporting Standards (IFRS) as approved for use in the European Union applied in accordance with the provisions of the Companies Act 2006.
The Accounts have been prepared on a historical cost basis, except for the revaluation of property, plant and equipment and measurement of defined benefit pension schemes.
New and amended Standards and Interpretations adopted by the Group
There were a number of Amendments to Standards adopted in the current year, but none of these had a material impact on the Company in the current period.
New and amended Standards and Interpretations issued but not effective for the financial year beginning 1 January 2017
At the date of authorisation of these accounts, the following standards and interpretations which have not been applied in these accounts were in issue but not yet effective:
• IFRS 9 "Financial instruments" will be effective for the year ending December 2018 onwards, the main impact being the impairment assessment methodology used to value trade receivables, an assessment of the full impact of this standard is in progress.
• IFRS 15 "Revenue from contracts with customers" will be effective for the year ending December 2018 onwards, an assessment of the full impact of this standard is in progress.
• IFRS 16 "Leases" will be effective for the year ending December 2019 onwards and the impact on the accounts is expected to be insignificant.
The effect of all other new and amended Standards and Interpretations which are in issue but not yet mandatorily effective is not expected to be material.
Notes to the Accounts

46 IFRS Annual Report & Accounts 2017
Year ended 31 December 2017
1 ACCOUNTING POLICIES (continued)
b Consolidation
The Consolidated Accounts incorporate the Accounts of the Company and all of its subsidiary undertakings for the year ended 31 December 2017 using the acquisition method, except for common control transactions, and exclude all intra-group transactions. Assets, liabilities and contingent liabilities of acquired companies are measured at fair value at the date of acquisition.
Any excess or deficiency between the cost of acquisition and fair value is treated as positive goodwill or a gain on bargain purchase as described below. Where subsidiary undertakings are acquired or disposed of during the year, the results and turnover are included in the Consolidated Income Statement from, or up to, the date control passes.
The Company has taken advantage of the exemption granted by Section 408 of the Companies Act 2006 from presenting its own Income Statement. The profit generated by the Company is disclosed under the Company Statement of Financial Position.
c Goodwill
When the fair value of the consideration for an acquired undertaking exceeds the fair value of its separable net assets, the difference is treated as purchased goodwill and is recognised as an asset at cost and reviewed for impairment annually. Any impairment is recognised immediately in the Consolidated Income Statement and is not reversed in subsequent years.
Where the fair value of the separable net assets exceeds the fair value of the consideration for an acquired undertaking the difference is credited to the Consolidated Income Statement in the year of acquisition.
Notes to the Accounts(Continued)

47IFRS Annual Report & Accounts 2017
Year ended 31 December 2017
1 ACCOUNTING POLICIES (continued)
d Impairment of intangible assets
Assets that have an indefinite useful life are not subject to amortisation and are reviewed for impairment annually and when there are indications that the carrying value may not be recoverable. Assets that are subject to amortisation are reviewed for impairment wherever events or changes in circumstances indicate that the carrying amount may not be recoverable. An impairment loss is recognised for the amount by which the carrying amount of the asset exceeds its recoverable amount. The recoverable amount is the higher of the fair value less costs to sell and value in use. For the purposes of assessing impairment, assets are grouped at the lowest levels for which there are separately identifiable cash flows (cash-generating units).
The amortisation on those intangible assets that do not have an indefinite useful life is charged to net operating expenses in the Income Statement and is calculated as follows:
Patents and licenses - 2 to 10 years straight line
e Property, plant and equipment
Property, plant and equipment is stated at cost of purchase or valuation, net of depreciation and any impairment provision.
Freehold land - not depreciated
Freehold buildings - 50 years straight line
Vehicles - 4 to 20 years straight line
Plant and machinery - 4 to 20 years straight line
Computers - 3 to 8 years straight line
Revaluations of land and buildings are made with sufficient regularity to ensure that the carrying amount does not differ materially from that which would be determined using fair value at the year end.
Notes to the Accounts(Continued)

48 IFRS Annual Report & Accounts 2017
Year ended 31 December 2017
1 ACCOUNTING POLICIES (continued)
f Financial instruments
Financial assets and financial liabilities are recognised in the Consolidated Statement of Financial Position when the Group becomes a party to the contractual provisions of the instrument.
Trade receivables
Trade receivables do not carry any interest and are initially measured at their fair value, and subsequently at their amortised cost, as reduced by appropriate allowances for estimated irrecoverable amounts.
Borrowings
Interest-bearing loans and overdrafts are recorded initially when the proceeds are received. Finance charges are accounted for at amortised cost using the effective interest rate method.
Trade payables
Trade payables are non-interest bearing and are initially measured at their fair value and subsequently at their amortised cost.
g Investments
Investments represent the Parent Company's holdings in its subsidiaries and are presented as non-current assets and stated at cost less any impairment in value. Any impairment is charged to the Company Income Statement.
h Inventories and work in progress
Inventories are valued at the lower of cost and net realisable value. Cost is calculated as follows:
Raw materials and consumables - cost of purchase on first in, first out basis.
Finished goods - cost of raw materials and labour together with attributable overheads.
Work in progress - cost of raw materials and labour together with attributable overheads.
Net realisable value is based on estimated selling price less further costs to completion and disposal.
Notes to the Accounts(Continued)

49IFRS Annual Report & Accounts 2017
Year ended 31 December 2017
1 ACCOUNTING POLICIES (continued)
i Construction contracts
Contract costs are recognised when incurred. When the outcome of a construction contract can be estimated reliably and it is probable that the contract will be profitable, contract revenue is recognised over the period of the contract. When the outcome of a construction contract cannot be estimated reliably, contract revenue is recognised only to the extent of contract costs incurred that it is probable will be recoverable. When it is probable that total contract costs will exceed total contract revenue, the expected loss is recognised as an expense immediately.
The Group uses the 'percentage of completion method' to determine the appropriate amount to recognise in a given period. The stage of completion is measured by reference to either the contract costs incurred up to the year end as a percentage of total estimated costs for each contract, or by reference to milestone conditions as defined in the contracts, as appropriate to the circumstances of the particular contract. Costs incurred in the year in connection with future activity on a contract are excluded from contract costs in determining the stage of completion, and are presented as inventories, prepayments or other assets, depending on their nature.
The Group presents as an asset the gross amount due from customers for contract work for all contracts in progress for which costs incurred plus recognised profits (less recognised losses) exceeds progress billings. Progress billings not yet paid by customers and retentions are included within 'trade and other receivables'.
The Group presents as a liability the gross amount due to customers for contract work for all contracts in progress for which progress billings exceed costs incurred plus recognised profits (less recognised losses).
j Taxes
Income tax expense represents the sum of the income tax currently payable and deferred income tax.
Deferred income tax is provided, using the liability method, on temporary differences between the tax bases of assets and liabilities and their carrying amounts in the Accounts. Deferred income tax assets are recognised to the extent that it is probable that future taxable profits will be available against which the deductible temporary differences can be utilised. Deferred tax has been calculated at the rate expected to apply at the time at which temporary differences are forecast to reverse, based on tax rates which have been substantially enacted at the balance sheet date.
Current and deferred income tax assets and liabilities are offset when the income taxes are levied by the same taxation authority and when there is a legally enforceable right to offset them.
Notes to the Accounts(Continued)

50 IFRS Annual Report & Accounts 2017
Year ended 31 December 2017
1 ACCOUNTING POLICIES (continued)
k Foreign currencies
(a) Transactions and balances
Transactions in currencies other than euro are recorded at the rates of exchange prevailing on the dates of the transactions. At each year end, monetary assets and liabilities that are denominated in foreign currencies are retranslated at the rates prevailing at the year end. Non-monetary assets and liabilities carried at fair value that are denominated in foreign currencies are translated at the rates prevailing at the date when the fair value was determined. Gains and losses arising on retranslation are included in net profit or loss for the period, except for exchange differences arising on non-monetary assets and liabilities where the changes in fair value are recognised directly in equity.
(b) Accounts of overseas operations
On consolidation, exchange differences arising from the translation of the net investment in foreign operations are taken to other comprehensive income.
Goodwill and fair value adjustments arising on the acquisition of a foreign entity are treated as assets and liabilities of the foreign entity and translated at the closing rate.
(c) Preparation of Accounts
These Accounts have been presented in euro because the majority of the Group's trade is conducted in this currency. Income and expense items are translated at the average exchange rates for the period unless exchange rates fluctuate significantly. Exchange differences arising, if any, are classified as equity and transferred to a separate component of equity.
The average exchange rate during the year was €1.14 (2016 - €1.22) to the Pound Sterling. The opening exchange rate was €1.17 (2016 - €1.36) to the Pound Sterling and the closing exchange rate was €1.13 (2016 - €1.17) to the Pound Sterling.
l Revenue recognition
Revenue from sale of goods is recognised when the Group has delivered the products and the customer has accepted them, and is measured at the fair value of the consideration received or receivable and represents amounts receivable for goods and services provided in the normal course of business, net of discounts, VAT and other sales related taxes.
Revenue from construction contracts is recognised in accordance with the Group's accounting policy on construction contracts, net of discounts, VAT and other sales related taxes.
Notes to the Accounts(Continued)
51IFRS Annual Report & Accounts 2017
Year ended 31 December 2017
1 ACCOUNTING POLICIES (continued)
m Cash and cash equivalents
Cash and cash equivalents comprise cash in hand, cash at bank and short-term deposits with banks and similar financial institutions with a maturity of six months or less, and bank overdrafts.
n Post-employment benefit obligations
For defined benefit post-employment schemes, the difference between the fair value of the scheme assets (if any) and the present value of the scheme liabilities is recognised as an asset or liability in the Statement of Financial Position.
Any asset recognised is restricted, if appropriate, to the present value of any amounts the Group expects to recover by way of refunds from the plan or reductions in future contributions. Remeasurements of the net surplus/deficit arising in the year are taken to the Statement of Comprehensive Income.
Other movements in the net surplus or deficit are recognised in the Income Statement, including the current service cost and any past service cost. The net interest cost on the net defined benefit liability is also charged to the Income Statement. The amount charged to the Income Statement in respect of these schemes is included within operating costs.
The most significant assumptions used in accounting for pension schemes are the discount rate and the mortality assumptions. The discount rate is used to determine the interest cost and net present value of future liabilities. The discount rate used is the yield on high quality corporate bonds with maturity and terms that match those of the post employment obligations as closely as possible. Where there is no developed corporate bond market in a country, the rate on government bonds is used. Each year, the unwinding of the discount on the net liabilities is charged to the Group's Income Statement as the interest cost. The mortality assumption is used to project the future stream of benefit payments, which is then discounted to arrive at a net present value of liabilities.
Valuations of liabilities are carried out using the projected unit method.
The values attributed to scheme liabilities are assessed in accordance with the advice of independent qualified actuaries.
The Group's contributions to defined contribution pension schemes are charged to the Income Statement in the period to which the contributions relate.
o Leased assets
All leases are "operating leases" and the relevant annual rentals are charged to the Consolidated Income Statement on a straight line basis over the lease term.
Notes to the Accounts(Continued)
52 IFRS Annual Report & Accounts 2017
Year ended 31 December 2017
1 ACCOUNTING POLICIES (continued)
p Dividend policy
Dividend distribution to the Company's Shareholder is recognised as a liability in the Group's Accounts in the period in which the dividends are approved by the Company's Shareholder.
q Key assumptions and significant judgements
The preparation of the Accounts in conformity with IFRS requires management to make estimates and assumptions that affect the reported amounts of revenues, expenses, assets and liabilities, and the disclosure of contingent liabilities at the date of the Accounts. The areas where the most judgement is required are highlighted below:
i Pensions
The determination of the pension cost and defined benefit obligation of the Group's defined benefit pension schemes depends on the selection of certain assumptions which include the discount rate, inflation rate, salary growth and mortality. Differences arising from actual experiences or future changes in assumptions will be reflected in subsequent periods. See note 9 for further details.
ii Property, plant and equipment
The property, plant and equipment used within the Group have estimated service lives of between 3 and 20 years, with the exception of property which has an estimated service life of 50 years, and the depreciation charge is clearly sensitive to the lives allocated to the various types of asset. Asset lives are reviewed regularly and changed where necessary to reflect the current view on their remaining lives in light of the technological change, prospective economic utilisation and the physical condition of the assets.
iii Revenue recognition
Revenue and profit are recognised for contracts undertaken based on estimates of the stage of completion of the contract activity. The Group's policies for the recognition of revenue and profit are set out above.
Notes to the Accounts(Continued)

53IFRS Annual Report & Accounts 2017
Year ended 31 December 2017
1 ACCOUNTING POLICIES (continued)
q Key assumptions and significant judgements (continued)
iv Impairment of assets
Property, plant and equipment, and intangible assets are reviewed for impairment if events or changes in circumstances indicate that the carrying amount may not be recoverable. When a review for impairment is conducted, the recoverable amount of an asset or a cash-generating unit is determined based on value-in-use calculations prepared on the basis of management's assumptions and estimates.
v Income taxes
The Group is subject to income taxes in numerous jurisdictions. Significant judgement is required in determining the provision for income taxes in each territory. There are many transactions and calculations for which the ultimate tax determination is uncertain during the ordinary course of business. The Group recognises liabilities for anticipated tax audit issues based on estimates of whether additional taxes will be due. Where the final tax outcome of these matters is different from the amounts which were initially recorded, such differences will impact the income tax and deferred tax provision in the period to which such determination is made. See notes 10 and 27 for further information.
vi Provisions
Provision is made for liabilities that are uncertain in timing or amount of settlement. These include provision for rectification and warranty claims. Calculations of these provisions are based on cash flows relating to these costs estimated by management supported by the use of external consultants where needed and discounted at an appropriate rate where the impact of discounting is material.
r Research and development
Research expenditure is charged to the Income Statement in the period in which it is incurred. Development expenditure is capitalised when the criteria for recognising an asset is met. Other development expenditure is recognised in the Income Statement as incurred.
Notes to the Accounts(Continued)

54 IFRS Annual Report & Accounts 2017
Year ended 31 December 2017
2 REVENUE An analysis of the Group's revenue between each significant category is as follows: 2017 2016 €'000 €'000Revenue from construction contracts 175,400 186,075Sale of goods 728,129 714,850
903,529 900,925
3 ANALYSIS OF NET OPERATING EXPENSES 2017 2016 €'000 €'000Distribution costs 50,898 49,709Administrative expenses 154,709 147,760Other operating income (5,865) (5,689)
Net operating expenses 199,742 191,780
4 OPERATING PROFIT 2017 2016 €'000 €'000Operating profit has been arrived at after chargingDirectors' emoluments (note 7) 4,268 3,245Depreciation of owned assets (note 12) 14,173 13,369Impairment of owned assets (note 12) 1,513 146Amortisation of intangibles (note 11) 736 527Research and development costs 7,234 7,179Loss/(profit) on sale of property, plant and equipment 154 (95)Fees payable to the Group's auditor for the audit of the Group's Accounts 153 179Fees payable to the Group's auditor and its associates for other services - the auditing of Subsidiary Accounts 962 1,163 - other services relating to taxation compliance 197 133 - all other services 216 165Operating lease - land and buildings 2,889 4,749 - other 421 924Impairment of trade receivables 229 1,356Cost of inventories recognised as an expense 413,971 403,555(included in cost of sales) Net loss/(profit) on foreign currency translation 9,013 (8,240)
Notes to the Accounts(Continued)

55IFRS Annual Report & Accounts 2017
Year ended 31 December 2017
5 FINANCE INCOME 2017 2016 €'000 €'000Bank interest receivable 1,362 1,281Other interest receivable 220 221
1,582 1,502
6 FINANCE COSTS 2017 2016 €'000 €'000Other interest 48 244
7 KEY MANAGEMENT PERSONNEL COMPENSATION 2017 2016 €'000 €'000Salaries and short-term employee benefits 4,800 3,654Post-employment benefits 8 31
4,808 3,685
All of the above key management personnel compensation relates to Directors.
Directors' emoluments 2017 2016 €'000 €'000Aggregate emoluments as Directors of the Company 4,260 3,214Value of Group pension contributions to money purchase schemes 8 31
4,268 3,245
Emoluments of the highest paid Director 3,687 2,683
Number of Directors who are accruing benefits under money No. No.purchase pension schemes 2 2
Notes to the Accounts(Continued)

56 IFRS Annual Report & Accounts 2017
Year ended 31 December 2017
8 EMPLOYEE NUMBERS AND COSTSThe average number of persons employed by the Group (including Directors) during the year was as follows:
2017 2016 No NoManagement, office and sales 2,166 2,162Manufacturing and direct labour 2,063 2,039
4,229 4,201
The aggregate payroll costs of these persons were as follows: 2017 2016 €'000 €'000Wages and salaries 239,218 226,416Social security costs 48,771 44,689Other pension costs 2,215 4,750
290,204 275,855
The average number of persons employed by the Company (including Directors) during the year was as follows:
2017 2016 No NoManagement, office and sales 29 31
The aggregate payroll costs of these persons were as follows:
2017 2016 €'000 €'000Wages and salaries 1,177 1,222Social security costs 790 597Other pension costs 26 42
1,993 1,861
Notes to the Accounts(Continued)

57IFRS Annual Report & Accounts 2017
Year ended 31 December 2017
9 POST-EMPLOYMENT BENEFITSThe table below outlines where the Group's post-employment amounts and activity are included in the Accounts. 2017 2016 €'000 €'000Balance sheet obligations for: Defined pension benefits (9,012) (9,603) Post-employment medical benefits (2,958) (3,418)
Liability in the balance sheet (11,970) (13,021)
Income statement credit/(charge) included in operating expenses for:Defined pension benefits 736 96Post-employment medical benefits (118) (129)
618 (33)
Remeasurements charge for: Defined pension benefits 26 (238) Post-employment medical benefits (74) (123)
(48) (361)
The income statement charge included within operating expenses includes current service costs, net interest costs and past service costs.
a) Defined benefit pension schemes
The group operates defined benefit pension plans in the UK (one defined benefits scheme and one hybrid scheme) and Eurozone under broadly similar regulatory frameworks. All of the plans are final salary pension plans, which provide benefits to members in the form of a guaranteed level of pension payable for life. The level of benefits provided depends on members' length of service and their salary in the final years leading up to retirement. Pensions in payment are generally updated in line with inflation. The plans face broadly similar risks, as described below. UK benefit payments are from trustee-administered funds and Eurozone benefit payments are from unfunded plans where the company meets the benefit payment obligation as it falls due. Assets held in UK trusts are governed by UK regulations and practice, as is the nature of the relationship between the group and the trustees (or equivalent) and their composition. Responsibility for governance of the schemes - including investment decisions and contribution schedules - lies jointly with the Group and the boards of trustees. The boards of trustees must be composed of representatives of the Group and scheme participants in accordance with the schemes' regulations.
Notes to the Accounts(Continued)

58 IFRS Annual Report & Accounts 2017
Year ended 31 December 2017
9 POST-EMPLOYMENT BENEFITS (continued)The amounts recognised in the balance sheet are determined as follows: 2017 2016 €'000 €'000Present value of funded obligations (17,013) (14,282) Fair value of plan assets 16,870 17,274
Net (deficit)/surplus on funded plans (143) 2,992Present value of unfunded obligations (8,650) (9,488)
Total deficit of defined benefit pension plans (8,793) (6,496) Impact of asset ceiling (219) (3,107)
Liability in the balance sheet (9,012) (9,603)
The UK defined benefit scheme has a surplus that is not recognised on the basis that future economic benefits are not available to the entity in the form of a reduction in future contributions or a cash refund.
The amount recognised in the income statement: 2017 2016 €'000 €'000Current service cost 788 165Net interest cost (52) (69)
736 96
The above amounts are included as an employee cost within net operating expenses.
Notes to the Accounts(Continued)
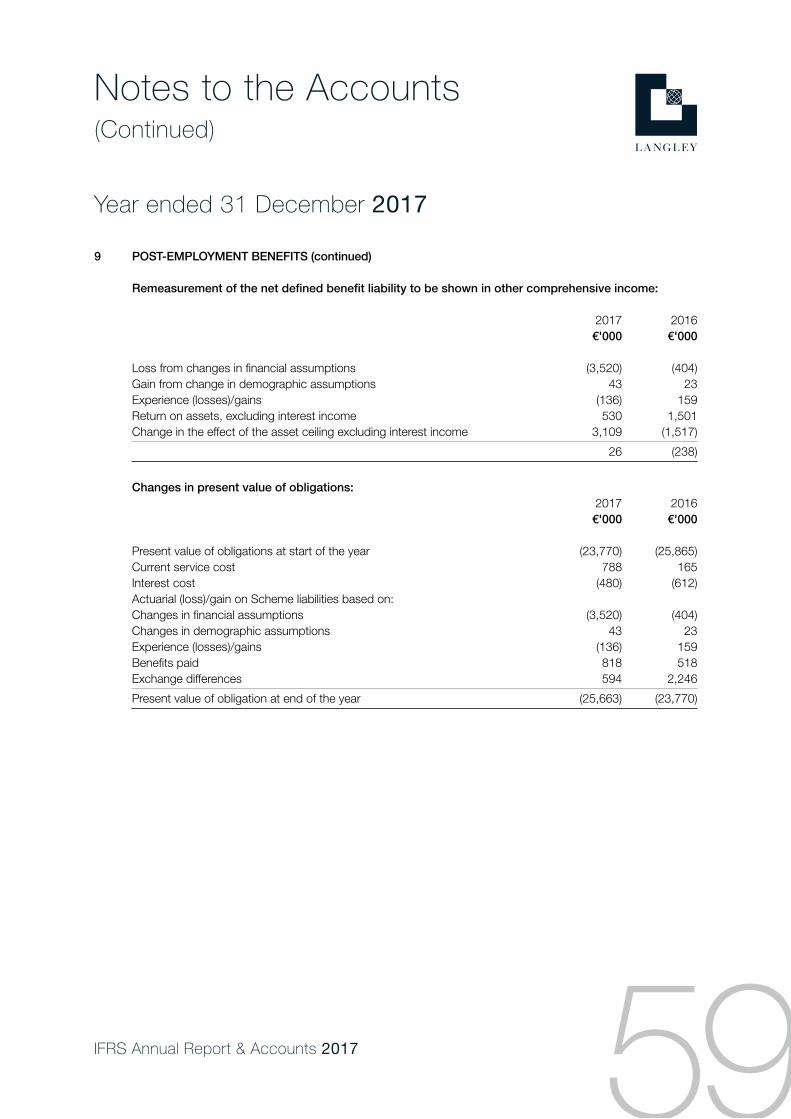
59IFRS Annual Report & Accounts 2017
Year ended 31 December 2017
9 POST-EMPLOYMENT BENEFITS (continued)
Remeasurement of the net defined benefit liability to be shown in other comprehensive income:
2017 2016 €'000 €'000
Loss from changes in financial assumptions (3,520) (404)Gain from change in demographic assumptions 43 23Experience (losses)/gains (136) 159Return on assets, excluding interest income 530 1,501Change in the effect of the asset ceiling excluding interest income 3,109 (1,517)
26 (238)
Changes in present value of obligations: 2017 2016 €'000 €'000
Present value of obligations at start of the year (23,770) (25,865)Current service cost 788 165Interest cost (480) (612)Actuarial (loss)/gain on Scheme liabilities based on: Changes in financial assumptions (3,520) (404)Changes in demographic assumptions 43 23Experience (losses)/gains (136) 159Benefits paid 818 518Exchange differences 594 2,246
Present value of obligation at end of the year (25,663) (23,770)
Notes to the Accounts(Continued)

60 IFRS Annual Report & Accounts 2017
Year ended 31 December 2017
9 POST-EMPLOYMENT BENEFITS (continued)
Changes in the fair value of scheme assets: 2017 2016 €'000 €'000Fair value of scheme assets at the start of the year 17,274 18,105Interest income 428 606Remeasurement of scheme assets 530 1,501Contributions by employers 78 83Benefits paid (775) (476)Exchange differences (665) (2,545)
Fair value of scheme assets at the end of the year 16,870 17,274
The significant actuarial assumptions were as follows: 2017 2016 UK Eurozone UK Eurozone
Rate of increase in salaries - 1.63% - 1.77%Discount rate 2.4% 1.25-1.45% 2.6% 1.3-1.36%Inflation 3.3-3.5% 1.25-1.45% 3.4-3.5% 1.3-1.36%
The inflation assumption shown for the UK is for the Retail Price Index. The assumption for the Consumer Price Index at 31 December 2017 was 2.3-2.5%.
Assumptions regarding future mortality are set based on actuarial advice in accordance with published statistics and experience in each territory. These assumptions translate into an average life expectancy in years for a pensioner retiring at age 65:
2017 2016Retiring at the end of the reporting period: Male 22-23 years 22 yearsFemale 24-25 years 24-25 years
Retiring 20 years after the end of the reporting period: Male 24-25 years 24-25 yearsFemale 26-27 years 26-27 years
Notes to the Accounts(Continued)

61IFRS Annual Report & Accounts 2017
Year ended 31 December 2017
9 POST-EMPLOYMENT BENEFITS (continued)
The sensitivity of the defined benefit obligation to changes in the weighted principal assumptions is:
Change in assumption Increase in assumption Decrease in assumption
Discount rate 0.25% Decrease obligation Increase obligation by 3.5 - 4.4% by 3.5 - 4.4%Inflation 0.25% Decrease obligation Increase obligation by 0.2 - 3.0% by 0.2 - 3.0%Life expectancy 1 year Increase obligation Increase obligation by 4.3% by 4.3%
The above sensitivity analyses are based on a change in an assumption while holding all other assumptions constant. In practice, this is unlikely to occur, and changes in some of the assumptions may be correlated. When calculating the sensitivity of the defined benefit obligation to significant actuarial assumptions the same method (present value of the defined benefit obligation calculated with the projected unit credit method at the end of the reporting period) has been applied as when calculating the pension liability recognised within the statement of financial position.
The methods and types of assumptions used in preparing the sensitivity analysis did not change compared to the previous period.
b) Post - employment medical benefits
The group operates a post-employment medical benefit scheme in the US. This scheme is unfunded. The method of accounting, significant assumptions and the frequency of valuations are similar to those used for defined benefit pension schemes set out above with the addition of actuarial assumptions relating to the long-term increase in healthcare costs of 3.0% a year and claim rates of 5.5%.
The amounts recognised in the balance sheet are determined as follows:
2017 2016 €'000 €'000Present value of unfunded obligations (2,958) (3,418)
Liability in the balance sheet (2,958) (3,418)
Notes to the Accounts(Continued)
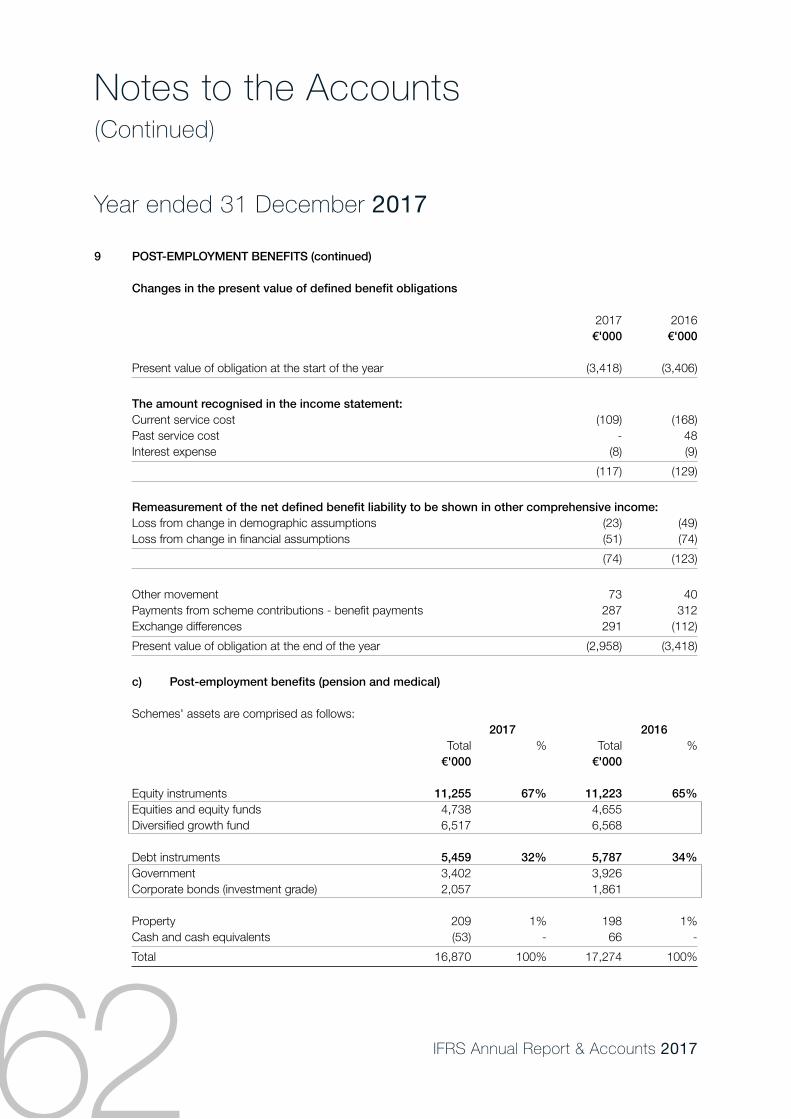
62 IFRS Annual Report & Accounts 2017
Year ended 31 December 2017
9 POST-EMPLOYMENT BENEFITS (continued)
Changes in the present value of defined benefit obligations
2017 2016 €'000 €'000
Present value of obligation at the start of the year (3,418) (3,406)
The amount recognised in the income statement:Current service cost (109) (168) Past service cost - 48Interest expense (8) (9)
(117) (129)
Remeasurement of the net defined benefit liability to be shown in other comprehensive income:Loss from change in demographic assumptions (23) (49) Loss from change in financial assumptions (51) (74)
(74) (123)
Other movement 73 40Payments from scheme contributions - benefit payments 287 312Exchange differences 291 (112)
Present value of obligation at the end of the year (2,958) (3,418)
c) Post-employment benefits (pension and medical)
Schemes' assets are comprised as follows: 2017 2016 Total % Total % €'000 €'000
Equity instruments 11,255 67% 11,223 65%Equities and equity funds 4,738 4,655 Diversified growth fund 6,517 6,568
Debt instruments 5,459 32% 5,787 34%Government 3,402 3,926 Corporate bonds (investment grade) 2,057 1,861
Property 209 1% 198 1%Cash and cash equivalents (53) - 66 -
Total 16,870 100% 17,274 100%
Notes to the Accounts(Continued)
63IFRS Annual Report & Accounts 2017
Year ended 31 December 2017
9 POST-EMPLOYMENT BENEFITS (continued)
Through its defined benefit pension schemes and post-employment medical plans, the Group is exposed to a number of risks, most of which are detailed below:
Asset volatilityThe schemes' liabilities are calculated using a discount rate set with reference to corporate bond yields; if scheme assets underperform this yield, this will create a deficit. The UK schemes hold a significant proportion of equity instruments, which are expected to outperform corporate bonds in the long-term while providing volatility and risk in the short-term.
The Group has reduced the level of investment risk by investing in assets that better match the liabilities. This has been done by the purchase of a mixture of government and corporate bonds. The government bonds represent investments in UK government securities only. The corporate bonds are global securities with an emphasis on the UK.
Changes in bond yieldA decrease in corporate bond yields will increase scheme liabilities, although this will be partially offset by an increase in the value of the schemes' bond holdings.
Inflation riskSome of the Group pension obligations are linked to inflation, and higher inflation will lead to higher liabilities (although, in most cases, caps on the level of inflationary increases are in place to protect the schemes against extreme inflation). The majority of the schemes' assets are either unaffected by (fixed interest bonds) or loosely correlated with (equities) inflation, meaning that an increase in inflation will also increase the deficit.
Life expectancyThe majority of the schemes' obligations are to provide benefits for the life of the member, so increase in life expectancy will result in an increase in the scheme's liabilities. This is particularly significant in the UK schemes, where inflationary increases result in higher sensitivity to changes in life expectancy.
In case of the Eurozone defined benefit scheme, the Group ensures that the investment positions are managed within an asset-liability matching (ALM) framework that has been developed to achieve long-term investments that are in line with the obligations under the scheme. Within this framework, the Group's ALM objective is to match assets to the pension obligations by investing in long-term fixed interest securities with maturities that match the benefit payments as they fall due. The UK hybrid scheme currently has no asset-liability matching strategy. The Group has not changed the processes used to manage its risks from previous periods. The Group does not use derivatives to manage its risk. Investments are well diversified, such that the failure of any single investment would not have a material impact on the overall level of assets. A large portion of assets in 2017 consist of equities and bonds, although the Group also invests in property and cash.
The Group has agreed that it will aim to eliminate the deficit in the hybrid scheme over the next 15 years. There is no deficit in the defined benefits scheme. The next triennial valuations are due to be completed as at 5 April 2018 and 31 July 2018 for the defined benefits scheme and hybrid scheme respectively. The Group considers that the contribution rates set at the last valuation date are sufficient to eliminate the deficit over the agreed period.
Notes to the Accounts(Continued)

64 IFRS Annual Report & Accounts 2017
Year ended 31 December 2017
9 POST-EMPLOYMENT BENEFITS (continued)
Expected contributions to post-employment benefit schemes for the year ending 31 December 2018 are €207,490.
The weighted average duration of the defined benefit obligation is 16.6 years.
10 INCOME TAX EXPENSE
(a) Charge for the year 2017 2016 €'000 €'000Current income tax:
UK corporation tax at 19.25% (2016 - 20%) 3,410 7,686 Overseas tax 29,695 32,317 Adjustments to prior year UK tax 82 (100)Adjustments to prior year overseas tax (2,022) 1,495
Total current taxation 31,165 41,398
Deferred income tax: Movement in overseas deferred tax 6,233 (1,484)Movement in UK deferred tax (38) 314
Total deferred taxation 6,195 (1,170)
Income tax expense 37,360 40,228
(b) Factors affecting tax expense 2017 2016 €'000 €'000Profit before taxation 111,808 122,730
Profit before taxation multiplied by the standard rate of tax of19.25% (2016 - 20%) 21,523 24,546 Expenses not deductible for tax purposes 4,353 4,449Income not taxable (1,047) (285)Timing differences (3,897) (1,362)Effect of foreign tax rates 16,701 11,726 Utilisation of losses brought forward (2,413) (2,652)Deferred tax assets not recognised 4,801 1,666 Exchange adjustment (721) 745 Adjustment to tax charge in previous period (1,940) 1,395
Tax expense 37,360 40,228
Notes to the Accounts(Continued)

65IFRS Annual Report & Accounts 2017
Year ended 31 December 2017
10 INCOME TAX EXPENSE (continued)
(c) Factors that may affect future tax charges
The Group had UK tax losses of approximately €5,445,000 at 31 December 2017 (2016 - €1,860,000) available for carry forward against future trading profits. In addition the Claudius Peters Group had overseas tax losses of approximately €1,174,000 at 31 December 2017 (2016 - €600,000), the Manroland Group €129,084,000 (2016 - €139,461,000), the Druck Chemie Group €7,368,000 (2016 - €7,013,000), the Bradman Lake Group €1,998,000 (2016 - €1,793,000) and the Active Power Group €2,431,000 (2016 - €1,641,000) available for carry forward against future trading profits of that Group.
(d) Impact of future tax rate changes
Finance Act 2016, which received Royal Assent on 15 September 2016, includes legislation to reduce the main rate of corporation tax from 19% to 17% from 1 April 2020. Accordingly, deferred tax has been calculated at the tax rate of 17%.
Notes to the Accounts(Continued)

66 IFRS Annual Report & Accounts 2017
Year ended 31 December 2017
11 INTANGIBLE ASSETS GROUP Positive Patents and Goodwill Licences Total €'000 €'000 €'000CostAt 1 January 2017 2,768 4,843 7,611Additions 5 795 800Exchange adjustment (334) (157) (491)
At 31 December 2017 2,439 5,481 7,920
Aggregate impairment and amortisationAt 1 January 2017 - 4,356 4,356Amortisation charge for the year - 736 736Exchange adjustment - (157) (157)
At 31 December 2017 - 4,935 4,935
Net book valuesAt 31 December 2017 2,439 546 2,985
At 31 December 2016 2,768 487 3,255
CostAt 1 January 2016 2,652 4,655 7,307Additions - 202 202Disposals - (164) (164)Exchange adjustment 116 150 266
At 31 December 2016 2,768 4,843 7,611
Aggregate impairment and amortisationAt 1 January 2016 - 3,954 3,954Amortisation charge for the year - 527 527Disposals - (91) (91)Exchange adjustment - (34) (34)
At 31 December 2016 - 4,356 4,356
Net book valuesAt 31 December 2016 2,768 487 3,255
At 31 December 2015 2,652 701 3,353
Notes to the Accounts(Continued)

67IFRS Annual Report & Accounts 2017
Year ended 31 December 2017
12 PROPERTY, PLANT AND EQUIPMENT GROUP Freehold land & Plant and buildings machinery Vehicles Computers Total €'000 €'000 €'000 €'000 €'000Cost or valuationAt 1 January 2017 157,292 123,891 54,990 17,075 353,248Additions 13,294 6,063 4,220 959 24,536Disposals - (1,658) (1,825) (334) (3,817)Revaluation 1,782 - - - 1,782Exchange adjustments (3,826) (1,061) (1,819) (534) (7,240)
At 31 December 2017 168,542 127,235 55,566 17,166 368,509
DepreciationAt 1 January 2017 46,186 77,242 14,015 14,911 152,354Charge for the year 3,218 5,968 4,026 961 14,173Impairment - - 1,513 - 1,513Disposals - (1,283) (1,413) (300) (2,996)Exchange adjustments (712) (1,482) (495) (709) (3,398)
At 31 December 2017 48,692 80,445 17,646 14,863 161,646
Net book amountAt 31 December 2017 119,850 46,790 37,920 2,303 206,863
At 31 December 2016 111,106 46,649 40,975 2,164 200,894
Cost or valuationAt 1 January 2016 152,351 117,673 59,380 16,198 345,602Additions 5,356 9,779 3,522 1,307 19,964On acquisition - 1,853 - 161 2,014Disposals (33) (2,330) (1,239) (501) (4,103)Reclassification 2,038 (2,038) - - -Exchange adjustments (2,420) (1,046) (6,673) (90) (10,229)
At 31 December 2016 157,292 123,891 54,990 17,075 353,248
DepreciationAt 1 January 2016 42,789 74,269 11,815 14,515 143,388Charge for the year 3,094 5,403 4,027 845 13,369On acquisition - 357 - 61 418Impairment 18 101 - 27 146Disposals (33) (2,047) (790) (498) (3,368)Reclassification 427 (427) - - -Exchange adjustments (109) (414) (1,037) (39) (1,599)
At 31 December 2016 46,186 77,242 14,015 14,911 152,354
Net book amountAt 31 December 2016 111,106 46,649 40,975 2,164 200,894
At 31 December 2015 109,562 43,404 47,565 1,683 202,214
Notes to the Accounts(Continued)

68 IFRS Annual Report & Accounts 2017
Year ended 31 December 2017
12 PROPERTY, PLANT AND EQUIPMENT (continued)
COMPANY Freehold land & Plant and buildings machinery Vehicles Computers TotalCost or valuation €'000 €'000 €'000 €'000 €'000At 1 January 2017 23,502 6,972 2,251 441 33,166Additions 1,473 410 1,075 13 2,971Disposals - - (569) (68) (637)Exchange adjustments (920) (272) (92) (18) (1,302)
At 31 December 2017 24,055 7,110 2,665 368 34,198
DepreciationAt 1 January 2017 1,793 2,083 1,657 418 5,951Disposals - - (544) (68) (612)Charge for the year 776 585 415 11 1,787Exchange adjustments (80) (88) (61) (14) (243)
At 31 December 2017 2,489 2,580 1,467 347 6,883
Net book amountAt 31 December 2017 21,566 4,530 1,198 21 27,315
At 31 December 2016 21,709 4,889 594 23 27,215
Cost or valuationAt 1 January 2016 23,175 2,769 2,486 500 28,930Additions 3,638 4,761 330 9 8,738Disposals - - (220) - (220) Exchange adjustments (3,311) (558) (345) (68) (4,282)
At 31 December 2016 23,502 6,972 2,251 441 33,166
DepreciationAt 1 January 2016 1,311 2,005 1,827 440 5,583Disposals - - (219) - (219) Charge for the year 687 366 303 41 1,397Exchange adjustments (205) (288) (254) (63) (810)
At 31 December 2016 1,793 2,083 1,657 418 5,951
Net book amount At 31 December 2016 21,709 4,889 594 23 27,215
At 31 December 2015 21,864 764 659 60 23,347
Notes to the Accounts(Continued)

69IFRS Annual Report & Accounts 2017
Year ended 31 December 2017
12 PROPERTY, PLANT AND EQUIPMENT (continued)
If these assets had not been revalued they would have been included at the following historical cost amounts:
Group 2017 2016 €'000 €'000Freehold land and buildingsCost 160,981 151,385
Aggregate depreciation and impairment 45,877 43,435
13 NON-CURRENT INVESTMENTS Group Company Shares in Shares in unlisted group undertakings undertakings €'000 €'000COSTAt 1 January 2017 14 79,520Exchange adjustment - (3,045)
At 31 December 2017 14 76,475
Carrying amountAt 31 December 2017 14 76,475
At 31 December 2016 14 79,520
Group Company Shares in Shares in unlisted group undertakings undertakings €'000 €'000COSTAt 1 January 2016 14 92,144Exchange adjustment - (12,624)
At 31 December 2016 14 79,520
Carrying amountAt 31 December 2016 14 79,520
At 31 December 2015 14 92,144
Notes to the Accounts(Continued)
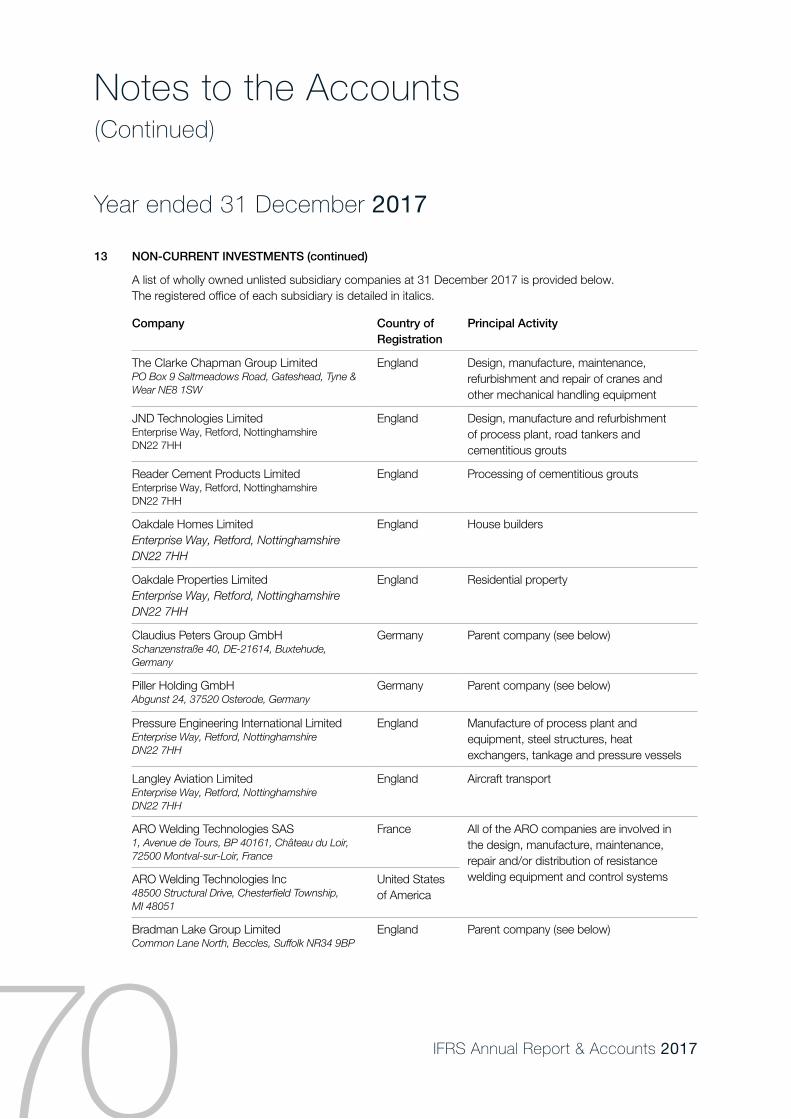
70 IFRS Annual Report & Accounts 2017
Year ended 31 December 2017
13 NON-CURRENT INVESTMENTS (continued)
A list of wholly owned unlisted subsidiary companies at 31 December 2017 is provided below. The registered office of each subsidiary is detailed in italics.
Notes to the Accounts(Continued)
Company Country ofRegistration
Principal Activity
The Clarke Chapman Group LimitedPO Box 9 Saltmeadows Road, Gateshead, Tyne & Wear NE8 1SW
England Design, manufacture, maintenance, refurbishment and repair of cranes and other mechanical handling equipment
JND Technologies LimitedEnterprise Way, Retford, Nottinghamshire DN22 7HH
England Design, manufacture and refurbishment of process plant, road tankers and cementitious grouts
Reader Cement Products LimitedEnterprise Way, Retford, Nottinghamshire DN22 7HH
England Processing of cementitious grouts
Oakdale Homes LimitedEnterprise Way, Retford, Nottinghamshire DN22 7HH
England House builders
Oakdale Properties LimitedEnterprise Way, Retford, Nottinghamshire DN22 7HH
England Residential property
Claudius Peters Group GmbHSchanzenstraße 40, DE-21614, Buxtehude, Germany
Germany Parent company (see below)
Piller Holding GmbHAbgunst 24, 37520 Osterode, Germany
Germany Parent company (see below)
Pressure Engineering International LimitedEnterprise Way, Retford, Nottinghamshire DN22 7HH
England Manufacture of process plant and equipment, steel structures, heat exchangers, tankage and pressure vessels
Langley Aviation LimitedEnterprise Way, Retford, Nottinghamshire DN22 7HH
England Aircraft transport
ARO Welding Technologies SAS1, Avenue de Tours, BP 40161, Château du Loir, 72500 Montval-sur-Loir, France
France All of the ARO companies are involved in the design, manufacture, maintenance, repair and/or distribution of resistance welding equipment and control systems ARO Welding Technologies Inc
48500 Structural Drive, Chesterfield Township, MI 48051
United States of America
Bradman Lake Group LimitedCommon Lane North, Beccles, Suffolk NR34 9BP
England Parent company (see below)

71IFRS Annual Report & Accounts 2017
Year ended 31 December 2017
Notes to the Accounts(Continued)
13 NON-CURRENT INVESTMENTS (continued)
A list of wholly owned unlisted subsidiary companies at 31 December 2017 is provided below. The registered office of each subsidiary is detailed in italics.
The following companies are wholly owned unlisted subsidiaries of ARO Welding Technologies SAS, at 31 December 2017:
Company Country ofRegistration
Principal Activity
Retford Investments LLC3050 Southcross Blvd Rock Hill, SC 29730
United States of America
Holder of real estate for other group companies
CPVA GmbHMuehlheimer Strase 341, 63075 Offenbach am Main, Germany
Germany Property rental
Sheetfed Holdings LimitedMikenboard LimitedH Q Engineers LimitedJND Wefco LimitedAll of the above:Enterprise Way, Retford, Nottinghamshire DN22 7HH
EnglandEnglandEnglandEngland
Parent company (see below)Dormant subsidiaryDormant subsidiaryDormant subsidiary
Sail Cruising Limited Antigua Dormant subsidiary
Company Country ofRegistration
Principal Activity
ARO Welding Technologies ABAB Timotejvägen, 7 439 71, Fjärås
Sweden All of the companies are involved in the design, manufacture, maintenance, repair and/or distribution of resistance welding equipment and control systems.
ARO Welding Technologies SA de CV43B Sur 4720 Estrella del Sur C.P. 72190 Puebla, Pue
Mexico
ARO Welding Technologies SAUC/ Cuzco, 26-28, nave 2 08030 Barcelona
Spain
ARO Welding Technologies LimitedUnit 15, Planetary Industrial Estate, Planetary Road, Willenhall, Wolverhampton, WV13 3XA
England
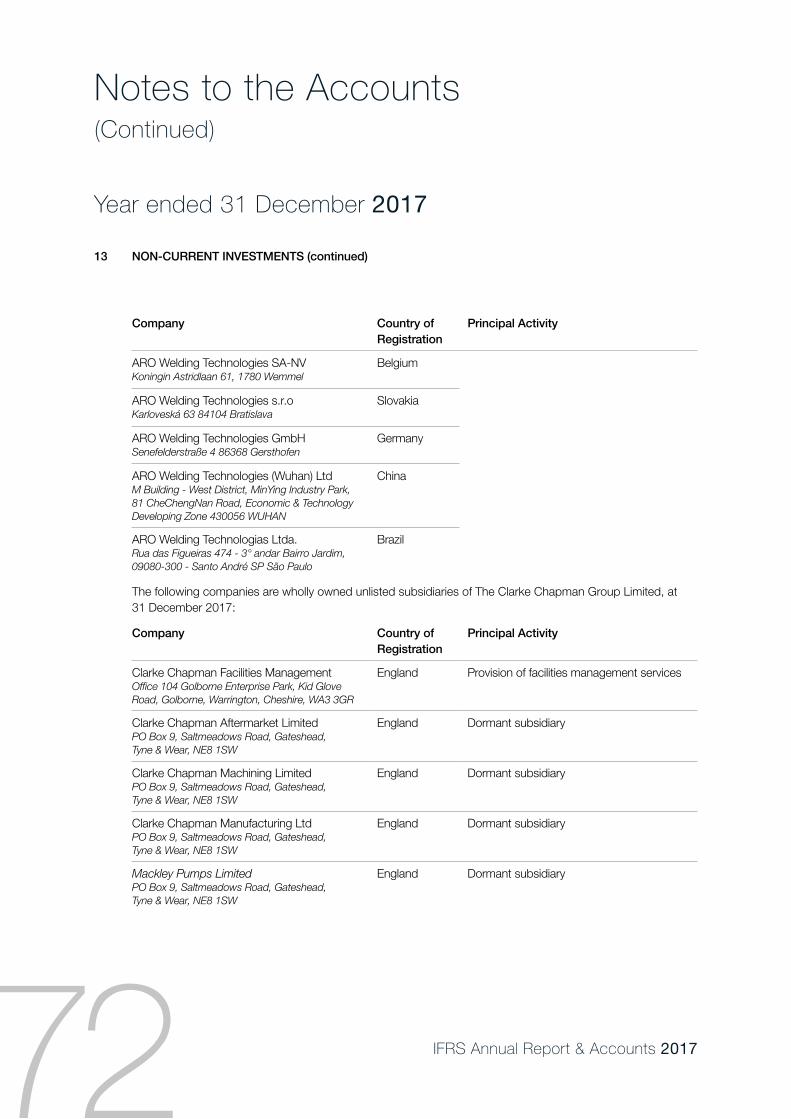
72 IFRS Annual Report & Accounts 2017
Year ended 31 December 2017
Notes to the Accounts(Continued)
13 NON-CURRENT INVESTMENTS (continued)
The following companies are wholly owned unlisted subsidiaries of The Clarke Chapman Group Limited, at 31 December 2017:
Company Country ofRegistration
Principal Activity
ARO Welding Technologies SA-NVKoningin Astridlaan 61, 1780 Wemmel
Belgium
ARO Welding Technologies s.r.oKarloveská 63 84104 Bratislava
Slovakia
ARO Welding Technologies GmbHSenefelderstraße 4 86368 Gersthofen
Germany
ARO Welding Technologies (Wuhan) LtdM Building - West District, MinYing Industry Park, 81 CheChengNan Road, Economic & Technology Developing Zone 430056 WUHAN
China
ARO Welding Technologias Ltda.Rua das Figueiras 474 - 3° andar Bairro Jardim, 09080-300 - Santo André SP São Paulo
Brazil
Company Country ofRegistration
Principal Activity
Clarke Chapman Facilities ManagementOffice 104 Golborne Enterprise Park, Kid Glove Road, Golborne, Warrington, Cheshire, WA3 3GR
England Provision of facilities management services
Clarke Chapman Aftermarket LimitedPO Box 9, Saltmeadows Road, Gateshead, Tyne & Wear, NE8 1SW
England Dormant subsidiary
Clarke Chapman Machining LimitedPO Box 9, Saltmeadows Road, Gateshead, Tyne & Wear, NE8 1SW
England Dormant subsidiary
Clarke Chapman Manufacturing LtdPO Box 9, Saltmeadows Road, Gateshead, Tyne & Wear, NE8 1SW
England Dormant subsidiary
Mackley Pumps LimitedPO Box 9, Saltmeadows Road, Gateshead, Tyne & Wear, NE8 1SW
England Dormant subsidiary
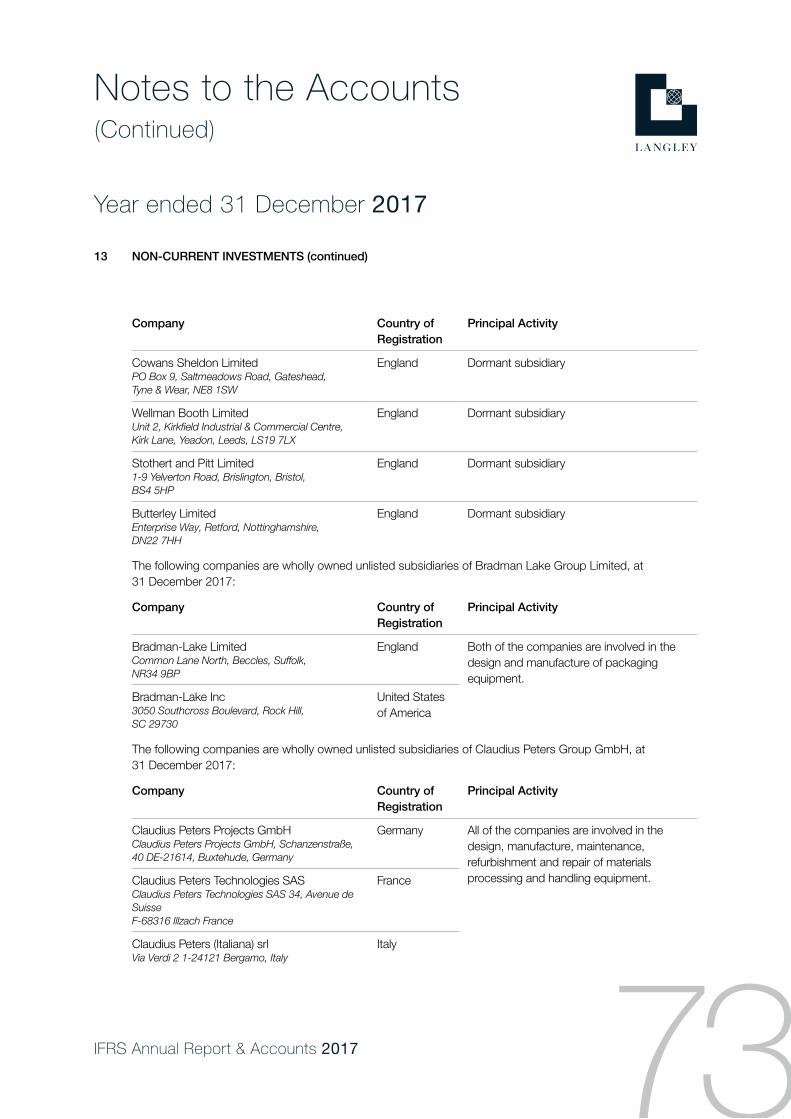
73IFRS Annual Report & Accounts 2017
Year ended 31 December 2017
Notes to the Accounts(Continued)
13 NON-CURRENT INVESTMENTS (continued)
Company Country ofRegistration
Principal Activity
Cowans Sheldon LimitedPO Box 9, Saltmeadows Road, Gateshead, Tyne & Wear, NE8 1SW
England Dormant subsidiary
Wellman Booth LimitedUnit 2, Kirkfield Industrial & Commercial Centre, Kirk Lane, Yeadon, Leeds, LS19 7LX
England Dormant subsidiary
Stothert and Pitt Limited1-9 Yelverton Road, Brislington, Bristol, BS4 5HP
England Dormant subsidiary
Butterley LimitedEnterprise Way, Retford, Nottinghamshire, DN22 7HH
England Dormant subsidiary
Company Country ofRegistration
Principal Activity
Claudius Peters Projects GmbHClaudius Peters Projects GmbH, Schanzenstraße, 40 DE-21614, Buxtehude, Germany
Germany All of the companies are involved in the design, manufacture, maintenance, refurbishment and repair of materials processing and handling equipment.Claudius Peters Technologies SAS
Claudius Peters Technologies SAS 34, Avenue de SuisseF-68316 Illzach France
France
Claudius Peters (Italiana) srlVia Verdi 2 1-24121 Bergamo, Italy
Italy
The following companies are wholly owned unlisted subsidiaries of Bradman Lake Group Limited, at 31 December 2017:
The following companies are wholly owned unlisted subsidiaries of Claudius Peters Group GmbH, at 31 December 2017:
Company Country ofRegistration
Principal Activity
Bradman-Lake LimitedCommon Lane North, Beccles, Suffolk, NR34 9BP
England Both of the companies are involved in the design and manufacture of packaging equipment.
Bradman-Lake Inc3050 Southcross Boulevard, Rock Hill, SC 29730
United States of America

74 IFRS Annual Report & Accounts 2017
Year ended 31 December 2017
Notes to the Accounts(Continued)
13 NON-CURRENT INVESTMENTS (continued)
Company Country ofRegistration
Principal Activity
Claudius Peters (Iberica) SAPaseo de la Habana 202 bis, 28036, Madrid, Spain
Spain
Claudius Peters (China) LimitedUnit 1705-1706, 17/F Laws Commercial Plaza, 788 Cheung Sha Wan Road, Lai Chi Kok, Kowloon, Hong Kong SAR
Hong Kong
Claudius Peters (UK) LimitedUnit 10, Thatcham Business Village, Colthrop Way, Thatcham Berkshire, RG19 4LW
England
Claudius Peters (Americas) Inc445 W. President George Bush Hwy Richardson, TX 75080
United States of America
Claudius Peters do Brasil LtdaRua das Figueiras, 474 - 3 º andar - Bairro Jardim 09080-300 - Santo André / SP Brazil
Brazil
Claudius Peters Romania srlStr. Oituz Nr. 25C, et 2 550337, Sibiu, Romania
Romania
Claudius Peters (Beijing) Machinery Services Limited7/G Hong Kong Macau Centre, No 2 Chaoyangmen Bei Da Jie, Beijing 100027, China
China
Claudius Peters India Pvt. LimitedUnit 408, 4th. Floor, Peninsula Plaza A/16 Fun Republic Lane Off Link Road, Andheri West Mumbai 400 053 India
India
Claudius Peters (Asia Pacific) Pte Ltd25 International Business Park, #01-65/66 German Centre, Singapore, 609916
Singapore
Claudius Peters Automation srlStr. Oituz Nr. 25C, et 2 550337, Sibiu, Romania
Romania

75IFRS Annual Report & Accounts 2017
Year ended 31 December 2017
Notes to the Accounts(Continued)
13 NON-CURRENT INVESTMENTS (continued)
The following company is a wholly owned unlisted subsidiary of Piller Holding GmbH, at 31 December 2017:
Company Country ofRegistration
Principal Activity
Piller Group GmbHAbgunst 24 37520, Osterode, Germany
Germany See below
Company Country ofRegistration
Principal Activity
Piller Australia Pty Limited2/3 Salisbury Road, Castle Hill, NSW, 2154, Sydney, Australia
Australia All of the companies are involved in producing electrical machinery, specialising in high capacity uninterruptible power supply (UPS) systems. The Group is also involved in the production of converters for aircraft ground power and naval military applications.
Piller France SAS1 Avenue du Président Pompidou, CS 70073 - BAT A F-92508 Rueil-Malmaison cedex, France
France
Piller USA Inc45 Wes Warren Drive, Middletown, New York 10941-2047, USA
United States of America
Piller UK LimitedWestgate, Phoenix Way, Cirencester, Gloucestershire, GL7 1RY
England
Piller Italia SrlCentro Direzionale Colleoni, Palazzo Pegaso, 3 Viale Colleoni, 25 20864, Agrate Brianza (MB) Italy
Italy
Piller Iberica SLU, Paseo de la Habana, 202 Bis Bj E-28036 Madrid, Spain
Spain
Piller Power Singapore Pte. Limited25 International Business Park, #01-65/66 German Centre, Singapore, 609916
Singapore
Piller Germany GmbH & Co KGAbgunst 24, 37520, Osterode, Germany
Germany
Piller Management GmbHAbgunst 24, 37520, Osterode, Germany
Germany
The following companies are wholly owned unlisted subsidiaries of Piller Group GmbH and its subsidiaries at 31 December 2017:

76 IFRS Annual Report & Accounts 2017
Year ended 31 December 2017
Notes to the Accounts(Continued)
13 NON-CURRENT INVESTMENTS (continued)
Company Country ofRegistration
Principal Activity
Endurance Power Protection Pvt LtdB-4, 2nd Floor, Plot No. 422, Nav Bhavana Premises, Co-op Society Ltd, S V Savarkar Marg, Prabhadevi Mumbai, Maharashtra, India, 400025
India
Active Power BeijingRm 506-7, Tower A, COFCO Plaza, 8 Jianguomen Nei Ave, Beijing, China
China
Active Power HongKong (Holding)A95, Unit A, s/F, Hung To Centre, 94-96 How Ming Street, Kwun Tong, Kowloon, Hong Kong
Hong Kong
Active Power Swiss (Holding)Schöneich 1,6265 Roggliswil, Swiss
Switzerland
Active Power GermanyAn der Leege 22, 37520 Osterode am Harz, Osterode, Germany
Germany
Active Power UK Ltd.Unit 1.2, Lauriston Business Park, Pitchill, Evesham, Worcestershire, WR11 8SN
England
Company Country ofRegistration
Percentage Ownership
Principal Activity
Manroland Sheetfed GmbHMuehlheimer Strasse 341, 63075 Offenbach am, Main, Germany
Germany 100% Note 1
Manroland Sheetfed Deutschland GmbH Muehlheimer Strasse 341, 63075 Offenbach am, Main, Germany
Germany 100% Note 2
Manroland Used Equipment GmbHMuehlheimer Strasse 341, 63075 Offenbach am, Main, Germany
Germany 100% Note 2
Manroland Sheetfed (UK) Limited1st Floor, Southerton House, Boundary Business Court, 92-94 Church Road, Mitcham, Surrey, CR4 3TD
England 100% Note 2
Manroland Latina S.A.Mariano Sanchez, Fontecilla No.374, Las Condes, Santiago de Chile, 7550296
Chile 100% Note 2
Manroland Latina S.A. de C.VAv. Rio San Joaquin, No. 6107, Col. Popo, Del. Miguel Hidalgo, C.P.11480, Mexico City
Mexico 99.9% Note 2
The following companies are investments held by Sheetfed Holdings Limited and its subsidiaries, at 31 December 2017:
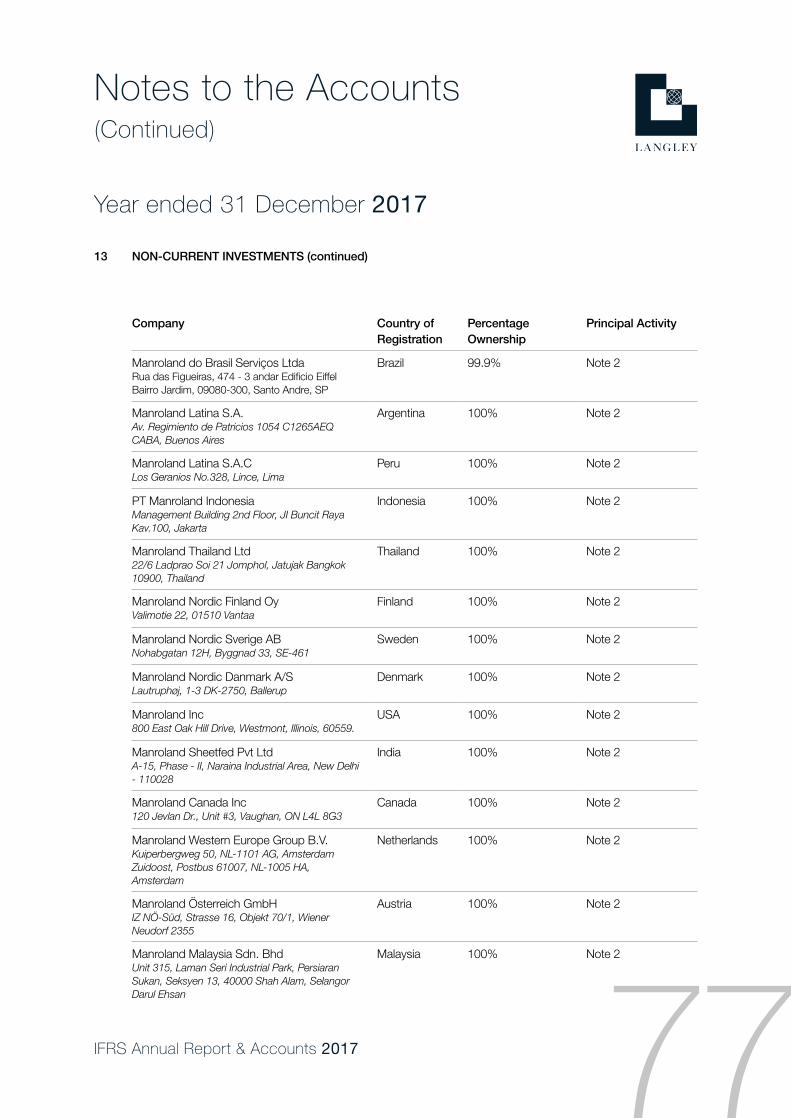
77IFRS Annual Report & Accounts 2017
Year ended 31 December 2017
Notes to the Accounts(Continued)
13 NON-CURRENT INVESTMENTS (continued)
Company Country ofRegistration
Percentage Ownership
Principal Activity
Manroland do Brasil Serviços LtdaRua das Figueiras, 474 - 3 andar Edificio Eiffel Bairro Jardim, 09080-300, Santo Andre, SP
Brazil 99.9% Note 2
Manroland Latina S.A.Av. Regimiento de Patricios 1054 C1265AEQ CABA, Buenos Aires
Argentina 100% Note 2
Manroland Latina S.A.CLos Geranios No.328, Lince, Lima
Peru 100% Note 2
PT Manroland IndonesiaManagement Building 2nd Floor, JI Buncit Raya Kav.100, Jakarta
Indonesia 100% Note 2
Manroland Thailand Ltd22/6 Ladprao Soi 21 Jomphol, Jatujak Bangkok 10900, Thailand
Thailand 100% Note 2
Manroland Nordic Finland OyValimotie 22, 01510 Vantaa
Finland 100% Note 2
Manroland Nordic Sverige ABNohabgatan 12H, Byggnad 33, SE-461
Sweden 100% Note 2
Manroland Nordic Danmark A/SLautruphøj, 1-3 DK-2750, Ballerup
Denmark 100% Note 2
Manroland Inc800 East Oak Hill Drive, Westmont, Illinois, 60559.
USA 100% Note 2
Manroland Sheetfed Pvt LtdA-15, Phase - II, Naraina Industrial Area, New Delhi - 110028
India 100% Note 2
Manroland Canada Inc120 Jevlan Dr., Unit #3, Vaughan, ON L4L 8G3
Canada 100% Note 2
Manroland Western Europe Group B.V.Kuiperbergweg 50, NL-1101 AG, Amsterdam Zuidoost, Postbus 61007, NL-1005 HA, Amsterdam
Netherlands 100% Note 2
Manroland Österreich GmbHIZ NÖ-Süd, Strasse 16, Objekt 70/1, Wiener Neudorf 2355
Austria 100% Note 2
Manroland Malaysia Sdn. BhdUnit 315, Laman Seri Industrial Park, Persiaran Sukan, Seksyen 13, 40000 Shah Alam, Selangor Darul Ehsan
Malaysia 100% Note 2

78 IFRS Annual Report & Accounts 2017
Year ended 31 December 2017
Notes to the Accounts(Continued)
13 NON-CURRENT INVESTMENTS (continued)
Company Country ofRegistration
Percentage Ownership
Principal Activity
Manroland Japan Co. Ltd2-3-4, Niizo-Minami, Toda-shi, Saitama 335-0026
Japan 100% Note 2
Manroland (Korea) Ltd2F,Gaya Building,570-1 Yeonnam-dong Mapo-Gu,Seoul 121-869
Korea 100% Note 2
Manroland (Taiwan) Ltd17F-9, No. 738, Chung Cheng Road Chung-Ho District, New Taipei City 23511, Taiwan
Taiwan 100% Note 2
Manroland (China) Limited7/F, Capella HTR, Kwun Tong, Kowloon, Hong Kong
China 100% Note 2
Guangzhou Printcom Printing Supplies Co. Ltd1/F, 11# Building, Standard Industrial Garden, Taishi Industrial Park, Dongchung Town, Panyu District, 511475, Guangzhou, P.R. China
China 100% Note 2
Manroland Printing Equipment (Shanghai) Co. LtdRoom 901, Bld A, HongKou Plaza, No. 388, West Jiang Wan Rd Hong Kou District, Shanghai, P.R. China
China 100% Note 2
Manroland Printing Equipment (Shenzhen) LtdRoom 101-106, Block C, Huahan Chuangxin Park, LangShan Road, Nanshan District, Shenzhen, P.R. China
China 100% Note 2
Manroland Adriatic d.o.o.Kovinska 4A, 10000 Zagreb
Croatia 100% Note 2
Manroland ROMANIA S.R.LStr. Ziduri Intre Vii 19, Corp C, Parter, Spatiu C-5, Sector 2, Bucuresti, 023321
Romania 100% Note 2
Manroland Bulgaria EOOD1766, Sofia, 251 Okolovrasten pat Street Delta center, floor 2, office 203
Bulgaria 100% Note 2
Manroland Magyaroszag Kft.Táblás u., 36-38, 1097, Budapest
Hungary 100% Note 2
Manroland Polska Sp. z.o.oWolica Aleja, Katowicka, 11 PL-05 830, Nadarzyn
Poland 100% Note 2

79IFRS Annual Report & Accounts 2017
Year ended 31 December 2017
Notes to the Accounts(Continued)
13 NON-CURRENT INVESTMENTS (continued)
Company Country ofRegistration
Percentage Ownership
Principal Activity
Manroland Czech s.r.oPrumyslova 10/1428, Praha 10, 102 00
Czech Republic
100% Note 2
Manroland France S.A.SBat. M1 Les Aralias, Paris Nord, II 66 rue des Vanesses CS 53290, Villepinte 95958, Roissy, CDG Cedex
France 100% Note 2
Manroland Swiss A.G.Schöneich 1, 6265 Roggliswil
Switzerland 100% Note 2
Manroland Ireland LtdUnit N2, North Ring Business Park, Santry, Dublin 9
Ireland 100% Note 2
Manroland Iberica Sistemas S.LCentro de Negocios Eisenhower Avda. Sur Aeropuerto de Barajas, 24 - Edif. 5 - 5º C, 28042, Madrid
Spain 100% Note 2
Manroland Iberica Sistemas S.ARua de Pé de Mouro, Polígono Empresarial Pé de Mouro, 19 2710-335 Sintra
Portugal 100% Note 2
Manroland Italia S.R.L.Via Lambretta 2, 20090, Segrate (MI)
Italy 100% Note 2
Manroland Benelux N.V.Koningin Astridlaan, 61 1780, Wemmel
Belgium 100% Note 2
Manroland Nordic Norge A/SPostboks 473, N-1473, Lørenskog
Norway 100% Note 2
Manroland Southern Africa (PTY) Ltd15 Manhattan Street Airport, Industria Cape Town, 7490
South Africa 100% Note 2
Manroland IP GmbHMuehlheimer Strasse 341, 63075 Offenbach am, Main, Germany
Germany 50% Note 4
Manroland Sheetfed (Thailand) Co. Ltd22/6 Ladprao Soi 21, Jomphol, Jatujak Bangkok 10900 Thailand
Thailand 100% Note 2
Wood International Inc333 Cedar Avenue, Middlesex NJ 08846, USA
USA 100% Dormant

80 IFRS Annual Report & Accounts 2017
Year ended 31 December 2017
Notes to the Accounts(Continued)
13 NON-CURRENT INVESTMENTS (continued)
Company Country ofRegistration
Percentage Ownership
Principal Activity
DC Druck Chemie GmbHWiesenstraße 10, D-72119, Ammerbuch-Altingen
Germany 100% Note 5
DC Green France SAS(Ouest) Route du Prouau, F-44980, Ste Luce Sur Loire
France 100% Note 5
DC Iberica SL SpainC/ Tresols 11 bajos, Apartdo de correos, 109 E-08850 Gava (Barcelona)
Spain 100% Note 5
DC Druck Chemie Polska Sp.z.o.o.Spichrzowa 16, 62-200, Gniezno
Poland 100% Note 5
DC Druck Chemie s.r.oK AMP 1294, 664 34, Kuřim
Czech Republic
100% Note 5
DC Druck Chemie SAS(Est) Route de Bretten, F-68780, Soppe le Bas
France 100% Note 5
DC Druck Chemie UK Limited10th Floor, 133 Finnieston Street, Glasgow,G3 8HB
Scotland 100% Note 5
DC Druck Chemie Italia S.R.LVia Tirso, 12 20098, San Giuliano, Milanese (MI)
Italy 100% Note 5
DC Druck Chemie Benelux BVGerstdijk 7, NL-5704 RG, Helmond
Benelux 100% Note 5
DC Druck Chemie Brazil LTDARua Rosa Belmir Ramos 151, 13.275-400, Valinhos / Sao Paulo
Brazil 100% Note 5
DC Druck Chemie AGSchöneich CH-6265, Roggliswil
Switzerland 100% Note 5
Note 1: The design, manufacture and sale of sheetfed offset litho printing presses and aftermarket services
Note 2: The sale of sheetfed offset litho printing presses and aftermarket services
Note 3: Property rental
Note 4: Intellectual Property
Note 5: The development, manufacture and supply of chemical and technical products and accessories for the printing industry, as well as providing waste processing and recycling services
The following subsidiaries have taken exemption from audit under s479a of Companies Act 2006:
Reader Cement Products Limited (03025049)Oakdale Homes Limited (02922110)Oakdale Properties Limited (07525468)

81IFRS Annual Report & Accounts 2017
Year ended 31 December 2017
14 NON-CURRENT TRADE AND OTHER RECEIVABLES Group 2017 2016 €'000 €'000Other receivables 3,057 2,306Pension scheme prepayment 667 735
3,724 3,041
15 INVENTORIES Group Company 2017 2016 2017 2016 €'000 €'000 €'000 €'000Raw materials 77,154 71,488 - -Work in progress 57,482 59,652 - -Finished goods 29,084 29,833 9 4
163,720 160,973 9 4
16 CONSTRUCTION WORK IN PROGRESSContracts in progress at the year end: Group 2017 2016 €'000 €'000Amounts due from contract customers included in trade and other receivables (note 17) 18,280 20,301
Amounts due to contract customers included in trade and otherpayables (note 20) (6,543) (4,808)
11,737 15,493
Contract costs incurred plus recognised profit less recognisedlosses to date 156,511 150,147
Less: Progress billings (144,774) (134,654)
11,737 15,493
Notes to the Accounts(Continued)

82 IFRS Annual Report & Accounts 2017
Year ended 31 December 2017
17 CURRENT TRADE AND OTHER RECEIVABLES Group Company 2017 2016 2017 2016 €'000 €'000 €'000 €'000Trade receivables 132,985 133,355 211 181Retentions 2,332 3,241 - -Amounts recoverable on construction contracts 18,280 20,301 - -Amounts owed by Group undertakings - - 126,891 142,797Directors' current accounts (note 31) - 665 - 665Other receivables 5,541 6,556 441 136VAT recoverable 5,034 4,107 572 480Prepayments 13,789 13,895 1,267 1,421
177,961 182,120 129,382 145,680
For terms and conditions relating to related party receivables, refer to note 31.Trade and other receivables are disclosed net of provisions for bad and doubtful debts, an analysis of which is as follows: Group 2017 2016 €'000 €'000 Balance at beginning of the year 18,450 18,538 Exchange differences (11) (23)Charge for the year 229 1,356 Unused amounts reversed (2,264) (1,421)
Balance at end of the year 16,404 18,450
Trade receivables are non-interest bearing and are generally on 30 - 90 day terms.At 31 December, the analysis of trade receivables that were past due but not impaired is as follows:
Past due but not impaired
<30 days 31-60 days 61-90 days 91-120 days >121 days €'000 €'000 €'000 €'000 €'000
Group2017 29,285 6,559 2,512 1,233 1,3262016 30,003 5,661 3,429 1,566 2,819
Company2017 4 - - - 2032016 4 - 4 173 -
Notes to the Accounts(Continued)

83IFRS Annual Report & Accounts 2017
Year ended 31 December 2017
18 CASH AND CASH EQUIVALENTS Group Company 2017 2016 2017 2016 €'000 €'000 €'000 €'000Cash in hand, at bank and short term deposits 323,036 296,923 177,381 117,139
19 CURRENT INCOME TAX RECOVERABLE Group Company 2017 2016 2017 2016 €'000 €'000 €'000 €'000Income tax 7,437 4,827 1,539 60
20 CURRENT TRADE AND OTHER PAYABLES Group Company 2017 2016 2017 2016 €'000 €'000 €'000 €'000Trade payables 39,635 39,276 675 747Other payables 9,459 12,056 72 75Other taxes and social security 7,809 7,029 50 142Accruals and deferred income 62,540 68,682 611 471VAT payable 7,299 7,182 - -Amounts owed to Group undertakings - - 1,711 1,820Payments on account 46,710 65,688 - -Amounts due on construction contracts 6,543 4,808 - -Directors' loan account 836 - 836 -
180,831 204,721 3,955 3,255
21 PROVISIONS
GROUP Warranty Other Total Provision Provision €'000 €'000 €'000Balance at 1 January 2017 19,442 10,152 29,594Additional provision recognised 13,724 1,273 14,997Provision utilised during the year (9,410) (5,803) (15,213)Provision released during year (7,264) (1,772) (9,036)Foreign exchange difference (521) (623) (1,144)
Balance at 31 December 2017 15,971 3,227 19,198
Current 14,412 3,153 17,565Non-current 1,559 74 1,633
Notes to the Accounts(Continued)

84 IFRS Annual Report & Accounts 2017
Year ended 31 December 2017
21 PROVISIONS (continued)
GROUP (continued) Warranty Other Total Provision Provision €'000 €'000 €'000Balance at 1 January 2016 19,314 5,652 24,966Additional provision recognised 11,194 6,843 18,037Provision utilised during the year 939 - 939Provision released during year (6,794) (1,852) (8,646) Foreign exchange difference (5,163) (493) (5,656) (48) 2 (46)
Balance at 31 December 2016 19,442 10,152 29,594
Current 17,100 10,068 27,168Non-current 2,342 84 2,426
The warranty provision is arrived at using estimates from historical warranty data. The other provision includes specific claims, redundancy and restructuring provisions. There were no provisions in the Company.
22 CURRENT INCOME TAX LIABILITIES Group Company 2017 2016 2017 2016 €'000 €'000 €'000 €'000Income tax 7,892 10,375 - 1,599
23 CURRENT PORTION OF LONG TERM BORROWINGS Group 2017 2017 €'000 €'000Loans 54 86
Notes to the Accounts(Continued)

85IFRS Annual Report & Accounts 2017
Year ended 31 December 2017
24 LONG TERM BORROWINGS Group 2017 2016 €'000 €'000Loans 93 177Due within one year (included in current liabilities) (54) (86)
39 91
Amounts payable:Between one and two years 39 49Between two and five years - 42
39 91
The fair value of the loans are approximately equivalent to the book value disclosed above. Interest was charged at 7% (2016 - 7%) on those loans during the year.
25 NON-CURRENT TRADE AND OTHER PAYABLES Group 2017 2016 €'000 €'000Trade payables 264 263Accruals and deferred income 17,086 12,951
17,350 13,214
Notes to the Accounts(Continued)
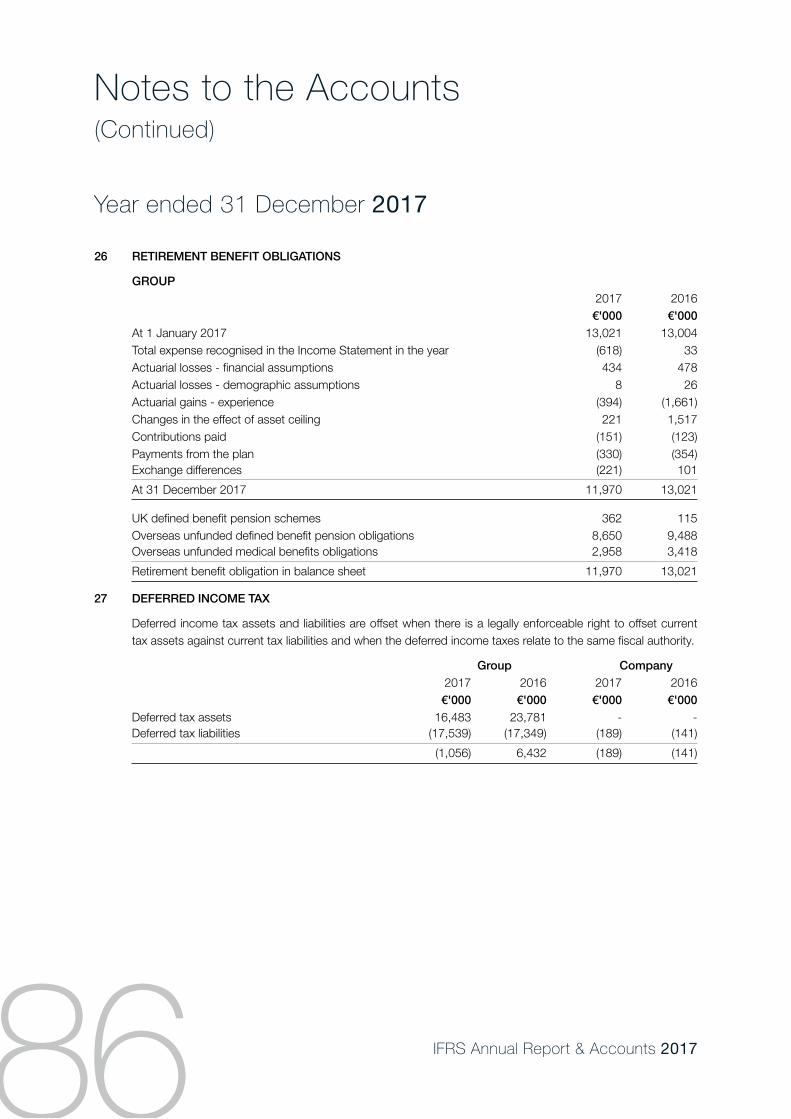
86 IFRS Annual Report & Accounts 2017
Year ended 31 December 2017
26 RETIREMENT BENEFIT OBLIGATIONS
GROUP 2017 2016 €'000 €'000At 1 January 2017 13,021 13,004Total expense recognised in the Income Statement in the year (618) 33Actuarial losses - financial assumptions 434 478Actuarial losses - demographic assumptions 8 26Actuarial gains - experience (394) (1,661) Changes in the effect of asset ceiling 221 1,517Contributions paid (151) (123) Payments from the plan (330) (354) Exchange differences (221) 101
At 31 December 2017 11,970 13,021
UK defined benefit pension schemes 362 115Overseas unfunded defined benefit pension obligations 8,650 9,488Overseas unfunded medical benefits obligations 2,958 3,418
Retirement benefit obligation in balance sheet 11,970 13,021
27 DEFERRED INCOME TAX
Deferred income tax assets and liabilities are offset when there is a legally enforceable right to offset current tax assets against current tax liabilities and when the deferred income taxes relate to the same fiscal authority.
Group Company 2017 2016 2017 2016 €'000 €'000 €'000 €'000Deferred tax assets 16,483 23,781 - -Deferred tax liabilities (17,539) (17,349) (189) (141)
(1,056) 6,432 (189) (141)
Notes to the Accounts(Continued)

87IFRS Annual Report & Accounts 2017
Year ended 31 December 2017
27 DEFERRED INCOME TAX (continued)
The net movement on the deferred income tax account is as follows: Group Company 2017 2016 2017 2016 €'000 €'000 €'000 €'000At 1 January 2017 6,432 4,799 (141) 76Transfer to revaluation reserve 35 35 - -Exchange differences (803) 356 7 (4)Deferred tax on revaluation (535) - - -Income Statement charge (note 10) (6,195) 1,170 (55) (213)Release to equity on actuarial loss 10 72 - -
At 31 December 2017 (1,056) 6,432 (189) (141)
GROUP
The movement in net deferred tax assets and liabilities during the year is as follows:
Other short Accelerated term Retirement Fair Tax tax temporary benefit value depreciation losses differences obligations gains Total €'000 €'000 €'000 €'000 €'000 €'000At 1 January 2016 3,915 (8,003) (9,010) (1,746) 10,045 (4,799)
Charge/(Credit) to income (1,664) (255) 264 224 261 (1,170) Recognised in equityregarding remeasurement - - (72) - (72)of defined benefit scheme Transfer to revaluation - - - (35) (35) reserve Exchange differences 453 (743) (837) (162) 933 (356)
At 31 December 2016 2,704 (9,001) (9,583) (1,756) 11,204 (6,432)
Gross assets (868) (9,001) (12,156) (1,756) - (23,781) Gross liabilities 3,572 - 2,573 - 11,204 17,349
(Credit)/charge to income 883 3,304 2,531 (162) (361) 6,195Recognised in equityregarding remeasurement - - - (10) - (10)of defined benefit scheme Transfer to revaluation 535 - - - (35) 500reserve Exchange differences (327) 1,123 1,186 219 (1,398) 803
At 31 December 2017 3,795 (4,574) (5,866) (1,709) 9,410 1,056
Gross assets (726) (4,574) (9,474) (1,709) - (16,483)Gross liabilities 4,521 - 3,608 - 9,410 17,539
Notes to the Accounts(Continued)

88 IFRS Annual Report & Accounts 2017
Year ended 31 December 2017
27 DEFERRED INCOME TAX (continued)
COMPANY
Accelerated Fair capital value allowances gains Total €'000 €'000 €'000At 1 January 2016 (76) - (76)Charge to income 214 - 214Exchange differences 3 - 3
At 31 December 2016 141 - 141
Charge to income 43 - 43Exchange differences 5 - 5
At 31 December 2017 189 - 189
Unprovided deferred taxation Group Company 2017 2016 2017 2016 €'000 €'000 €'000 €'000Accelerated tax depreciation - 2 - -Tax losses available 31,452 38,989 - -Other short term timing differences 666 434 - -Retirement benefit obligation 219 367 - -
32,337 39,792 - -
Deferred tax has been calculated at the rate expected to apply at the time at which temporary differences are forecast to reverse, based on tax rates which have been substantially enacted at the balance sheet date.
No deferred tax asset has been recognised in respect of the above accelerated tax depreciation, other short term temporary differences, tax losses and retirement benefit obligations because there is uncertainty as to whether the Group will have sufficient relevant taxable profits to utilise these assets in the near future.
28 CONTINGENT LIABILITIES
Contingent liabilities exist at the balance sheet date in respect of: Group Company 2017 2016 2017 2016 €'000 €'000 €'000 €'000UK Group bank guarantees - - 1,780 1,524UK Group value added tax - - 830 906UK Bonds, guarantees and indemnities 6,280 7,792 6,242 7,752Overseas bank guarantees 45,570 71,728 - -Overseas bonds, guarantees and indemnities 26,373 29,459 - -
78,223 108,979 8,852 10,182
Notes to the Accounts(Continued)

89IFRS Annual Report & Accounts 2017
Year ended 31 December 2017
28 CONTINGENT LIABILITIES (continued)
The Company has guaranteed the bank facilities of UK subsidiaries and is party to a group VAT registration. Throughout the Group, contingent liabilities exist in respect of guarantees, performance bonds and indemnities issued on behalf of Group companies by banks and insurance companies in the ordinary course of business.
In view of net cash position held with the same UK bank within the group, the Directors believe that the likelihood of the guarantees being invoked is unlikely, therefore no provision has been recognised in these Accounts.
29 FINANCIAL INSTRUMENTS
The Group and parent Company's principal financial instruments that arise directly from their operations and are detailed below:
Group Company 2017 2016 2017 2016 €'000 €'000 €'000 €'000Loans and receivables 175,984 180,319 127,543 143,779
Financial liabilities measured at amortised cost 119,370 125,262 3,905 3,113
The main purpose of these financial instruments is to fund the operations of the Group and the parent Company, as well as to manage their working capital, liquidity and surplus funds.
The main risks arising from the Group's financial instruments are foreign currency risk, credit risk and interest rate risk. Liquidity risk is not considered to be a main risk to the Group given the Group's cash and cash equivalents balances being considerably higher than any bank borrowings.
Foreign currency risk
The Group is exposed to foreign currency risk on sales, purchases and borrowings that are denominated in a currency other than the functional currencies of individual Group entities (which are principally sterling, euro and US dollars).
The Group publishes its Consolidated Accounts in euro and as a result, it is subject to foreign currency exchange translation risk in respect of the results and underlying net assets of its operations where the euro is not the functional currency of that operation.
Notes to the Accounts(Continued)

90 IFRS Annual Report & Accounts 2017
Year ended 31 December 2017
29 FINANCIAL INSTRUMENTS (continued)
Financial risk
The following table demonstrates the sensitivity to a reasonably possible change in the sterling to euro and other currencies to euro exchange rate, with all other variables held constant, of the Group's profit before tax due to changes in the fair value of monetary assets and liabilities.
Increase/decrease Increase/decrease Effect on profit in other Effect on profit in sterling rate before tax exchange rates before tax €'000 €'0002017 +20% 1,194 +20% (6,209) -20% (1,790) -20% 8,180
2016 +20% (2,857) +20% (6,041) -20% 4,285 -20% 8,645
Credit risk
The Group trades only with recognised, creditworthy third parties. It is the Group's policy that all customers who wish to trade on credit terms are subject to credit verification procedures. In addition, receivable balances are monitored on an ongoing basis with the result that the Group's exposure to bad debt is not significant.
With respect to credit risk arising from the other financial assets of the Group, comprising of cash and cash equivalents, the Group's exposure to credit risk arises from default of the counterparty with a maximum exposure equal to the carrying amounts of these instruments.
Interest rate risk
The Group's exposure to the risk of changes in market interest rates relates primarily to the Group's money on deposit.
Capital risk management
The Group defines capital as being share capital plus reserves and manages capital to ensure adequate resources are retained for continued growth of the Group. Access to capital includes the retention of cash on deposit and availability of funding through agreed capital facilities. Long term deposits are used to obtain more favourable rates of return only when adequate cash resources are maintained on shorter term deposit for the Group's working capital requirements.
Notes to the Accounts(Continued)

91IFRS Annual Report & Accounts 2017
Year ended 31 December 2017
30 FAIR VALUE MEASUREMENTS
As at 31 December 2017 there were no significant differences between book values and fair values of financial assets and liabilities.
The following table categorises the Group's assets and liabilities held at fair value by the lowest level of the significant inputs used in determining their fair value:
1) Quoted prices (unadjusted) in active markets for identical assets or liabilities (level 1)2) Inputs other than quoted prices included within level 1 that are observable either directly (that is, as prices)
or indirectly (that is, derived from prices) (level 2)3) Inputs for the asset or liability that are not based on observable market data (that is, unobservable inputs)
(level 3)
The level in the fair value hierarchy within which the fair value measurement is categorised in its entirety is determined on the basis of the lowest level input that is significant to the fair value measurement in its entirety. For this purpose, the significance of an input is assessed against the fair value measurement in its entirety. If a fair value measurement uses observable inputs that require significant adjustment based on unobservable inputs, that measurement is a level 3 measurement.
Group Level 1 Level 2 Level 3 Total 2017 2017 2017 2017Recurring fair value measurements €'000 €'000 €'000 €'000Freehold property - 119,850 - 119,850
- 119,850 - 119,850
Company Level 1 Level 2 Level 3 Total 2017 2017 2017 2017Recurring fair value measurements €'000 €'000 €'000 €'000Freehold property - 21,566 - 21,566
- 21,566 - 21,566
Group Level 1 Level 2 Level 3 Total 2016 2016 2016 2016Recurring fair value measurements €'000 €'000 €'000 €'000Freehold property - 111,106 - 111,106
- 111,106 - 111,106
Company Level 1 Level 2 Level 3 Total 2016 2016 2016 2016Recurring fair value measurements €'000 €'000 €'000 €'000Freehold property - 21,709 - 21,709
- 21,709 - 21,709
Notes to the Accounts(Continued)

92 IFRS Annual Report & Accounts 2017
Year ended 31 December 2017
Notes to the Accounts(Continued)
30 FAIR VALUE MEASUREMENTS (continued)
For valuations based on a valuation technique the following information is provided about the technique used and significant inputs:
Group Fair value at 31 Dec
2017€'000
Valuation technique
Significant input
Property, plant and equipment- Freehold property
119,850 Market comparable
approach
Market priceper square
metre for comparable
properties
Company Fair value at 31 Dec
2017€'000
Valuation technique
Significant input
Property, plant and equipment- Freehold property
21,566 Market comparable
approach
Market priceper square
metre for comparable
properties
Group Fair value at 31 Dec
2016€'000
Valuation technique
Significant input
Property, plant and equipment -Freehold property
111,106 Market comparable
approach
Market priceper square
metre for comparable
properties
Company Fair value at 31 Dec
2016€'000
Valuation technique
Significant input
Property, plant and equipment -Freehold property
21,709 Market comparable
approach
Market priceper square
metre for comparable
properties
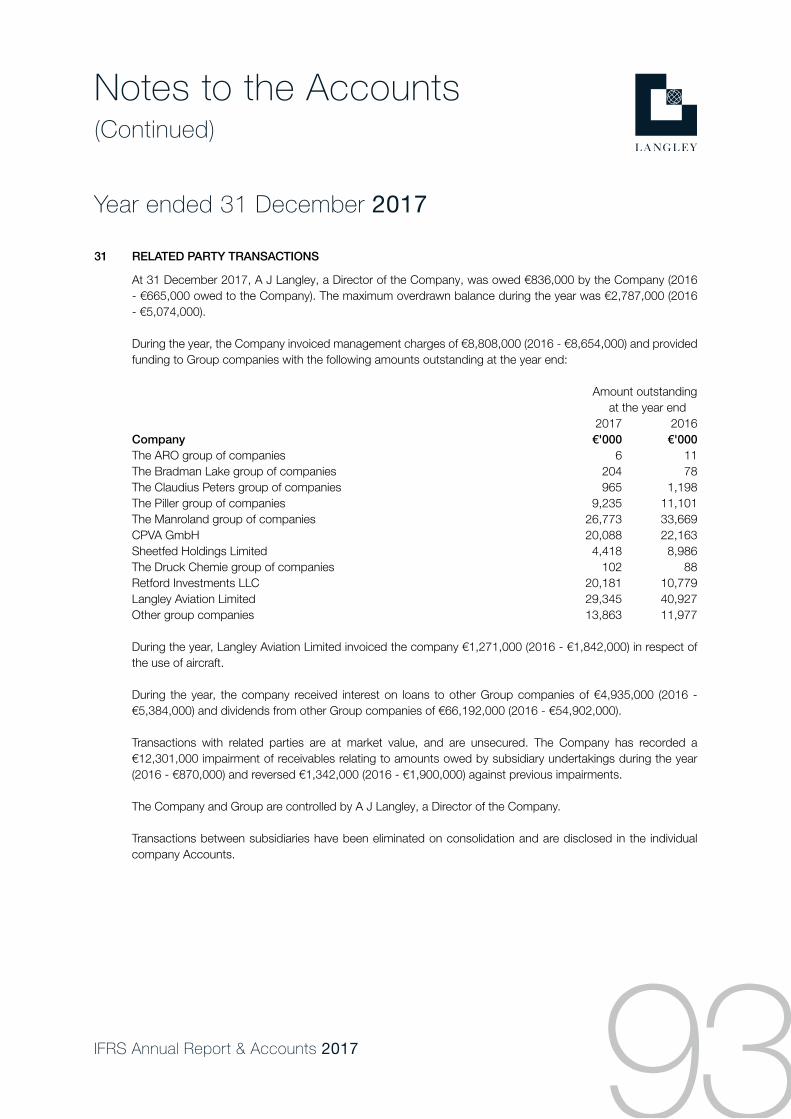
93IFRS Annual Report & Accounts 2017
Year ended 31 December 2017
31 RELATED PARTY TRANSACTIONS
At 31 December 2017, A J Langley, a Director of the Company, was owed €836,000 by the Company (2016 - €665,000 owed to the Company). The maximum overdrawn balance during the year was €2,787,000 (2016 - €5,074,000).
During the year, the Company invoiced management charges of €8,808,000 (2016 - €8,654,000) and provided funding to Group companies with the following amounts outstanding at the year end:
Amount outstanding at the year end 2017 2016Company €'000 €'000The ARO group of companies 6 11The Bradman Lake group of companies 204 78The Claudius Peters group of companies 965 1,198The Piller group of companies 9,235 11,101The Manroland group of companies 26,773 33,669 CPVA GmbH 20,088 22,163Sheetfed Holdings Limited 4,418 8,986The Druck Chemie group of companies 102 88Retford Investments LLC 20,181 10,779Langley Aviation Limited 29,345 40,927Other group companies 13,863 11,977
During the year, Langley Aviation Limited invoiced the company €1,271,000 (2016 - €1,842,000) in respect of the use of aircraft.
During the year, the company received interest on loans to other Group companies of €4,935,000 (2016 - €5,384,000) and dividends from other Group companies of €66,192,000 (2016 - €54,902,000).
Transactions with related parties are at market value, and are unsecured. The Company has recorded a €12,301,000 impairment of receivables relating to amounts owed by subsidiary undertakings during the year (2016 - €870,000) and reversed €1,342,000 (2016 - €1,900,000) against previous impairments.
The Company and Group are controlled by A J Langley, a Director of the Company.
Transactions between subsidiaries have been eliminated on consolidation and are disclosed in the individual company Accounts.
Notes to the Accounts(Continued)

94 IFRS Annual Report & Accounts 2017
Year ended 31 December 2017
32 SHARE CAPITAL 2017 2016Authorised: €'000 €'00060,100,010 ordinary shares of £1 each 71,227 71,227
2017 2016Allotted, issued and fully paid: €'000 €'00060,100,010 ordinary shares of £1 each 71,227 71,227
33 MERGER RESERVE
The merger reserve arose during the year ended 31 December 2013 on the business combination with Sheetfed Holdings Limited. The transaction qualified for merger relief under section 612 of the Companies Act 2006.
34 REVALUATION RESERVE
This reserve is used to reflect changes in the fair value of assets, net of deferred tax, as indicated in note 1(e). It is not available for the payment of dividends.
35 RETAINED EARNINGS
Included within the retained earnings of the Group are foreign currency translation deficits of €20,834,000 (2016 - €5,115,000). Included within the retained earnings reserve for the Company is €26,548,000 (2016 - €15,756,000) of foreign currency translation deficits.
The net currency exchange difference arising on retranslation in the year was a loss of €15,719,000 (2016 - loss of €28,510,000) for the Group and a loss of €10,792,000 (2016 - loss of €40,133,000) for the Company. The foreign currency translation reserve contains the accumulated foreign currency translation differences arising when the Accounts of the Company and Group operations are translated from their own functional currency to the euro, being the presentation currency for the group Accounts.
Notes to the Accounts(Continued)

95IFRS Annual Report & Accounts 2017
Year ended 31 December 2017
36 COMMITMENTS UNDER OPERATING LEASES
At the year end, the Group had outstanding commitments for future minimum lease payments and other costs under non-cancellable operating leases, which fall due as follows:
2017 2016 €'000 €'000Within one year 3,494 5,062In two to five years 5,054 10,530After five years 821 1,758
9,369 17,350
The lease commitments relate primarily to leases of land and buildings. The leases have various terms and renewal rights.
37 CASH GENERATED FROM OPERATIONS
GROUP 2017 2016 €'000 €'000
Profit before taxation 111,808 122,730 Depreciation 14,173 13,369 Profit on sale of property, plant and equipment (154) (95)Amortisation of intangibles 736 527 Interest income (1,582) (1,502)Impairment of fixed assets 1,513 146 Interest expense 48 244 (Increase)/decrease in inventories (2,747) 7,485 Decrease/(increase) in trade and other receivables 3,475 (10,963)(Decrease)/increase in trade and other payables (30,149) 1,817 Movement in retirement benefit obligations (878) (446)Foreign exchange translation adjustments (316) 1,118
Cash generated from operations 95,927 134,430
COMPANY 2017 2016 €'000 €'000
Profit before taxation 54,236 71,993 Depreciation 1,787 1,397 Profit on sale of property, plant and equipment (139) (27)Dividend income received (66,192) (54,902)Interest income (5,680) (5,921)Increase in inventories (5) (4)Decrease in trade and other receivables 14,650 7,009 Decrease in trade and other payables (875) (44)Foreign exchange translation adjustments 3,218 (7,506)
Cash generated from operations 1,000 11,995
Notes to the Accounts(Continued)

Printed on a Manroland ROLAND 700 EVOLUTION press with InLine foiler at Manroland HQ, Offenbach, Germany.


langleyholdings.com
Annual R
eport & A
ccounts 2017Langley H
oldings plc


![Sheetfed News Drupa Issue May 2012[1]](https://static.fdocuments.in/doc/165x107/543a952eafaf9fc96f8b46dc/sheetfed-news-drupa-issue-may-20121.jpg)


