Landscapes' Capacities to Provide Ecosystem Services – a Concept
22
© 2009 IALE-D. All rights reserved. www.landscapeonline.de ISSN 1865-1542 Page 1 Received: 22.05.2009 Received in revision: 28.09.2009 Accepted: 01.10.2009 Published:01.12.2009 Landscapes‘ Capacities to Provide Ecosystem Services – a Concept for Land-Cover Based Assessments Benjamin Burkhard 1 * , Franziska Kroll, Felix Müller & Wilhelm Windhorst University of Kiel, Ecology Centre, Olshausenstr. 40; 24098 Kiel; [email protected] 1 * Corresponding author Abstract Landscapes differ in their capacities to provide ecosystem goods and services, which are the benefits humans obtain from nature. Structures and functions of ecosystems needed to sustain the provision of ecosystem services are alte- red by various human activities. In this paper, a concept for the assessment of multiple ecosystem services is propo- sed as a basis for discussion and further development of a respective evaluation instrument. Using quantitative and qualitative assessment data in combination with land cover and land use information originated from remote sensing and GIS, impacts of human activities can be evaluated. The results reveal typical patterns of different ecosystems‘ capacities to provide ecosystem services. The proposed approach thus delivers useful integrative information for environmental management and landscape planning, aiming at a sustainable use of services provided by nature. The research concept and methodological framework presented here for discussion have initially been applied in different case studies and shall be developed further to provide a useful tool for the quantification and spatial modelling of multiple ecosystem services in different landscapes. An exemplary application of the approach dealing with food provision in the Halle-Leipzig region in Germany is presented. It shows typical patterns of ecosystem service distri- bution around urban areas. As the approach is new and still rather general, there is great potential for improvement, especially with regard to a data-based quantification of the numerous hypotheses, which were formulated as base for the assessment. Moreover, the integration of more detailed landscape information on different scales will be needed in future in order to take the heterogeneous distribution of landscape properties and values into account. Therefore, the purpose of this paper is to foster critical discussions on the methodological development presented here. Keywords: ecosystem integrity, ecosystem services, land use, Corine land cover, indicators B. Burkhard, F. Kroll, F. Müller & W. Windhorst Landscapes‘ Capacities to Provide Ecosystem Services - a Concept for Land-Cover Based Assessments Landscape Online 15, 1-22. DOI:10.3097/LO.200915
Transcript of Landscapes' Capacities to Provide Ecosystem Services – a Concept

© 2009 IALE-D. All rights reserved. www.landscapeonline.de ISSN 1865-1542 Page 1
Received: 22.05.2009 Received in revision: 28.09.2009 Accepted: 01.10.2009 Published:01.12.2009
Landscapes‘ Capacities to Provide Ecosystem Services – a Concept for Land-Cover Based
AssessmentsBenjamin Burkhard1* , Franziska Kroll, Felix Müller & Wilhelm Windhorst
University of Kiel, Ecology Centre, Olshausenstr. 40; 24098 Kiel; [email protected]
* Corresponding author
Abstract
Landscapes differ in their capacities to provide ecosystem goods and services, which are the benefits humans obtain from nature. Structures and functions of ecosystems needed to sustain the provision of ecosystem services are alte-red by various human activities. In this paper, a concept for the assessment of multiple ecosystem services is propo-sed as a basis for discussion and further development of a respective evaluation instrument. Using quantitative and qualitative assessment data in combination with land cover and land use information originated from remote sensing and GIS, impacts of human activities can be evaluated. The results reveal typical patterns of different ecosystems‘ capacities to provide ecosystem services. The proposed approach thus delivers useful integrative information for environmental management and landscape planning, aiming at a sustainable use of services provided by nature. The research concept and methodological framework presented here for discussion have initially been applied in different case studies and shall be developed further to provide a useful tool for the quantification and spatial modelling of multiple ecosystem services in different landscapes. An exemplary application of the approach dealing with food provision in the Halle-Leipzig region in Germany is presented. It shows typical patterns of ecosystem service distri-bution around urban areas. As the approach is new and still rather general, there is great potential for improvement, especially with regard to a data-based quantification of the numerous hypotheses, which were formulated as base for the assessment. Moreover, the integration of more detailed landscape information on different scales will be needed in future in order to take the heterogeneous distribution of landscape properties and values into account. Therefore, the purpose of this paper is to foster critical discussions on the methodological development presented here.
Keywords:
ecosystem integrity, ecosystem services, land use, Corine land cover, indicators
B. Burkhard, F. Kroll, F. Müller & W. WindhorstLandscapes‘ Capacities to Provide Ecosystem Services
- a Concept for Land-Cover Based AssessmentsLandscape Online 15, 1-22. DOI:10.3097/LO.200915

Landscape OnlineB. Burkhard et al.
© 2009 IALE-D. All rights reserved. www.landscapeonline.de ISSN 1865-1542 Page 2
Landscapes‘ Capacities to ... 15 / 2009
1 Introduction
The ecosystem services concept is strongly based on the approach of de Groot’s “Functions of Na-
ture” (1992), which has predecessors in landscape eco-logy and planning. For example in the Eastern German landscape literature, landscape functions and landscape potentials have been an important item of research (see Haase & Mannsfeld 2002, Bastian & Steinhardt 2003, Bastian & Schreiber 1999). In the Western German area Marks et al. published their instructions for the evaluation of landscape system performances in 1992. In the global context, the contributions of Costanza et al. (1997) and Daily (1997) have been milestones in ecosystem services research. Nowadays, ecosystem services have become a very popular research theme and a conceptual framework for numerous research projects (e.g. the Millennium Ecosystem Assessment; MA 2003). The attractiveness of the approach most likely originates in its integrative character, which supports inter- and transdisciplinary research, linking environmental and socio-economic concepts (Müller & Burkhard 2007). Moreover, today‘s environmental and economic crises and upcoming problems related to environmental degradation and resource depletion make the necessity of new management tools obvious (Vandewalle et al. 2009, Rees 1998, Dailey et al. 2009). From a systems analytical point of view, the concept provides a systematic listing of the most important ecosystem components and processes and the depen-dence of human societies on them (de Groot 2006). Most studies carried out so far provide very appealing conceptual frameworks and interdisciplinary scientific methods.
However, one main obstacle seems to be the applica-tion of the ecosystem goods and services concept at the landscape level due to the lack of appropriate data for their quantification. Many studies are focussing on global assessments (Naidoo 2008, Costanza et al. 1997), which provide valuable information but are not directly applicable for regional or local decision ma-
king. A review of concepts of dynamic ecosystems and their services in the RUBICODE project showed, that most quantifications of ecosystem services are carri-ed out with economic measures. Assessments in non-monetary terms are very few although standardised approaches to quantify ecosystem services are required (Vandewalle et al. 2009). As a suitable spatial reference RUBICODE explored the concept of Service Provi-ding Units (SPUs) which are „the total collection of organisms and their trait attributes required to deliver a given ecosystem service at the level needed by service beneficiaries. The SPU must be quantified in terms of metrics such as abundance, phenology and distributi-on“ (Vandewalle et al. 2009). This is an interesting ap-proach as it divides (but also reduces) landscapes into service providers which might result in the derivation of new landscape classification units. A comparison of these service providing units with natural units or land cover units thus seems to be interesting.
The mapping of ecosystem services has been listed as one key element that is required in order to improve the recognition and implementation of ecosystem ser-vices into institutions and decision-making by Daily & Matson (2008). In recent years, many new mapping ap-proaches of ecosystem services have been developed by various scientists (e.g. Tallis & Polasky 2009, Nelson et al. 2009, Egoh et al. 2008, Naidoo et al. 2008, Troy & Wilson 2006, Willemen et al. 2008). These approa-ches vary considerably in the scale and scope of the analysis as well as in the assessment method of eco-system goods and services production. Reviewing the-se studies reveals the striking difficulty of combining spatial accuracy with comparability of different case studies. Following the first attempt of Costanza et al. (1997) to estimate and map the value of ecosystem ser-vices in monetary terms at global scale, Turner et al. (2007), Kreuter et al. (2001) and Troy & Wilson (2006) are using the same approach of value transfer in order to quantify and map the monetary value of ecosystem services at global or regional scales. The value or bene-fit transfer method, in which the valuation results of ecosystem services at one study site are transferred to others, has been criticised for neglecting spatial diffe-rences of habitat types (Tallis & Polasky 2009, Nelson et al. 2009). Other mapping attempts quantify a dif-

Landscape OnlineB. Burkhard et al.
© 2009 IALE-D. All rights reserved. www.landscapeonline.de ISSN 1865-1542 Page 3
Landscapes‘ Capacities to ... 15 / 2009
ferent number of ecosystem services in biophysical units, without including monetary valuation. Naidoo et al. (2008) present a method for the global mapping and quantification of four ecosystem services in biophysi-cal units and compare the service production with pri-ority sites for biodiversity conservation. They restrict their analysis of ecosystem services quantification to four services because of the lack of available data at the global scale. Also Egoh et al. (2008) who conduc-ted their study of mapping ecosystem services at the national scale for South Africa, concentrate on the bio-physical quantification and assessment of spatial con-gruence and relationships of only five soil and water related ecosystem services. They identify areas of me-aningful (ranges) and hotspot supply of each analysed ecosystem service and count the number of ranges and hotspots per catchment for the visualisation of the total service supply in their maps. Willemen et al. (2008) map and quantify the capacities of eight land-scape functions to provide ecosystem services for the Gelderse Vallei in the Netherlands. The authors em-phasise the biophysical variation of landscapes which leads to an uneven distribution of goods and servi-ces. Only parts of the landscape functions are direct-ly observable from land cover data. Non-directly ob-servable landscape functions necessitate the inclusion of field observations prior to extrapolating landscape functions from spatial indicators. For those landscape functions, Willemen et al. (2008) apply rules based on literature reviews as has been previously done by Hai-nes-Young et al. (2006) and Gimona & van der Horst (2007). Recently, two ambitious projects emerged to further develop spatial explicit modeling and map-ping of ecosystem services. The first is the MIMES approach (Multiscale Integrated Model of the Earth Systems’ Ecological Services, www.uvm.edu/giee/mi-mes) which builds on the GUMBO model (Boumans et al. 2002) and aims at evaluating the effects of land use changes on ecosystem services on various scales by integrating participatory model building, data coll-ection and valuation. This integrated model system is still under development. The second modeling tool, the Integrated Valuation of Ecosystem Services and Tradeoffs tool (InVEST) that has been developed by the Natural Capital Project (www.naturalcapitalproject.org) has already been described in published studies
(Tallis & Polasky 2009, Nelson et al. 2009). So far, this tool, which aims at linking models of ecological pro-duction functions with economic valuation methods, includes a limited number of ecosystem services as well as terrestrial biodiversity.
Unlike InVEST, our approach aims at developing a more general methodology to evaluate capacities of different landscapes to provide ecosystem services. It does not focus on the economic evaluation of eco-system services or environmental accounting (like e.g. Mäler et al. 2008, Boyd & Banzhaf 2006), whose per-tinence is debated due to its economic terminology, its anthropocentric orientation and the underestimati-on of biological principles (Ludwig 2000, Chee 2004, Rapport & Singh 2006). Nevertheless, economic eva-luations are an essential part of human-environmental systems research. They support awareness raising for the dependence of human societies on nature and help design institutions for the conservation of important natural systems in a sustainable manner (Heal 2000). In this sense, there is no either-or among ecological and economic evaluation methods (Farber et al. 2002). Turner et al. (2003) have shown in their survey of the nature valuation literature that there is a need of stu-dies to encompass a range of interdependent ecological functions, uses and values at different sites. This type of study is of great relevance to environmental mana-gers who have to deal with complex trade-offs between conservation and land use development. Although we do not integrate an economic valuation in our propo-sed method, a classification of the service production capacities allows a comparison between different bio-physical units.
In contrast to the studies presented above, our ap-proach includes the concept of ecological integrity as a prerequisite for providing ecosystem goods and ser-vices to humans and therefore widens the purely anth-ropocentric view of other studies (Müller & Burkhard 2007). As defined by Barkmann et al. (2001), ecolo-gical integrity denotes the „support and preservation of those processes and structures which are essential prerequisites of the ecological ability for self-organi-sation“ of ecosystems. It is mainly based on variables of energy and matter budgets and structural features

Landscape OnlineB. Burkhard et al.
© 2009 IALE-D. All rights reserved. www.landscapeonline.de ISSN 1865-1542 Page 4
Landscapes‘ Capacities to ... 15 / 2009
of whole ecosystems. These components are similar to those referred to as „supporting services“ in other ecosystem services studies (MA 2003). In the assess-ment framework presented here, ecological integri-ty and related indicators (Müller 2005) represent the base for the provision of regulating, provisioning and cultural ecosystem services. The different ecosystem services of these three groups were mainly selected from lists provided by de Groot (2006), MA (2005) and Costanza et al. (1997).
As spatial units, the land cover classes of the Eu-ropean CORINE project (EEA 1994) were used as starting points. Originating from remote sensing data, these land cover units provide a logical combination of land cover and land use - as it can be found in the real landscapes. As CORINE land cover units are qui-te coarse data with regard to their spatial and thematic resolution, a lot of information is aggregated with a high degree of generalization. Hence, several land-scape features, qualities, rarities and configurations cannot be represented. Therefore, CORINE data are used as a starting point and the integration of additio-nal data is planned step by step. This will improve the value and explanatory power of spatial assessments of ecosystem services. The information needed for an appropriate evaluation of ecosystem services and the estimation of their value are difficult or - in many aspects - even impossible to obtain. But, „even im-perfect measures of their [ecosystem services] value, if understood as such, are better than simply ignoring ecosystem services altogether, as is generally done in decision making today“ (Daily 1997: 8).
In this paper, we are therefore proposing the first step of a comprehensive assessment strategy for ecosys-tem services provision at the landscape level. It is a new approach as it offers great potential to combine various data sources and different topics. Outcomes are descriptive tables and maps which illustrate the potentials of particular areas to provide ecosystem services. We are aware that a broad range of central issues like for example questions of scale-dependenci-es and scale–interactions, habitat heterogeneities and temporal aspects are not considered yet. But this was not the aim of this paper. Our approach aims at deve-
loping and discussing a research framework to answer the following questions:
- What potential do the different land cover units have to provide which ecosystem services?
- How can we combine expert judgements with quanti-tative data to assess landscapes‘ capacities to provi-de ecosystem services?
- Is it possible to derive a general assessment metho-dology, applicable and transferable to various areas and scales?
2 Assessment framework
The basic idea of the assessment strategy is the analysis of existing landscape data to evaluate
capacities to provide ecosystem services in a spatial manner. In a first step, which is presented here, easily available land cover data (like CORINE) were linked to expert judgements about the different land cover types’ capacities to provide various ecosystem servi-ces. For future assessments, the successive integration of quantitative data as well as further landscape attri-butes and configurations are planned. With this paper, we want to introduce and demonstrate the potentials of spatial assessments of ecosystem services. At the current state of application, the assessments are based on a high amount of qualitative data and rather lar-ge spatial units. Hence, generalizations of particular habitat features are unavoidable. Nevertheless, we do not assume that every part of a given habitat type is of equal value with regard to its capacity to provide ecosystem services, social values or management prac-tices. This kind of information is planned to be gene-rated during future applications. After that, results are expected to provide statistical and spatial information and illustrations (maps) which are useful for landscape planning and environmental management. Conceptual models and, in particular, spatially explicit informa-tion, like maps, have a high potential to support the understanding of complex systems and interrelations-hips (Dresner 2008).

Landscape OnlineB. Burkhard et al.
© 2009 IALE-D. All rights reserved. www.landscapeonline.de ISSN 1865-1542 Page 5
Landscapes‘ Capacities to ... 15 / 2009
2.1 CORINE land cover classes as reference areas
The aim of the CORINE program of the European Uni-on is to compile information on the state of the environ-ment with regard to certain topics which have priority for all member states of the community (EEA 1994). There-fore, a geographical information system has been created to provide information on the environment which is es-sential when preparing and implementing community po-licies. CORINE includes 44 land cover classes altogether grouped in a three-level nomenclature into 1) artificial surfaces, 2) agricultural areas, 3) forests and seminatural areas, 4) wetlands and 5) water bodies (for descriptions of the land cover classes, see Appendix 2 of this paper). These classes (are supposed to) represent all land cover types in Europe. The classes are clearly defined in the nomenclature provided by the project (EEA 1994). One task during the development and application of our as-sessment framework in theory and in case studies was to find out, whether these predefined land cover classes are suitable and sufficient to represent the ecosystems and land cover types occurring in our case study areas.
The geographical data in the European CORINE data base have been converted to a European geographical re-ference system and contain a minimum mapping unit of 25 ha. The national CORINE data bases are collected by national teams and disseminated on demand by National Reference Centres. The European CORINE data base is the result of the integration of these national databases. Datasets on a 100 metre grid, a 250 metre grid and a 1 km grid are available at marginal cost respectively downloada-ble for free from the EEA website (http://dataservice.eea.europa.eu/). For our studies, CORINE data in ESRI ArcView polygon shape format were used. The vector data have the advantage of being more spatially explicit and it is easy to join the spatial data with ecosystem servi-ces evaluation matrices in the related attribute tables.
2.2 Definition of ecosystem services
Based on the ecosystem services lists provided by de Groot (2006), MA (2005) and Costanza et al. (1997) and the list of ecological integrity components described by Müller & Burkhard (2007) and Müller (2005), a general set of ecosystem services was derived. The individual servi-
ces are grouped in the four categories 1) ecological integri-ty (supporting services), 2) provisioning services, 3) regu-lating services and 4) cultural services. As cultural services are very difficult to grasp and to value (MA 2005), they are reduced to „recreation and aesthetic value“ and „intrinsic value of biodiversity“. The first term was generated be-cause appropriate indicators like visitor numbers are easily available; the second one because, in our point of view, the lack of appreciation of nature and species diversity as such (besides their contribution to human welfare) is a considerable drawback in many of the available concepts of ecosystem services. For definitions of the selected ser-vices and potential indicators for their quantification, see Appendix 1 of this paper. The selection and quantificati-on of appropriate indicators and data for the individual ecosystem services are as crucial as the selection of the services themselves. We have to be aware that the whole analysis is a model of reality trying to reduce the comple-xity of human-environmental systems in an appropriate, logical and reproducible manner. Hence, generalizations and simplifications have to be tolerated in order to receive a holistic picture of complex systems.
2.3 Assessment matrix: land cover vs. ecosystem services
To assess different land cover types’ capacities to provide ecosystem services, a matrix was created. On the y-axis of this matrix, the 44 CORINE land cover types are placed. On the x-axis, the 29 ecosystem services as defined in Ap-pendix 1 are placed. At the intersections (altogether 1276), different land cover types’ capacities to provide the indivi-dual service were assessed on a scale consisting of:
0 = no relevant capacity, 1 = low relevant capacity, 2 = relevant capacity, 3 = medium relevant capacity, 4 = high relevant capacity and 5 = very high relevant capacity.
The assignments in Table 1 are based on first expert eva-luations (conceptual and from different case studies) and can be seen as research hypotheses which are to be tested in further case study applications with data from measu-rements, modeling or additional expert assessments. Table 1 shows concentrations of high capacities to provide a broad range of ecosystem services for the different forest land cover types, peatlands, moors and heathlands. Mo-reover, it reveals rather high capacities of many nature-

Landscape OnlineB. Burkhard et al.
© 2009 IALE-D. All rights reserved. www.landscapeonline.de ISSN 1865-1542 Page 6
Landscapes‘ Capacities to ... 15 / 2009
Table 1: Matrix for the assessment of the different land cover types‘ capacities to provide selected ecosystem goods and ser-vices (for definition of land cover types and ecosystem services see Appendices 1 and 2). The assessment scale reaches from
0 = rosy colour = no relevant capacity of the land cover type to provide this particular ecosystem service, 1 = grey green = low relevant capacity, 2 = light green = relevant capacity, 3 = yellow green = medium relevant capacity, 4 = blue green =
high relevant capacity and 5 = dark green = very high relevant capacity. In the rows between the assessments (yellow colour), sums for the individual ecosystem services groups were calculated.

Landscape OnlineB. Burkhard et al.
© 2009 IALE-D. All rights reserved. www.landscapeonline.de ISSN 1865-1542 Page 7
Landscapes‘ Capacities to ... 15 / 2009
near land cover types to support ecological integrity. The highly human-modified land cover types, like urban fabric, industrial or commercial areas, mineral extraction and dump sites, have very low or no rele-vant capacities to provide ecosystem services. Hence, a pattern emerges which matches well with the results one would assume. The application in case studies will reveal, whether this matrix is applicable in real cases, if the hypotheses can be tested with existing data and if these proxies will lead to modifications. During this „maturing“ process of the matrix, which has already started with first case studies and will continue in fu-ture, the whole approach receives a better foundation. The matrix might on the one hand be seen as the most innovative point of our concept, on the other hand it seems to be the most vulnerable also.
2.4 Applications in case studies
Up to now, a similar assessment framework has been applied in different case studies: i) related to the estab-lishment of the biosphere reserve „Schwäbische Alb“ in southern Germany, ii) in boreal areas in northern Finland with forestry and reindeer husbandry (Burk-hard et al. 2009a , http://joyx.joensuu.fi/~tkumpula/clmirf), iii) in the German North Sea related to the ins-tallation of offshore wind parks (www.coastal-futures.org), iv) to assess the impacts of tourism on the Ger-man island of Sylt (Schmidt 2008) and v) about the rural-urban region Halle-Leipzig/Germany as part of the PLUREL project (www.plurel.net). In the indivi-dual case studies, relevant CORINE land cover classes were selected from the whole set of 44 classes in a first step. This means, only land cover types occurring in the particular study areas were considered (e.g. there are no olive groves in Finland). In a second step, the list of 29 ecosystem services was checked for relevan-ce in the particular study. It becomes obvious that in some cases, the list presented here had to be supple-mented by additional, case study-specific services. For example, the provisioning service “food by reindeer meat” is of such a high relevance for the case study in northern Finland, that it was included as an indi-vidual class in addition to the other groups. For the study in the North Sea, ecological integrity parameters had to be adapted to marine conditions (Burkhard et
al. 2009b). The data behind the assessments in the case studies origin in modeling, statistical data or are based on expert evaluations.
2.5 Further development and future applications of the
concept
In order to attain better access to suitable data in fu-ture, a cooperation with the German chapter of the Long Term Ecological Research (LTER-D) network is planned. Different LTER-D sites were selected to be representative for forest ecosystems, coastal regions, agricultural areas, city regions and mountainous areas. Thus, the main biomes in Germany can be covered and exemplary assessments and calibrations of the assess-ment tools can be carried out in the near future.
Besides a better data appliance, the integration of further landscape components is the main target in fu-ture. There are a) static features like elevation, slope, soils, hydrology, vegetation data (more detailed than in CORINE) and b) dynamic features like climatic and weather conditions, land use technology improvements or changes in land use intensity to be considered. This will lead to a better consideration of spatial and tem-poral heterogeneities of landscape features and values, which are probably not suitably represented in the CO-RINE classes.
3 Exemplary first results
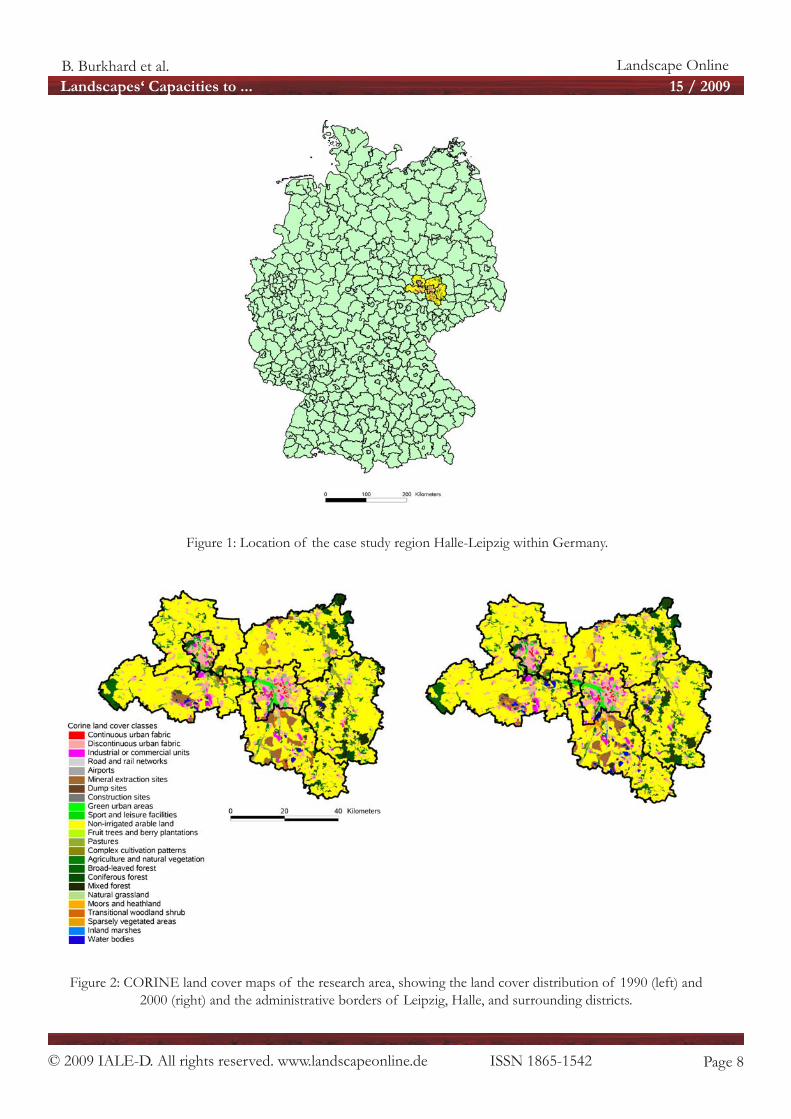
To illustrate the procedure, we present selected re-sults from the PLUREL project‘s case study area
Halle-Leipzig in central eastern Germany (Fig. 1). In this region, the main land use changes during the last decades were related to urban sprawl, including hou-sing and commercial areas and a change in agricultural production patterns following the German reunificati-on. Additionally, the region is characterized by open pit brown coal mining areas often having been converted to lakes after abandonment. Figure 2 shows the CORINE maps of the region illustrating the land cover distribution in the years 1990 and 2000. An expansion of discontinuous
Landscape OnlineB. Burkhard et al.
© 2009 IALE-D. All rights reserved. www.landscapeonline.de ISSN 1865-1542 Page 8
Landscapes‘ Capacities to ... 15 / 2009
Figure 1: Location of the case study region Halle-Leipzig within Germany.
Figure 2: CORINE land cover maps of the research area, showing the land cover distribution of 1990 (left) and 2000 (right) and the administrative borders of Leipzig, Halle, and surrounding districts.

Landscape OnlineB. Burkhard et al.
© 2009 IALE-D. All rights reserved. www.landscapeonline.de ISSN 1865-1542 Page 9
Landscapes‘ Capacities to ... 15 / 2009
urban fabric and industrial or commercial units around the urban areas of Leipzig and Halle is visible during the ten years period illustrated here.
3.1 Quantification of ecosystem services
To give an example of a possible quantification of selected ecosystem services, data on the provisioning ecosystem service „food provision“ were collected for the study area Halle-Leipzig, covering the years 1990 and 2000. Table 2 shows respective data for the provision of crops, fodder, livestock, capture fisheries & aquaculture, wild food and total food (weighted and aggregated) in GJ/ha land cover type per year. For the calculation of a single value per land cover type, statistical data about the crop composition in % have been combined with harvest masses in dt/ha per crop type (fruit, meat, milk, fish) and finally with the asso-ciated energy values in GJ/dt. The results show an increase in agricultural production in all classes except water bodies (Table 2). The production data were classified according to
the same scale as in the ecosystem service provision matrix (Table 1). Hereby, the maximum values were taken as refe-rence values to represent the class „5 = very high relevant capacity“. First, the classification was carried out for each land cover type individually, resulting in a high valuation of fish and wild foods in the land cover types water bodies, respectively forests, in spite of the very low food provision per hectare in comparison to the other land cover types. In order to provide a general view of food provision and to put the food providing land cover types in relation to each other, the results of all food types were subsequent-ly aggregated. Before doing so, a weighting between the food types “crops” and “fodder” was necessary, as they are both provided by the land cover class “non-irrigated arable land”. For the weighting, each of the two food types was included according to its share of cultivated arable land in the respective year. Additionally, the energy in GJ/ha that is provided by fodder was divided by ten because of the lower energy value of meat in comparison to fodder crops necessary to produce that
Table 2: Provisioning ecosystem service „food provision“ in the Halle-Leipzig region divided by types of food and land cover classes and as weighted aggregation of all food providing services (Data sources: Saxon State
Ministry of the Environment and Agriculture 2001, 2003; KTBL 2005).

Landscape OnlineB. Burkhard et al.
© 2009 IALE-D. All rights reserved. www.landscapeonline.de ISSN 1865-1542 Page 10
Landscapes‘ Capacities to ... 15 / 2009
meat. The classification of the aggregated food provision service shows another picture than the individual land co-ver type classifications.
3.2 Spatial distribution of ecosystem services
If we combine the data presented in Table 2 with the spa-tial GIS data by joining the crop production data to the attribute table of the GIS polygon shape file, the spati-al distribution of ecosystem services can be displayed in maps (Fig. 3). The increase in crop production is visible in the darker areas.
To get an impression of the overall capacity for food pro-vision, the individual food types in Table 2 were aggregated to one class „food“ and the same classification scale was applied to the land cover types occurring in the study area. Figure 4 shows the maps of food provision in the Halle-Leipzig region in the year 1990 and 2000. The low food provision capacities of urban and suburban areas, mi-neral extraction and dump sites as well as forest areas become obvious in both years.
Figure 3: Spatial distribution of the ecosystem service “crop provision” in the year 1990 (left) and 2000 (right) for the region of Leipzig, Halle, and surrounding districts.
Figure 4: Spatial distribution of the aggregated ecosystem service “food provision” in the year 1990 (left) and 2000 (right) for the region of Leipzig, Halle, and surrounding districts.

Landscape OnlineB. Burkhard et al.
© 2009 IALE-D. All rights reserved. www.landscapeonline.de ISSN 1865-1542 Page 11
Landscapes‘ Capacities to ... 15 / 2009
4 Discussion
The example of food provision in the Halle-Leip-zig region demonstrates that a combination of the
hypotheses from the expert judgements (Table 1) with statistical data (Table 2) is possible. The methodology offers results showing clear patterns of ecosystem ser-vice distribution. Comparable results were achieved in the other case studies applying a similar methodology. The application of CORINE land cover data from the years 1990 and 2000 has demonstrated changes in the case study region. Typical effects of urban sprawl with increasing urban and commercial areas around the ci-ties of Leipzig and Halle became visible. The conversi-on of open pit mining areas into lakes is another com-mon phenomenon in this region. Both developments have impacts on the provision of ecosystem services. But, the reduction of arable land did not cause a de-crease in food production services. On the contrary, improvements in agricultural productivity have caused an increase in food provisioning services despite the shrinkage of agricultural area. Therefore it was impor-tant, not to look at spatial extensions of land use alone but also on their intensities respectively productivities. By modifying the spatial land cover and the production data, future scenarios have been simulated in the PLU-REL project. The simulations show that the trends presented here are probable to continue in this region for the next decades.
The question of suitable accounting units is still de-bated. In the Halle-Leipzig study we decided to use energy (GJ food produced per hectare land per year), a rather neutral unit that nevertheless includes additional qualitative information on the food supply in compari-son to the mass unit dt/ha. Monetary accountings are more value-laden and therefore trickier to apply. Addi-tionally, market prices (e.g. for food) are strongly fluc-tuating between years and countries hindering spatial and temporal comparisons of monetary accountings.
The evaluations of the ecosystem services provision
capacities/land cover matrix (Table 1) are probably the most crucial point in this methodology. So far, the as-sessments are based on expert evaluations and experi-ence from the case studies. As the material presented here is a first attempt to develop, discuss and estab-lish a new methodology, estimations and input data were intentionally kept as simple as possible. With a better data base and in a longer perspective, it is not convenient just to count and to add different ecosys-tem services, respectively the processes behind them. There must be a weighting procedure which enables an appropriate accounting of different components and their relevance. Nevertheless, the assessment matrix (Tab. 1) reveales interesting patterns of relations bet-ween land cover types and their capacities to provide ecosystem services.
The CORINE land cover types appear to provide a suitable spatial and thematic reference, at least to start the assessment with. As they originate from satellite imagery, they represent the real situation at the earth’s surface. The land cover which can be found there is a combination of natural conditions and human action (land use). Therefore, satellite data are a suitable base for ecosystem services assessments. The idea of eco-system services has been built on a comparable linka-ge of natural conditions and human use/benefits of them. Whether an additional spatial subdivision in ser-vice providing units (Vandewalle et al. 2009) is advisa-ble, has to be proven in further case study applications. Certainly, the rough spatial resolution and thematic ge-neralizations of the CORINE data are strongly limiting the outcomes presented here. Especially if working on the local or regional level, further data have to be in-tegrated in order to obtain a better representation of landscape and land use features.

Landscape OnlineB. Burkhard et al.
© 2009 IALE-D. All rights reserved. www.landscapeonline.de ISSN 1865-1542 Page 12
Landscapes‘ Capacities to ... 15 / 2009
5 Conclusions
With this paper, we present a new methodology to evaluate ecosystem service provisions of diffe-
rent land cover and land use types in relation to human activities. One must bear in mind, that the assessments and the table/map compilations have been mainly based on expert judgements up to now. The successi-ve substitution of these expert assessments by „real“ or model data, constituting the major task and work plan in future, will reveal whether this method and the hypotheses made will stand or if they have to be mo-dified. However, the assessment of the capacities of different (eco)systems or land cover/land use types to provide ecosystem services seems to be very promi-sing. The coupling with GIS and spatial displaying of ecosystem services‘ distributions in maps have a very high potential for landscape analysis and management.
Maps of landscapes‘ capacities to provide ecosystem services give an idea about potentials, possible conflicts and limits in environmental management. The integ-ration and analysis of further landscape data, like land use information (types and intensities), biotic informa-tion (additional vegetation data, fauna, habitats) and abiotic information (soil types, elevation models, cli-mate data, hydrological information), in the assessment process open further opportunities. Figure 5 shows the conceptual framework, including the current steps of analysis (CORINE data, expert judgements and exem-plary quantitative assessments), future integration of additional data sources and further quantifications.
During the conceptual work on the assessment frame-work and within our case studies it became obvious, that the conditions, structures, problems, spatial and temporal scales we want to address are more diverse than expected. Impacts of land-use intensity on ecolo-gical functioning often depend on spatial scales much larger than a single field or land use (Zurlini & Girardin 2007). The land cover classes, ecosystem services and
Figure 5: Conceptual framework to assess and quantify landscapes’ capacities to provide ecosystem services. The dashed and dotted lines indicate the components presented with examples in this paper.

Landscape OnlineB. Burkhard et al.
© 2009 IALE-D. All rights reserved. www.landscapeonline.de ISSN 1865-1542 Page 13
Landscapes‘ Capacities to ... 15 / 2009
respective indicators suggested here may not have the capacity to cover all topics and scales in general. The-refore, we suggest them as a core set of ecosystem ser-vices and land cover/use types with respective poten-tial indicators. It is apparent, that CORINE data with their coarse resolution of at least several hundreds of metres do not have the potential to represent natural conditions on a local scale. Therefore in the individual studies, supplementary case study-specific ecosystems and land cover/use types needed to represent the par-ticular circumstances at the individual study site have to be integrated. Moreover, temporal dynamics and processes taking place on different scales should be taken into account. The same should be done for the ecosystem services. Where there are further significant components not being covered by the list presented here, it is simple to include additional topics by integ-rating further ecosystem services.
As main points open for discussion with regard to the research idea presented here the following questions emerge:
- Does the methodological framework add value to the current research on ecosystem services and their modeling?
- Are there appropriate data available to assess ecosys-tem services in the way presented here?
- How can these data and information be integrated and aggregated into indicators using which units?
- Is the list of ecosystem services sufficient and which services can be quantified?
- Is there an appropriate way to weight the individual ecosystem services with regard to their relevance?
- How can we cope with complexities of landscapes with regard to spatial and temporal scales, hetero-geneities and dynamics?
We are looking forward to respective discussions, com-ments and questions about these issues in the future.
6 Acknowledgements
We want to thank all colleagues, students and other collaborators which contributed to the development and application of this framework. Our special thanks go to the colleagues from the CLMIRF project Pette-ri Vihervaara, Timo Kumpula and Ari Tanskanen, our colleagues from the Zukunft Küste - Coastal Futures project, our colleagues from the PLUREL project, the LTER-D members Hendrik Schubert, Cornelia Baess-ler, Sonja Jähnig, Peter Haase, Karlotto Wenkel and Uta Berger. We are looking forward to receiving further comments, contributions and criticism on the research idea presented here.
References
Barkmann, J., Baumann, R., Meyer, U., Müller, F. & W. Windhorst 2001. Ökologische Integrität: Risikovorsor-ge im Nachhaltigen Landschaftsmanagement. GAIA 10/2, 97-108.
Bastian, O. & K.-F. Schreiber 1999. Analyse und ökolo-gische Bewertung der Landschaft. [in German]. 2nd edition. Spektrum Akademischer Verlag, Heidelberg- Berlin.
Bastian, O. & U. Steinhardt 2003. Development And Per-spectives Of Landscape Ecology. Kluwer Academic Publishers, Dortrecht.
Boumans, R.; Costanza, R.; Farley, J.; Wilson, M.A.; Porte-la, R.; Rotmans, J.; Villa, F.; Grasso, M. 2002. Modeling the dynamics of the integrated earth system and the value of global ecosystem services using the GUMBO model. Ecological Economic 41, 529-560. doi:10.1016/S0921-8009(02)00098-8
Boyd, J. & S. Banzhaf 2006. What Are Ecosystem Servi-ces? The Need for Standardized Environmental Ac-counting Units. Resources for the Future, Washington.

Landscape OnlineB. Burkhard et al.
© 2009 IALE-D. All rights reserved. www.landscapeonline.de ISSN 1865-1542 Page 14
Landscapes‘ Capacities to ... 15 / 2009
Burkhard, B.; Opitz, S.; Lenhart, H.-J.; Ahrendt, K.; Garthe, S.; Mendel, B. & W. Windhorst 2009a. Ecosystem based modeling and indication of eco-logical integrity in the German North Sea – Case study offshore wind farms. Ecological Indicators. doi:10.1016/j.ecolind.2009.07.004.
Burkhard, B.; Kumpula, T. & P. Vihervaara 2009b. Changing landscape management in rural Finland. Mitteilungen zur Kieler Polarforschung 23, 67-72.
Chee, Y.E. 2004. An ecological perspective on the valua-tion of ecosystem services. Biological Conservation 120, 549–565. doi:10.1016/j.biocon.2004.03.028
Costanza, R.; D’Arge, R.; de Groot, R.S.; Farber, S.; Grasso, M.; Hannon, B.; Limburg, K.; Naeem, S.; O’Neill, R.V.; Paruelo, J.; Raskin, R.G.; Sutton, P. & M. van den Belt 1997. The value of world’s ecosys-tem services and natural capital. Nature 387, 253-260. doi:10.1038/387253a0
Daily, G.C.; Polasky, S.; Goldstein, J.; Kareiva, P.M.; Mooney, H.A.; Pejchar, L.; Ricketts, T.H.; Salz-man, T.; & R. Shallenberger 2009. Ecosystem ser-vices in decision making - time to deliver. Fron-tiers in Ecology and the Environment 7(1), 21–28. doi:10.1890/080025
Daily, G.C. & P.A. Matson 2008. Ecosystem Services: From theory to implementation. Proceedings of the National Academy of Sciences of the USA 105(28), 9455-9456. doi:10.1073/pnas.0804960105
Daily, G.C. 1997. Nature‘s Services Societal Depen-dence On Natural Ecosystems. Island Press, Wa-shington D C.
de Groot, R.S. 1992. Functions of Nature : Evaluati-on of Nature in Environmental Planning, Manage-ment and Decision Making. Wolters-Noordhoff BV, Groningen.
de Groot, R.S. 2006. Function-analysis and valuation as a tool to assess land use conflicts in planning for sustainable, multi-functional landscapes. Landsca-pe and Urban Planning 75, 175-186. doi:10.1016/j.landurbplan.2005.02.016
Dresner, M. 2008. Using research projects and quali-tative conceptual modeling to increase novice sci-entists’ understanding of ecological complexity.
Ecological Complexity 5, 216 – 221. doi:10.1016/j.ecocom.2008.05.003
EEA 1994. Corine Land Cover report – Part 2: No-menclature.http://www.eea.europa.eu/publica-tions/COR0-part2 (Date: 11.05.2009).
Egoh, B.; Reyers, B.; Rouget, M.; Richardson, D.M.; Le Maitre, D.C. & A.S. van Jaarsveld 2008. Mapping ecosystem services for planning and management. Agriculture, Ecosystems and Environment 127, 135-140. doi:10.1016/j.agee.2008.03.013
Farber, S.C.; Costanza, R. & M.A. Wilson 2002. Eco-nomic and ecological concepts for valuing ecosys-tem services. Ecological Economics 41, 375–392. doi:10.1016/S0921-8009(02)00088-5
Gimona, A. & D. van der Horst 2007. Mapping hot-spots of multiple landscape functions: a case study on farmland afforestation in Scotland. Landscape Ecology 22, 1255-1264. doi:10.1007/s10980-007-9105-7
Haase, G. & K. Mannsfeld 2002. Naturraumeinheiten, Landschaftsfunktionen und Leitbilder am Beispiel von Sachsen. Forschungen zur deutschen Landes-kunde 250.
Haines-Young, R.; Watkins, C.; Wale, C. & A. Mur-dock 2006. Modelling natural capital: the case of landscape restoration on the South Downs, Eng-land. Landscape and Urban Planning 75, 244-264. doi:10.1016/j.landurbplan.2005.02.012
Heal, G. 2000. Valuing Ecosystem Services. Ecosys-tems 3, 24–30. doi:10.1007/s100210000006
Kreuter, U.P.; Harris, H.G.; Matlock, M.D. & R.E. Lacey 2001. Change in ecosystem service values in the San Antonio area, Texas. Ecological Economics 39, 333-346. doi:10.1016/S0921-8009(01)00250-6
KTBL 2005. Faustzahlen für die Landwirtschaft. KTBL-Schriftenvertrieb im Landwirtschaftsverlag. Münster-Hiltrup.
Ludwig, D. 2000. Limitations of Economic Valuation of Ecosystems. Ecosystems 3, 31–35. doi:10.1007/s100210000007
MA (Millennium Ecosystem Assessment) 2003. Ecosys-tems and Human Well-being. Millennium Ecosystem Assessment (MA). Island Press. Washington D C.

Landscape OnlineB. Burkhard et al.
© 2009 IALE-D. All rights reserved. www.landscapeonline.de ISSN 1865-1542 Page 15
Landscapes‘ Capacities to ... 15 / 2009
Mäler, K.-G.; Aniyar, S. & Å. Jansson 2008. Accounting for ecosystem services as a way to understand the requirements for sustainable development. Procee-dings of the National Academy of Sciences 105(28), 9501–9506. doi:10.1073/pnas.0708856105
Marks, R.; Müller, M. J.; Leser, H. & H.-J. Klink 1992. Anleitung zur Bewertung des Leistungsvermögens des Landschaftshaushaltes. Forschung zur deut-schen Landeskunde 229.
Müller, F. & B. Burkhard 2007. An ecosystem based framework to link landscape structures, functions and services. In: Mander, Ü.; Wiggering, H. & K. Helming (eds.): Multifunctional Land Use – Mee-ting Future Demands for Landscape Goods and Services. Pp. 37-64, Springer. Berlin - Heidelberg - New York.
Müller, F. 2005. Indicating ecosystem and landscape organisation. Ecological Indicators 5(4), 280-294. doi:10.1016/j.ecolind.2005.03.017
Naidoo, R.; Balmford, A.; Costanza, R.; Fisher, B.; Green, R.E., Lehner, B.; Malcolm, T.R. & T.H. Ri-cketts 2008. Global mapping of ecosystem services and conservation priorities. Proceedings of the Na-tional Academy of Sciences 105(28), 9495–9500. doi:10.1073/pnas.0707823105
Nelson, E.; Mendoza, G.; Regetz, J.; Polasky, S.; Tal-lis, H.; Cameron, D.r.; Chan, K.M.A.; Daily, G.C.; Goldstein, J.; Kareiva, P.M.; Lonsdorf, E.; Naidoo, R.; Ricketts, T.H. & M.R. Shaw 2009. Modeling multiple ecosystem services, biodiversity conser-vation, commodity production, and tradeoffs at landscape scales. Front Ecol Environ 7(1), 4–11. doi:10.1890/080023
Rapport, D.J. & A. Singh 2006. An EcoHealth-based framework for State of Environment Reporting. Ecological Indicators 6, 409–428. doi:10.1016/j.ecolind.2005.05.003
Rees, W.E. 1998. How should a parasite value its host? Ecological Economics 25, 49–52. doi:10.1016/S0921-8009(98)00015-9
Saxon State Ministry of the Environment and Agricul-ture 2001. Sächsischer Agrarbericht 2000. https://publikationen.sachsen.de (Date: 18.05.09)
Saxon State Ministry of the Environment and Agri-culture 2003. Forstbericht der Sächsischen Staats-regierung, Berichtszeitraum 1. Januar 1998 bis 31. Dezember 2002. https://publikationen.sachsen.de (Date: 18.05.09)
Schmidt, A. 2008. Integrative Bewertung der Auswir-kungen touristischer Nutzungen auf die Bereitstel-lung der Ecosystem Services auf der Insel Sylt. Dip-loma thesis. Christian-Albrechts-University Kiel.
Tallis, H. & S. Polasky 2009. Mapping and Valuing Ecosystem Services as an Approach for Conserva-tion and Natural-Resource Management. Annals of the New York Academy of Sciences 1162, 265-283. doi:10.1111/j.1749-6632.2009.04152.x
Turner, R.K.; Paavola, J.; Cooper, P.; Farber, S.; Jessa-my, V. & S. Georgio 2003. Valuing nature: lessons learned and future research directions. Ecological Economics 46, 493-510.
Turner, W.R.; Brandon, T.; Brooks, M.; Costanza, R.; da Fonseca, G.A.B. & R. Portela 2007. Global conser-vation of biodiversity and ecosystem services. BioS-cience 57, 868-873. doi:10.1641/B571009
Troy, A. & M.A. Wilson 2006. Mapping ecosystem ser-vices: Practical challenges and opportunities in lin-king GIS and value transfer. Ecological Economics 60, 435-449. doi:10.1016/j.ecolecon.2006.04.007
Vandewalle, M.; Sykes, M.T.; Harrison, P.A.; Luck, G.W.; Berry, P.; Bugter, R.; Dawson, T.P.; Feld, C.K.; Harrington, R.; Haslett, J.R.; Hering, D.; Jones, K.B.; Jongman, R.; Lavorel,S.; Martins da Silva, P.; Moo-ra, M.; Paterson, J.; Rounsevell, M.D.A.; Sandin, L.; Settele, J.; Sousa, J.P. & M. Zobel 2009. Review pa-per on concepts of dynamic ecosystems and their services. http://www.rubicode.net/rubicode/RU-BICODE_Review_on_Ecosystem_Services.pdf (Date: 11.05.2009).
Willemen, L.; Verburg, P.H.; Hein, L. & M.E.F. van Mensvoort 2008. Spatial characterization of land-scape functions, Landscape and Urban Planning 88, 34-43. doi:10.1016/j.landurbplan.2008.08.004
Zurlini, G. & P. Girardin 2007. Introduction to the spe-cial issue on ‘‘Ecological indicators at multiple sca-les’’. Ecological Indicators 8, 781-782. doi:10.1016/j.ecolind.2007.12.003

Landscape OnlineB. Burkhard et al.
© 2009 IALE-D. All rights reserved. www.landscapeonline.de ISSN 1865-1542 Page 16
Landscapes‘ Capacities to ... 15 / 2009
Appendix 1
List of ecosystem services with definitions and potential indicators (based on Müller & Burkhard 2007, de Groot 2006, MA 2005 and Costanza et al. 1997).

Landscape OnlineB. Burkhard et al.
© 2009 IALE-D. All rights reserved. www.landscapeonline.de ISSN 1865-1542 Page 17
Landscapes‘ Capacities to ... 15 / 2009

Landscape OnlineB. Burkhard et al.
© 2009 IALE-D. All rights reserved. www.landscapeonline.de ISSN 1865-1542 Page 18
Landscapes‘ Capacities to ... 15 / 2009

Landscape OnlineB. Burkhard et al.
© 2009 IALE-D. All rights reserved. www.landscapeonline.de ISSN 1865-1542 Page 19
Landscapes‘ Capacities to ... 15 / 2009
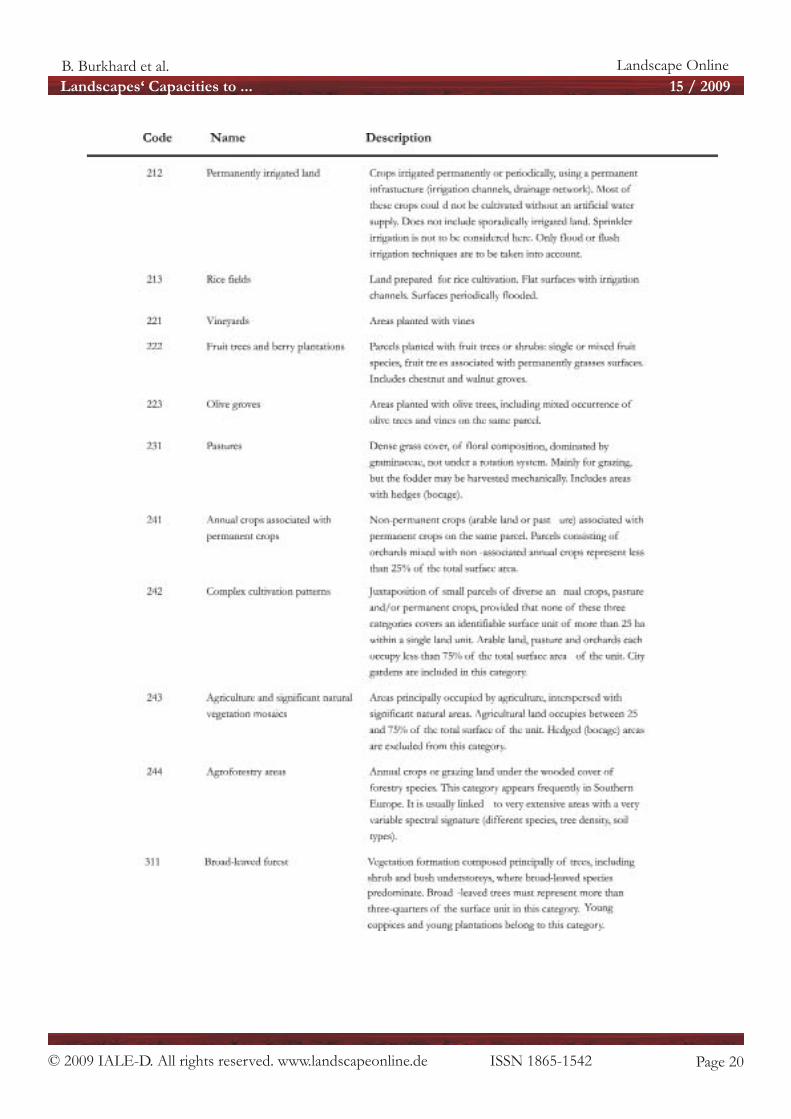
Appendix 2
CORINE land cover – description of categories (from EEA 1994).
Landscape OnlineB. Burkhard et al.
© 2009 IALE-D. All rights reserved. www.landscapeonline.de ISSN 1865-1542 Page 20
Landscapes‘ Capacities to ... 15 / 2009

Landscape OnlineB. Burkhard et al.
© 2009 IALE-D. All rights reserved. www.landscapeonline.de ISSN 1865-1542 Page 21
Landscapes‘ Capacities to ... 15 / 2009

Landscape OnlineB. Burkhard et al.
© 2009 IALE-D. All rights reserved. www.landscapeonline.de ISSN 1865-1542 Page 22
Landscapes‘ Capacities to ... 15 / 2009
![SK9822 REV.01 EN [兼容模张] · 2016. 3. 18. · 3/ 12 SK9822 SK9822: The default is RGB chips with IC integration 6. General Information](https://static.fdocuments.in/doc/165x107/60c8dd7214333e138a661027/sk9822-rev01-en-fafff-2016-3-18.jpg)