
Moisture Meter Range Laserliner (2)/ Material Moisture Measurement
Upload
marmariCategory
view
228download
1
Mario A. Girdalo , 2008 , Uni.Georgia USA
Present by : MARI ; FOROOTAN.

We adressedTemporal & spatial
Variation
Of
SM
In a heterogenous
landscape

0-History !
1-OBJECTIVE&HYPOTHESIS
2-METHODOLOGY
3-RESULTS
4-CONCLUSION

SM= soil moistue
LRW=little river watershed=study area
LULC=LandCover-LandUse
ANOVA=analyze of variance
LS=landscape
H-P=hydra-probe
Var. =variation
P.C.C =pearson correlation coefficient
Western et al. ,1999
SM is not a random phen.
Sp. Var. according to
Size of Samp. Area & Env. Var.
Anderson et al. ,2003
Combination of Env. Factors
(Soil.Veg.c,Topo,Climate)
Create spatially distribution of SM
Over dif.scales of space & time
USDA-NASA 2003 (SMEX03)
In situ devices at LRW produce
Relieble inf. Of SM
Moran ,2004
Cashion ,2005
Under a complex LS.
Remote sensors
with coarse spatial resolution
produce inaccurate estimates
Investigate
Spacial var.
In ground-based
SM data collection
From small plots (30*30)
Similar to pixel size of
Small EFOV remote sensors
TM , ETM+& ASTER &ALI
In a heterogenous landscape

We want toAssessSuitabolity of
Using small plots
For field validation
Of
Satellites remote sensing
Instruments
With small EFOV( < 30m )
TM,ETM+
ASTER & ALI
All are expected
To better capture
Local field conditions
Under landscape environmental
Complexity

DispiteHeterogeneity of study area
It is possible to find Temporally & Spatiolly
Homogenous SM behavior
Within small areas of 30*30.

StudySM var.Within
5 dominate LULC
In LRW
Landscape.

1- increase field knowledge of
SM behavior in Hetero.LS
2-lead to better interpretation of
the
Satellite estimates


-Study Area
-Plot Data
collection
-Statistical Analysis


Northen eastern
Portion of
The 334 km2
Little river watershed
In South Atlantic coastal plain
Of US
Near Tifton ,Georgia
*Relatively flat
topography
*Broad flood plains
*Poorly defined
stream channels
*gently sloping %1-
%5
*sandyloam soil with
sandy surface
horizon
&heavier subsoil
Low W.holding
capacity
& fast surface
drainage
*Annual av,RF=120 mm
*unevently distribution
Short duration in Win.
High density in Sum.
Sum. are long &hot
&humid
Win. are short &mild
Landscape composed of a diversity of
LULC
Forest , Cropland , Pasture,
Residental area & Wetlands

An in situ Network
27 ground stations
As a source of ground-based
Point Data
To
1- validate remote sensing analysis of SM
and
Soil tempreture & Climate
2- long term Hydrological studies
In South eastern of US


H-P-s
Operated by USDA-ARS
And record
SM information &Ground tempreture
At 3 depths
5 , 20 , 30 m
Every 30 min
Typ. Installed along
Agriculture field
boundaries,
Fence rows
& pasture areas &
Typ. Surounded by
Native grass veg.cover.


8 of 27 sites
Selected
Surounding H-P
&
Associated with
the
In situ
SM
Monitoring
station


30 * 03 m area
Surrounded H.p
And
Subsequently sampled for SM
SM was measured using
Portable theta capacitance probe
(measure dielectric conductivity
similar to H.p)

To minimize Errors
We use
Same equipment
&
Same personnel


Data collected Randomly
Within 8(30*30m) plots
8
16
26
32
40
50
63
66
For each plot
10-20 reading
On
4 dif. Dates
March11
March28
April12
May24
2005

testing temporal stability of
SM reading over a fairly short time period
(here 48 h)
On 2 consecutive days
*Nov 30 & Dec 1 (2005)
*Jan 13 & Jan 14 (2006)
Systematic sampling

Each reading was taken in
3 intervals in
4 directions
From H.P station
Total 20 sample per Plot

Hdra-probe
Station
Sampling
location
4 perpendicular
direction
30 M
30 M
At some locations
Fewer than
4 directions
Were evaluated
Due to the presence of
obstacles
Such as
Road and Channels
collected from
5 field adjacent to plot areas
Under the LULC;
Grass ,Orchard,Bare land&
Agriculture Cotton & Peanuts
Associated with H.P sits:
50 , 32 , 66 & 40
Each LULC 8 – 10 SM readings
At 3 intervals along a
25 – 30 m transect
In 4 dif.times
Nov – Dec 2005
&
Jan 2006

Precipitation from each
site
Raingages at H.P stations
For 12-day period at intervals 5
min
For each Sampling Dates


1- ANOVA
2- time stability anaysis
3- Tukey & tamhane hoc
analysis
4-Pearson Correlation
Coefficient
5- t- test


No. Of R.F
For 12 day
period previos
to
Sampling date
Ranged
between
3 - 6

Min average was less
than 2.2
In 24 May
Max average was
10 cm
In 28 March

March 11
March 28

April 12
May 24
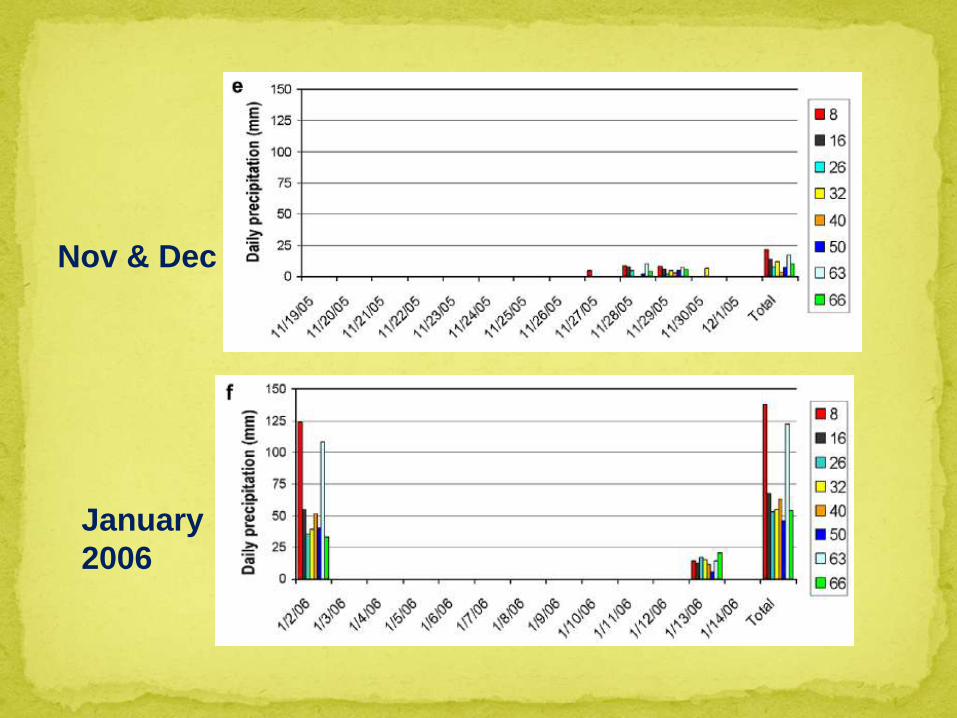
Nov & Dec
January
2006

During R.F events
all sites received simultanous precipitation
with small var. among them.
SO
Water supply
was homogeneous
for all sites prior to Sample Date
SO
SM dif. Can be considered
As a result of
Intrinsic
& mostly independet of water supply

Mean volumetric
SM & infield
Variation
Recorded in
8 locations
Presented
8 highest valus of Vol.SM
40 lowest valus of Vol.SM
When we compared it with precipitation
record:
8 greatest cumulative prec. only for 3
Sam.Date.
While 63 , 16 , 50 greatest prec. inputs
for 5 other days
Aand
For lowest 40 , 32
Prec. Record shows they have above
average
These observations
support
the Hypothesis:
SM caused by intrinsic
Enviromental var.
Beyond prec.acting
At the local scale


This analys use 2 sets of variation to
perform
Composition between plots
Variation among groups
Variation within groups
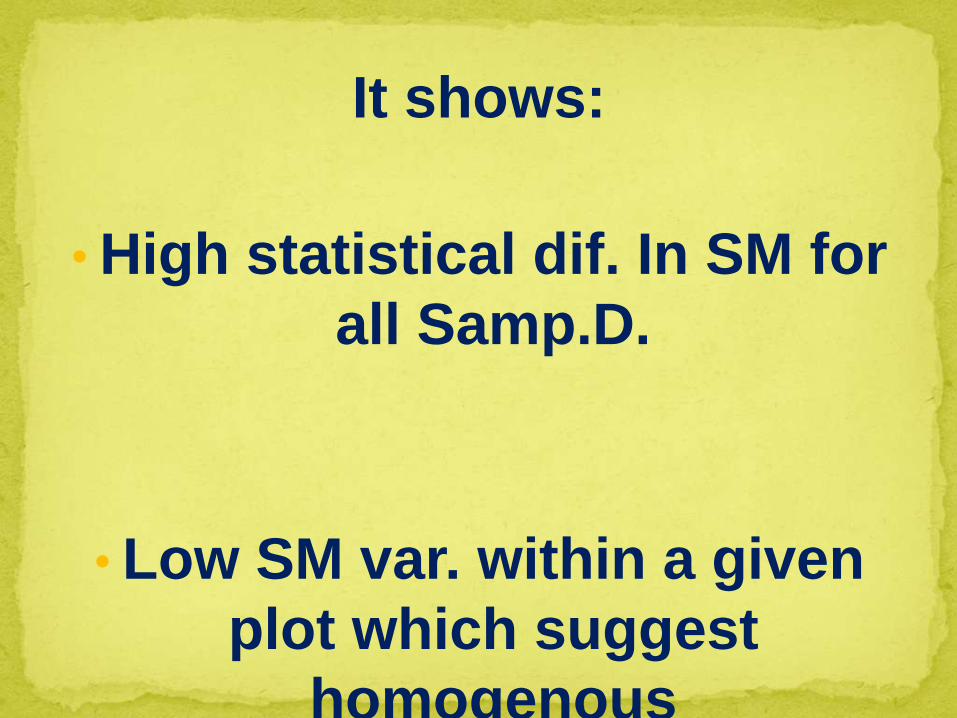
It shows:
• High statistical dif. In SM for
all Samp.D.
• Low SM var. within a given
plot which suggest
homogenous


A multiple comparesion among the
plots
It one by one comparsion between
sites

0 = means weak
relationship
&
More than 0 means have a
relationship
1 , 2 , 3 ,…
Bigger score
Stronger relationship

SO
Weakest relationship
Were find between
8-26 /8-40 /8-66 / 40-
50
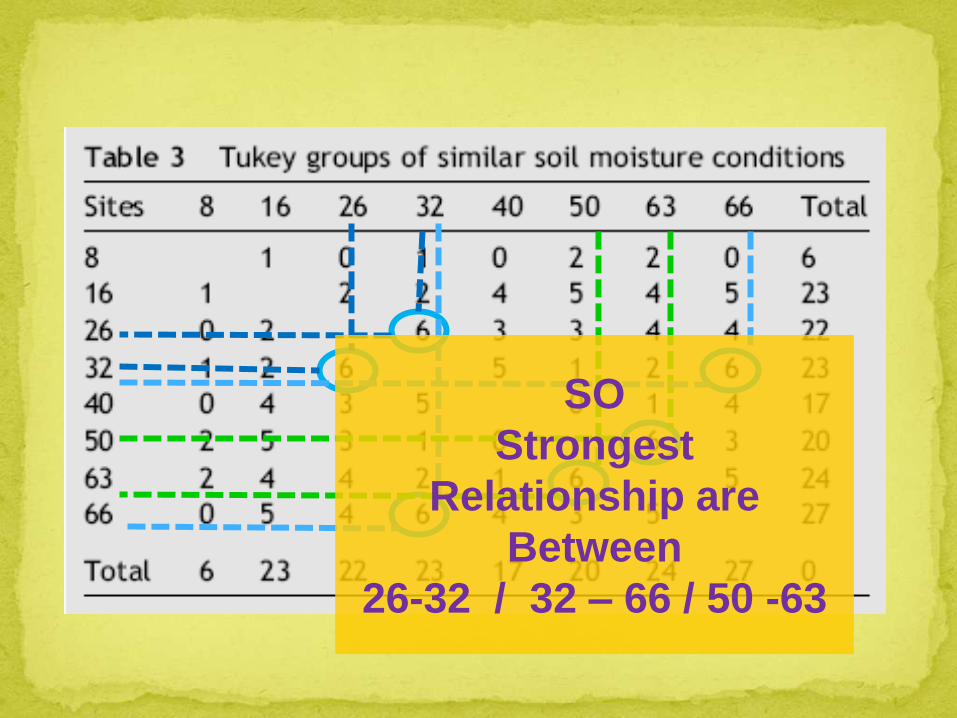
SO
Strongest
Relationship are
Between
26-32 / 32 – 66 / 50 -63


SO
Site 8
Is most unique
SM
Behaviuor
Site 66
High level of
Similarity
With other sites

Similarity of 26 & 32 *Precipitation record:
similar and
Less than 2.5 cm Dif.for all
Samp.D.
*Soil type:
Both are belong to
Tifton soil
Series
*Veg. cover:
32 short grass
26edge of agr.field in wich hay is cut for cattle consumption
site Ppt S.t V.c
26 + + +
32 + + +
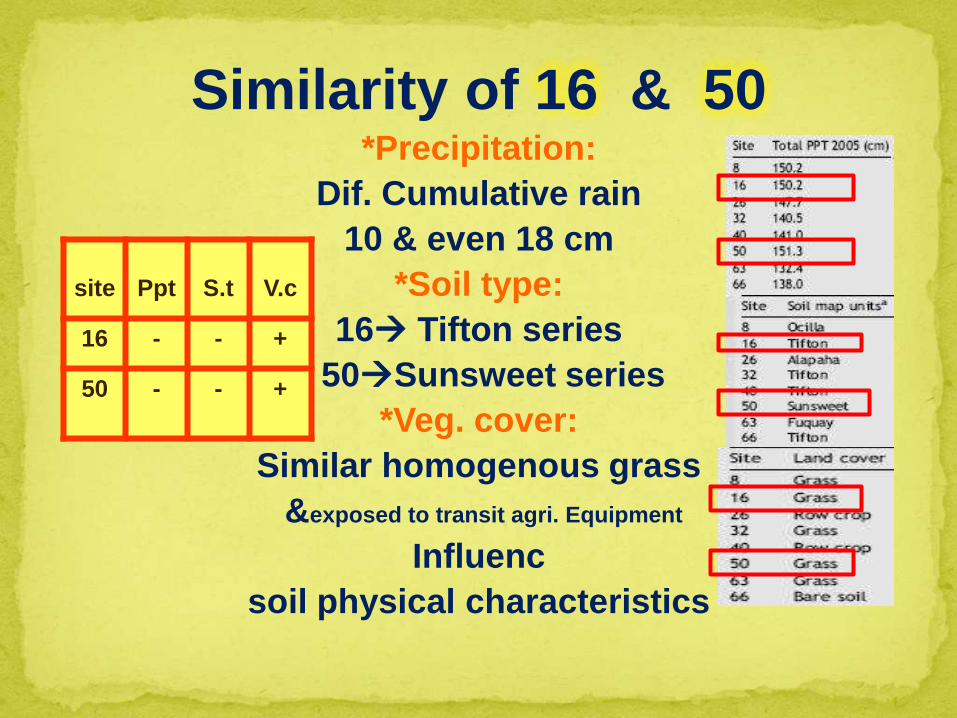
Similarity of 16 & 50 *Precipitation:
Dif. Cumulative rain
10 & even 18 cm
*Soil type:
16 Tifton series
50Sunsweet series
*Veg. cover:
Similar homogenous grass
&exposed to transit agri. Equipment
Influenc
soil physical characteristics
site Ppt S.t V.c
16 - - +
50 - - +

Most dissimilar sites were
8-26 / 8-40 /8-66 /40-50/50-32
Low assosiation was found between 16
&32
In total 6 Sam.D.

8 – 26 / 8-40 / 8-66
Dif. Combination of Soil type
SO
Var. in water infiltration process
SO
Dif. SM content
40-50 / 50-32
Dif. Cumulative rainfall


In LRW
LULC
Is a greater factor
affecting
SM conditions
Than
Cumulative Rainfall
Influnce of LULC
In SM
Indicated by our results in LRW. LS.
That make:
Dif.
Evatranspiration
&
Soil water usage

Spatial resolution of R.sensing Sensors
That are More appropriate to
Capture SM conditions under this LS.
Will be defined by
*LS. Fragmentation
*LULC composition
*Sizes of LULC fragments
High levels of fragmetation at LRW
With fragments of
Small size
So
Moderate to
Fine spatial resolutionsensors
(~ 3 0 m)
Are expected better suit the
countinous sutdy
Of SM in LRW

Parasmeter mean relative diffrence:
1-Measure how particular sample
compare with
Av. SM of plot
2-Indicator of
Infield
Variation of surface
SM
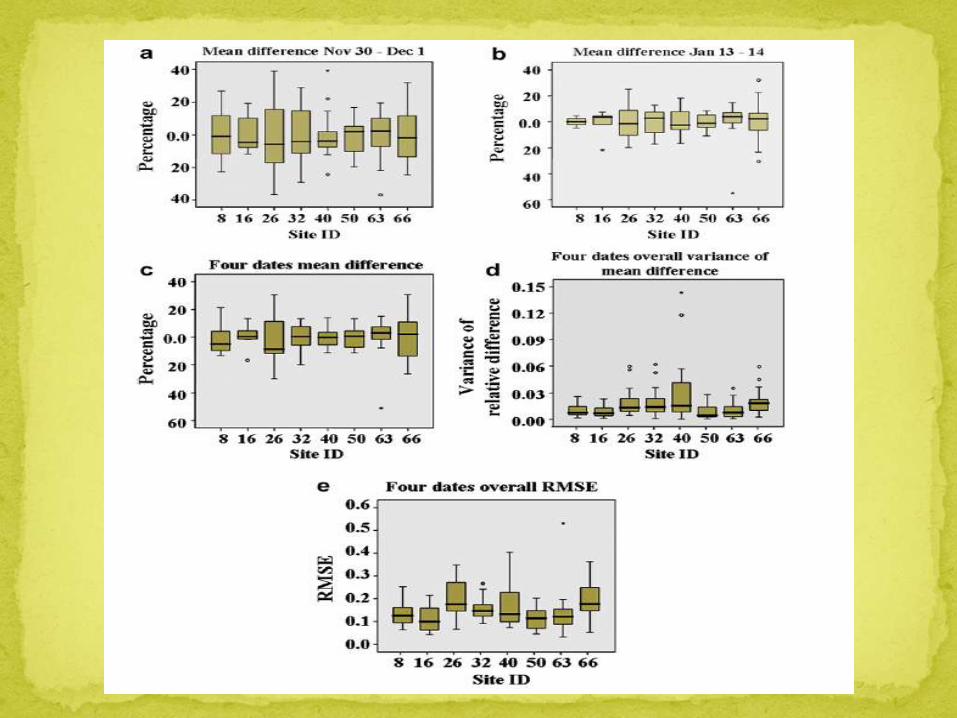

26 has highest
range on
mean Dif.
(36%-39%)

16 has
Lowest
Var.
(-4%-+4%)

High level of
Homogeneity
Within each
Sample plot
Highest Av. Of mean
relative Dif. Was
2.6% in 66
Followed by
8 , (2.1%)
16 (1.2 %)
26 (1.0%)
Otherwise mean relative Dif. Was
0.1 % below the plot Dif. Approach
Zero

Results indicateSamp. Point within the plots are very
close to each
Plot mean
SO
Can accurately
Estimate
Surface SM behavior
Of
Entire 30*30 m plot

Our results shows
High level of in field
Homogeniety
That’s in contrast with
The results of similar
research performed
In large plots

in our research
By selecting Small LS.
fragments.
The in field heterogenity
casued by
Topography Diffrence
Was
Minimize

Stability in plots 40 & 50
Can be explained by their
Relatively Homogenous LC
50 part of a larger pasture and
entire plot covered by same grass
type
40 part of a mechanized
AGR.Field & change
Veg-cover throughout growing
season

So
Hemogeneity Veg.Cover
&
Homogeniety
precipitation,Slope,Soil physical
characters
High stability of
SM
Recorded at these 2 sites


Was compare to evaluate if all
in field locations experience similar
SM VAR.s
within a
short period(one day in this case)

Correlations were significant in both
sets
But Only for 26 , 32 , 63

P.C.C
Is an indicator of
Spatial stability
Of SM
Point data

Low pcc with low
significant level
Process is unstable in
space and for time lag
In which Data collected


Computed to evaluate
The Variation in
Av.SM values
From one day to next


Results suggest that
Surface SM
Will not necesserily
Reflect profile conditions
SO
Remote sensing retrieving
algorithms
Based only in direct or indirect
Quantification of
Surface conditions
As
Temp. , SM
May produce Errors
When used in this LS.

These ERRORS
Can be
Minimized
by incorporatig in to Rem.Sen.
Analysis data of
Precipitation events prior to Samp.D
&
Infiltration analysis for soil type
dominated
of study area

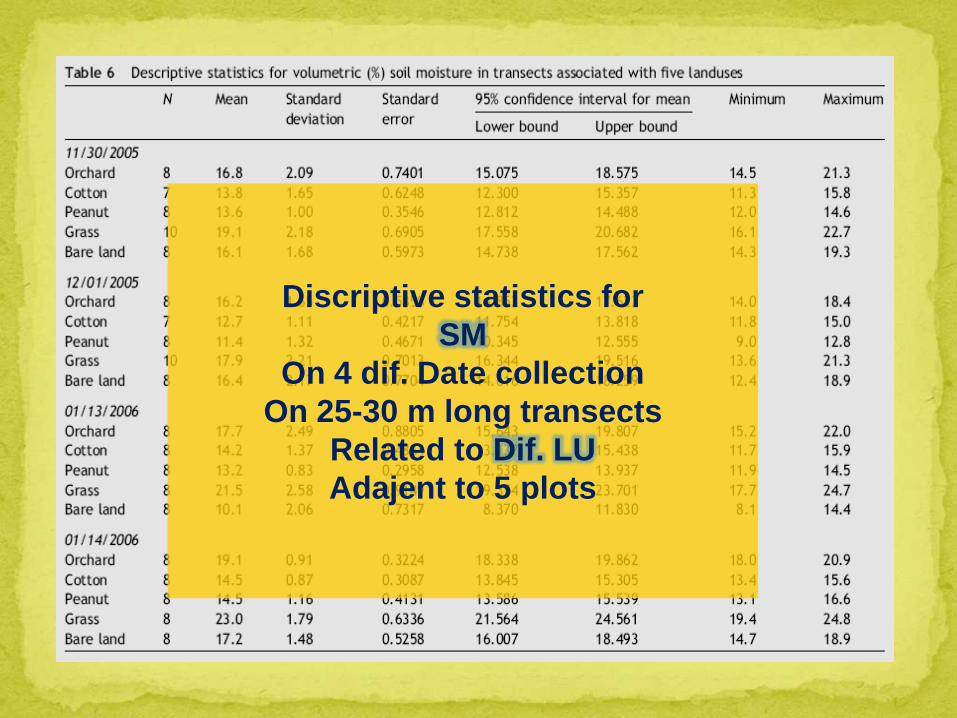
Discriptive statistics for
SM
On 4 dif. Date collection
On 25-30 m long transects
Related to Dif. LU
Adajent to 5 plots


Results shows
Orchard & grass
Have the wettest
conditions
While
Cotton & peanut fields
Were the driest
Tilled AG.fiels
lowest spatial variability with Av.
Values around %1
Grass AG.field
highest standard deviation with
values btween
%1.8 - %2.6
Bare land
Intermediate behavior


ANOVA
Between SM valuse for
five LULC
Showed
Significant statistical Dif.
For all 4 days

Peanut &
Cotton
Most similar
with
No stat.Dif
Among them
for any 4 days
Greatest Dif. With
orchard, grass &
bareland
Showing Stat.Dif on all
Samp.Dates

AOVA high Diffrences in SM
among the plots
& high Hemogeneity within them
Precipitation analysis similar
rainfall conditions
So SM.Var. explained by in situ local
conditions

Temporal stability analysis SM has
high stability within the small plots
and single point can use to monitor
SM Var. of all plot
T-statistical analysisSM statesin
upper soil layer changes within
24H

And finally we found
stat.Dif. In SM between
Dif. LULC as there
adjacent plots


A remote sensing
approach that consider
Homogeneous LULC ,LS fragments
can be used to identify
LS units of similar SM behavior
under Heterogeneous landscapes
In addition
The insitu USDA-ARS network
will serve better in remote
sensing studies
in wich sensors
with fine spatial resolution
are evaluated