Land/BuiLding needs anaLysis For TargeTed indusTries
69
LAND/BUILDING NEEDS ANALYSIS FOR TARGETED INDUSTRIES October, 2009 Prepared by Community Planning & Urban Design Group 8181 East Tufts Avenue Denver, Colorado 80237 In association with 10184 West Belleview Avenue, Suite 100 Littleton, Colorado 80127
Transcript of Land/BuiLding needs anaLysis For TargeTed indusTries

o c to b e r 2 0 0 9

LAND/BUILDING NEEDS ANALYSIS FOR TARGETED INDUSTRIES October, 2009 Prepared by
Community Planning & Urban Design Group 8181 East Tufts Avenue Denver, Colorado 80237 In association with 10184 West Belleview Avenue, Suite 100 Littleton, Colorado 80127


ii
CONTENTS 1. PURPOSE, PROCESS, AND PREDICTIONS ..................................................................... 1
1.1. Purpose of this Report ............................................................................................................... 1 1.2. Methodology .............................................................................................................................. 4 1.3. Caveats...................................................................................................................................... 4 1.4. Summary of Findings ................................................................................................................. 6
2. SUPPLY .................................................................................................................... 8
2.1. Interviews and Stakeholder Surveys .......................................................................................... 8 2.2. Available Buildings and Leasable Spaces................................................................................ 11 2.3. Building Type Profiles .............................................................................................................. 12 2.4. Building Features and Site Characteristics by Building Type ................................................... 24 2.5. Building Type and Site Area by Targeted Industry Cluster....................................................... 25 2.6. Land Use and Zoning............................................................................................................... 28 2.7. Projected Land/Building Inventory by Targeted Industry Clusters............................................ 34
3. DEMAND ................................................................................................................. 43
3.1. Projected Employment ............................................................................................................. 43 3.2. Projected Land/Building Space Needs by Targeted Industry Cluster....................................... 47
4. RESULTS ................................................................................................................ 52
4.1. Supply and Demand Comparison ............................................................................................ 52 4.2. Findings and Considerations.................................................................................................... 57

LAND/BUILDING NEEDS ANALYSIS FOR TARGETED INDUSTRIES
iii
APPENDICES Appendix A: Summary of Stakeholder Surveys and Interview Responses Appendix B: Available Commercial Real Estate, City of Fort Collins Appendix C: Available Commercial Real Estate, Larimer County Appendix D: Memorandum: Employment Forecast for Fort Collins Land/Building Needs Analysis for Targeted Industries (Development Research Partners, July 1, 2009) Appendix E: Existing Targeted Industry Employees
FIGURES
Figure 2-1: Existing Rail Lines .................................................................................................................... 27 Figure 2-2: Chip Design / R&D Suitable Sites for Industry Cluster ............................................................. 37 Figure 2-3: Software / GIS Suitable Sites for Industry Cluster .................................................................... 38 Figure 2-4: Biosciences Suitable Sites for Industry Cluster ........................................................................ 39 Figure 2-5: Clean Energy Suitable Sites for Industry Cluster...................................................................... 40 Figure 2-6: Uniquely Fort Collins Suitable Sites for Industry Cluster .......................................................... 41 Figure 2-7: Aggregate Highly Suitable Lands for Target Industries ............................................................ 42 Figure 4-1: Typical Targeted Industry Cluster Supporting Businesses ....................................................... 61 Figure 4-2: Typical Targeted Industry Cluster Processes and Land Uses .................................................. 62
TABLES Table 2-1: Stakeholder Questionnaire Topics............................................................................................... 8 Table 2-2: City of Fort Collins Commercial Real Estate Metrics ................................................................. 11 Table 2-3: Larimer County (including City of Fort Collins) Commercial Real Estate Metrics....................... 11 Table 2-4: Building Type Profile: Regional Warehouse ............................................................................. 13 Table 2-5: Building Type Profile: Refrigerated Distribution ........................................................................ 14 Table 2-6: Building Type Profile: Light Manufacturing ............................................................................... 15 Table 2-7: Building Type Profile: Heavy Manufacturing ............................................................................. 16 Table 2-8: Building Type Profile: Research & Development Flex .............................................................. 17 Table 2-9: Building Type Profile: Office Showroom ................................................................................... 18 Table 2-10: Building Type Profile: Multitenant ........................................................................................... 19 Table 2-11: Building Type Profile: Data Switch Center .............................................................................. 20 Table 2-12: Building Type Profile: Office (single or multi-story) ................................................................. 21 Table 2-13: Building Type Profile: Retail (in-line or pad)............................................................................ 22 Table 2-14: Building Type Profile: Vertical Mixed-Use............................................................................... 23 Table 2-15: Building Features by Building Type ......................................................................................... 24 Table 2-16: Site Characteristics by Building Type ...................................................................................... 24 Table 2-17: Typical Building Type by Targeted Industry Cluster................................................................. 25 Table 2-18: Typical Site Area by Targeted Industry Cluster ....................................................................... 26 Table 2-19: Typical Land Uses by Targeted Industry ................................................................................. 28 Table 2-20: Chip Design / Research and Development – Suitable Districts for Industry Development....... 29 Table 2-21: Software / GIS – Suitable Districts for Industry Development.................................................. 30 Table 2-22: Biosciences – Suitable Districts for Industry Development ...................................................... 31

LAND/BUILDING NEEDS ANALYSIS FOR TARGETED INDUSTRIES
iv
Table 2-23: Clean Energy – Suitable Districts for Industry Development ................................................... 32 Table 2-24: Uniquely Fort Collins – Suitable Districts for Industry Development ........................................ 33 Table 2-25: Total Vacant Land .................................................................................................................. 34 Table 2-26: Five Targeted Industry Clusters Combined Suitable Land....................................................... 34 Table 2-27: Suitable Land Supply by Targeted Industry Cluster................................................................. 35 Table 3-1: Fort Collins Total Covered Employment .................................................................................... 44 Table 3-2: Chip Design/Research and Development.................................................................................. 44 Table 3-3: Software/GIS ............................................................................................................................. 45 Table 3-4: Biosciences ............................................................................................................................... 45 Table 3-5: Clean Energy............................................................................................................................. 46 Table 3-6: Uniquely Fort Collins ................................................................................................................. 47 Table 3-7: Existing Development FAR Analysis.......................................................................................... 48 Table 3-8: Employee Density Ratios by Building Type ............................................................................... 48 Table 3-9: Employee Density Ratios (low range - current conditions) ........................................................ 49 Table 3-10: Employee Density Ratios (high range - no heavy industrial) ................................................... 49 Table 3-11: Citywide Targeted Industry Cluster Employment (2007, 2030)................................................ 50 Table 3-12: Low Density Scenario - Land Area Needs (20 year projection) ............................................... 51 Table 3-13: High Density Scenario - Land Area Needs (20 year projection)............................................... 51 Table 4-1: Suitable Land Supply by Targeted Industry Cluster................................................................... 53 Table 4-2: Five Targeted Industry Clusters Aggregate Gap Analysis (2007-2030)..................................... 54 Table 4-3: Chip Design/R&D Gap Analysis (2007-2030) ............................................................................ 54 Table 4-4: Software/GIS Gap Analysis (2007-2030)................................................................................... 55 Table 4-5: Biosciences "Gap Analysis" (2007-2030) .................................................................................. 55 Table 4-6: Clean Energy "Gap Analysis" (2007-2030)................................................................................ 56 Table 4-7: Uniquely Fort Collins "Gap Analysis" (2007-2030)..................................................................... 56 Table 4-8: Highly Suitable Land by Zone District ........................................................................................ 58


LAND/BUILDING NEEDS ANALYSIS FOR TARGETED INDUSTRIES
1
1. PURPOSE, PROCESS, AND PREDICTIONS
1.1. Purpose of this Report This study is an assessment of the land and building space needs and location requirements of certain industry clusters targeted by the City of Fort Collins. The URS Community Planning and Urban Design Group, in Association with Development Research Partners (DRP), sought to determine if Fort Collins has sufficient available land and/or buildings appropriately zoned for development/redevelopment and if the available land and/or buildings meet the specific needs of the targeted industries. Moreover, if the city lacks adequate available land and/or buildings, can changes be made to address the needs? This study, with supporting information and analysis, builds upon the work from the “Strategic Employment Opportunities: Select Industry Clusters in Fort Collins” report prepared in October, 2006. The findings also draw from the City’s Buildable Lands Inventory (BLI) by reviewing sites (land/buildings) within the Fort Collins Growth Management Area (GMA) boundary to determine their suitability for potential uses from the targeted clusters. The targeted industry clusters assessed in this project are described below.
Chip Design / Research and Development: The Chip Design/Research and Development cluster in Fort Collins houses several large international businesses as well as a large number of small, independent businesses that bring innovation and growth to the industry. The tech-centered recession of 2001 fundamentally reshaped the computer and electronics manufacturing industry. Businesses involved in the research and production of computers and computer peripheral equipment, including the development and production of semiconductors are in this industry cluster group. The industry has also contracted due to increased productivity, technological advancement, and a general migration of manufacturing operations to overseas locations. As a result, the current computers and electronics industry in Fort Collins and many other areas is focused more on higher-level research and design activities than on manufacturing. While this shift should mean more stability for the industry in the long term, heavy competition and consolidation will likely make for volatile employment trends in the short term. As computer chip companies in Fort Collins face these challenging conditions, they will have a competitive advantage due to the region’s many technology research and incubation resources.
Software / GIS: Software/GIS promises to be one of the high growth industries into the future. Software/GIS entrepreneurs are drawn to the area’s attractive quality of life, along with potential synergies with Colorado State University (CSU). The research- and design-intensive software industry is among the sectors of the U.S. electronics industry with a more favorable outlook, and the industry is uniquely positioned to thrive in Fort Collins thanks to a regional focus on the burgeoning field of Geographic Information Systems (GIS) technology. This cluster includes

LAND/BUILDING NEEDS ANALYSIS FOR TARGETED INDUSTRIES
2
businesses providing custom computer programming services, prepackaged software, computer integrated systems design, and other computer related services. Geospatial software companies in Northern Colorado’s “GIS Alley” have several key opportunities for future growth. At a broad level, increasing interest in GIS technology for businesses and governments will sustain demand for specialists who can design, implement, and maintain new software systems. At the local level, research efforts in energy conservation, forestry, and disease prevention will benefit software specialists who can create mapping tools for university researchers and bioscience companies.
Biosciences: The single largest factor in building a successful Biosciences cluster in Fort Collins is the extent to which Colorado State University (CSU) serves as the major driver of new technologies and successfully develops partnerships with industry to create new products and services. The biosciences industry cluster includes a wide variety of companies – from pharmaceuticals and medical device manufacturers to veterinary service providers, environmental consultants, academic institutions, and independent laboratories. Because of this diversity, forecasters must consider a large number of often conflicting factors when they consider the industry’s long-term employment trends. For example, high drug costs and consolidations will likely slow employment growth in pharmaceuticals from the prior decade’s rapid pace. Alternatively, increased use of biotechnologies in the energy field is driving rapid bioscience research and business incubation activity. Because the bioscience industry is forward-looking and research intensive, largely unpredictable changes in factors including public policies, government funding, and commodity prices contribute to the uncertainty in the outlook for bioscience employment. These factors are likely to offset one another in the long term, however, and the bioscience industry is likely to grow at an above-average pace in an economy that increasingly favors innovation. Fort Collins is uniquely positioned to thrive in this sort of economy, because the region is an increasingly recognized hub for research and start-up activity.
Clean Energy: The Clean Energy cluster brings together CSU researchers, public, private, and not-for-profit agencies to find answers to pressing global challenges of peak oil, climate change, energy security, energy costs, and environmental impacts. The cluster is already working on solutions, such as smart grid technologies, biofuels, solar energy, wind energy, and cleaner burning and more efficient engines. The clean energy cluster includes businesses producing renewable energy products and conducting research and development related to increasing the production of renewable energy. While analysts disagree as to how much and how quickly oil prices will rise over the long term, some increase appears inevitable if for no other reason than the growing oil demand of developing countries. As oil prices increase, renewable energy technologies are more financially feasible and clean energy employment will increase.

LAND/BUILDING NEEDS ANALYSIS FOR TARGETED INDUSTRIES
3
In addition to commodity prices, several other factors will influence the rate of growth in clean energy employment. First, policy changes and public support could shift the demand for clean energy technologies. Colorado is one of 28 states to have a renewable energy portfolio standard (RPS), but no standard currently exists at the national level. If a national standard took effect, clean energy employers would likely expand faster to serve larger markets. Locally, the FortZED initiative – a multi-pronged effort to create a net zero energy district in downtown Fort Collins – should support additional renewable energy development and employment as it gains momentum. Other factors, such as the supply-chain effects of several renewable energy materials manufacturers and the overall rate at which clean energy research can be translated into viable, utility-scale technologies, will also influence clean energy employment trends. Because policies and technologies do not lend themselves to forecasting, this forecast assumes that policy and technology changes related to clean energy happen at essentially the same rate they have over the past several years. The forecast also assumes that clean energy employment growth will moderate in the later years as the industry matures.
Uniquely Fort Collins: The uniquely Fort Collins industry cluster includes businesses whose products and operations contribute to the eclectic, innovative, and high quality of life in Fort Collins. This industry includes three sub-clusters – Artistic and Cultural Entertainment, Hospitality, and Recreational and Retail Activities. Because businesses in these three sub-clusters have different land uses, employment forecasts for each sub-cluster are provided separately in the table below. Employment in the three sub-clusters – particularly in Recreational and Retail Activities – depends somewhat on population and income levels. Tourism is a second major employment driver in these clusters, and the college-age population in Fort Collins also provides sustained demand for retail and entertainment facilities. Finally, the region’s network of craft brewers should continue to attract tourists and other brewing-related businesses.
This study is intended to be both a current and future (20-year) land planning exercise. The process and report will assist the City in understanding the space (land/building) needs and location requirements for the targeted industry clusters. The comparison of available suitable land with the forecast demand for land indicates whether there is sufficient land supply for each targeted industry cluster. This analysis is presented with other qualitative observations at the end of this report. These findings and observations are intended to provide direction to changes that may be necessary to City Plan principles and policies and/or its associated Structure Plan map to add new sites.

LAND/BUILDING NEEDS ANALYSIS FOR TARGETED INDUSTRIES
4
1.2. Methodology In evaluating the City of Fort Collins’ land/building needs for targeted industry clusters, this study examined two main factors: 1) supply, and 2) demand. To determine the adequacy of the City’s existing and future supply of land and buildings, the project team researched the facility needs and preferences of the five targeted industry clusters. The team developed industry profiles based on interviews and confidential surveys of local economic development professionals, real estate brokers, and business leaders. The team also consulted published standards and facility classifications from the Urban Land Institute, American Planning Association, and CoStar, in order to create detailed documentation of building features, dimensional standards, and site characteristics, for 13 common commercial building types (regional warehouse, light manufacturing, office, retail, etc.). Through Geographic Information Systems (GIS) analysis, the team then evaluated sites within the Fort Collins Growth Management Area (GMA) boundary (land/buildings previously identified in the Fort Collins Buildable Lands Inventory (BLI) to determine their suitability for potential uses from the targeted clusters. The available sites were reviewed against the requirements of the targeted industry profiles, building profiles, and current zoning standards. With City staff’s input, the team refined and summarized the land/buildings supply findings in a series of five maps and tables which correspond to the five targeted industry clusters. The GIS exercise provided a general idea of the City’s current and future supply of land and buildings suitable for the five targeted industry clusters. The estimated supply of land and buildings was then compared against the projected demand for new commercial/employment space. Future demand for space and land for the targeted industries was based on the 20-year employment forecast prepared by Development Research Partners. This forecast summarized current city-wide employment and employment growth on an aggregate basis, and then broke out employment growth for each of the targeted industries, taking into consideration regional growth, Fort Collins growth, and estimated growth by industry sector. Ultimately, the targeted industry employment projections were translated into estimated building/facility space needs over the 20-year forecast period. This analysis was based on standard planning ratios of anticipated square feet per employee (by building type and/or industry), which were cross-checked by comparison with existing conditions in Fort Collins. The resulting forecast identifies building space, site, and/or land requirements for each targeted industry cluster over the 20-year planning period. The project team compared the supply of suitable land, sites and/or building space with the estimated demand, and identified areas where there is an imbalance for each targeted industry cluster. The difference between the estimated supply and demand for the land/building space needs of each industry (gap analysis) is the basis for the team’s findings and considerations.
1.3. Caveats This analysis relied on the Fort Collins Buildable Lands Inventory (BLI) data set and as a result, any caveats and qualifications associated with the BLI apply to this study. Important ones to highlight are the following:

LAND/BUILDING NEEDS ANALYSIS FOR TARGETED INDUSTRIES
5
1. Large-scale analysis such as the BLI will include a small number of errors in data or calculation. Such errors are not thought to significantly affect the major factual conclusions based on the BLI.
2. In some cases, the City Zoning or Structure Plan designations do not correspond to BLI
classifications. The BLI classifications attempt to capture the most likely future scenario in order to provide the most accurate estimate of vacant land potential.
3. The BLI is not an attempt to fully analyze or depict the market feasibility or availability of a
particular parcel or of a geographic area, the affordability of land, the availability or capacity of infrastructure, or the pace at which individual parcels of land will develop in the future. Rather, this report is intended to provide useful information and analysis for use in subsequent policy discussions and actions that implement City Plan.
Following are additional caveats for the URS analysis summarized in this report: 1. The study relied heavily on the BLI and other Fort Collins GIS data. It could not have been
completed without the rich and comprehensive data source created by Fort Collins planning staff. 2. The GIS analysis relied on vacant land polygons, or "blobs" in the BLI. It was not a parcel-by-
parcel analysis using Assessor Parcel data. This approach assumes that several smaller parcels can be combined into polygons to make larger development sites.
3. The BLI and other Fort Collins GIS data were the primary sources for analyzing vacant land in
terms of suitability for each of the targeted Industries. Two levels of suitability were assessed: - Highly suitable includes ideal zone districts for the targeted industry clusters, adequate site
area, and no identified physical constraints. - Potentially suitable includes adequate site area but some potential targeted industry land
uses may not be allowed by current zoning regulations. For example, the current zoning may allow office use but not light industrial operations, which may also be desired by a particular company in one of the targeted industry clusters
4. There was no attempt in the analysis to find ways to mitigate or offset the identified development constraints in order to make a potentially suitable classification change to a highly suitable classification. However, potentially suitable land can be changed to highly suitable through pre-development actions such as changing the zoning, subdividing large parcels, or creating land assemblages from several small parcels.
5. The Development Research Partners employment projection was used as a forecast of future
employment city-wide as well as by targeted industry. The market share of employment growth for the industries (from 23% - 26% of total future citywide employment growth) was assumed to be the same for land use growth.
6. The suitability measure does not evaluate aspects of location – such as proximity to similar users
or to supporting amenities like parks, bike paths, retail and restaurants, or nearby residential choices. Land cost was also not a factor.

LAND/BUILDING NEEDS ANALYSIS FOR TARGETED INDUSTRIES
6
1.4. Summary of Findings The complete study findings and considerations are explained in detail in Section 4.2. Key points are excerpted below.
1. Targeted Industry Clusters Share of Total Employment – This study compares the supply of available land/buildings with the forecast demand by the targeted industry clusters on an aggregate basis. There was no attempt to assign market share by targeted industry cluster relative to the total forecast employment. The targeted industry clusters analyzed in this report represent 26% of total Fort Collins employment.
2. Land Demand/Availability by Targeted Industry Cluster – Chip Design/R&D has a low projected growth rate (.9%, or 190 employees) in the Fort Collins area and as a result, has minimal additional land requirements (an additional 9 acres of land). Software/GIS has a well-established base and a healthy projected future growth rate (1.9%, or 1,250 employees) for the Fort Collins area. However, due to the high employee density of this cluster, additional employees will require only 28 acres of land for new facilities. Biosciences will have significant future building and land requirements if it grows as hoped in Fort Collins, and may become constrained. Projected annual growth is strong (2.9% and 1,960 employees) and will require 90 – 180 acres of land, depending on employee density. Clean Energy is similar to biosciences in that it is projected to grow in the Fort Collins area, has non-typical building and land requirements, and may become constrained. Future annual growth is very strong and is estimated to be 5.2% (3,440 new employees), requiring from 158 – 316 aces of land for new facilities, depending on the employee density. The Uniquely Fort Collins industry cluster is projected to grow close to the Fort Collins total employment rate (1.8%, compared to 1.9%), resulting in 4,430 new employees. This will require 202 acres of land for new facilities due to high employee density.
3. Location of Highly Suitable Lands – Most highly suitable lands are in the northeast quadrant of
Fort Collins, north of Prospect and east of College Avenue. Over half of the highly suitable lands are within one-half mile of I-25.
4. Potentially Suitable vs. Highly Suitable Land Supply – The inventory of highly suitable land can
be increased by taking steps that allow potentially suitable land to be reclassified as highly suitable. These steps include obtaining a variance from some of the current zoning requirements, changing the zoning, or replatting the property to a more suitable parcel size.
5. Location of Industrial and Commercial Zoned Lands – There are multiple sites highly suitable
for targeted industry development within industrial-zoned districts as indicated on the City's Structure Plan. 50% of the total 1,588 acres of highly suitable lands are either Industrial (610 acres) or Commercial (185 acres).
6. Utilities – 3-phase power is important to businesses which operate heavy machinery for industrial
processes and manufacturing. 3-phase power is available along major arterials in the City, and is usually added for areas that are annexed. The City of Fort Collins Utilities, in partnership with the Platte River Power Authority (PRPA), is in the process of constructing an extensive fiber optics

LAND/BUILDING NEEDS ANALYSIS FOR TARGETED INDUSTRIES
7
system in the City of Fort Collins that interconnects with similar systems in the neighboring cities. The system was “overbuilt” to help local public and commercial agencies meet their own needs for high-speed telecommunications, which is of benefit to many businesses.
7. Rail Access – Rail service provided by a rail spur is important to some industrial users. There are
several railroads that pass through the GMA and the Mountain Vista Subarea has rail access, including existing rail spurs.
8. Mountain Vista Subarea Plan Update – The draft subarea plan update summary provided to
URS includes several findings which are consistent with the Land/Building Needs Analysis for Targeted Industries:
The forecast in employment growth and resulting land demand analysis identified a small shortfall in Industrial-zoned land capacity. The Mountain Vista Subarea provides an opportunity to correct this shortfall and provide additional capacity for industrial development beyond the 2030 time horizon.
Due to the limitations imposed by the Growth Management Area, an oversupply in either Employment- or Industrial-zoned land is beneficial to provide flexibility to respond to changing market conditions.
9. Smart Growth Planning and Targeted Industry Cluster Requirements – The Smart Growth
goals of compact, more intense development may contradict the goal of attracting complete industry clusters to Fort Collins. For example, light and heavy manufacturing (elements of the Bioscience and Clean Energy clusters) require large buildings, large sites, and less dense site development than R&D and administrative office uses. If local land use regulations discourage or prohibit low density industrial development, then some high economic impact activities may not locate in the Fort Collins GMA.
10. Research, Business and Industrial Parks – Fort Collins has a limited inventory of true research,
business and industrial parks, which are important facilities for the nurturing of targeted industry clusters. Planning for the redevelopment of industrial land, such as in the northeast sector of Fort Collins and along I-25, should encourage the creation of research, business and industrial parks.
11. Zoning Flexibility – It is important that the Fort Collins system of land entitlement incorporate
flexibility to accommodate priority economic development users, particularly in cases where requirements may inadvertently exclude them, without sacrificing the quality development that the community demands.
12. Updated Inventory of Sites and Other Information – The City of Fort Collins should work closely
with city and regional economic development staff to ensure that there is an accurate inventory of highly suitable and potentially suitable parcels for development. Advance Planning staff should continue to monitor and update the inventory and incorporate feedback from private developers, businesses, and economic development staff.

LAND/BUILDING NEEDS ANALYSIS FOR TARGETED INDUSTRIES
8
2. SUPPLY
2.1. Interviews and Stakeholder Surveys For this study the project team contacted approximately ten local planning, economic development, and real estate professionals representing the City of Fort Collins, Downtown Development Authority, Chamber of Commerce, Northern Colorado Economic Development Corporation (NCEDC), Colorado State University, and commercial real estate brokerages. The team also contacted over 40 key business owners and local leaders representing the five targeted industry clusters. Detailed responses to project questionnaires were received from seven planning/economic development/real estate professionals and from eleven industry professionals. The confidential questionnaire responses are summarized in Appendix A: Summary of Stakeholder Surveys and Interview Responses
Constraints, Concerns and Common Themes The project questionnaires asked for input from planning/economic development/real estate professionals and targeted industry leaders and stakeholders on the following topics:
Table 2-1: Stakeholder Questionnaire Topics
Planning / Economic Development / Real Estate Professionals
Targeted Industry Leaders / Business Owners / Stakeholders
Key economic players in Fort Collins Barriers for growing industries Employer attractions in Fort Collins and the region Outlook for targeted industries – those that raise
concerns or may be excelling Local and regional land use needs/concerns Local and regional transportation needs/concerns Land assembly concerns relative to development
and redevelopment Likely locations for employment growth and possible
conflicts with City policies Targeted industry location/building requirements
Type of business and services provided Concerns with growing or locating a business in Fort
Collins Building, site, and location requirements Special utility requirements Concerns and requirements related to transportation
infrastructure Requirements for proximity to other uses, suppliers,
or facilities “Deal breakers” when considering a location Demographics of typical employees, managers,
clients Employee recruitment Expansion plans
The questionnaire responses revealed numerous common themes, summarized below. Lack of light or heavy industrially zoned land – Fort Collins has a lack (real or perceived) of quality industrial land. There are concerns about other uses infiltrating industrial areas and possibly displacing light

LAND/BUILDING NEEDS ANALYSIS FOR TARGETED INDUSTRIES
9
industrial/fabrication businesses that are valuable contributors to Fort Collins’ economic well-being (examples: along Jefferson/Highway 14 and around the Fort Collins Airport north of Mulberry). The perceived lack of available industrial zoned land within the growth boundary may be stifling the redevelopment of the River District; large industrial landowners are not likely to consider sale of their land until they can relocate to another suitable industrial site. However, the potential for the Anheuser-Busch property to redevelop in the future was not addressed in the questionnaires. Lack of larger floor plate and flexible properties for diverse uses – Stakeholders expressed a concern about a lack of adequate vacant facilities for larger employers. For example, GE Energy and AVA Solar had to go to Longmont to find suitable space. In order to attract and retain growing companies, Fort Collins needs attractive, urban-style, modern office and research complexes/office parks/campuses. Businesses require buildings that provide flexible options for growth. Companies often have diverse uses and requirements for a single site: office, fabrication/shop space, warehouse storage, laboratories, loading docks, drive-in bays, paved outdoor staging areas, hazardous materials storage, roof access, handicapped access, high speed communications lines, clean electric power, uninterruptible power supply, specialized ventilation (for labs), etc. One employer stated that there is a need for more space like, but perhaps more modern than, the Prospect Business Park. Unfortunately, the business park has been infiltrated by other uses such as a charter school, the county jail and county offices, and other changes over the last 10 years that have made it less attractive to new and growing businesses. The nearest space with similar potential is the Centerra development west of I-25. (For example, Heska started in the Prospect Business Park but now resides in Centerra.) However, Centerra has a high price tag and is a long distance from where most employees live. Colorado State University – The presence of a research university and ability to connect to it is critical. CSU is a key research partner and source of educated employees for the targeted industry clusters. It is important to continue to align the university curriculum to current and future job prospects (for example, in natural resources and related disciplines). One employer reported a drop-off in qualified technical candidates as the university/students focus more on other non-technical degree programs. Additionally, decreasing government support of higher education is an ongoing financial challenge or the university and the state as a whole. Underdeveloped entrepreneurial culture and social/financial network – Stakeholders reported a lack of financing and venture or angel capital sources for start-up ventures. Respondents stated that Fort Collins also lacks up-front incentive dollars to help companies get their operations started. There are concerns that there are too few local “clusters” of like-minded firms and that Fort Collins suffers from a lack of national exposure. Respondents acknowledged that the city is very family-friendly; however, some believe it is not as attractive for younger professionals that may prefer to live in a major metropolitan area. One employer reported greater success attracting and keeping a good, high quality, young workforce at its Lower Downtown Denver location. Regional competition – There is a lot of local and national competition for the relatively small number of companies seeking to expand or relocate on an annual basis. State/county/city economic development departments, local/regional economic development organizations, utility companies, chambers of commerce, etc., are all vying to attract new companies and there are fears of developers/companies going outside Fort Collins to Loveland or along I-25 to the south. Moreover, individual community comprehensive plans have different visions of what the future holds for different areas. For example, the Fort Collins

LAND/BUILDING NEEDS ANALYSIS FOR TARGETED INDUSTRIES
10
Structure Plan (Future Land Use) map has a vision for lower density residential development east of the City's Growth Management Area (GMA) boundary for the areas east of I-25. The Town of Timnath's Future Land Use Plan shows a mix of land uses including employment, commercial, and higher density residential uses. The Timnath employment districts, which conflict with Fort Collins’ rural lands designations, are in close proximity to I-25, and could be suitable locations for some of the targeted industry clusters that Fort Collins is trying to attract. Numerous stakeholders speculated that the regional center of economic activity seems to be shifting south (for example, Centerra). Mobility – There are big concerns related to financing transportation infrastructure: widening I-25, improving interchanges and east-west arterial streets, expanding local and regional transit, expanding the bicycle network, and assuring good (fast) access to Denver International Airport. Infill versus greenfield development – Several stakeholders noted that the City of Fort Collins seems to favor infill development; however, these stakeholders warned that it is extremely expensive and time-consuming to do infill. It is difficult for Fort Collins’ infill sites to compete with greenfield sites in terms of cost and time. There are market pressures for employers to expand to the southeast toward Loveland, Windsor, Johnstown and Greeley, where more land options are available. Interstate interchanges are a logical place for employment growth (especially the intersection of I-25 and Hwy 34) and Fort Collins’ more southern I-25 interchanges (south of Prospect and east of Lemay) seem primed for growth. That said, most targeted industry representatives indicated a clear preference for expansion in existing buildings, either by building onto their existing structures or by relocating to a different, larger building. Stakeholders preferred a tenant finish/alteration situation to building from scratch. City policies – Numerous stakeholders underscored the importance of City efforts to strengthen its retail base. Some respondents indicated that nearby popular retailers and restaurants (like those at Centerra) are important amenities for attracting potential employers. Some respondents also reported that the City’s development review process has recently improved, but is still not competitive with other areas and can be politically unpredictable. The perceived “no growth” political stance is seen as a barrier to development and counter to market forces that are pushing employment uses to the I-25 corridor. Additionally, some respondents asserted that on-site parking limitations (maximums) are too restrictive; three targeted industry professionals cited insufficient parking as a “deal breaker” when considering a location. Utilities – Nearly half of the targeted industry professionals mentioned that power is important to their operations. Several have specialized equipment with requirements for high voltage; additionally, needs for clean electric power and an uninterruptible power supply were also mentioned several times. One survey respondent, whose business is located outside of the city limits in Larimer County, complained of the historically unreliable power supply. The availability of 3-phase power is also important to some industries, particularly those which operate heavy machinery for industrial processes and manufacturing. In response to these concerns, 3-phase power and fiber-optic capacity were further researched as part of this study.

LAND/BUILDING NEEDS ANALYSIS FOR TARGETED INDUSTRIES
11
2.2. Available Buildings and Leasable Spaces In February and March 2009, the project team compiled data from NCEDC on the current available commercial real estate (buildings greater than 5,000 square feet) in the City of Fort Collins and Larimer County. Appendix B and Appendix C contain profile sheets with photos and details for each available building or building space in the City and County. Analysis of the aggregate NCEDC data yielded the following findings for the City of Fort Collins and greater Larimer County (including Fort Collins).
Table 2-2: City of Fort Collins Commercial Real Estate Metrics
Number of available
properties
Total Available
Building SFTotal Land Area (AC)
Mean Land
Area (Ac)
Median Land
Area (Ac)
Properties with Entire
Bldg Available
Mean Land Area (Ac) of Entire Bldg
Sites
Average Age/Year
Built
Parking Ratio (per 1,000 SF)
Multitenant properties
Mean % vacant of
multi-tenant bldgs
Industrial 20 392,082 59.1 3.48 1.89 5 1.59 1984 1.66 13 45.61%Office 32 389,600 61.8 2.38 1.06 12 1.16 1984 3.23 n/a n/aFlex 8 270,682 80.7 16.14 3.27 4 1.9 1986 2.5 5 85.38%Retail 40 709,595 186.4 6.01 1.65 13 2.88 1983 3.41 n/a n/aTotal 100 1,761,959 388 4.89 1.38 34 1.99 1984 2.86 18 56.66%% of County 62.89% 50.08% 46.78% 53.97%
Source: NCEDC, Available Commercial Real Estate 5,000+ sf database, 2009
Table 2-3: Larimer County (including City of Fort Collins) Commercial Real Estate Metrics
Number of available
properties
Total Available
Building SFTotal Land
Area (Ac)
Mean Land
Area (Ac)
Median Land
Area (Ac)
Properties with Entire
Bldg Available
Mean Land Area (Ac) of Entire Bldg
Sites
Average Age/Year
Built
Parking Ratio (per 1,000 SF)
Multitenant properties
Mean % vacant of
multi-tenant bldgs
Industrial 42 1,524,458 370.648 10.02 1.89 19 16 1982 1.87 20 57.19%Office 45 611,624 90.3687 2.44 1.58 17 1 1990 3.39 n/a n/aFlex 15 437,437 105.1526 8.76 2.63 7 3.03 1986 3.5 9 72.43%Retail 57 944,940 263.3293 6.27 1.71 20 2.81 1984 3.51 n/a n/aTotal 159 3,518,459 829.5 6.48 1.85 63 7.06 1985 3.04 29 61.92%
Source: NCEDC, Available Commercial Real Estate 5,000+ sf database, 2009 The NCEDC data show that there are 159 available commercial properties in Larimer County, 100 of which are located within the City of Fort Collins. These available properties represent over 3.5 million square feet of available building space in the county and nearly 1.8 million square feet in the city.

LAND/BUILDING NEEDS ANALYSIS FOR TARGETED INDUSTRIES
12
2.3. Building Type Profiles None of the targeted industry clusters studied is housed in a single type of building. However, depending on the particular business/industrial process being housed, it is possible to identify the most likely building types for that stage of the business/industrial process. With this in mind, URS identified the typical commercial/employment building types and site requirements for the five targeted industry clusters and analyzed their key features. This information is presented as building type profiles for the following major commercial building types.
Warehouse Distribution o Regional Warehouse o Refrigerated Distribution
Manufacturing o Light Manufacturing o Heavy Manufacturing
Flex o Research & Development Flex o Office Showroom
Multitenant Data Switch Center Office (single or multi-story) Retail (in-line or pad) Vertical Mixed Use Special Purpose/Other
Each building type profile contains a photo and address of a local example, as well as a description of the building function and its size parameters.

LAND/BUILDING NEEDS ANALYSIS FOR TARGETED INDUSTRIES
13
Table 2-4: Building Type Profile: Regional Warehouse
Local Example: 4800 Innovation Drive – Oakridge Business Park
25,945 square feet
4,500 square feet office
Land Area: 2.59 Acres
Function Serve local and regional markets for storing and distributing goods.
Size (Sq. ft.) 20,000 to 100,000 plus square feet
Office Manufacturing Cooler/Freezer Building Uses
Up to 25% Up to 10% Up to 5%
Ceiling Height 16’ – 24’
Bldg. Footprint Generally rectangular
Tenancy Single tenants, but can be retrofitted for multi-tenant use
Dock Ratio 1: 5,000 – 15,000
Site Coverage 40% - 50% of site area
Comments Regional warehouses serve tenants who store and distribute goods. These tenants range from small, local distributors to large manufacturing companies. Regional warehouses represent the largest number of facilities in warehousing and distribution buildings. When the office buildout within a regional warehouse is greater than the typical 25% or less, these facilities are often referred to as “office warehouses”. The interior configuration of regional warehouses depends highly on the individual tenant (or tenants) and their primary business functions. There are typically few manufacturing activities conducted within regional warehouses.
Chip Design/ Research &
Development Software/GIS Biosciences Clean Energy Uniquely Fort
Collins Targeted Industry Users
Sources: Guide to Classifying Industrial Property (Second Edition), Urban Land Institute, 2003; Fort Collins Land Building Analysis, Available Commercial Real Estate, NCEDC, 2009-03-04; MSN Live Maps, 2009; and research by URS Corporation

LAND/BUILDING NEEDS ANALYSIS FOR TARGETED INDUSTRIES
14
Table 2-5: Building Type Profile: Refrigerated Distribution
Local Example: 3620 Weicker Drive
Approximately 250,000 Square Feet
Function Short-term storage and distribution of perishable goods.
Size (Sq. ft.) 20,000 to 100,000 or more square feet
Office Manufacturing Cooler/Freezer Building Uses
Up to 15% Some food processing Over 25%
Ceiling Height 20’ – 30’ +
Bldg. Footprint Typically rectangular
Tenancy Single-user
Dock Ratio 1:7-10,000
Site Coverage 40% - 50% of site area
Comments These facilities are generally divided into sections: The cooler or freezer, dry storage, and office space. The docks are typically temperature controlled, to seal and protect from outdoor temperatures. There is not usually a need for trailer storage, and the number of employees is comparatively low, thus requiring less parking and higher overall site coverage. Examples of these buildings include beer distributors, produce distribution, frozen food distribution, etc.
Chip Design/ Research &
Development Software/GIS Biosciences Clean Energy Uniquely Fort
Collins Targeted Industry Users
Sources: Guide to Classifying Industrial Property (Second Edition), Urban Land Institute, 2003; Fort Collins Land Building Analysis, Available Commercial Real Estate, NCEDC, 2009-03-04; MSN Live Maps, 2009; and research by URS Corporation
LAND/BUILDING NEEDS ANALYSIS FOR TARGETED INDUSTRIES
15
Table 2-6: Building Type Profile: Light Manufacturing
Local Example: 720 E. Vine Drive
30,740 Square Feet
Land Area: 1.25 Acres
Function Wide range of functions including manufacturing, warehousing, and distribution.
Size (Sq. ft.) 15,000 to 300,000 square feet
Office Manufacturing Rail Building Uses
Up to 20% 50% – 75% Occasionally, Exterior
Ceiling Height 14’ – 24’
Bldg. Footprint Varies
Tenancy Single tenant or multi-tenant
Dock Ratio 1: 10,000 – 15,000
Site Coverage 30% - 40% of site area
Comments Light manufacturing buildings typically require a large amount of power (avg. 2,000 amperes). Because of the parking requirements associated with the number of employees, these facilities usually cover less of the site than a heavy manufacturing or warehousing facility. Light manufacturing facilities generally rely on a heavier amount of truck transport than heavy manufacturing, which rely more on rail services. These buildings are difficult to classify because they often resemble facilities used for warehousing or heavy manufacturing.
Chip Design/ Research &
Development Software/GIS Biosciences Clean Energy Uniquely Fort
Collins Target Industry Users
Sources: Guide to Classifying Industrial Property (Second Edition), Urban Land Institute, 2003; Fort Collins Land Building Analysis, Available Commercial Real Estate, NCEDC, 2009-03-04; MSN Live Maps, 2009; and research by URS Corporation

LAND/BUILDING NEEDS ANALYSIS FOR TARGETED INDUSTRIES
16
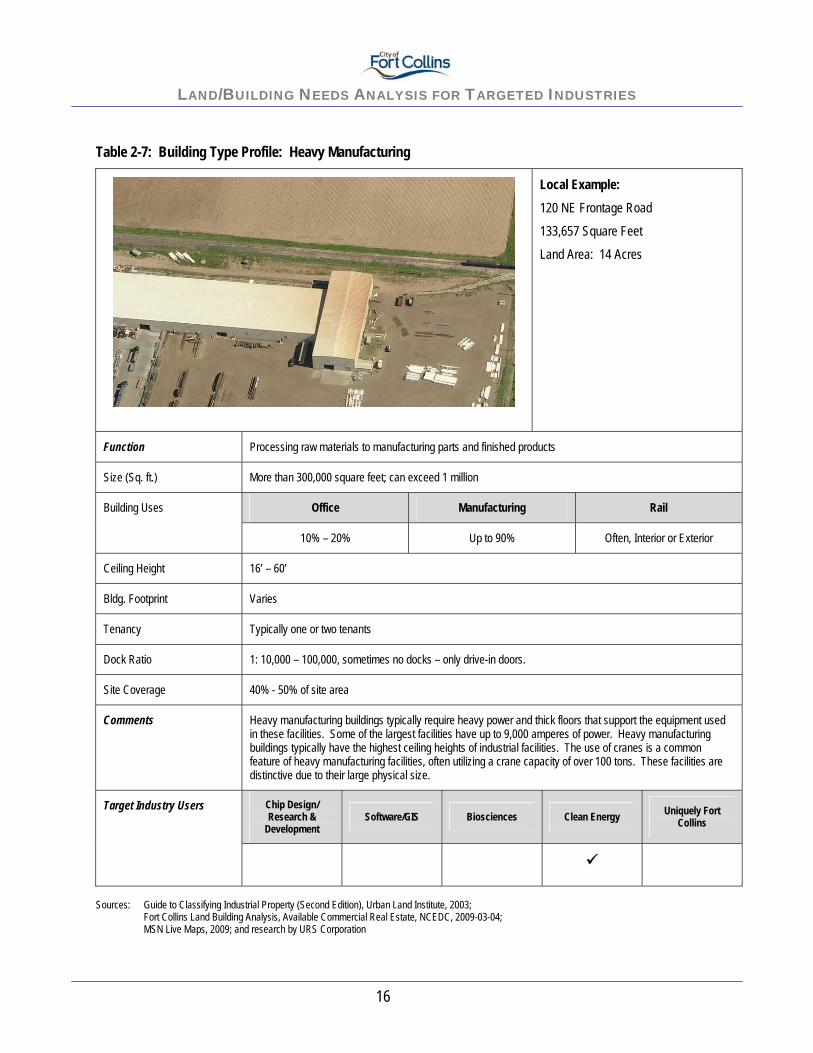
Table 2-7: Building Type Profile: Heavy Manufacturing
Local Example: 120 NE Frontage Road
133,657 Square Feet
Land Area: 14 Acres
Function Processing raw materials to manufacturing parts and finished products
Size (Sq. ft.) More than 300,000 square feet; can exceed 1 million
Office Manufacturing Rail Building Uses
10% – 20% Up to 90% Often, Interior or Exterior
Ceiling Height 16’ – 60’
Bldg. Footprint Varies
Tenancy Typically one or two tenants
Dock Ratio 1: 10,000 – 100,000, sometimes no docks – only drive-in doors.
Site Coverage 40% - 50% of site area
Comments Heavy manufacturing buildings typically require heavy power and thick floors that support the equipment used in these facilities. Some of the largest facilities have up to 9,000 amperes of power. Heavy manufacturing buildings typically have the highest ceiling heights of industrial facilities. The use of cranes is a common feature of heavy manufacturing facilities, often utilizing a crane capacity of over 100 tons. These facilities are distinctive due to their large physical size.
Chip Design/ Research &
Development Software/GIS Biosciences Clean Energy Uniquely Fort
Collins Target Industry Users
Sources: Guide to Classifying Industrial Property (Second Edition), Urban Land Institute, 2003; Fort Collins Land Building Analysis, Available Commercial Real Estate, NCEDC, 2009-03-04; MSN Live Maps, 2009; and research by URS Corporation
LAND/BUILDING NEEDS ANALYSIS FOR TARGETED INDUSTRIES
17
Table 2-8: Building Type Profile: Research & Development Flex
Local Example: 1600 Prospect Parkway
26,200 Square Feet
Land Area: 3.27 Acres
Function Mostly used as high-tech manufacturing, laboratories, and/or office space.
Size (Sq. ft.) 20,000 to 100,000 square feet
Office Warehouse Laboratory/Manufacturing Building Uses
25% – 75% Below 20% 25% – 75%
Ceiling Height 10’ – 18’
Bldg. Footprint Varies
Tenancy Mostly multitenant
Dock Ratio Averages 1:20,000
Site Coverage Typically 25% - 50% of site area
Comments R&D Flex buildings typically have a higher curb appeal than other industrial facilities. They often include professionally landscaped grounds, and a higher emphasis on parking lots due to the greater number of employees. These buildings often require laboratory or “clean” space, which further differentiate them from other manufacturing and warehousing facilities. The office-like setting of an R&D building typically sees less truck traffic on site. R&D flex space is often appealing to high-tech assembly. These buildings typically have attractive building facades.
Chip Design/ Research &
Development Software/GIS Biosciences Clean Energy Uniquely Fort
Collins Target Industry Users
Sources: Guide to Classifying Industrial Property (Second Edition), Urban Land Institute, 2003; Fort Collins Land Building Analysis, Available Commercial Real Estate, NCEDC, 2009-03-04; MSN Live Maps, 2009; and research by URS Corporation

LAND/BUILDING NEEDS ANALYSIS FOR TARGETED INDUSTRIES
18
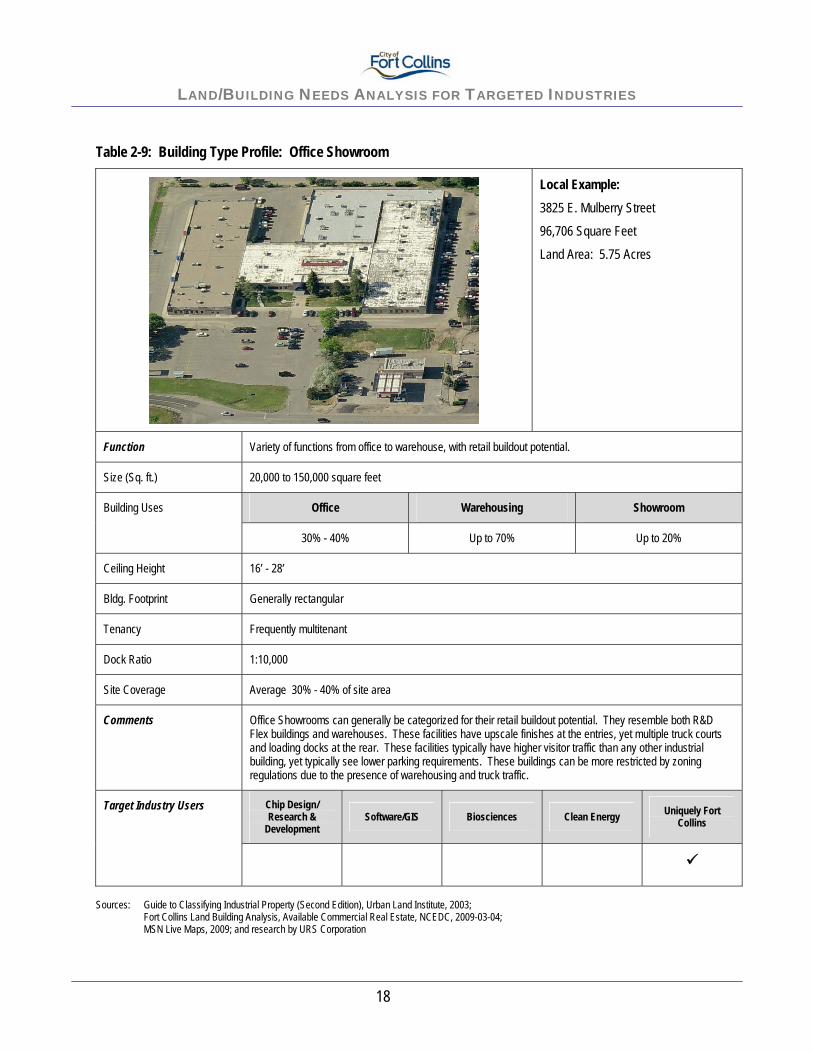
Table 2-9: Building Type Profile: Office Showroom
Local Example: 3825 E. Mulberry Street
96,706 Square Feet
Land Area: 5.75 Acres
Function Variety of functions from office to warehouse, with retail buildout potential.
Size (Sq. ft.) 20,000 to 150,000 square feet
Office Warehousing Showroom Building Uses
30% - 40% Up to 70% Up to 20%
Ceiling Height 16’ - 28’
Bldg. Footprint Generally rectangular
Tenancy Frequently multitenant
Dock Ratio 1:10,000
Site Coverage Average 30% - 40% of site area
Comments Office Showrooms can generally be categorized for their retail buildout potential. They resemble both R&D Flex buildings and warehouses. These facilities have upscale finishes at the entries, yet multiple truck courts and loading docks at the rear. These facilities typically have higher visitor traffic than any other industrial building, yet typically see lower parking requirements. These buildings can be more restricted by zoning regulations due to the presence of warehousing and truck traffic.
Chip Design/ Research &
Development Software/GIS Biosciences Clean Energy Uniquely Fort
Collins Target Industry Users
Sources: Guide to Classifying Industrial Property (Second Edition), Urban Land Institute, 2003; Fort Collins Land Building Analysis, Available Commercial Real Estate, NCEDC, 2009-03-04; MSN Live Maps, 2009; and research by URS Corporation

LAND/BUILDING NEEDS ANALYSIS FOR TARGETED INDUSTRIES
19
Table 2-10: Building Type Profile: Multitenant
Local Example: 3201 E. Mulberry Street
94,595 Square Feet
Land Area: 4.47 Acres
Function Variety of functions to accommodate multiple tenants including office space, showroom, manufacturing, and sometimes telecommunications.
Size (Sq. ft.) 20,000 to 120,000 square feet; average is about 80,000 square feet
Office Manufacturing/Warehousing Retail Building Uses
Up to 50% Up to 60% Sometimes
Ceiling Height 16’-24’
Bldg. Footprint Often ‘L’ or ‘U’ shaped, rarely rectangular
Tenancy Always Multitenant
Dock Ratio Varies
Site Coverage 40% - 50% of site area
Comments Multitenant buildings are often distinguished from R&D Flex and Office Showroom by the less appealing façade treatments used. Loading docks and truck traffic may be present on any given elevation. Generally, an individual tenant may occupy between 5% and 25% of the total building. These multitenant buildings tend to maximize the use of the site resulting in high site coverage percentages. Multitenant facilities can accommodate any range of businesses needing smaller industrial space.
Chip Design/ Research &
Development Software/GIS Biosciences Clean Energy Uniquely Fort
Collins Target Industry Users
Sources: Guide to Classifying Industrial Property (Second Edition), Urban Land Institute, 2003; Fort Collins Land Building Analysis, Available Commercial Real Estate, NCEDC, 2009-03-04; MSN Live Maps, 2009; and research by URS Corporation

LAND/BUILDING NEEDS ANALYSIS FOR TARGETED INDUSTRIES
20
Table 2-11: Building Type Profile: Data Switch Center
Local Example: 4424 Innovation Drive
91,884 Square Feet
Land Area: 4.91 Acres (Could be converted to data switch center if fiber optic cable is available.)
Function Housing high-tech data equipment and access to fiber optic cable.
Size (Sq. ft.) 15,000 to 300,000 square feet
Office Manufacturing Power Building Uses
1% 0% 60-200 Watts psf
Ceiling Height 14’+
Bldg. Footprint Varies
Tenancy Single
Dock Ratio Usually 0 (Zero); no loading requirements
Site Coverage 40% - 60% of site area
Comments Data switch centers can be differentiated from other industrial properties by certain exterior components, and user requirements. Because of the equipment housed within the facility, security and power is of utmost importance. These buildings usually require minimal wall and roof penetrations in order to maintain building dryness as well as provide the most security possible. There may be larger utility areas on the exterior for power generators, HVAC, fire suppression and security. The equipment inside the structures often requires floor loads of more than 150 pounds per square foot. Security is a key element for these facilities, often utilizing trained guards, surveillance cameras, fenced campuses, motion detectors and more. These buildings can either be redeveloped from older buildings, or constructed as newer high-tech facilities.
Chip Design/ Research &
Development Software/GIS Biosciences Clean Energy Uniquely Fort
Collins Target Industry Users
Sources: Guide to Classifying Industrial Property (Second Edition), Urban Land Institute, 2003; Fort Collins Land Building Analysis, Available Commercial Real Estate, NCEDC, 2009-03-04; MSN Live Maps, 2009; and research by URS Corporation

LAND/BUILDING NEEDS ANALYSIS FOR TARGETED INDUSTRIES
21
Table 2-12: Building Type Profile: Office (single or multi-story)
Local Example: 2809 E. Harmony Road
57,031 Square Feet
3-story building
Function Provide space for typical office use, applicable equipment, and necessary employee amenities.
Size (Sq. ft.) 5,000 to 300,000 plus square feet
Office Other Services Parking Building Uses
90+ percent loading/delivery, storage 1:250 sf
Ceiling Height 10-18’
Bldg. Footprint Varies, often irregular shaped
Tenancy Often multi-tenant
Dock Ratio Usually 0 (Zero); no loading requirements
Site Coverage 25% - 50% of site area
Comments Office buildings typically maintain a cleaner environment than industrial buildings, with well-maintained landscaping and façade treatments. Parking requirements are typically higher with office buildings because of the number of employees using the facilities during peak time. These buildings require a normal amount of power supply in order to handle the HVAC systems and run necessary equipment, but are not typically running high-powered equipment. Office buildings can be either single-story structures, or multi-story buildings depending on the size of the companies and number of employees.
Chip Design/ Research &
Development Software/GIS Biosciences Clean Energy Uniquely Fort
Collins Target Industry Users
Sources: Guide to Classifying Industrial Property (Second Edition), Urban Land Institute, 2003; Fort Collins Land Building Analysis, Available Commercial Real Estate, NCEDC, 2009-03-04; MSN Live Maps, 2009; and research by URS Corporation

LAND/BUILDING NEEDS ANALYSIS FOR TARGETED INDUSTRIES
22
Table 2-13: Building Type Profile: Retail (in-line or pad)
Local Example: 4636 S. Mason Street
10,000 Square Feet
Land Area: 0.96 Acres
Function Facilities used for short term storage and display of goods ready for sale or immediate distribution.
Size (Sq. ft.) 5,000 to 150,000 plus square feet
Office Warehouse/Manufacturing Parking Required Building Uses
Less than 10% 15-20% High
Ceiling Height 12’-28’
Bldg. Footprint Varies
Tenancy Mostly multitenant
Dock Ratio 1:50,000
Site Coverage 25% - 50% of site area
Comments Retail buildings usually require a relatively high number of parking spaces due to peak demand hours. Although retail buildings often include a number of tenants, individual pad sites are common. Retail buildings range from small boutique style shops on the first floor of vertically mixed-use buildings, to massive “big box” retail stores and power centers. Small retail buildings do not require loading docks, but rather incorporate loading zones and delivery access into the rear of the building. Larger retailers utilize loading docks, and generally have higher ceiling requirements and floor thickness to withstand heavy equipment and stacks of shelving. Depending on the type and value of goods for sale, transparent storefronts are often desired, and security systems may be more complex. Retail buildings generally have appealing façade treatments and are well-landscaped.
Chip Design/ Research &
Development Software/GIS Biosciences Clean Energy Uniquely Fort
Collins Target Industry Users
Sources: Guide to Classifying Industrial Property (Second Edition), Urban Land Institute, 2003; Fort Collins Land Building Analysis, Available Commercial Real Estate, NCEDC, 2009-03-04; MSN Live Maps, 2009; and research by URS Corporation

LAND/BUILDING NEEDS ANALYSIS FOR TARGETED INDUSTRIES
23
Table 2-14: Building Type Profile: Vertical Mixed-Use
Local Example: 151 North College Avenue
6,100 Square Feet
Stories: 2
Land Area: 0.11 Acres
Function Facility used for multiple functions typically including retail, office, and residential.
Size (Sq. ft.) 5,000 to 100,000 plus
Retail Office Other Building Uses
First floor (up to 50%) Second floor (0 to 50%) Residential, storage, civic, restaurant, services, etc.
Ceiling Height 12’ +
Bldg. Footprint Varies
Tenancy Multitenant
Dock Ratio n/a
Site Coverage varies
Comments Vertical Mixed-Use buildings allow different tenants with different needs to locate within a single structure. Vertically mixed-use buildings maximize space, allow different uses to be in close proximity, and are desirable in traditional downtowns as well as new urbanism developments. Parking is often a concern with vertical mixed-use buildings, as these structures oftentimes rely on on-street parking or off-site parking facilities. A typical 3-story vertical mixed-use building would include retail on the first floor, office on the second, and residential on the third floor. Façade treatments on these types of buildings are generally appealing, and often historic in nature. Tree-lined streets are common, providing separation of the automobile and pedestrian environments.
Chip Design/ Research &
Development Software/GIS Biosciences Clean Energy Uniquely Fort
Collins Target Industry Users
Sources: Guide to Classifying Industrial Property (Second Edition), Urban Land Institute, 2003; Fort Collins Land Building Analysis, Available Commercial Real Estate, NCEDC, 2009-03-04; MSN Live Maps, 2009; and research by URS Corporation

LAND/BUILDING NEEDS ANALYSIS FOR TARGETED INDUSTRIES
24
2.4. Building Features and Site Characteristics by Building Type The preceding building type profiles and associated research were used to compile the following summary tables of building features and site characteristics by building type. This information was used to develop planning ratios and other factors that describe the relationship between building type, employee density, site development density, and land requirements for different targeted industries, which are summarized on the tables below. This information was later evaluated to help formulate quantitative planning ratios and other criteria that could be used in the GIS analysis. Table 2-15: Building Features by Building Type
Building Type Building Size (SF) # Floors Ceiling Height Dock Ratio* Image** Shape Occupancy Utilities
Warehouse DistributionRegional Warehouse 20,000 to 100,000+ 1 16-24 1:5-15,000 low regular single or multi-user normalRefrigerated Distribution 20,000 to 100,000+ 1 20-30 1:7-10,000 low regular single user high power
ManufacturingLight Manufacturing 15,000 to 300,000 1 14-24 1:10-15,000 low regular single user high powerHeavy Manufacturing 300,000 to 1 million+ 1 16-60 varies low regular single user high power
FlexR&D Flex 20,000 to 100,000 1 10-18 1:20,000 high irregular multi-user lab/clean roomsOffice Showroom 20,000 to 150,000 1 16-28 1:10:000 high irregular multi-user normal
Multitenant 20,000 to 120,000 1 16-24 varies medium irregular multi-user lower powerData Switch Center 15,000 to 300,000 varies 14+ N/A low regular single user high power w/redundancyOffice (single or multi-story) 5,000 to 300,000+ several 12 N/A high irregular multi-user normalRetail (in-line or pad) 5,000 to 150,000+ 1 12-28 N/A high irregular single or multi-user normalSpecial Purpose/Other any varies 12+ N/A high irregular multi-user normalVertical Mixed-Use any several 12+ N/A high irregular multi-user normal
Sources: Guide to Classifying Industrial Property (Second Edition), Urban Land Institute, 2003, and research by URS.* Dock Ratio refers to the number of required docks/open loading zones per square footage** Image refers to the overall quality of the appearance of the exterior of the facility
Table 2-16: Site Characteristics by Building Type
Bldg Type Building Size (SF) Parking Employees
Parking Customers
Truck Access and Loading Rail Access Site Coverage Site Area*
Warehouse DistributionRegional Warehouse 20,000 to 100,000+ yes (low) no yes no 40-50% 2 to 6 acres +Refrigerated Distribution 20,000 to 100,000+ yes (low) no yes occasionally 40-50% 2 to 6 acres +
ManufacturingLight Manufacturing 15,000 to 300,000 yes (high) no yes occasionally 30-40% 1 to 20 acres +Heavy Manufacturing 300,000 to 1 million+ yes (low) no yes occasionally 40-50% 10 to 50 acres +
FlexR&D Flex 20,000 to 100,000 yes (high) no yes no 25-40% 1 to 9 acresOffice Showroom 20,000 to 150,000 yes (low) yes (high) yes no 30-40% 1 to 12 acres
Multitenant 20,000 to 120,000 yes (depends) yes (depends) yes no 40-50% 1 to 7 acresData Switch Center 15,000 to 300,000 yes (very low) no no no 40-60% 0.6 to 18 acres +Office (single or multi-story) 5,000 to 300,000+ yes (high) no no no 25-50% 0.25 to 28 acres +Retail (in-line or pad) 5,000 to 150,000+ yes (low) yes (high) rear no 25-50% 0.25 to 14 acres +Special Purpose/Other any yes (high) yes (high) no no varies variesVertical Mixed-Use any yes (high) yes (high) no no varies varies
* Site Area range determined by multiplying the lowest building size by the highest site coverage, and conversely the highest building size by the lowest site coverage.
Sources: Planner's Estimating Guide, Projecting Land-Use and Facility Needs, Arthur C. Nelson, FAICP, 2004

LAND/BUILDING NEEDS ANALYSIS FOR TARGETED INDUSTRIES
25
2.5. Building Type and Site Area by Targeted Industry Cluster The building types and site area requirements were also evaluated in terms of their applicability to the five targeted industry clusters, which yields information about which building types and parcel /site areas are associated with the respective targeted industry clusters. None of the targeted industry clusters studied is housed in a single building or facility type. For example, an office, multitenant, flex, light manufacturing, industrial manufacturing, and/or a warehouse building may be suitable for a Clean Energy business. Similarly, Biosciences may find suitable as wide a range of facilities as Clean Energy, particularly if there is a large scale agricultural production element that requires greenhouses and outdoor facilities. Chip Design/Research and Development requires light manufacturing facilities in addition to office, multitenant, and Flex; while Software/GIS has a narrower spectrum – office, multitenant or flex. Nearly all building types identified might be suitable for the broad Uniquely Fort Collins category. For all clusters there is the possibility of special purpose and customized facilities, which are treated as a separate category. Table 2-17 summarizes typical building types by targeted industry cluster.
Table 2-17: Typical Building Type by Targeted Industry Cluster
Building TypeChip Design/ Research &
Development
Software/GIS Biosciences Clean Energy
Uniquely Fort Collins (Artistic
and Cultural Entertainment)
Uniquely Fort Collins
(Recreation and Retail)
Uniquely Fort Collins
(Hospitality)
Warehouse DistributionRegional WarehouseRefrigerated Distribution
ManufacturingLight ManufacturingHeavy Manufacturing
FlexR&D FlexOffice Showroom
MultitenantData Switch CenterOffice (single or multi-story)Retail (in-line or pad)Special Purpose/OtherVertical Mixed-Use
Source: Research and analysis conducted by URS The different targeted industries also tend to be associated with a range of parcel sizes that reflects the size and configuration of the building(s), vehicular access, parking, and outdoor equipment and material storage. Table 2-18 summarizes typical parcel/site areas by targeted industry cluster.

LAND/BUILDING NEEDS ANALYSIS FOR TARGETED INDUSTRIES
26
Table 2-18: Typical Site Area by Targeted Industry Cluster
Site Area*Chip Design/ Research &
Development
Software/GIS Biosciences Clean Energy
Uniquely Fort Collins (Artistic
and Cultural Entertainment)
Uniquely Fort Collins
(Recreation and Retail)
Uniquely Fort Collins
(Hospitality)
0-1 acre1-5 acres5-10 acres10-20 acres20-50 acres 50-100 acres100+ acres
Source: Research and analysis conducted by URS* Site Area categories defined to match classification of the Buildable Land Inventory
Rail Access Rail access is important for heavy industrial users. The following map (Exhibit 2-1) shows the location of existing rail lines. However, presence of rail line does not mean that access to that rail line is possible. Obtaining access and constructing spurs is a complex process. However, there are currently railroad spurs off the BNSF track in the vicinity of Anheuser-Busch that could be expanded.
3-Phase Power The availability of 3-phase power is important to many businesses, particularly those which operate heavy machinery for industrial processes and manufacturing. In general, 3-phase power lines exist along all major arterials within the city limits. Additional information in this area can be provided by: Bob Micek, City of Fort Collins Utilities, at 970-416-2724 or e-mail to [email protected].
Fiber Optics Cable In 1998 the City of Fort Collins Utilities, in partnership with the Platte River Power Authority (PRPA), began construction of an extensive fiber optics system in the City of Fort Collins which interconnects with similar systems in the neighboring cities of Loveland, Longmont, and Estes Park to form a regional fiber system in the Front Range area of Northern Colorado. The system was originally constructed to provide telecommunications capabilities for the electric utility, but was “overbuilt” using 144-strand cables to provide for future growth and to help local public and commercial agencies meet their own needs for high-speed telecommunications. Today, approximately 1/3 of the 26.2 mile backbone fiber optics loop in Fort Collins is in use by local public agencies such as the City of Fort Collins, PRPA, Colorado State University, Larimer County, the Poudre Fire Authority, the Poudre School District, and the Poudre Valley Hospital System. An additional 1/3 of the backbone fiber has been leased as “dark fiber” to commercial telecom services providers who provide high-speed voice, video and data services to their customers in the area. The remaining dark fiber strands are available for lease at very competitive rates. Additional information in this area can be provided by: Eric Dahlgren, City of Fort Collins Utilities, at 970-221-6712 or e-mail to [email protected].

LAND/BUILDING NEEDS ANALYSIS FOR TARGETED INDUSTRIES
27

LAND/BUILDING NEEDS ANALYSIS FOR TARGETED INDUSTRIES
28
2.6. Land Use and Zoning The targeted industry clusters require key land uses in their activities/processes, most of which are regulated by the Fort Collins zone districts. The table below provides a summary of typical land uses that would need to be allowed for that targeted industry to conduct the full range of possible uses on a particular site.
Table 2-19: Typical Land Uses by Targeted Industry
Warehouse (all types)
Heavy Manufacturing
Light Manufacturingand Assembly
Labs/ HighTech Office Retail
Parking Lots/
Structures
Outdoor Storage
ResourceExtraction Composting Entertainment
Facilities
Chip Design/Research & DevelopmentSoftware/GISBiosciencesClean Energy
Uniquely Fort Collins (Artistic and Cultural Entertainment)Uniquely Fort Collins (Recreation and Retail)Uniquely Fort Collins (Hospitality)
Source: Research and analysis conducted by URS On a more detailed level, the targeted industry cluster land uses were compared to the allowable land uses in the City of Fort Collins zone districts. Zoning summaries (Table 2-19 through Table 2-24) highlight the Fort Collins zone districts that have appropriate allowable land uses for each of the five targeted industry clusters.

LAND/BUILDING NEEDS ANALYSIS FOR TARGETED INDUSTRIES
29
Table 2-20: Chip Design / Research and Development – Suitable Districts for Industry Development
CHIP DESIGN / RESEARCH & DEVELOPMENTSuitable Districts for Industry Development
Zone District
Warehouse (all types)
Heavy Manufacturing
Light Manufacturingand Assembly
Labs/ HighTech Office Retail
Parking Lots/
Structures
Outdoor Storage
ResourceExtraction Composting Entertainment
Facilities
C A A A/P P P-retail/supply P PCC A A A A/P P PCCN A A A A ACCR A A P ACL B/A/RO B NR/A B B/A RO/B RO/A-towing B/ACN A A A A A/P A A-retail/supply AD A A A/B P/B P A/P/BE A A A A A AHC A A AHMN AI A A A A A A A/P P ALMN P (<500' of E. Vine) P/Ax Ax(<5000 sf)MMN P NC A A A PNCB ANCLNCMRC P-no RTZ ARFRLRUL P AUE P P
Sources: Research and analysis conducted by URS. Zoning information provided by the City of Fort Collins.
LEGENDB Basic Development ReviewA Administrative ReviewP Planning and Zoning Board Review
Ax
Px
NR Non-Riverside Area Only (CL zone)RO Riverside Area Only (CL zone)
Adiminstrative Review, must be combined with another allowed use in the Zone to form a Neighborhood CenterPlanning and Zoning Board Review, must be combined with another allowed use to form a Neighborhood Center
Essential land use for target industry cluster
Desirable land use for target industry cluster
Potentially suitable for target industry cluster (one or more essential or desirable uses permitted)
Highly suitable for target industry cluster (all essential & desirable land uses permitted)

LAND/BUILDING NEEDS ANALYSIS FOR TARGETED INDUSTRIES
30
Table 2-21: Software / GIS – Suitable Districts for Industry Development
SOFTWARE / GIS Suitable Districts for Industry Development
Zone District
Warehouse (all types)
Heavy Manufacturing
Light Manufacturingand Assembly
Labs/ HighTech Office Retail
Parking Lots/
Structures
Outdoor Storage
ResourceExtraction Composting Entertainment
Facilities
C A A A/P P P-retail/supply P PCC A A A A/P P PCCN A A A A ACCR A A P ACL B/A/RO B NR/A B B/A RO/B RO/A-towing B/ACN A A A A A/P A A-retail/supply AD A A A/B P/B P A/P/BE A A A A A AHC A A AHMN AI A A A A A A A/P P ALMN P (<500' of E. Vine) P/Ax Ax(<5000 sf)MMN P NC A A A PNCB ANCLNCMRC P-no RTZ ARFRLRUL P AUE P P
Sources: Research and analysis conducted by URS. Zoning information provided by the City of Fort Collins.
LEGENDB Basic Development ReviewA Administrative ReviewP Planning and Zoning Board Review
Ax
Px
NR Non-Riverside Area Only (CL zone)RO Riverside Area Only (CL zone)
Adiminstrative Review, must be combined with another allowed use in the Zone to form a Neighborhood CenterPlanning and Zoning Board Review, must be combined with another allowed use to form a Neighborhood Center
Essential land use for target industry cluster
Desirable land use for target industry cluster
Potentially suitable for target industry cluster (one or more essential or desirable uses permitted)
Highly suitable for target industry cluster (all essential & desirable land uses permitted)

LAND/BUILDING NEEDS ANALYSIS FOR TARGETED INDUSTRIES
31
Table 2-22: Biosciences – Suitable Districts for Industry Development
BIOSCIENCESuitable Districts for Target Industry Cluster
Zone District
Warehouse (all types)
Heavy Manufacturing
Light Manufacturingand Assembly
Labs/ HighTech Office Retail
Parking Lots/
Structures
Outdoor Storage
ResourceExtraction Composting Entertainment
Facilities
C A A A/P P P-retail/supply P PCC A A A A/P P PCCN A A A A ACCR A A P ACL B/A/RO B NR/A B B/A RO/B RO/A-towing B/ACN A A A A A/P A A-retail/supply AD A A A/B P/B P A/P/BE A A A A A AHC A A AHMN AI A A A A A A A/P P ALMN P (<500' of E. Vine) P/Ax Ax(<5000 sf)MMN P NC A A A PNCB ANCLNCMRC P-no RTZ ARFRLRUL P AUE P P
Sources: Research and analysis conducted by URS. Zoning information provided by the City of Fort Collins.
LEGENDB Basic Development ReviewA Administrative ReviewP Planning and Zoning Board Review
Ax
Px
NR Non-Riverside Area Only (CL zone)RO Riverside Area Only (CL zone)
Adiminstrative Review, must be combined with another allowed use in the Zone to form a Neighborhood CenterPlanning and Zoning Board Review, must be combined with another allowed use to form a Neighborhood Center
Essential land use for target industry cluster
Desirable land use for target industry cluster
Potentially suitable for target industry cluster (one or more essential or desirable uses permitted)
Highly suitable for target industry cluster (all essential & desirable land uses permitted)

LAND/BUILDING NEEDS ANALYSIS FOR TARGETED INDUSTRIES
32
Table 2-23: Clean Energy – Suitable Districts for Industry Development
CLEAN ENERGYSuitable Districts for Industry Development
Zone District
Warehouse (all types)
Heavy Manufacturing
Light Manufacturingand Assembly
Labs/ HighTech Office Retail
Parking Lots/
Structures
Outdoor Storage
ResourceExtraction Composting Entertainment
Facilities
C A A A/P P P-retail/supply P PCC A A A A/P P PCCN A A A A ACCR A A P ACL B/A/RO B NR/A B B/A RO/B RO/A-towing B/ACN A A A A A/P A A-retail/supply AD A A A/B P/B P A/P/BE A A A A A AHC A A AHMN AI A A A A A A A/P P ALMN P (<500' of E. Vine) P/Ax Ax(<5000 sf)MMN P NC A A A PNCB ANCLNCMRC P-no RTZ ARFRLRUL P AUE P P
Sources: Research and analysis conducted by URS. Zoning information provided by the City of Fort Collins.
LEGENDB Basic Development ReviewA Administrative ReviewP Planning and Zoning Board Review
Ax
Px
NR Non-Riverside Area Only (CL zone)RO Riverside Area Only (CL zone)
Adiminstrative Review, must be combined with another allowed use in the Zone to form a Neighborhood CenterPlanning and Zoning Board Review, must be combined with another allowed use to form a Neighborhood Center
Essential land use for target industry cluster
Desirable land use for target industry cluster
Potentially suitable for target industry cluster (one or more essential or desirable uses permitted)
Highly suitable for target industry cluster (all essential & desirable land uses permitted)

LAND/BUILDING NEEDS ANALYSIS FOR TARGETED INDUSTRIES
33
Table 2-24: Uniquely Fort Collins – Suitable Districts for Industry Development
UNIQUELY FORT COLLINSSuitable Districts for Industry Development
Zone District
Warehouse (all types)
Heavy Manufacturing
Light Manufacturingand Assembly
Labs/ HighTech Office Retail
Parking Lots/
Structures
Outdoor Storage
ResourceExtraction Composting Entertainment
Facilities
C A A A/P P P-retail/supply P PCC A A A A/P P PCCN A A A A ACCR A A P ACL B/A/RO B NR/A B B/A RO/B RO/A-towing B/ACN A A A A A/P A A-retail/supply AD A A A/B P/B P A/P/BE A A A A A AHC A A AHMN AI A A A A A A A/P P ALMN P (<500' of E. Vine) P/Ax Ax(<5000 sf)MMN P NC A A A PNCB ANCLNCMRC P-no RTZ ARFRLRUL P AUE P P
Sources: Research and analysis conducted by URS. Zoning information provided by the City of Fort Collins.
LEGENDB Basic Development ReviewA Administrative ReviewP Planning and Zoning Board Review
Ax
Px
NR Non-Riverside Area Only (CL zone)RO Riverside Area Only (CL zone)
Adiminstrative Review, must be combined with another allowed use in the Zone to form a Neighborhood CenterPlanning and Zoning Board Review, must be combined with another allowed use to form a Neighborhood Center
Essential land use for target industry cluster
Desirable land use for target industry cluster
Potentially suitable for target industry cluster (one or more essential or desirable uses permitted)
Highly suitable for target industry cluster (all essential & desirable land uses permitted)

LAND/BUILDING NEEDS ANALYSIS FOR TARGETED INDUSTRIES
34
2.7. Projected Land/Building Inventory by Targeted Industry Clusters The suitability analysis is presented as a series of tables and GIS maps for each industry. The BLI was the basis for analyzing vacant land in terms of suitability for each of the targeted Industries. Two levels of suitability were assessed: Highly suitable includes ideal zone districts for targeted industry clusters, adequate site area, and no identified physical constraints.
Potentially suitable includes adequate site area but some potential targeted industry land uses may not be allowed by current zoning. (For example, the current zoning may allow office use but not light industrial operations, which may also be desired by a particular company in one of the targeted industries.)
GIS analysis also enabled the suitable land to be classified by location: (1) within City limits and (2) outside city limits, but within the GMA. The total land that was analyzed in summarized in Table 2-25.
Table 2-25: Total Vacant Land Total Vacant Land Inventory
Description Areas (AC)Total Area in GMA Acres 9,336Area within City Boundaries 4,086Area outside of City Boundaries 5,250No. of Parcels* in GMA 2,598Number of Parcels within City* Boundaries 1,309Number of Parcels outside City* Boundaries 1,289Notes:1. Source: Fort Collins BLI.* Data provided by Fort Collins Advance Planning. The analysis results for the five targeted industry clusters combined are summarized in Table 2-26, based on the BLI total of 9,336 acres of vacant land.
Table 2-26: Five Targeted Industry Clusters Combined Suitable Land
Location Total Suitable Area (AC)
Highly Suitable Area (AC)
Highly Suitable Share (%)
Within City Limits 2,792 1,315 83%Outside City, Inside GMA 402 273 17%Total 3,194 1,588 100%
Notes:1. "Highly Suitable" includes ideal zone districts for Target Industry, adequate site area, and no identifed physical constraints.
3. Numbers may not sum due to rounding.
2. "Potentially Suitable" includes adequate site area, some limited physical constraints, but some potentially desirable land uses are not allowed by zoning.

LAND/BUILDING NEEDS ANALYSIS FOR TARGETED INDUSTRIES
35
Table 2-27 below, summarizes suitable lands by targeted industry cluster, using the BLI as well as approved development projects provided by Fort Collins planning staff. Note that lands listed for each industry are selected from the total BLI and the same site may be included for one, several, or all of the industries analyzed. Therefore, total suitable lands should not be summed from this table. It is also important to keep in mind the limitation associated with the potentially suitable category. As stated above, potentially suitable land lacks zoning for all the uses necessary for the targeted industry cluster and as such, is not considered "developer ready" for the full range of uses. However, it is possible that potentially suitable land might be satisfactory for one or several of the targeted industry cluster uses. In some cases, it is possible that potentially suitable parcels could be reclassified as highly suitable after rezoning, replatting, or other entitlement actions.
Table 2-27: Suitable Land Supply by Targeted Industry Cluster
Industry Highly Suitable (AC)
Potentially Suitable (AC) Total (AC) % of Target
Industry TotalChip Design/R&D 828 1,220 2,048
Within City Limits 683 979 1,662 81%Outside City, Inside GMA 145 241 386 19%
Software/GIS 1,191 1,145 2,336Within City Limits 1,024 965 1,989 85%Outside City, Inside GMA 167 180 347 15%
Bioscience 806 1,572 2,378Within City Limits 672 1,320 1,992 84%Outside City, Inside GMA 134 252 386 16%
Clean Energy 578 1,807 2,385Within City Limits 519 1,479 1,998 84%Outside City, Inside GMA 59 328 387 16%
Uniquely Fort Collins 286 2,092 2,378Within City Limits 162 1,835 1,997 84%Outside City, Inside GMA 124 257 381 16%
Source: Research by URS, and data provided by the City of Fort Collins through the BLI 2008

LAND/BUILDING NEEDS ANALYSIS FOR TARGETED INDUSTRIES
36
Chip Design / Research and Development 828 acres of land is rated highly suitable for Chip Design/R&D and 1,220 acres are rated potentially suitable. Software / GIS 1,191 acres of BLI land are rated as highly suitable for Software/GIS and 1,145 acres are potentially suitable. Biosciences 806 acres are rated highly suitable land for Biosciences and 1,572 acres are rated potentially suitable. Clean Energy 578 acres are rated highly suitable for Clean Energy and 1,807 acres are potentially suitable. Uniquely Fort Collins 286 acres of land are highly suitable for Uniquely Fort Collins and an additional 2,092 acres are potentially suitable. However, this cluster encompasses a very wide range of possible uses.

LAND/BUILDING NEEDS ANALYSIS FOR TARGETED INDUSTRIES
37

LAND/BUILDING NEEDS ANALYSIS FOR TARGETED INDUSTRIES
38

LAND/BUILDING NEEDS ANALYSIS FOR TARGETED INDUSTRIES
39

LAND/BUILDING NEEDS ANALYSIS FOR TARGETED INDUSTRIES
40

LAND/BUILDING NEEDS ANALYSIS FOR TARGETED INDUSTRIES
41

LAND/BUILDING NEEDS ANALYSIS FOR TARGETED INDUSTRIES
42
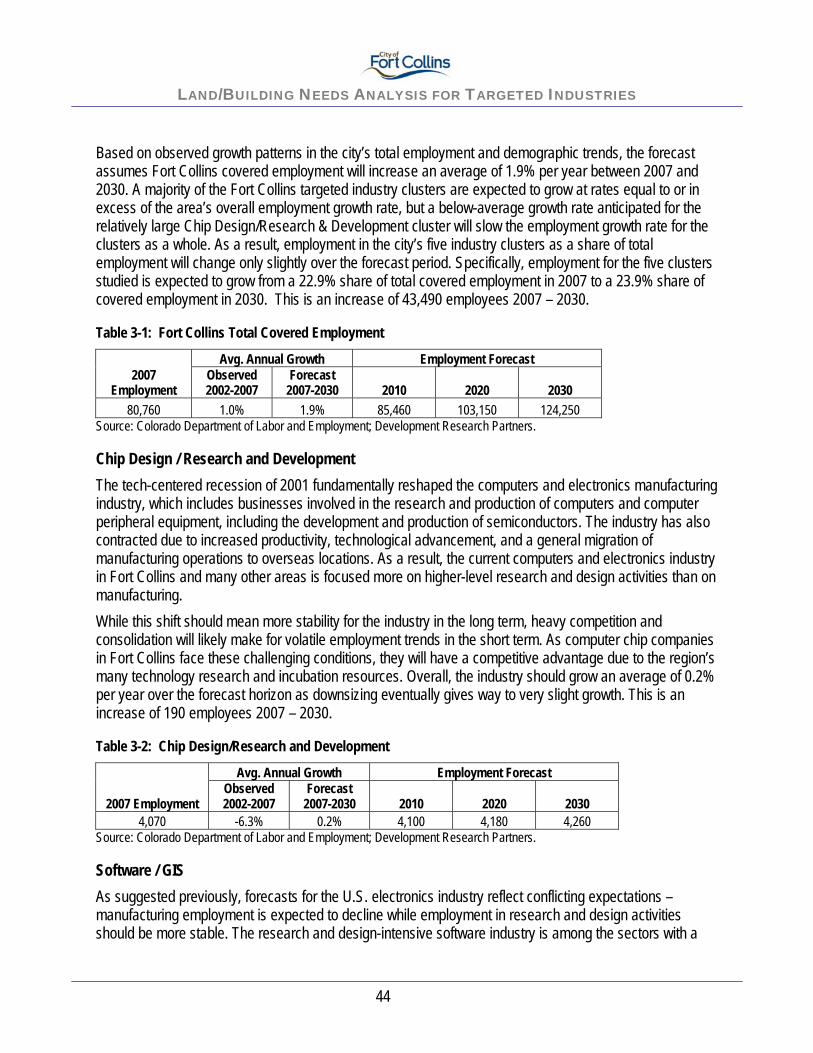
LAND/BUILDING NEEDS ANALYSIS FOR TARGETED INDUSTRIES
43
3. DEMAND
3.1. Projected Employment URS and Development Research Partners teamed to prepare a current and 20-year land/building needs outlook for the City of Fort Collins’ five targeted industry clusters. This section is excerpted from that analysis; the entire memorandum is included in Appendix D. The analysis includes a forecast for total employment growth in Fort Collins and in each targeted industry cluster over the next 20 years. While all data is based on the Fort Collins Growth Management Area, which represents an area slightly larger than the current city limits, the region is called “Fort Collins” throughout this report. The 2007 employment level is the forecast base in each analysis, and growth trends over the past five years are provided for context. Note that the 2007 base for all-industries employment used in this report – 80,760 – is lower than the 2007 base of 95,300 used in the 2007 Buildable Lands Inventory and Capacity Analysis prepared by the City of Fort Collins in January 2008. The Buildable Lands employment figure includes an adjustment for sole proprietors that was not used in this report as this particular group of workers is not expected to significantly affect demand for commercial space. Forecast total employment levels for 2010, 2020, and 2030 are based on straight-line forecasts. While this forecast acknowledges that business cycles will occur throughout this 20-year outlook, the timing and duration of future business cycles are not identified. Forecast employment growth rates are based on current industry cluster definitions. Due to shifts in market conditions and economic development priorities, the current industry cluster definitions differ slightly from those first introduced in the city’s inaugural industry cluster study Strategic Employment Opportunities: Select Industry Clusters in Fort Collins, completed by Development Research Partners and R&M Resource Development in October 2006. While the five clusters included in this analysis represent the city’s current priorities and advantages, it is likely that these industries will continue to evolve and change over time in response to future business and consumer needs, innovations, and technological shifts. Therefore, these employment forecasts should be reviewed and revised on a regular basis to account for any structural changes in the city’s key targeted industries. The following sections provide a total employment forecast for Fort Collins plus individual forecasts for each of the five industry clusters.
Fort Collins Total Employment Long-term job and population growth in Fort Collins is expected to be slower than in other parts of northern Colorado as Fort Collins is the region’s most mature community. More broadly, job growth nationwide is expected to slow over the next several decades as an aging population limits labor force growth. This does not necessarily mean, however, that job growth in Fort Collins will be slow. In fact, employment growth across the northern Colorado region is expected to exceed statewide growth over the next decade. Economists expect an increase in innovation-driven jobs as the nation’s economy continues to mature, and Fort Collins is uniquely positioned to attract such jobs with research resources from CSU and active business incubators.

LAND/BUILDING NEEDS ANALYSIS FOR TARGETED INDUSTRIES
44
Based on observed growth patterns in the city’s total employment and demographic trends, the forecast assumes Fort Collins covered employment will increase an average of 1.9% per year between 2007 and 2030. A majority of the Fort Collins targeted industry clusters are expected to grow at rates equal to or in excess of the area’s overall employment growth rate, but a below-average growth rate anticipated for the relatively large Chip Design/Research & Development cluster will slow the employment growth rate for the clusters as a whole. As a result, employment in the city’s five industry clusters as a share of total employment will change only slightly over the forecast period. Specifically, employment for the five clusters studied is expected to grow from a 22.9% share of total covered employment in 2007 to a 23.9% share of covered employment in 2030. This is an increase of 43,490 employees 2007 – 2030.
Table 3-1: Fort Collins Total Covered Employment Avg. Annual Growth Employment Forecast
2007 Employment
Observed 2002-2007
Forecast 2007-2030 2010 2020 2030
80,760 1.0% 1.9% 85,460 103,150 124,250 Source: Colorado Department of Labor and Employment; Development Research Partners.
Chip Design / Research and Development The tech-centered recession of 2001 fundamentally reshaped the computers and electronics manufacturing industry, which includes businesses involved in the research and production of computers and computer peripheral equipment, including the development and production of semiconductors. The industry has also contracted due to increased productivity, technological advancement, and a general migration of manufacturing operations to overseas locations. As a result, the current computers and electronics industry in Fort Collins and many other areas is focused more on higher-level research and design activities than on manufacturing. While this shift should mean more stability for the industry in the long term, heavy competition and consolidation will likely make for volatile employment trends in the short term. As computer chip companies in Fort Collins face these challenging conditions, they will have a competitive advantage due to the region’s many technology research and incubation resources. Overall, the industry should grow an average of 0.2% per year over the forecast horizon as downsizing eventually gives way to very slight growth. This is an increase of 190 employees 2007 – 2030.
Table 3-2: Chip Design/Research and Development Avg. Annual Growth Employment Forecast
2007 Employment Observed 2002-2007
Forecast 2007-2030 2010 2020 2030
4,070 -6.3% 0.2% 4,100 4,180 4,260 Source: Colorado Department of Labor and Employment; Development Research Partners.
Software / GIS As suggested previously, forecasts for the U.S. electronics industry reflect conflicting expectations – manufacturing employment is expected to decline while employment in research and design activities should be more stable. The research and design-intensive software industry is among the sectors with a
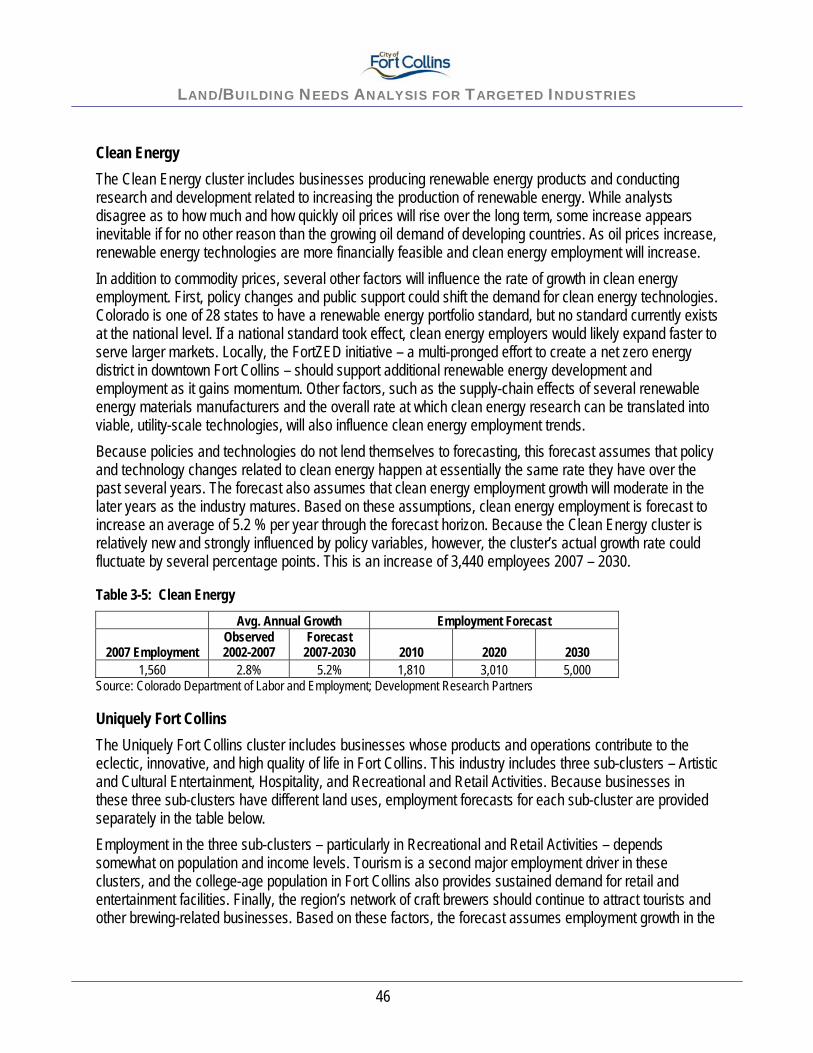
LAND/BUILDING NEEDS ANALYSIS FOR TARGETED INDUSTRIES
45
more favorable outlook, and the industry is uniquely positioned to thrive in Fort Collins thanks to a regional focus on the burgeoning field of Geographic Information Systems (GIS) technology. This cluster includes businesses providing custom computer programming services, prepackaged software, computer integrated systems design, and other computer related services. Geospatial software companies in northern Colorado’s “GIS Alley” have several key opportunities for future growth. At a broad level, increasing interest in GIS technology for businesses and governments will sustain demand for specialists who can design, implement, and maintain new software systems. At the local level, research efforts in energy conservation, forestry, and disease prevention will benefit software specialists who can create mapping tools for university researchers and bioscience companies. Overall, annual employment growth in Fort Collins’ software/GIS cluster is expected to average 1.9% per year throughout the forecast horizon. This is an increase of 1,250 employees 2007 – 2030.
Table 3-3: Software/GIS Avg. Annual Growth Employment Forecast
2007 Employment Observed 2002-2007
Forecast 2007-2030 2010 2020 2030
2,300 1.6% 1.9% 2,440 2,940 3,550 Source: Colorado Department of Labor and Employment; Development Research Partners.
Biosciences The Biosciences cluster includes a wide variety of companies – from pharmaceuticals and medical device manufacturers to veterinary service providers, environmental consultants, academic institutions, and independent laboratories. Because of this diversity, forecasters must consider a large number of often conflicting factors when they consider the industry’s long-term employment trends. For example, high drug costs and ongoing consolidations will likely slow employment growth in pharmaceuticals from the prior decade’s rapid pace. Alternatively, increased use of biotechnologies in the energy field is driving rapid bioscience research and business incubation activity. Because the Bioscience cluster is forward-looking and research intensive, largely unpredictable changes in factors including public policies, government funding, and commodity prices add additional uncertainty to the outlook for bioscience employment. These factors are likely to offset one another in the long term, however, and the bioscience industry is likely to grow at an above-average pace in an economy that increasingly favors innovation. Fort Collins is uniquely positioned to thrive in this sort of economy, because the region is an increasingly recognized hub for research and start-up activity. Overall employment growth in the bioscience cluster is expected to average 2.9% per year through the forecast horizon. This is an increase of 1,960 employees 2007 – 2030.
Table 3-4: Biosciences Avg. Annual Growth Employment Forecast
2007 Employment Observed 2002-2007
Forecast 2007-2030 2010 2020 2030
2,110 2.3% 2.9% 2,300 3,060 4,070 Source: Colorado Department of Labor and Employment; Development Research Partners

LAND/BUILDING NEEDS ANALYSIS FOR TARGETED INDUSTRIES
46
Clean Energy The Clean Energy cluster includes businesses producing renewable energy products and conducting research and development related to increasing the production of renewable energy. While analysts disagree as to how much and how quickly oil prices will rise over the long term, some increase appears inevitable if for no other reason than the growing oil demand of developing countries. As oil prices increase, renewable energy technologies are more financially feasible and clean energy employment will increase. In addition to commodity prices, several other factors will influence the rate of growth in clean energy employment. First, policy changes and public support could shift the demand for clean energy technologies. Colorado is one of 28 states to have a renewable energy portfolio standard, but no standard currently exists at the national level. If a national standard took effect, clean energy employers would likely expand faster to serve larger markets. Locally, the FortZED initiative – a multi-pronged effort to create a net zero energy district in downtown Fort Collins – should support additional renewable energy development and employment as it gains momentum. Other factors, such as the supply-chain effects of several renewable energy materials manufacturers and the overall rate at which clean energy research can be translated into viable, utility-scale technologies, will also influence clean energy employment trends. Because policies and technologies do not lend themselves to forecasting, this forecast assumes that policy and technology changes related to clean energy happen at essentially the same rate they have over the past several years. The forecast also assumes that clean energy employment growth will moderate in the later years as the industry matures. Based on these assumptions, clean energy employment is forecast to increase an average of 5.2 % per year through the forecast horizon. Because the Clean Energy cluster is relatively new and strongly influenced by policy variables, however, the cluster’s actual growth rate could fluctuate by several percentage points. This is an increase of 3,440 employees 2007 – 2030.
Table 3-5: Clean Energy Avg. Annual Growth Employment Forecast
2007 Employment Observed 2002-2007
Forecast 2007-2030 2010 2020 2030
1,560 2.8% 5.2% 1,810 3,010 5,000 Source: Colorado Department of Labor and Employment; Development Research Partners
Uniquely Fort Collins The Uniquely Fort Collins cluster includes businesses whose products and operations contribute to the eclectic, innovative, and high quality of life in Fort Collins. This industry includes three sub-clusters – Artistic and Cultural Entertainment, Hospitality, and Recreational and Retail Activities. Because businesses in these three sub-clusters have different land uses, employment forecasts for each sub-cluster are provided separately in the table below. Employment in the three sub-clusters – particularly in Recreational and Retail Activities – depends somewhat on population and income levels. Tourism is a second major employment driver in these clusters, and the college-age population in Fort Collins also provides sustained demand for retail and entertainment facilities. Finally, the region’s network of craft brewers should continue to attract tourists and other brewing-related businesses. Based on these factors, the forecast assumes employment growth in the

LAND/BUILDING NEEDS ANALYSIS FOR TARGETED INDUSTRIES
47
Uniquely Fort Collins cluster will roughly equal growth in all industries and average 1.8% per year through the forecast horizon. This is an increase of 4,430 employees 2007 – 2030.
Table 3-6: Uniquely Fort Collins Avg. Annual Growth Employment Forecast
Sub-cluster 2007
Employment Observed 2002-2007
Forecast 2007-2030 2010 2020 2030
Artistic and Cultural Entertainment 300 -0.2% 1.8% 320 380 460 Hospitality 4,300 -0.3% 1.8% 4,530 5,420 6,470 Recreational and Retail Activities 3,860 0.4% 1.9% 4,080 4,930 5,950 Uniquely Fort Collins (Total) 8,450 0% 1.8% 8,930 10,720 12,880
Source: Colorado Department of Labor and Employment; Development Research Partners. Note: Sub-cluster employment may not add to total cluster employment due to rounding.
3.2. Projected Land/Building Space Needs by Targeted Industry Cluster
Employee Density Ratios In order to estimate land/building needs for the 20-year forecast period, the URS team developed building and land-specific planning ratios (referred to as "employee density ratios") to forecast targeted industry land/building requirements, on a per-employee basis. These steps are described below:
Step 1: Determine employee building density ratio Building Area (SF) / Employee = based on industry data and research
Step 2: Using FAR for the site, determine total building area (SF) on hypothetical one-acre site. One-acre site Building Area (SF) = FAR x 43,560 SF
Step 3: Using one-acre site Building Area (SF) and Employee/Site Area (SF) ratio to calculate Employees/Site Area (AC)
Employees / Site Area (AC) = one-acre site Building Area (SF) / Bldg Area (SF)/Employee
The first step was to understand building space requirements for employees according to building type and targeted industry. These ratios range from 300 SF/employee for office buildings to 2,000 SF/employee for warehouse and industrial types of buildings. All ratios are based on gross building area. The ratios were derived from industry standards that were cross checked for Fort Collins with information from the targeted industry questionnaires. The second step was to determine the total building area (SF) on a hypothetical one-acre site using the FAR. Each of the building types was analyzed in terms of typical site development requirements in Fort Collins – the results were expressed as Floor Area Ratios (FARs). Building type variations in site coverage were accounted for in the FAR. For industrial buildings, FAR and site coverage are the same because industrial buildings are typically one story. FAR and site coverage are different if a building is more than

LAND/BUILDING NEEDS ANALYSIS FOR TARGETED INDUSTRIES
48
one story – examples include office buildings, special purpose buildings, Flex with second story mezzanines, and vertical mixed-use buildings. For simplicity of analysis, an FAR of 0.25 was assumed for this analysis of employment/commercial land uses. This number was developed through an analysis of CoStar data for existing buildings in the GMA. Subsequently, it was validated by Fort Collins Long Range Planning. However, a more specific analysis using different FARs (determined by specific building types and development constraints) could be undertaken if warranted. The FAR analysis based on a .25 FAR is summarized in the table below.
Table 3-7: Existing Development FAR Analysis
Bldg. Type # Bldgs in Sample
Land Area (AC)
Rentable Bldg.
Area (SF)
Total Available
Space (SF)FAR
Industrial 5 7.93 82,513 82,513 0.24Office 12 10.42 133,620 133,074 0.29Flex 4 3.80 113,532 113,532 0.69Retail 13 31.68 269,734 269,734 0.20
Total 34 53.83 599,399 598,853 0.26Source: CoStar and NCEDC database The third step was to convert total building SF on the site and employees/building area (SF) into employee density ratios of employees/acre which are summarized on Table 3-8. Each of the building types was analyzed as if it were on a typical development site in Fort Collins – the results were expressed as FARs and typical site coverage for each building type. These two measurements are the same if the building is one story; however, they are different if a building is more than one story – which is some times the case for office buildings, special purpose buildings, and vertical mixed-use buildings.
Table 3-8: Employee Density Ratios by Building Type
Building Types Floor Area Ratio (FAR)
Bldg Area (SF)/ 1 acre
Bldg. Area (SF)/
Employee
Employees/ Ste Area (AC)
Warehouse DistributionRegional Warehouse 0.45 19,602 2,000 9.80 Refrigerated Distribution 0.45 19,602 2,000 9.80
ManufacturingLight Manufacturing 0.35 15,246 500 30.49 Heavy Manufacturing 0.45 19,602 2,000 9.80
FlexR&D Flex 0.33 14,375 500 28.75 Office Showroom 0.35 15,246 500 30.49
Multitenant 0.45 19,602 500 39.20 Data Switch Center 0.50 21,780 2,000 10.89 Office
Single story 0.40 17,424 300 58.08 Multi-story 0.70 30,492 300 101.64
Retail (in-line or pad) 0.38 16,553 500 33.11 Special Purpose/Other 0.25 10,890 500 21.78 Vertical Mixed-Use 0.50 21,780 500 43.56
Source: Research and analysis conducted by URS

LAND/BUILDING NEEDS ANALYSIS FOR TARGETED INDUSTRIES
49
Employee Density by Targeted Industry Cluster Using the results of the previous analysis of building types and site development, the URS team developed employee density ratios tailored to the five targeted industry clusters. Estimates of employee density by targeted industry enable projections to be made of the building area required for each new employee, by cluster, which are shown on Table 3-9 and Table 3-10. Two scenarios were analyzed: Low Employee Density Ratios (current conditions) and High Employee Density Ratios (no heavy industrial). They are different in their inclusion/exclusion of heavy industrial buildings/land uses. Heavy industrial buildings are significant because they typically have a low employee density and tend to be large facilities or complexes. As a result, they require larger buildings and parcels than other building types. For example, a wind turbine blade manufacturer or outdoor plant/animal research facility. The heavy industrial category would include these kinds of facilities which typically requires larger buildings and/or sites with pens, greenhouses, storage areas, or field, and which result in lower employee densities. This step was cross-checked using information from the targeted industry questionnaires.
Table 3-9: Employee Density Ratios (low range - current conditions)
Targeted Industry Cluster Typical FAR Bldg. Area (SF)/ Employee
Employees/ Site Area
(AC)Chip Design/Research & Development 0.25 500 21.78 Software/GIS 0.25 300 36.30 Biosciences 0.25 1,000 10.89 Clean Energy 0.25 1,000 10.89 Uniquely Fort Collins (Artistic and Cultural Entertainment) 0.25 500 21.78 Uniquely Fort Collins (Recreation and Retail) 0.25 500 21.78 Uniquely Fort Collins (Hospitality) 0.25 500 21.78
Source: Research and analysis conducted by URS
Table 3-10: Employee Density Ratios (high range - no heavy industrial)
Targeted Industry Cluster Typical FAR Bldg. Area (SF)/ Employee
Employees/ Site Area
(AC)Chip Design/Research & Development 0.25 500 21.78 Software/GIS 0.25 300 36.30 Biosciences 0.25 500 21.78 Clean Energy 0.25 500 21.78 Uniquely Fort Collins (Artistic and Cultural Entertainment) 0.25 500 21.78 Uniquely Fort Collins (Recreation and Retail) 0.25 500 21.78 Uniquely Fort Collins (Hospitality) 0.25 500 21.78
Source: Research and analysis conducted by URS

LAND/BUILDING NEEDS ANALYSIS FOR TARGETED INDUSTRIES
50
Employee Density Test Analysis URS also did a cross-check of employee density city-wide for the Fort Collins GMA, using current GMA employment and employment land area. This is summarized on the first part of the table below. Analysis of city-wide conditions yielded a current employee density of 15.3 employees/developed employment acre. Based on this ratio, the projected total employment growth (from 80,760 to 124,250) of 43,490 people would require from 2,175 (20 employees/ AC) to 2,842 (15.3 employees/AC) additional acres. This test analysis is consistent with the ranges summarized in Table 3-9 and Table 3-10 and increases confidence in the employment density ratios used for land use projections. The lower part of Table 3-11 uses these city-wide ratios to estimate required land area by targeted industry cluster and for the five clusters in aggregate. The Development Research Partners analysis provides an estimate of the each cluster's share of city-wide employment (22.9% in 2007 increasing to 25.5% in 2030). Based on this, the additional land area requirement for the targeted Industries (2007 – 2030) ranges from 563 acres to 736 acres (depending on the employee density factor). Again, this city-wide analysis can provide a cross-check with the industry-by-industry calculation that follows.
Table 3-11: Citywide Targeted Industry Cluster Employment (2007, 2030)
Description 2007 2030 (projections)
Growth Management AreaGMA Employment 80,760 124,250 GMA Developed Employment Acres 5,280 Actual GMA Employee Density (employees / acre) 15.3 Projected Additional GMA Employment Acres (steady employee density: 15.3 employees/acre) 2,843 Targeted Industry ClustersTargeted Industries Employment:
Chip Design/Research & Development 4,070 4,260 Software/GIS 2,300 3,550 Biosciences 2,110 4,070 Clean Energy 1,560 5,000 Uniquely Fort Collins (Artistic and Cultural Entertainment) 300 460 Uniquely Fort Collins (Recreation and Retail) 3,860 5,950 Uniquely Fort Collins (Hospitality) 4,300 6,470
Targeted Industries Employment Subtotal 18,500 29,760 Targeted Industries Share of Citywide Employment 22.9% 24.0%Projected Additional Targeted Industry Acres (GMA employee density: 15.3 employees/acre) 736
Source: Research and analysis conducted by URS
Forecast of Future Land Requirements The final step in the quantitative analysis was to prepare a forecast of future land requirements for each of the targeted industry clusters, based upon the planning ratios in Table 3-9and Table 3-10 and the 20-year employment forecast developed by Development Research Partners. The forecast is presented as high and low scenarios (Table 3-12 and Table 3-13), that differ in whether or not it is assumed that lower-density industrial development will occur in the future. The Low Density Scenario (14.74 employees/acre average density) is similar to the city-wide calculation (15.3 employees/acre average density) in Table 3-11; as a result, it will be used in other study calculations to characterize the existing conditions base case, and to

LAND/BUILDING NEEDS ANALYSIS FOR TARGETED INDUSTRIES
51
provide a reference point for examining how different assumptions may affect the estimate of targeted industry cluster land requirements. The High Density Scenario (22.66 employees/acre average density) is presented to illustrate what might happen if targeted industry development trends toward towards office, Flex, and light manufacturing and away from warehouse and heavier industrial uses.
The analysis presented on Table 3-12 and Table 3-13 suggests that a continuation of current conditions and land use patterns will require approximately 735 acres of suitable land for targeted industry cluster growth from 2007 to 2030. If future development occurs at a higher average density (for example, without heavy industrial or other less dense land use), less land may be required (approximately 487 acres).
Table 3-12: Low Density Scenario - Land Area Needs (20 year projection)
Bldg Area (SF)/ Employee
# of Employees
(2007)
Increase # of Employees (2007-2010)
Increase # of Employees (2007-2020)
Increase # of Employees (2007-2030)
Add'l Site Area (AC)
(2007-2010)
Add'l Site Area (AC)
(2007-2020)
Add'l Site Area (AC)
(2007-2030)
Chip Design/Research & Development 500 4,070 30 110 190 1.38 5.05 8.72Software/GIS 300 2,300 140 640 1,020 3.86 17.63 28.10Biosciences 1000 2,110 190 950 1,960 17.45 87.24 179.98Clean Energy 1000 1,560 250 1,450 3,440 22.96 133.15 315.89Uniquely Fort Collins (Artistic and Cultural Entertainment) 500 300 20 70 140 0.92 3.21 6.43Uniquely Fort Collins (Recreation and 500 4,300 230 1,120 2,170 10.56 51.42 99.63Uniquely Fort Collins (Hospitality) 500 3,860 220 1,070 2,090 10.10 49.13 95.96
TOTAL 1,080 5,410 11,010 67.22 346.83 734.71
Employee Density Test (Increase # of Employees/Additional Site Area) for 2007-2030. 14.99Notes:1. "Typical FAR" of .25 is based on current Fort Collins average for non-residential development (source: Fort Collins Long Range Planning); validated by URS analysis.2. "Bldg Area(SF)/Employee" of 300 SF/Employee assumes standard office building configuration. 3. "Bldg Area(SF)/Employee" of 500 SF assumes R&D Flex and Light Manufacturing building configurations. 4. "Bldg Area(SF)/Employee" of 1000 SF assumes R&D Flex, Light Manufacturing, and Heavy Manufacturing building configurations. 5. For Uniquely Fort Collins, "Bldg Area(SF)/Employee" of 500 SF is used as an average to reflect a wide range of activites and building types.
Table 3-13: High Density Scenario - Land Area Needs (20 year projection)
Bldg Area (SF)/ Employee
# of Employees
(2007)
Increase # of Employees (2007-2010)
Increase # of Employees (2007-2020)
Increase # of Employees (2007-2030)
Add'l Site Area (AC)
(2007-2010)
Add'l Site Area (AC)
(2007-2020)
Add'l Site Area (AC)
(2007-2030)
Chip Design/Research & Development 500 4,070 30 110 190 1.4 5.1 8.7Software/GIS 300 2,300 140 640 1,020 3.9 17.6 28.1Biosciences 500 2,110 190 950 1,960 8.7 43.6 90.0Clean Energy 500 1,560 250 1,450 3,440 11.5 66.6 157.9Uniquely Fort Collins (Artistic and Cultural Entertainment) 500 300 20 70 140 0.9 3.2 6.4Uniquely Fort Collins (Recreation and Retail) 500 4,300 230 1,120 2,170 10.6 51.4 99.6Uniquely Fort Collins (Hospitality) 500 3,860 220 1,070 2,090 10.1 49.1 96.0
TOTAL 1,080 5,410 11,010 47.0 236.6 486.8
Employee Density Test (Increase # of Employees/Additional Site Area) for 2007-2030. 22.62Notes:1. "Typical FAR" of .25 is based on current Fort Collins average for non-residential development (source: Fort Collins Long Range Planning); validated by URS analysis.2. "Bldg Area(SF)/Employee" of 300 SF/Employee assumes standard office building configuration. 3. "Bldg Area(SF)/Employee" of 500 SF assumes R&D Flex and Light Manufacturing building configurations (no heavy manufacturing). 4. For Uniquely Fort Collins, "Bldg Area(SF)/Employee" of 500 SF is used as an average to reflect a wide range of activites and building types.

LAND/BUILDING NEEDS ANALYSIS FOR TARGETED INDUSTRIES
52
4. RESULTS The final stage of the analysis compared available suitable land with the forecast land requirements for the targeted industries in aggregate as well as by industry. This is referred to as a gap analysis. The benefit of this analysis is not to attempt to make a precise prediction; but rather, its value is to gain a general understanding of the following issues:
How much land will be required for the targeted industry clusters; What determines suitability; Where available land is located; Planned density of development; and How zoning and land use policies may affect the supply of suitable land.
In addition, the analysis helps to identify red flags or indicators of a potential imbalance between supply/demand for suitable land. The analysis is presented for the five clusters on an aggregate basis and by individual targeted industry. This kind of analysis provides an opportunity for long range planning staff to compare "what if” scenarios related to supply and demand. This kind of informal sensitivity analysis can help to gain a better understanding of which factors make a difference and how different assumptions about market trends and land use policies can influence future outcomes. It is very important, however, to keep in mind that land thought to be highly suitable based on this or any other analysis may not be available for development. Price, willingness to sell, and feasibility of land assembly are all considerations that, in the end, may outweigh physical and economic analysis by non-owners, such as the City and its consultants. Following the comparison of supply and demand, key findings and recommended assumptions for future planning are presented.
4.1. Supply and Demand Comparison
Suitable Land Supply Table 4-1 is repeated from Chapter 2 and summarizes the GIS analysis of suitable land by targeted industry cluster for areas within City limits and outside City limits but within the GMA. The amount of suitable land is inversely related to the restrictiveness of requirements for each industry cluster. For example, there is more highly suitable land for Software/GIS than any other industry. This is due to the fact that this industry cluster uses general office space and can be housed in a variety of buildings of different sizes. All targeted industry clusters studied had similar amounts of potentially suitable and highly suitable land combined, ranging from 2,048 to 2,336 acres. However, they varied in the amounts of highly suitable land. Software/GIS has the most highly suitable land (1,191 acres) followed by Bioscience and Chip Design/R&D (806 and 826 acres, respectively), Clean Energy (578 acres), and Uniquely Fort Collins (286 acres.)

LAND/BUILDING NEEDS ANALYSIS FOR TARGETED INDUSTRIES
53
Table 4-1: Suitable Land Supply by Targeted Industry Cluster
Industry Highly Suitable (AC)
Potentially Suitable (AC) Total (AC) % of Target
Industry TotalChip Design/R&D 828 1,220 2,048
Within City Limits 683 979 1,662 81%Outside City, Inside GMA 145 241 386 19%
Software/GIS 1,191 1,145 2,336Within City Limits 1,024 965 1,989 85%Outside City, Inside GMA 167 180 347 15%
Bioscience 806 1,572 2,378Within City Limits 672 1,320 1,992 84%Outside City, Inside GMA 134 252 386 16%
Clean Energy 578 1,807 2,385Within City Limits 519 1,479 1,998 84%Outside City, Inside GMA 59 328 387 16%
Uniquely Fort Collins 286 2,092 2,378Within City Limits 162 1,835 1,997 84%Outside City, Inside GMA 124 257 381 16%
Source: Research by URS, and data provided by the City of Fort Collins through the BLI 2008
Aggregate Supply and Demand Compared Table 4-2 summarizes the aggregate gap analysis for the five targeted industry clusters combined, using a hypothetical 100% share that assumes that the targeted industries do not compete with other employment uses for the highly suitable land in the GMA. A second assumption is that only highly suitable land will be considered, because it can be considered developer ready with all targeted industry required uses. Two employee densities were analyzed to illustrate different scenarios: Lower Density (15 employees/acre), which is the current city-wide average), and Higher Density (23 employees/acre), which might occur in the future with fewer heavy industrial uses and City policies that encourage more dense and compact development patterns. The analysis did not attempt to estimate the effect of competing employment uses on land absorption by the targeted industry clusters. According to the Development Research Partners analysis, the targeted industries currently have a 23% share of covered employment in the GMA, and this is expected to increase to 26% in 2030. Other covered employment has a share ranging from 74% to 77%. Future planning should also take into account the land/building requirements of employment uses and industries that were not part of this study.. Under the higher density scenario, the analysis suggests that about 487 acres (31% of the highly suitable land) will be required over the next 20 years, and under the lower density scenario, about 739 acres will be required (46% of the highly suitable land). In broad terms, this suggests that there is about twice as much highly suitable land than will be required. The implications of this are discussed in the key findings.

LAND/BUILDING NEEDS ANALYSIS FOR TARGETED INDUSTRIES
54
Table 4-2: Five Targeted Industry Clusters Aggregate Gap Analysis (2007-2030) Higher Density Scenario Lower Density Scenario
Chip Design/R&D, Software/GIS, Bioscinces, Clean Energy, and Uniquely Fort Collins
Highly Suitable (AC)
Land Required (23
Emp./ AC)
Absorption of Highly Suitable
(%)
Land Required (15
Emp./ AC)
Absorption of Highly Suitable
(%)Within City Limits 1,315Outside City, Inside GMA 273
Total inside GMA 1,588 487 31% 735 46%Notes:1. Analysis assumes that targeted industries do not compete with other commercial/employment land uses for the highly suitable land. 2. "Higher Density" scenario averages 23 Employees/Acre across all 5 targeted industries; "Lower Density" scenario averages 15 Employee/Acre.
Chip Design / Research and Development Some of the clusters have future land requirements that are much smaller in comparison to what is present to day as well as compared with other targeted industry clusters. This is due to a number of reasons, including future low growth rates and numbers of additional employees in Fort Collins, which are discussed in Chapter 2. Chip Design/Research and Development fits this pattern (projecting 9 additional acres in 2030). This can easily be provided by the projected supply of land.
Table 4-3: Chip Design/R&D Gap Analysis (2007-2030)
Chip Design/R&D Highly Suitable (AC)
Potentially Suitable (AC)
Land Required (500 SF/
Employee) (AC)
Absorption of Highly
Suitable (%)
Within City Limits 683 979Outside City, Inside GMA 145 241
Total inside GMA 828 1,220 9 1%Notes:1. "Highly Suitable" includes ideal zone districts for Target Industry, adequate site area, and no identifed physical constraints.2. "Potentially Suitable" includes adequate site area but some potentially desirable land uses are not allowed by zoning.3. "Absorption" is the land area requirement in 2030 to accommodate the forecasted targeted industry employment.

LAND/BUILDING NEEDS ANALYSIS FOR TARGETED INDUSTRIES
55
Software / GIS Software/GIS is forecast to require approximately 28 acres of land by 2030, which can be accommodated by the inventory of highly suitable land. The requirement is about 2% of the total forecasted supply of suitable land for this industry cluster.
Table 4-4: Software/GIS Gap Analysis (2007-2030)
Software/GIS Highly Suitable (AC)
Potentially Suitable (AC)
Land Required (300 SF/ Emp.)
(AC)
Absorption of "Highly
Suitable" (%)
Within City Limits 1,024 965Outside City, Inside GMA 167 180
Total inside GMA 1,191 1,145 28 2%Notes:1. "Highly Suitable" includes ideal zone districts for Target Industry, adequate site area, and no identifed physical constraints.2. "Potentially Suitable" includes adequate site area but some potentially desirable land uses are not allowed by zoning.3. "Absorption" is the land area requirement in 2030 to accommodate the forecasted targeted industry employment.
Biosciences Biosciences has a large projected land requirement because it is forecast to grow and Fort Collins is a good fit for this cluster. Future demand ranges from 90 to 180 acres, depending on the density, which will depend on whether land intensive business/industrial processes choose to locate in Fort Collins. According to the suitability requirements for Biosciences, land requirements range from 11% to 22% of total projected supply.
Table 4-5: Biosciences "Gap Analysis" (2007-2030) Bioscience "Gap" Analysis (2007-2030)
Higher Density Scenario Lower Density Scenario
Bioscience Highly Suitable (AC)
Potentially Suitable (AC)
Land Required (500 SF/Emp.)
w/o Heavy Industrial
Absorption of Highly
Suitable (%)
Land Required (1000 SF/Emp.)
w/ Heavy Industrial
Absorption of Highly Suitable
(%)
Within City Limits 672 1,320Outside City, Inside GMA 134 252
Total inside GMA 806 1,572 90 11% 180 22%Notes:1. "Highly Suitable" includes ideal zone districts for Target Industry, adequate site area, and no identifed physical constraints.2. "Potentially Suitable" includes adequate site area but some potentially desirable land uses are not allowed by zoning.3. "Absorption" is the land area requirement in 2030 to accommodate the forecasted targeted industry employment.4. "Higher Density" and "Lower Density" scenarios differ in SF/Employee; .25 FAR is constant for both.

LAND/BUILDING NEEDS ANALYSIS FOR TARGETED INDUSTRIES
56
Clean Energy Clean Energy is expected to grow and may have large land requirements, ranging from 158 to 316 acres. Similar to Biosciences, that demand for land will be affected by the nature of the business/industrial processes, and whether the uses in Fort Collins include land intensive heavy industrial uses required for large-scale manufacturing. Recent history suggests that manufacturing may locate elsewhere (for example, the Vestas blade manufacturing plant located in Windsor and Brighton and the tower manufacturing plant is slated for Pueblo. Regardless, land requirements are projected to range from 27% to 55% of total projected supply of highly suitable land.
Table 4-6: Clean Energy "Gap Analysis" (2007-2030)
Higher Density Scenario Lower Density Scenario
Clean Energy Highly Suitable (AC)
Potentially Suitable (AC)
Land Required (500 SF/Emp.)
w/o Heavy Industrial
Absorption of Highly
Suitable (%)
Land Required (1000 SF/Emp.)
w/ Heavy Industrial
Absorption of Highly Suitable
(%)
Within City Limits 519 1,479Outside City, Inside GMA 59 328
Total inside GMA 578 1,807 158 27% 316 55%Notes:1. "Highly Suitable" includes ideal zone districts for Target Industry, adequate site area, and no identifed physical constraints.2. "Potentially Suitable" includes adequate site area but some potentially desirable land uses are not allowed by zoning.3. "Absorption" is the land area requirement in 2030 to accommodate the forecasted targeted industry employment.4. "Higher Density" and "Lower Density" scenarios differ in SF/Employee; .25 FAR is constant for both.
Uniquely Fort Collins Recognizing that Uniquely Fort Collins is a very broad category, the future land requirement is about 202 acres. This is approximately 71% of the total highly suitable land for this targeted industry cluster, which leaves a margin of only 84 acres.
Table 4-7: Uniquely Fort Collins "Gap Analysis" (2007-2030)
Uniquely Fort Collins Highly Suitable (AC)
Potentially Suitable (AC)
Land Required (500 SF/Emp.)
Absorption of Highly
Suitable (%)
Within City Limits 162 1,835Outside City, Inside GMA 124 257
Total inside GMA 286 2,092 202 71%Notes:1. "Highly Suitable" includes ideal zone districts for Target Industry, adequate site area, and no identifed physical constraints.2. "Potentially Suitable" includes adequate site area but some potentially desirable land uses are not allowed by zoning.3. "Absorption" is the land area requirement in 2030 to accommodate the forecasted targeted industry employment.
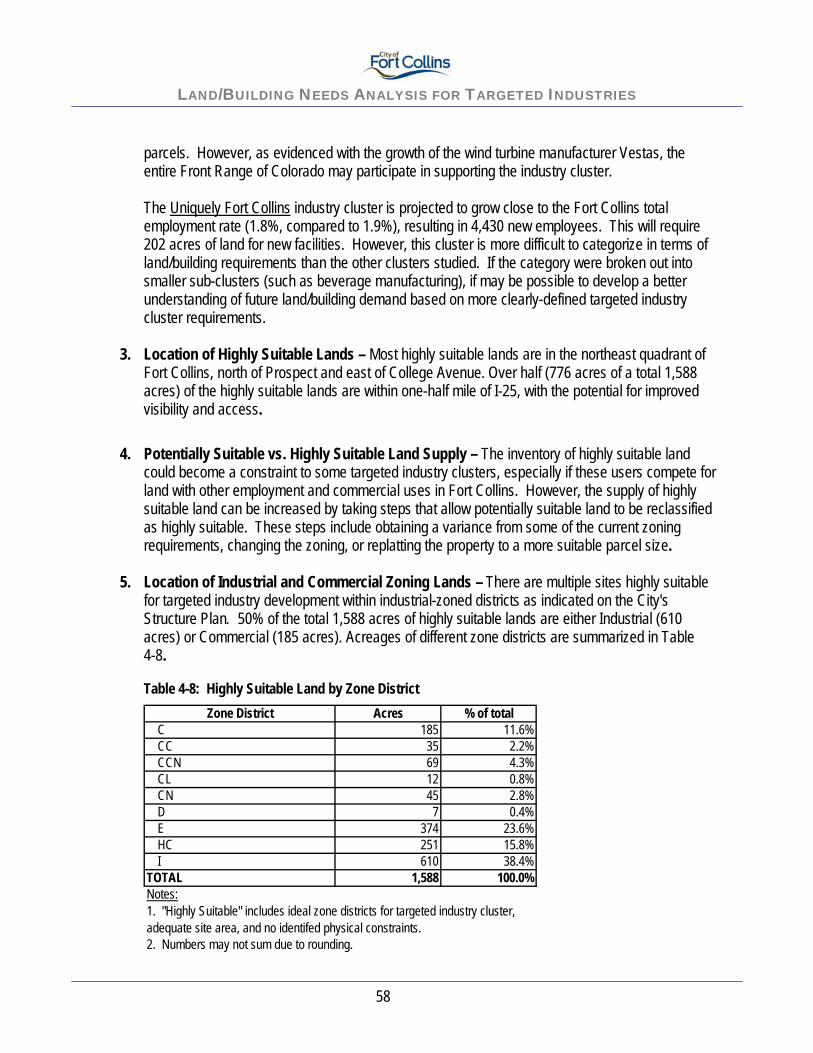
LAND/BUILDING NEEDS ANALYSIS FOR TARGETED INDUSTRIES
57
4.2. Findings and Considerations Based on the supply and demand comparison, key findings and considerations are detailed below. Some of these have implications for current and future planning policies, including the possible need for changes to City Plan principles and policies and its associated Structure Plan map. The study findings and future considerations for planning are immediately followed by a summary of planning assumptions and criteria.
Key Findings 1. Targeted Industry Clusters Share of Total Employment – This study compares the supply of
available land/buildings with the forecast demand by the targeted industry clusters on an aggregate basis. There was no attempt to assign market share by target industry relative to the total forecast employment. According to the Development Research Partners analysis, the targeted industry clusters are for estimated to comprise approximately 26% of the total employment in 2030. This means that the remaining 74% of total Fort Collins employment must also be accommodated.
2. Land Demand/Availability by Targeted Industry Cluster – Two of the targeted industry clusters
are forecast to have minimal future land requirements. Chip Design/R&D has a low projected growth rate (.9%) in the Fort Collins area and as a result, has minimal additional land requirements (190 employees would require an additional 9 acres of land for office, multitenant, flex light manufacturing, and special purpose buildings). On the other hand, Software/GIS has a well-established base and a healthy future growth rate (1.9%) projected for the Fort Collins area, which results in 1,250 additional employees. However, due to the high employee density of this cluster, additional employees will require only 28 acres of land for new facilities (office, multitenant, and flex types of buildings, as well as possibly data switch center, and special purpose). All of these facilities are easily sited in office parks, stand-alone buildings, and mixed-used business parks.
Biosciences will have significant future building and land requirements if it grows as hoped in Fort Collins, and may become constrained. Forecast annual growth is strong (2.9%) resulting in 1,960 additional employees that require from 90 – 180 acres of land for new facilities (the range reflects different assumptions about employee density for this group). As discussed previously, this targeted industry is a good fit for Fort Collins due to the presence of CSU, government, and private organizations, but the industry cluster has unique requirements for labs, manufacturing facilities, and special purpose facilities. The future land/building requirements will depend on local biosciences growth and whether a true cluster develops in the Fort Collins area, which would include large-scale manufacturing, marketing, and distribution, as well as R&D and office. These facilities may require large sites located in research and industrial parks.
Clean Energy is similar to biosciences in that it is projected to grow in the Fort Collins area and has non-typical building and land requirements. Future annual growth is very strong and is estimated to be 5.2% (3,440 new employees), requiring from 158 – 316 acres of land for new facilities (office, multitenant, R&D, light/heavy manufacturing, warehouse/distribution, and special purpose facilities). This cluster may already be constrained or deemed less than ideal for expansion in Fort Collins. Steps should be taken to ensure that required facilities are available in the Fort Collins GMA. Such facilities include well-located research and industrial parks with large 50-100 acre

LAND/BUILDING NEEDS ANALYSIS FOR TARGETED INDUSTRIES
58
parcels. However, as evidenced with the growth of the wind turbine manufacturer Vestas, the entire Front Range of Colorado may participate in supporting the industry cluster. The Uniquely Fort Collins industry cluster is projected to grow close to the Fort Collins total employment rate (1.8%, compared to 1.9%), resulting in 4,430 new employees. This will require 202 acres of land for new facilities. However, this cluster is more difficult to categorize in terms of land/building requirements than the other clusters studied. If the category were broken out into smaller sub-clusters (such as beverage manufacturing), if may be possible to develop a better understanding of future land/building demand based on more clearly-defined targeted industry cluster requirements.
3. Location of Highly Suitable Lands – Most highly suitable lands are in the northeast quadrant of Fort Collins, north of Prospect and east of College Avenue. Over half (776 acres of a total 1,588 acres) of the highly suitable lands are within one-half mile of I-25, with the potential for improved visibility and access.
4. Potentially Suitable vs. Highly Suitable Land Supply – The inventory of highly suitable land could become a constraint to some targeted industry clusters, especially if these users compete for land with other employment and commercial uses in Fort Collins. However, the supply of highly suitable land can be increased by taking steps that allow potentially suitable land to be reclassified as highly suitable. These steps include obtaining a variance from some of the current zoning requirements, changing the zoning, or replatting the property to a more suitable parcel size.
5. Location of Industrial and Commercial Zoning Lands – There are multiple sites highly suitable
for targeted industry development within industrial-zoned districts as indicated on the City's Structure Plan. 50% of the total 1,588 acres of highly suitable lands are either Industrial (610 acres) or Commercial (185 acres). Acreages of different zone districts are summarized in Table 4-8.
Table 4-8: Highly Suitable Land by Zone District Zone District Acres % of total
C 185 11.6%CC 35 2.2%CCN 69 4.3%CL 12 0.8%CN 45 2.8%D 7 0.4%E 374 23.6%HC 251 15.8%I 610 38.4%
TOTAL 1,588 100.0%Notes:
2. Numbers may not sum due to rounding.
1. "Highly Suitable" includes ideal zone districts for targeted industry cluster, adequate site area, and no identifed physical constraints.

LAND/BUILDING NEEDS ANALYSIS FOR TARGETED INDUSTRIES
59
6. Utilities – Two utilities are key to some targeted industry clusters: 3-Phase Power: 3-phase power appears to be available along major arterials within city limits, which is an important factor for some businesses, particularly those which operate heavy machinery for industrial processes and manufacturing. When property is annexed, the utility endeavors to establish 3-phase power along arterials, if it is not already in place. Fiber Optics Cable: The City of Fort Collins Utilities, in partnership with the Platte River Power Authority (PRPA), is in the process of constructing an extensive fiber optics system in the City of Fort Collins that interconnects with similar systems in the neighboring cities of Loveland, Longmont, and Estes Park to form a regional fiber system in the Front Range area of northern Colorado. The system was originally constructed to provide telecommunications capabilities for the electric utility, but was “overbuilt” using 144-strand cables to provide for future growth and to help local public and commercial agencies meet their own needs for high-speed telecommunications. This is an important feature to most business, particularly those which require significant "bandwidth" and would benefit from the lower costs that the system provides.
7. Rail Access – The GMA has several railroad lines running through it. Of particular note are the BNSF line and rail spurs near Anheuser–Busch, which can be used or expanded to provide rail access to industrial properties in this area, as shown on the Mountain Vista Subarea Plan Update.
8. Mountain Vista Subarea Plan Update – At the time of this planning study, the City of Fort Collins was in the process of updating the subarea plan for the area around Anheuser-Busch. The draft subarea plan update summary provided to URS includes several findings which are consistent with the findings and conclusions of the Land/Building Needs Analysis for Targeted Industries:
The forecast in employment growth and resulting land demand analysis identified a small shortfall in Industrial-zoned land capacity. The Mountain Vista Subarea provides an opportunity to correct this shortfall and provide additional capacity for industrial development beyond the 2030 time horizon. Due to the limitations imposed by the Growth Management Area, an oversupply in either Employment- or Industrial-zoned land is beneficial to provide flexibility to respond to changing market conditions.
The subarea plan update should be adopted as an initial step in providing high-quality sites for targeted industry clusters and other users which support the long-term economic development goals of the city and the region.
9. Smart Growth Planning and Targeted Industry Requirements – The Smart Growth goals of compact, more intense development may contradict the goal of attracting as complete an industry cluster as possible and maximizing the economic impact to Fort Collins. For example, light and heavy manufacturing are key elements of the Bioscience and Clean Energy clusters. Manufacturing or production at the industrial scale (wind turbines or agritechnology products, for example) typically requires large buildings, large sites, and less dense site development than R&D and administrative office uses. If local land use regulations discourage or prohibit low density
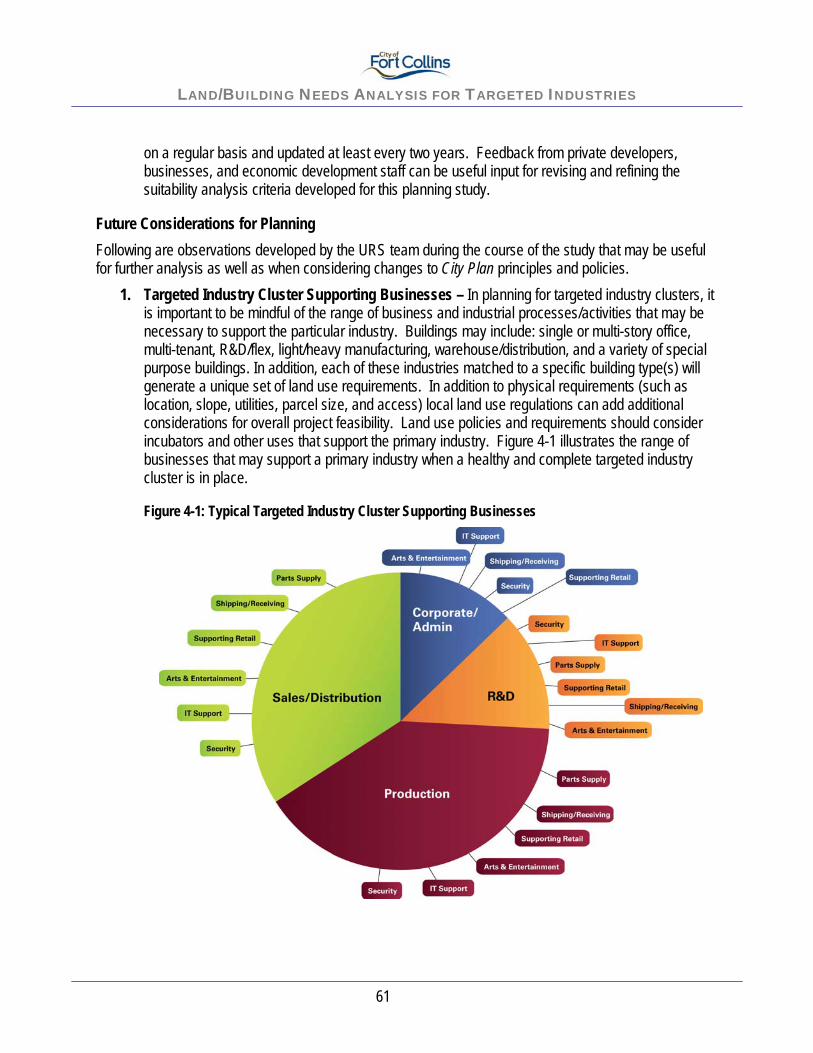
LAND/BUILDING NEEDS ANALYSIS FOR TARGETED INDUSTRIES
60
industrial development, then these high economic impact activities may not locate in the Fort Collins area. For reference, following is a summary of Smart Growth1 principles:
• Create a range of housing opportunities and choices. • Create walkable neighborhoods. • Encourage community and stakeholder collaboration. • Foster distinctive, attractive communities with a strong sense of place. • Make development decisions predictable, fair and cost effective. • Mix land uses. • Preserve open space, farmland, natural beauty and critical environmental area. • Provide a variety of transportation choices. • Strengthen and direct development towards existing communities. • Take advantage of compact building design.
10. Research, Business and Industrial Parks – Entirely new industries are conceived of and take shape in research, business, and industrial parks. These are large master planned projects that incorporate state-of-the-art infrastructure with a variety of entitled and developer-ready sites (and sometimes constructed buildings) to serve the development of target industries and supporting businesses. These large projects can be developed and managed under the auspices of a university or other public institution, by the private sector, or through a combination of public and private efforts. They represent a successful strategy to match specific industry requirements with land and facilities and shorten the timeline for getting a facility planned, entitled, and constructed. They may have unique land use restrictions or entitlements that are tailored to specific industries, and can provide an appropriate location where business and industrial activities are allowed and protected from unreasonable interference by NIMBYs. Fort Collins has a limited inventory of true research, business and industrial park projects. The northeast sector of Fort Collins and along I-25 are ideal locations for these kinds of facilities.
11. Zoning Flexibility – The City currently has a highly-differentiated system of zone districts to accomplish the long-term vision for Fort Collins. However, it is important that the system of land entitlement incorporate flexibility to accommodate important economic development users, particularly in cases where requirements may inadvertently exclude them, without sacrificing the quality development that the Fort Collins demands. This may facilitate potentially suitable parcels becoming highly suitable, and as a result, attractive to key economic development use.
12. Updated Inventory of Sites and Other Information – Long range planning needs to work closely with city and regional economic development staff to ensure that there is an accurate inventory of highly suitable and potentially suitable parcels for development. While NCEDC maintains an excellent datable of buildings in the region, the same needs to occur for land which may be part of an industrial or business park or a larger, sub-dividable tract. The inventory should be monitored
1 Smart Growth Network website, http://www.epa.gov/smartgrowth/sg_network.htm

LAND/BUILDING NEEDS ANALYSIS FOR TARGETED INDUSTRIES
61
on a regular basis and updated at least every two years. Feedback from private developers, businesses, and economic development staff can be useful input for revising and refining the suitability analysis criteria developed for this planning study.
Future Considerations for Planning Following are observations developed by the URS team during the course of the study that may be useful for further analysis as well as when considering changes to City Plan principles and policies.
1. Targeted Industry Cluster Supporting Businesses – In planning for targeted industry clusters, it is important to be mindful of the range of business and industrial processes/activities that may be necessary to support the particular industry. Buildings may include: single or multi-story office, multi-tenant, R&D/flex, light/heavy manufacturing, warehouse/distribution, and a variety of special purpose buildings. In addition, each of these industries matched to a specific building type(s) will generate a unique set of land use requirements. In addition to physical requirements (such as location, slope, utilities, parcel size, and access) local land use regulations can add additional considerations for overall project feasibility. Land use policies and requirements should consider incubators and other uses that support the primary industry. Figure 4-1 illustrates the range of businesses that may support a primary industry when a healthy and complete targeted industry cluster is in place.
Figure 4-1: Typical Targeted Industry Cluster Supporting Businesses

LAND/BUILDING NEEDS ANALYSIS FOR TARGETED INDUSTRIES
62
2. Targeted Industry Cluster Process and Land Uses – In order to serve the broadest spectrum of targeted industry cluster requirements, it is essential to have ample, well-located sites that can accommodate the full range of building types and land uses. Without a complete spectrum of sites and buildings, a small segment of a particular industry will be captured and the economic cluster will be incomplete. Typical building types and uses associated with a continuum of business and industrial processes are illustrated in Figure 4-2. This includes the life-cycle of a business from start-up through expand R&D and ultimately, production and sales.
Figure 4-2: Typical Targeted Industry Cluster Processes and Land Uses

LAND/BUILDING NEEDS ANALYSIS FOR TARGETED INDUSTRIES
63
Assumptions and Criteria for Future Planning The following assumptions and criteria were developed during the course of the study and are summarized below, in order that Fort Collins staff will be able to use this information for future analysis.
Employee Density Ratio (citywide – all employment uses): 15 employees/AC (current conditions - lower density development with heavy industrial uses) 22 employees/AC (possible future conditions - higher density development without heavy industrial uses)
Employee Density Ratio (Targeted Industries): Chip Design/R&D: 500 SF/Employee Software/GIS: 300 SF/Employee Biosciences: 500 – 1,000 SF/Employee Clean Energy: 500 – 1,000 SF/Employee Uniquely Fort Collins: 500 SF/Employee
Employee Density Ratio (Building Types): Warehouse Distribution
Regional Warehouse 700 SF/Employee Bulk Warehouse 700 SF/Employee Refrigerated Distribution 700 SF/Employee
Manufacturing Light Manufacturing 400 SF/Employee Heavy Manufacturing 610 SF/Employee
Flex R&D Flex 275 SF/Employee Office Showroom 700 SF/Employee
Multitenant Varies Data Switch Center 1,000 SF/Employee
Office (single or multi-story) 350 SF/Employee Retail (in-line or pad) 675 SF/Employee
Special Purpose/Other Varies Vertical Mixed Use Varies
(Also see Table 2-16: Site Characteristics by Building Type for additional details.)
Floor Area Ratio (citywide – all employment uses): Commercial/Employment areas city-wide: FAR = 0.25

8 1 8 1 e A S t t U f t S A v e . D e n v e R , c o 8 0 2 3 7