Land Value Impacts of Rail Transit Services in Los Angeles ... · Land Value Impacts of Rail...
37
Land Value Impacts of Rail Transit Services in Los Angeles County Robert Cervero and Michael Duncan Report prepared for National Association of Realtors Urban Land Institute June 2002
Transcript of Land Value Impacts of Rail Transit Services in Los Angeles ... · Land Value Impacts of Rail...

Land Value Impacts of Rail Transit Services in Los Angeles County
Robert Cervero and Michael Duncan
Report prepared for
National Association of Realtors Urban Land Institute
June 2002

1
ABSTRACT Los Angeles County has the worst traffic congestion in country, which on the surface could be expected to increase the value of parcels near major transit stops. This report empirically investigates this proposition using hedonic price models. While some instances of land-value premiums were found, overall impacts were uneven and inconsistent. In the case of the Red Line , multi-family housing near subway stations accrued benefits; for other uses, nearby properties tended to sell for less. Stronger premiums were found for the Metrolink commuter rail system, with the exception of the Orange and Ventura corridors. Light-rail transit services conferred the largest benefits to multi-family housing and commercial uses. Residential properties near Bus Rapid Transit stops generally sold for less whereas commercial properties generally sold for more. One possible explanation for lower land value is that many major transit stops in the County lie within redevelopment districts. 1. INTRODUCTION If transit investments create benefits, real-estate markets tell us. Location theory holds that land prices rise in synch with travel-time savings, thus to the degree transit expedites travel, properties near stations should sell for more. Transit’s “capitalization benefits” are thought to be especially pronounced in highly congested areas. This report presents research results on the land-value impacts of high-performance transit services – heavy rail, commuter rail, light rail, and bus rapid transit (BRT) – in Los Angeles County, the nation’s most populated county (9.8 million inhabitants in 2002). All three rail services operate on dedicated rights-of-way while the BRT system, called Metro Rapid, runs in mixed-traffic conditions along freeways and major arteries. The term “high performance” is used in this report to denote relatively speedy transit services, either due to fixed-guideway operations or, in the case of BRT, signal prioritization and other service enhancements. This report is a companion to recent work conducted on transit’s land-value impacts in two other California settings – Santa Clara County and San Diego County.1 The interested reader is referred to those studies for discussions on the policy context and methodological issues related to studying land-value impacts.
1 R. Cervero and M. Duncan, Rail Transit’s Value-Added: Effects of Proximity to Light and Commuter Rail Transit on Commercial Land Values in Santa Clara County, California, report prepared for the National Association of Realtors and the Urban Land Institute, June 2001; R. Cervero and M. Duncan, Land Value Impacts of Rail Transit Services in San Diego County, report prepared for the National Association of Realtors and the Urban Land Institute, June 2002.

2
Metropolitan Los Angeles has the dubious distinction of being the nation’s most traffic-congested region according to the Texas Transportation Institute (TTI). In fact, it has held this rank every year since 1982 when TTI began measuring regional traffic congestion. In 1999, 59 hours per capita were lost due to freeway delays and half of the region’s freeway lane-miles operated at “extreme” congestion levels (up from 4 percent in 1982).2 Los Angeles also has the nation’s most polluted air and own classification by the U.S. Environmental Protection Agency (EPA) – “extreme non-attainment area” -- for non-compliance with national clean air standards. Traffic snarls and air pollution have long been attributed to the region’s car-dependent landscape, however curiously it had the nation’s second highest residential densities in 2000, just behind Oahu County (Honolulu). From a mobility standpoint, Los Angeles densities appear to be “dysfunctional”: uniformly high enough to create widespread traffic congestion but not peaked enough along linear corridors to draw sufficient numbers of customers into trains and buses. The region hopes to change this through aggressively building rail lines, expanding BRT, and pursuing transit-oriented development. Los Angeles County provides a particularly rich setting for studying the land-value impacts of high-performance transit investments. Four different forms of transit exist as alternatives to traditional fixed-route, fixed-schedule bus services: a heavy-rail subway line (Metro Red Line); six commuter rail lines (Metrolink); two light-rail lines (Metro Green and Blue lines); and two bus rapid transit lines (Wilshire-Whittier Boulevards and Ventura Boulevard BRT lines). In principle, one expects that the largest capitalization benefits accrue to the high-speed, exclusively grade-separated service, the Red Line subway. As conduits to affordable housing, commuter rail might be expected to confer benefits to residential properties – especially apartments and condos – situated within walking distance of stations. Benefits from light-rail and BRT services, theory would suggest, are generally less because these services operate either in mixed-traffic conditions or at slower operating speeds. Also, unlike the County’s three rail services, BRT lines do not have dedicated right-of-ways. In contrast to celebrated BRT systems in Ottawa (Canada), Curitiba (Brazil), Bogata (Columbia), and Nagoya (Japan), Los Angeles County’s BRT services achieve their speed advantages solely through operational and design strategies: signal prioritization, lengthening of bus stops, queue-jumper lanes, far-side bus stops, and low-floor buses that expedite boarding and alighting. Because there are no fixed guideways, it might be the case that real-estate markets do not positively respond to BRT since there are no guarantees that services will be in place in future years or that routing or schedule frequencies will not be modified. This report is divided as follows. First, recent investments in transit and development activities around transit nodes in Los Angeles County are reviewed. Second, the methodologies and data sources used in this study are discussed. 2 Texas Transportation Institute, 2001 Urban Mobility Report, College Station, Texas A&M University, 2002; See: http://mobility.tamu.edu/ums/study/cities/tables/los_angeles.pdf

3
Third, descriptive statistics and research results are presented. Lastly, the policy implications of these findings are elaborated upon. 2. TRANSIT AND DEVELOPMENT IN LOS ANGELES COUNTY Los Angeles County has a century-long legacy of transit oriented development (TOD). The County was originally built around the streetcar. In the 1920s, the Pacific Electric Railway was the nation’s largest electric trolley system, featuring 6,000 trains, 144 routes, and some 1,200 track miles.3 Inter-city rail lines defined Southern California’s cityscape, forming the radial spines that channeled growth throughout the first half of the 20th century. As in most American cities, the post Second World War period saw the dismantling of Los Angeles’s passenger rail services and an entirely different urban landscape – one governed by cars and freeways – take shape. In recent times, deteriorating traffic conditions and air quality have prompted shifts in how Southern California’s public officials view transportation and land use. Smart growth principles have been embraced with seemingly open arms. Flush with Federal and State funds, the region laid more track-miles of rail transit than anywhere in the country over the past decade and has emerged as a national leader on the BRT front. The city of Los Angeles has adopted A Transportation/Land Use Policy for Los Angeles to guide TOD planning. The region has also operationalized the value capture concept through a benefit assessment program. Other policy innovations, like Location Efficient Mortgages, are also being pursued. 2.1 High-Performance Transit in Los Angeles County The Los Angeles County Metropolitan Transportation Authority (MTA) serves as planner, designer, builder, and operator of a 1,900 coach Metro Bus fleet and 60 miles of Metro Rail services that presently interconnect 50 stations in the County (Map 1). An additional 12 rail transit stations are under construction and 29 are in various stages of planning and design (including a long-anticipated Gold LRT Line to Pasadena). The Blue LRT Line connects 22 stations along a 22-mile corridor between downtown Los Angeles and downtown Long Beach in both aerial and at-surface alignments. The 20-mile Green LRT Line connects 14 predominantly elevated stations between Norwalk and the El Segundo coastal area. The 17.4-mile Red Line from Union Station to North Hollywood operates solely underground, and at a price tag of $4.5 billion, has been by far the County’s priciest rail investment to date.
3 M. Bernick and R. Cervero, Transit Villages for the 21st Century, New York, McGraw-Hill, 1997, Chapter 2.

4
Map 1. Metro Rail Services in Los Angeles County, 2002

5
Much larger in size is the 416-mile, 49-station Metrolink commuter-rail system, operated by the Southern California Regional Rail Authority (SCRRA).4 The five routes, shown in Map 2, operating in Los Angeles County are the: Antelope Valley Line (Lancaster to Los Angeles); Riverside Line (Riverside to Los Angeles); San Bernardino Line (San Bernardino to Los Angeles); Orange County Link (Oceanside to Los Angeles); and Ventura Line (Oxnard to Los Angeles). In early 2002, some 32,000 riders patronized Metrolink each weekday, up from around 2,000 a day a decade earlier. Around two-thirds of Metrolink riders previously drove-alone to work.5 The Metro Rapid presently consists of two demonstration BRT routes: the 26-mile Wilshire-Whittier Boulevards corridor (between Santa Monica and East Los Angeles) and the 16-mile Ventura Boulevard corridor (from University City to the edge city of Warner Center) (Map 3). Current (Phase II) plans call for an ambitious expansion of BRT services to many corners of the County as well as the introduction of exclusive lanes and by-pass lanes. Los Angeles County has reaped ridership dividends from the rapid expansion of transit services. Average weekday boardings on the Red Line more than doubled from 63,000 in April 2000 to more than 137,000 in April 2002. Patronage on light-rail lines has also steadily grown; in April 2002, daily ridership reached 68,000 on the Blue Line and 27,000 on the Green Line. The BRT demonstration program is widely viewed as a huge success: one year into the program, ridership on the Wilshire/Whittier corridor jumped 42 percent, and along the Ventura corridor, 27 percent.6 2.2 Transit Oriented Development Over the past decade, development has gravitated to transit corridors in Los Angeles County, in most instances ushered along with the help of public redevelopment funding. The first wave of modern-day TOD activity concentrated in downtown Los Angeles and several outlying urban districts. The refurbished Union Station – where five Metrolink lines and the subway converge, along with six inter-city Amtrak runs -- has become the centerpiece of downtown TOD. On a parcel next to the station, MTA entered into a design-build turnkey arrangement with Catellus Development Corporation to construct the agency’s towering headquarters. Also anchoring Union station is the built-to-suit high-rise headquarters of the Metropolitan Water District. Grant Central Market, a newly
4 SCRRA is a public joint-powers authority comprised of five collaborating member agencies: the Los Angeles County Metropolitan Transportation Authority, the Orange County Transportation Authority, San Bernardino Association of Governments, the Riverside County Transportation Commission, and the Ventura County Transportation Commission. 5 Source: http://www.metrolinktrains.com/about/fastfacts.html. 6 Transportation Management & Design, Inc., Final Report: Los Angeles Metro Rapid Demonstration Program, report prepared for the Los Angeles County Metropolitan Transportation Authority, 2002.

6
Map 2. Metrolink Commuter Train System, 2002
Map 3. Metro Rapid BRT Demonstration Routes, 2002

7
renovated landmark building in downtown Los Angeles, lies across the street from the Pershing Square Red Line station. The project was leveraged by the County redevelopment agency and transit authority fully backing $13.5 million of taxable bonds and $26.5 million of tax-exempt bonds. Two notable mixed housing-commercial TODs in second-tier downtowns are Pacific Court one block from the Blue Line terminus in downtown Long Beach and Holly Street Village, built in anticipation of the eventual extension of light rail services to downtown Pasadena. Both were redevelopment-driven projects funded through land-cost write -downs and the issuance of tax-exempt finance bonds. More recently, mixed-use developments atop Los Angeles subway stations are dramatically transforming what only a decade ago was a fairly ticky-tack stretch of Hollywood Boulevard. Projects range from affordable apartments and neighborhood retail at Western Avenue to a 640,000 square-foot mega-entertainment-retail complex and 640-room hotel at Highland Avenue. In the latter case, MTA nets over a half million dollars annually under a 99-year ground lease.7 Perhaps the most impressive recent land-use change is the NoHo Commons project, a multi-phased mixed-use complex several blocks east of the North Hollywood Metro Rail Station. NoHo Commons features 220,000 square feet of office space, 228,000 square feet of shops and restaurants, 810 units of housing, a community health center, and a child-care center. Recently, MTA approved a second mixed-use project that will occupy space at the transit station itself. 2.3 Public Policies While market forces partly account for land-use changes around Los Angeles County’s rail stations, public policies have played at least as big of a role. As noted, most large-scale mixed-use projects mushrooming around transit nodes have been leveraged, and more bluntly, “subsidized”, through redevelopment assistance. Many of the County’s transit nodes enjoy a privileged status, beneficiaries of tax credits, tax-increment financed neighborhood improvements, pre-assembled land, and other perquisites. Another inducement to TOD has been Location Efficient Mortgages (LEMs), co-sponsored by the city of Los Angeles, the Southern California Association of Governments, and a private lender, Countrywide Home Loans, Inc. The LEM program makes it easier to qualify for a home mortgage under the principle that those living near transit stations are likely to own fewer cars and log fewer miles on road systems, thus freeing up income for home purchases. In Southern California’s pricey housing market, proponents argue this can be an effective lure for encouraging households to buy into station areas. Research shows that 7 N. Holt, Transit Villages are Making a Comeback, Wall Street Journal, May 9, 2001, p. B1-3.

8
families living in parts of Central Los Angeles save, on average, more than $200 a month in vehicle ownership and usage costs compared to the average suburban family.8 Montage at Village Green is one of the first projects built under the LEM model. The 109-home development is located across from the Sylmar/San Fernando Metrolink train station midway along the Antelope Valley Line, offering among the most affordable prices for detached single -family homes in the San Fernando Valley. To make the project work, the developer, American City Visa, joined forces with Fannie Mae and the Southern California Regional Rail Authority. Down payment requirements as low as one percent make home ownership within reach of many low-to-moderate income households. Fannie Mae is also an equity investor in Montage at Village Green, providing $1.5 million from its American Communities Fund. Those purchasing a home at Montage at Village Green receive up to two free Metrolink monthly passes. Another effective public-policy tool used in Los Angeles County is benefit assessment financing. Offices, retail shops, hotels, and other benefiting commercial properties along the Red Line are levied an assessment that to date has generated some $130 million, or 9 percent of the Red Line’s construction cost. Monies have also gone toward ancillary improvements, including landscaping and passageways. One ancillary “add-on” whose value should not be under-estimated is the colorful artwork found at all rail stops in Southern California. Each Metrorail station features unique works of art commissioned from local artists. The MTA Board set aside a percentage of the construction budget for public art. Artwork found at Metrorail stations include recycled film reels, bright murals, cavernous rock sculptures, and even archeological artifacts uncovered during construction. Described by the New York Times as “one of the most imaginative public art programs in the country”, Metro Art has received several coveted arts awards.9 While to some such add-ons might be written off as “frills”, in truth studies tell us transit riders are keenly sensitive to the quality of environment while waiting for a train. Indeed, mode-choice studies reveal that the disutility transit riders assign to waiting is three times longer than that assigned to in-vehicle travel – it is as if the body clock slows down by a factor of three when waiting for a train.10 Making the transfer and waiting experience more exciting and visually stimulating can translate into more riders and farebox income. 8 J. Holtzclaw, R. Clear, H. Dittmar, D. Goldstein, and P. Hass, Location Efficiency: Neighborhood and Socio-Economic Characteristics Determine Auto Ownership and Use, Transportation Planning and Technology, Vol. 25, 2002, pp. 1-27. 9 R. Snoble, Bringing a Touch of Humanity to the Trip: The Art of Transit in Los Angeles, Rail, Edition 4, 2002, pp. 10-11. 10 M. Wachs, Consumer Attitudes Toward Transit Service: An Interpretative Review, Journal of the American Institute of Planners, Vol. 42, No. 1, 1976, pp. 96-104.

9
3. DATA AND METHODOLOGY Has the collective energies put into making transit nodes in Los Angeles County viable places to live, work, and do business paid off in terms of real-estate market performance? As nodes that function as windows to the region at-large, transit stops – particularly those embellished by infill, mixed-use development and site enhancements – should absorb these benefits. This section presents the data sources and methodologies used to address this very question. 3.1 Data Sources The primary data source used to carry out this research was Metroscan, a proprietary data base maintained by and available from First American Real Estate Solutions, headquartered in Sacramento, California. Metroscan contains monthly information on all real-estate sales transactions recorded in county assessor offices. For purposes of this study, data observations for commercial and residential properties were selected – in the case of commercial parcels, data were acquired for calendar years 1999, 2000, and 2001 (in order to create a sufficient size data base); for residential parcels, there were enough year-2000 observations to support the analysis.11 Hedonic price models that gauged the land-value premiums associated with transit were estimated for four types of land uses: Residential – multi-family housing; Residential – condominiums; Residential – single-family housing; and Commercial.12 Since capitalization effects are thought to vary across these land-use categories, separate analyses were conducted for each. To ensure assessed values reflected transacted sales prices, records were only selected for parcels that sold in the year of analysis: 2000 for residential and 1999-2001 for commercial properties. The following numbers of records were available across each of the land uses:
• Residential – multi-family housing: 3,803 parcel records • Residential – condominiums: 13,462 parcel records • Residential – single-family housing: 40,966 parcel records • Commercial: 1,241 parcel records.
For year-2000 commercial properties, the following land uses (and shares of year-2000 sales transactions) were examined:
• Office-Professional (31.1%)
11 While data were available for the year-2001, the residential analysis was conducted using year- 2000 sales data since this time point matched the date of many of the control variables used in the analysis, such as demographic variables from the census. 12 For multi-family units (multi-family housing and condominiums), analyses were conducted for entire properties, not individual units.

10
• Commercial Restaurant (8.1%) • Commercial Retail (37.9%) • Commercial: Other (22.9%)
Besides price information, Metroscan provided various data on parcels, including structure and lot sizes, year built, numbers of bedrooms and bathrooms (for residential parcels), types of use (for commercial parcels), dates of sale, and address information. Address data were used to pinpoint the longitudinal-latitudinal coordinates of parcels, from which various metrics of location, including the municipality or census designated place (CDP) of a parcel, were computed. Other key data used in the analysis came from the Southern California Associations of Governments (SCAG) and the year-2000 U.S. census (from summary table file 1A). The primary SCAG data used in the analysis were 1997 peak-period travel times for a matrix of traffic analysis zones (TAZs). Travel-time estimates were available for both highway and transit networks. Data on population, housing units, and various socio-demographic attributes of census blocks were obtained from the year-2000 census. 3.2 Methodology: Hedonic Price Modeling To gauge impacts – i.e., values-added or values-subtracted -- associated with being near light, heavy, commuter rail transit or BRT in Los Angeles County, hedonic price models were estimated.13 Models took the form: P i = f(T, A, S, C), where: P i equals the estimated price of parcel i; T is a vector of transportation services, including proximity to transit and highways and accessibility via highway and transit networks; A is a vector of property (e.g., structure size and age) and land-use (e.g., type of commercial) attributes; S is a vector of neighborhood socio-demographic characteristics (e.g., mean household income); and C is a vector of controls (e.g., municipality and time-series fixed effects). Municipality fixed-effect (dummy) variables were used to statistically capture the unique attributes of communities, such as quality of schools and degree of regulatory restrictiveness. The Appendix presents the full array of variables that were candidate inputs into the analysis. Many of the variables related to location, proximity to transit,
13 Hedonic price models are widely considered to be the most rigorous and accurate basis for, in general, apportioning factors that influence land values, and more specifically for estimating the land-value premium associated with transportation infrastructure. Hedonic price theory assumes that most consumer goods comprise a bundle of attributes, and that the overall transaction price can be decomposed into the component (or “hedonic”) prices of each attribute. See: S. Rosen, Hedonic Prices and Implicit Markets: Product Differentiation in Pure Competition, Journal of Political Economics, Vol. 82, 1974, pp. 34-55.

11
neighborhood attributes, and accessibility were measured using Geographic Information System (GIS) tools. One-quarter and one-half mile buffers were created around all rail stations and BRT stops in Los Angeles County as well as all freeway and grade-separated interchanges. The one-quarter to one-half mile range is generally considered to be an acceptable walking distance to major transit stops. Whichever radius yielded the best statistical fit, regardless of the direction of a coefficient’s sign, was used for each of the dummy variables used to denote walking access to transit. For purposes of gauging neighborhood attributes (such as neighborhood median household income and racial composition), one-mile buffers around parcels were digitally overlaid onto census blocks. This allowed neighborhood attributes to be gauged for areas of consistent size (around 2,010 acres) for each parcel
One of the key control variables that accounted for the relative location of parcels was accessibility indices. For residential properties, accessibility to jobs was estimated. Isochronic measures of accessibility gauged the number of jobs within designated travel-time intervals of 15 minutes, 30 minutes, 45 minutes, and one-hour over the highway and transit networks. Thus, separate accessibility indicators were computed for auto-highway and transit access to jobs. For commercial properties, accessibility to households (as indicators of relative proximity to consumers and workers) was measured. Accessibility analyses were conducted at the Traffic Analysis Zone (TAZ) level using year-1997 travel-time estimates provided by the Southern California Association of Governments (SCAG). Thus, indices gauged levels of accessibility for the TAZ that a particular parcel lies within. Because capitalization effects were thought to vary by transit corridors, the analyses were stratified to measure differences in land-value impacts for each of the major transit lines. Across the four modes (heavy rail, light rail, commuter rail, and BRT) are 10 separate high-capacity/high-performance transit lines. Since real-estate transactions did not always occur near each line for each of the land-use types, in some instances no land-value impacts could be measured for particular lines. 4. DESCRIPTIVE STATISTICS Table 1 presents summary statistics for some of key variables used in the hedonic price models, broken down by the four land-use types. On average, the most expensive properties were for commercial uses, followed by, in order, multi-family housing, single-family residences, and condominiums. Among land uses, the largest share of condominium sales were within a half-mile of a transit stop – 16.9 percent; for other land uses, the shares of sales near rail stations or BRT stops were: commercial – 12.6 percent; multi-family housing – 12 percent; and single-family homes – 5.7 percent. Also, multi-family housing units and commercial establishments tended to be closest to freeway interchanges and

12
Table 1. Descriptive Statistics of Key Variables Used in Hedonic Price Model for Residential Uses
Mean or Proportion .
Multi-Family
Housing
Condo-
miniums
Single-Family
Housing
Com-
mercial Sales Price ($, 2000) Transportation Proximity Measures Subway (Red Line); within ½ mile of LRT station Metra Antelope Valley Line: within ½ mile of station Metra Orange Line: within ½ mile of station Metra Riverside Line: within ½ mile of station Metra San Bernardino Line: within ½ mile of station Metra Ventura Line: within ½ mile of station LRT Blue Line: within ½ mile of rail station LRT Green Line: within ½ mile of rail station BRT Ventura Line: within ½ mile of bus stop BRT Wilshire-Whittier Line: within ½ mile of bus
stop Interchange Ramp: network distance, in miles, to
nearest freeway ramp Transportation Proximity Measures Regional Job Accessibility: No. jobs within 45-
minute peak-period auto travel time on highway network
Regional Household Accessibility: No. employed residents within 45-minute peak-period travel time on highway network
Property and Location Attributes Structure Size (feet) Lot Size (feet) Structure Age (years) Population Density: Persons per gross acre within
one mile radius of parcel, 2000 Employment Density: Workers per gross acre
within one mile radius of parcel, 2000 Household Income: Annual, $, 2000 City of Los Angeles Location: proportion
342,564
.013
.001
.000
.001
.001
.001
.042
.011
.014
.026
1.42
3,247,053
--
3,597 9,187 55.5
20.1
6.8
29,715 .17
188,396
.024
.015
.001
.001
.001
.011
.027
.002
.042
.047
1.59
2,644,769
--
1,221 3,803 23.3
15.3
8.2
39,045 .40
277,507
.001
.001
.001
.002
.001
.001
.013
.011
.014
.012
1.84
2,619,745
--
1,547 8.646 50.0
13.1
4.6
38,860 .35
439,919
.012
.012
.002
.013
.002
.002
.022
.014
.024
.023
1.45
--
2,570,455
4,403 10,526 50.4
17.6
6.8
32,708 .19

13
single-family housing tended to be farthest away. Multi-family housing parcels were generally closer to jobs via highway networks than other residential uses – e.g., on average, nearly 3.25 million jobs were within 45 minutes highway travel time of multi-family properties, versus about 2.6 million for condominiums and single-family housing. In terms of property and location attributes, commercial and apartment buildings tended to be the largest in size and condominiums were generally the smallest. Condominiums were also usually on the smallest lots and commercial structures on the largest. The typical condominium was around half the age of the typical apartment or single-family residence that was sold. Multi-family projects tended to be in the densest settings and, predictably, single-family properties in the sparsest. Owner-occupied housing – condominiums and single -family parcels – were generally in the highest income neighborhoods, and multi-family structures tended to be in lower-income settings. Lastly, higher shares of condominiums and single-family properties that were sold during the study period were in the City of Los Angeles than multi-family housing or commercial parcels. 5. HEDONIC PRICE MODEL RESULTS This section presents the hedonic price model results for the four land uses, along with graphs that summarize measured land-value premiums or discounts. Land-value impacts were gauged using sensitivity-analysis techniques. For each corridor, this involved inputting mean or modal (i.e., most frequently occurring) values in the corridor (defined as five-mile radii of rail or BRT lines) into the explanatory variables of hedonic price models to come up with price estimates for the “typical” property. In all instance, base-case estimates assumed properties were not within one-half mile of a rail station or BRT stop. Holding other factors constant, the price estimates were then revised based on the assumption that the property was within one-half mile of a station on each rail line or BRT stop. Statistically, this amounted to converting the dummy variable for the rail or BRT line of interest from a value of 0 to a value of 1. The percentage change in estimated land value under this sensitivity analysis represented the premium, or discount, associated with being near a transit stop. 5.1 Multi-Family Housing Model The effects of being near transit stops on the sales prices of apartments and other multi-family units were uneven. Table 2 reveals that both positive and negative impacts were recorded. None of the associations with proximity to transit were statistically significant at the 5 percent probability level, however. This is a red flag, signaling that it is difficult to draw any firm inferences from these results. All one can comfortably say that, so far, there is no evidence of large and appreciable premiums having accrued to multi-family housing from the

14
Table 2. Multi-Family Housing Properties: Hedonic Price Model Results — Factors Influencing Year 2000 Multi-Family Housing Sales Price in Los
Angeles County; Year 2000 data, unless otherwise noted Variable
Coeffi- cient
Standard Error
Prob. Value
Rail/Highway Proximity Subway (Red Line); within ½ mile of rail station (1=yes; 0=no) 21,707.4 21,129.6 .304 Metrolink Antelope Valley Line: within ½ mile of station (1=yes; 0=no) Metrolink Riverside Line: within ½ mile of station (1=yes; 0=no) Metrolink San Bernardino Line: within ½ mile of station (1=yes; 0=no) Metrolink Ventura Line: within ½ mile of station (1=yes; 0=no)
-12,554.8 13,168.8
-12,309.4 1,888.7
24.732.9 23,269.3 25,678.5 29,661.8
.612
.571
.632
.950 LRT Blue Line: within ½ mile of rail station (1=yes; 0=no) 4,349.9 7,501.7 .562 LRT Green Line: within ½ mile of rail station (1=yes; 0=no) 12,228.9 11,815.3 .301 BRT Ventura Line: within ½ mile of bus stop (1=yes; 0=no) BRT Wilshire-Whittier Line: within ½ mile of bus stop (1=yes; 0=no)
-21,386.8 -5,574.2
21,803.6 10,128.2
.329
.582 Highway/Freeway: within ¼ mile of grade-separated highway or
freeway Interchange Ramp: network distance, in miles, to nearest freeway
ramp
-3,673.5
10,585.3
4,812.4
2,236.7
.445
.000
Accessibility and Location Regional Job Accessibility by Auto: No. jobs (in 1,000s, 1995) within
45 minutes peak-period auto travel time on highway network Regional Job Accessibility by Transit: No. jobs (in 1,000s, 1995) within
30 minutes peak-period transit travel time, walk access Distance to Downtown, in straightline miles Pacific coastline: within ½ straightline miles
43.5
104.1
1,376.5 85,215.9
5.1
47.2
836.1 10,007.3
.000
.000 .100 .000
Property Attributes Structure Size: Square feet Lot Size: Square feet of Usable Space Units, total number on parcel Bathrooms, total number on parcel Neighborhood Attributes
48.4 0.95
-3,087.0 28,938.6
2.2
0.10 1,755.1 4,523.3
.000 .000 .079 .000
Population Density: Persons per gross acre within one mile radius of parcel
552.0
315.6
.080
Mean Household Income within one mile radius of parcel, $, 2000 2.01 0.47 .000 White Households: proportion of households within one mile radius of
parcel of white race Youth: proportion of population residing within one mile radius of
parcel that is age 18 or less Seniors: proportion of population residing within one mile radius of
parcel that is age 65 or more
132,025.5
-466,665.0
-173,022.1
18,246.9
58,244.2
89,455.9
.000
.053
.000
City (or CDP) Fixed Effects (1=yes, 0=no) Arcadia Artesia Azusa Baldwin Park Bell Bell Gardens Beverly Hills Carson Claremont Cudahy
88,980.2
-47,881.8 45,353.8 51,328.2 15,015.1 18,128.9
427,562.3 -47,896.5 46,948.9 11,789.1
24,797.0 29,376.5 21,284.9 26,490.9 13,197.7 12,623.6 29,701.1 23,618.9 38,522.2 21,663.1
.000 .103 .033 .053 .255 .151 .000 .043 .223 .586

15
Table 2 (continued) Culver City Duarte El Monte El Segundo Gardena Hawaiian Gardens Hawthorne Hermosa Beach Inglewood La Canada La Mirada La Puente La Verne Lakewood Lancaster Lawndale Lomita Long Beach Los Angeles Malibu Manhattan Beach Monrovia Monterey Park Norwalk Palmdale Pomona Redondo Beach Rosemead San Dimas San Fernando San Gabriel Santa Monica South El Monte South Gate South Pasadena Temple City Torrance West Hollywood Whittier Month Fixed Effects (1=yes, 0=no) February March April May June July August September October November December Constant
22,330.9
-54,715.3 30,559.6 58,749.7
-27,618.1 -63,611.3 -16,671.7 197,722.1 -29,424.2 117,030.5 -86,345.2 30,558.5
-42,211.5 -60,625.5
-132,796.9 -27,596.6 12,319.5
-31,638.4 -12,927.4 443,727.5 457,592.9 20,946.2 22,744.8
-31,293.8 -85,197.8 17,330.5 36,303.2 28,883.7
-31,802.9 56,125.4 48,158.8
195,927.6 27,186.3 13,315.0 66,367.9 30,695.3 11,497.3 39,344.3
-18,913.4
-6,686.6 1,572.6
10,426.6 9,065.2
16,183.0 9,800.0
21,051.4 16,632.4 16,840.9 12,937.7 2,3441.2
-31,768.6
16,412.7 85,280.9 10,526.6 22,542.0 14,921.9 22,430.2 10,551.4 19,362.6 8,835.1
42,995.3 84,986.4 49,354.4 39,545.4 23,656.1 46,939.9 14,489.4 21,835.2 7,702.9 4,969.4
63,717.8 22,490.9 14,319.8 16,069.7 23,395.4 8,6021.1 14,388.8 14,182.9 14,077.5 35,601.7 35,458.5 18,128.2 14,717.5 23,895.8 9,658.4
19,607.7 17,210.8 12,488.8 16,649.3 11,209.3
7,918.7 7,298.5 7,674.6 7,268.0 7,307.4 7,570.4 7,121.0 7,183.2 7,660.6 7,294.5 7,196.6
39,781.8
.174 .521 .004 .009 .064 .005 .114 .000 .001 .007 .310 .536 .286 .010 .005 .057 .573 .000 .009 .000 .000 .144 .157 .181 .322 .228 .011 .040 .372 .114 .008 .000 .255 .168 .001 .075 .357 .018 .092
.399 .829 .174 .212 .027 .196 .003 .021 .028 .076 .001 .425

16
Table 2 (continued) Summary Statistics No. observations = 3,803 F Statistic (prob.) = 111.3 (.000) R-Squared = .715
presence of high-performance transit in Los Angeles County. Table 2 indicates that multi-family parcels near the Red Line subway stations reaped the largest value-added benefits – all else being equal, they sold for over $20,000 more if they were within a half mile of a station. (For multi-family housing, the half-mile versus quarter-mile ring provided the best statistical fits for all corridors.) Multi-family parcels near MTA’s light rail stations similarly accrued positive, though smaller, benefits. With respect to commuter-rail services, impacts were inconsistent – moderately positive in the case of the Riverside Line, moderately negative for the Antelope Valley and San Bernardino Lines, and inconsequential in the case of the Ventura Line. In that none of these relationships were statistically significant, the most one can say is that in the year-2000, there was no evidence of commuter-rail services having exerted any notable impacts on the sales prices of apartments, duplexes, triplexes, or other multi-family rental units. In the case of BRT, land prices for multi-family projects tended to be lower in both corridors, however again poor statistical fits muddy any interpretations. With respect to highways and freeways, parcels that were within a quarter-mile tended to sale for less, ostensibly because of the nuisance effect, and values generally increased with distance from interchanges. While one might expect values would be higher near interchanges, the thicket of freeways that criss-cross Southern California likely meant most multi-family parcels had “good enough” freeway access. The other variables in the hedonic price model entered as statistical controls, to remove the influences of other factors shaping multi-family housing prices. Consistent with residential location theory, access to jobs via both highway and transit networks positively influenced values. Larger complexes on big lots with plentiful bathrooms also tended to sell for more. In addition, apartments in dense settings generally fetched higher prices, possibly because of the premium attached to being in more urban and mixed-use settings. Multi-family units also tended to sell for more in higher income, non-minority neighborhoods made up of families at the middle stages of the lifecycle. Based on the fixed effects variables, Table 2 shows that multi-family parcels in some cities, like Beverly Hills and Poway, commanded huge premiums, and also prices generally rose throughout calendar-year 2000 (based on the positive signs of the monthly dummy variables relative to the suppressed category of January).14
14 For all models presented, coefficients on the fixed-effect variables should be interpreted with respect to the suppressed (i.e., non-presented) category. For municipality fixed effects, the

17
Figure 1 summarizes findings on the value-added versus value-subtracted impacts of proximity to major transit nodes in Los Angeles County. As noted, these premiums or discounts were estimated by inputting mean or modal statistics for all variables in predictive models, and through sensitivity analysis, gauging the percentage change in mean price given a change in each transit-proximity variable, holding all other factors constant.15 Figure 1 reveals that in percentage terms, apartments and other multi-family units near the Metro Red subway line reaped the large value-added premium – more than 6 percent. Other premiums were in the 0.5 to 4 percent range. The largest “dis-value” was the -6 percent registered for multi-family units along the Ventura BRT corridor. While one might argue this is due to negative impacts of
-1.6%
-6.0%
3.4%
1.2%
0.5%
-3.4%
3.7%
-3.5%
6.1%
-8% -6% -4% -2% 0% 2% 4% 6% 8%
Land Value Premium/Discount, Percent
Metro Red Subway Line
Metrolink Antelope Valley Line
Metrolink Riverside Line
Metrolink San Bernardino Line
Metrolink Ventura Line
Metro LRT Blue Line
Metro LRT Green Line
Metro Rapid Ventura BRT Line
Metro Rapid Wilshire-Whittier BRT Line
suppressed category was unincorporated portions of Los Angeles County as well as other (usually smaller) municipalities and census designated places (CDP) not included in the model. For the monthly fixed-effect variables, the suppressed category is January – thus all premiums or discounts are with respect to the first month of the calendar year. 15 In the sensitivity analysis, mean values (from Table 1) were inputted into the model based on attributes of parcels within a five-mile radius of each transit corridor. The dummy variable for each “transit proximity” variable was “turned on” to gauge land-value impacts, holding all other input values constant. Table 1 shows typical input values for predictor variables based on all cases in the data base that were used for some of the variables in the sensitivity analyses.
Figure 1. Multi-Family Housing Land-Value Premiums or Discounts in Los Angeles County, by Rail Line

18
being near the busy Ventura Freeway, we note that proximity to freeways was a control variable entered into the analysis, as was road-network distance to the nearest freeway interchange. As of a year or so into the BRT experiment, there was no evidence of benefits having accrued to nearby multi-family parcels. 5.2 Condominiums Did for-sale higher density housing perform any better than multi-family rental properties? Table 3 shows only with respect to Metrolink commuter-rail stops, excluding the Ventura Line. In terms of heavy-rail subway and LRT services, properties tended to be worth less near stations, in contrast to multi-family housing where premiums were registered. Condominiums near BRT stops generally sold for less, as was the case with rental multi-family housing properties. These relationships were generally far more statistically significant than in the case of multi-family models, partly because of the considerably larger sample size. Overall, inconsistent and not easily interpretable results were produced. As often-times affordable for-sale units, condominiums near commuter rail stops generally capitalized accessibility benefits. Why this did not hold for the Ventura Line and other rail services is unclear. It could be that capitalization benefits only accrued to commuter-rail stops targeted at serving journeys-to-work from suburban residential locales. Because they serve many non-work trips as well, light and heavy rail services might not have produced the same degree of market pressures as commuter rail lines. Many of the control variables shown in Table 3 produced results that were similar to those from the multi-family housing model. Being too close to a freeway depressed condominium prices, and being accessible to jobs or near the coastline raised them. In the latter case, being within a half-mile of the Pacific Ocean bumped up condominium prices by an average of $117,000. Sales prices also generally increased with nearby population and employment densities. Condominiums sold in cities like Manhattan Beach and Rolling Hills Estate enjoyed premiums of well over $100,000. From the monthly fixed effects variables, prices generally rose during calendar-year 2000. In percentage terms, Figure 2 shows the premiums accruing to condominiums sold within a half-mile of Metrolink stations along the San Bernardino and Antelope Valley lines exceeded 12 percent and for the Riverside line, the value-added was nearly 9 percent.16 Fairly substantial dis-benefits were recorded for condominiums sold near Red Line subway stations, Ventura Metrolink stations, and Wilshire-Whittier BRT Line. One possibility is that lying near transit stops, especially along the Wilshire corridor of the Red Line and BRT line,
16 Again, mean or modal statistics for explanatory variables shown in Table 3 were computed from data for all parcels within five miles of each corridor. These values were used in the sensitivity test of each corridor.

19
Table 3. Condominium Properties: Hedonic Price Model Results — Factors
Influencing Year 2000 Condominium Sales Price in Los Angeles County; Year 2000 data, unless otherwise noted
Variable
Coeffi- cient
Standard Error
Prob. Value
Rail/Highway Proximity Subway (Red Line); within ½ mile of rail station (1=yes; 0=no) -38,192.1 5,830.0 .000 Metrolink Antelope Valley Line: within ½ mile of station (1=yes; 0=no) Metrolink Orange County Line: within ½ mile of station (1=yes; 0=no) Metrolink Riverside Line: within ½ mile of station (1=yes; 0=no) Metrolink San Bernardino Line: within ½ mile of station (1=yes; 0=no) Metrolink Ventura Line: within ½ mile of station (1=yes; 0=no)
28,683.8 3,019.2
19,555.5 32,381.9
-28,903.7
9,100.5 19,548.5 26,078.7 15,575.8 7,237.6
.002
.877
.453
.037
.000 LRT Blue Line: within ½ mile of rail station (1=yes; 0=no) -14,174.0 7,654.3 .064 BRT Ventura Line: within ¼ mile of bus stop (1=yes; 0=no) BRT Wilshire-Whittier Line: within ½ mile of bus stop (1=yes; 0=no)
-11,541.9 -19,239.1
7,830.0 7,323.5
.140
.009 Highway/Freeway: within ½ mile of grade-separated highway or
freeway Interchange Ramp: network distance, in miles, to nearest freeway
ramp
-5,281.5
7,043.3
2,035.0
858.7
.009
.000
Accessibility and Location Regional Job Accessibility by Auto: No. jobs (in 1,000s, 1995) within
45 minutes peak-period auto travel time on highway network Regional Job Accessibility by Transit: No. jobs (in 1,000s, 1995) within
30 minutes peak-period transit travel time, walk access Distance to Downtown, in straightline miles Pacific coastline: within ½ straightline miles
35.1
47.3
1,307.8 117,209.5
2.2
28.3
352.7 4,620.5
.000
.096 .000 .000
Property Attributes Structure Age, Years Structure Size, Square feet Bathrooms, total number Bedrooms, total number Condo Conversion Parcel, from apartments (1=yes, 0=no) Neighborhood Attributes
-1,097.0
228.4 -3,980.5
-18,246.0 -2,168.0
100.4
3.0 1,669.3 1,648.3 2,515.1
.000 .000 .017 .000 .389
Population Density: Persons per gross acre within one mile radius of parcel
Employment Density: Workers per gross acre within one mile radius of parcel
470.1
2,058.6
172.8
161.2
.007
.000
Mean Household Income within one mile radius of parcel, $, 2000 2.82 0.14 .000 White Household: proportion of households within one mile radius of
parcel of white race Youth: proportion of population residing within one mile radius of
parcel that is age 18 or less
31,279.3
-136,287.0
7,883.7
26,315.0
.000
.000
City (or CDP) Fixed Effects (1=yes, 0=no) Agoura Hills Artesia Azusa Bellflower Beverly Hills Carson Cerritos Compton
24,706.1
-40,564.9 50,175.3
-36,155.8 55,269.7
-29,282.3 12,099.8
-16,713.4
9,185.5
23,829.3 9,716.7
11,524.9 11,237.8 8,822.4
11,479.6 21,786.7
.007 .089 .000 .002 .000 .001 .292 .443

20
Culver City Table 3 (continued) Diamond Bar Downey Duarte El Segundo Gardena Hawthorne Hermosa Beach Huntington Park Inglewood Irwindale La Canada La Verne Lakewood Lawndale Lomita Long Beach Los Angeles Manhattan Beach Monrovia Montebello Norwalk Palmdale Palos Verdes Paramount Pasadena Pico Rivera Rancho Palos Verdes Redondo Beach Rolling Hills Estates San Fernando San Clarita Santa Monica Signal Hill South Gate Temple City West Covina West Hollywood Whittier Month Fixed Effects (1=yes, 0=no) February March April May June July August September October November December Constant
-21,396.6
-20,748.6 -56,392.5 39,932.4 9,816.0
-37,013.8 -83,720.0 26,103.8
-30,990.5 -21,544.7 62,272.3 30,819.0 48,099.9
-37,394.8 -25,211.0 12,763.8
-20,733.1 9,060.2
176,362.4 33,328.8
-10,971.8 -28,857.6 -41,476.9 -40,948.7 -17,771.4 21,836.8
-27,046.7 -27,147.1 -7,627.0
113,704.2 13,237.1 20,350.4 97,034.6
-10,815.8 -34,657.7 -19,180.8 -6,905.1 32,670.4
-19,006.4
4,540.2 9,147.5
11,530.2 15,290.8 16,336.4 18,335.9 15,838.8 21,396.3 24,765.9 27,298.4 24,597.5
-28,758.2
6,064.6
6,309.4 11,398.4 16,612.1 13,826.8 11,953.8 17,271.8 12,070.8 14,424.8 7,149.2
28,062.3 44,259.0 29,670.8 25,674.2 18,212.6 12,478.8 5,482.9 2,345.2
15,229.2 12,324.5 12,042.2 11,960.7 16,840.9 34,201.7 9,052.3 5,233.2
19,517.6 8,977.6 5,052.7
88,463.4 23,730.2 5,142.6 5,627.0
11,818.8 44,311.6 15,540.1 7,422.7 6,312.7
14,945.4
4,864.1 4,465.3 4,480.4 4,467.0 4,407.3 4,473.3 4,417.6 4,450.2 4,510.3 4,386.7 4,387.6 7,045.4
.000
.001
.000
.016
.478
.002
.000
.031
.032
.003
.026
.486
.105
.145
.166
.306
.000
.000
.000
.007
.362
.016
.014
.231
.050
.000
.166
.003
.131
.199
.577
.000
.000
.360
.434
.217
.352
.000
.203
.351
.041
.010
.001
.000
.000
.000
.000
.000
.000
.000
.000

21
Table 3 (continued) Summary Statistics No. observations = 13,462 F Statistic (prob.) = 309.2 (.000) R-Squared = .657
-8.4%
-5.1%
-6.2%
-12.7%
1.3%
14.2%
8.6%
12.6%
-16.8%
-20% -15% -10% -5% 0% 5% 10% 15% 20%
Land Value Premium/Discount, Percent
Metro Red Subway Line
Metrolink Antelope Valley Line
Metrolink Riverside Line
Metrolink San Bernardino Line
Metrolink Orange Line
Metrolink Ventura Line
Metro LRT Blue Line
Metro Rapid Ventura BRT Line
Metro Rapid Wilshire-Whittier BRT Line
corresponded with lying within a redevelopment district. This latter association could have very well depressed condominium sales prices. These findings suggest that for-sale housing units, like condominiums, that lie in built-up urban districts suffer from the association of being in “blighted” districts, the very definition used to designate redevelopment zones. 5.3 Single-Family Housing How about detached for-sale housing units? Did their experiences mirror those of condominiums? Table 4 suggests “yes”, with a few exceptions. Again, residential parcels near Antelope Valley and Riverside Metrolink stations accrued benefits, as reflected by single -family home prices. Premiums for other
Figure 2. Condominium Land-Value Premiums or Discounts in Los Angeles County, by Rail Line

22
Table 4. Single-Family Housing Properties: Hedonic Price Model Results — Factors Influencing Year 2000 Condominium Sales Price in Los Angeles
County; Year 2000 data, unless otherwise noted Variable
Coeffi- cient
Standard Error
Prob. Value
Rail/Highway Proximity Subway (Red Line); within ½ mile of rail station (1=yes; 0=no) -18,469.4 12,960.0 .154 Metrolink Antelope Valley Line: within ½ mile of station (1=yes; 0=no) Metrolink Orange County Line: within ½ mile of station (1=yes; 0=no) Metrolink Riverside Line: within ½ mile of station (1=yes; 0=no) Metrolink San Bernardino Line: within ½ mile of station (1=yes; 0=no) Metrolink Ventura Line: within ½ mile of station (1=yes; 0=no)
25,675.3 2,273.3
27,770.7 6,164.2
-1,591.7
12,608.3 31,402.7 27,037.8 10,480.1 14,410.3
.059 ..942 .304 .556 .912
LRT Blue Line: within ½ mile of rail station (1=yes; 0=no) LRT Green Line: within ½ mile of rail station (1=yes; 0=no)
13,351.5 -7,073.6
7,654.0 7,419.1
.081
.340 BRT Ventura Line: within ¼ mile of bus stop (1=yes; 0=no) BRT Wilshire-Whittier Line: within ¼ mile of bus stop (1=yes; 0=no)
-23,810.7 -59,053.2
12,900.0 8,372.1
.065
.000 Highway/Freeway: within ½ mile of grade-separated highway or
freeway
-10,831.5
1,561.7
.000 Accessibility and Location Regional Job Accessibility by Auto: No. jobs (in 1,000s, 1995) within
45 minutes peak-period auto travel time on highway network Pacific coastline: within ½ straightline miles
53.6
146,082.2
1.4
7,328.3
.000 .000
Property Attributes Structure Age, Years Structure Size, Square feet Bathrooms, total number Bedrooms, total number No. Stories Neighborhood Attributes
558.2 190.9
21,481.7 -22,788.0 -21,830.3
55.8 1.9
1,490.7 1,077.9 2,366.6
.000 .000 .000 .000 .000
Population Density: Persons per gross acre within one mile radius of
parcel Employment Density: Workers per gross acre within one mile radius of
parcel Mean Household Income within one mile radius of parcel, $, 2000
-1,187.8
-1,509.8
3.14
160.5
219.5 0.23
.000
.000 .000
White Household: proportion of households within one mile radius of parcel of white race
Youth: proportion of population residing within one mile radius of parcel that is age 18 or less
Seniors: proportion of population residing within one mile radius of parcel that is age 65 or more
231,957.6
-529,605.0
-542,444.3
5,999.1
21,696.8
31,369.5
.000
.000
.000

23
Table 4 (continued) City (or CDP) Fixed Effects (1=yes, 0=no) Arcadia Artesia Azusa Baldwin Hills Bell Bellflower Beverly Hills Bradbury Carson Claremont Diamond Bar Downey Duarte El Monte El Segundo Gardena Glendale Glendora Hawaiian Gardens Hermosa Beach Hidden Hills Industry Inglewood Irwindale La Canada La Habra Heights La Mirada La Puente La Verne Lakewood Long Beach Los Angeles Malibu Manhattan Beach Norwalk Palos Verdes Paramount Pasadena Pico Rivera Pomona Rancho Palos Verdes Rolling Hills Rolling Hills Estates Rosemead San Dimas San Fernando San Marino San Clarita Santa Monica Sierra Madre South El Monte South Pasadena
46,249.7 -30,231.0 63,577.3 57,314.7 8,753.1
-63,619.9 660,717.7 85,021.2
-24,131.0 -31,124.3 -32,235.8 -63,185.6 35,821.3 22,042.3
-25,289.9 -14,084.5 -17,948.5 -23,382.6 -15,106.0 75,952.2
522,375.3 99,715.8 -8,753.1 58,071.0
192,713.8 -72,492.8 -59,053.3 63,937.5
-31,995.8 -61,823.3 -45,893.8
6,992.0 1,094,412.4
225,129.2 -23,247.7 421,009.0 -13,191.1 47,930.5 -4,506.1 37,788.5 21,581.6
495,602.7 265,969.5 11,440.0
-38,898.6 78,907.1
262,225.6 -8,280.7
396,385.9 -14,036.7 25,174.9 51,109.5
7,243.4 14,398.3 11,716.4 7,603.1
16,416.9 8,006.4
12,888.1 36,763.6 6,544.7 9,549.4 8,658.0 5,284.9
13,189.4 7,886.7
15,653.6 10,502.4 5,121.5 7,399.1
20,918.3 13,602.6 35,488.2 65,955.7 7,928.3
59,001.7 9,206.5
20,251.1 7,426.6 9,770.0
10,112.3 4,994.7 3,467.3 1,868.9
24,382.8 8,560.3 4,892.8
21,153.8 11,933.0 5,130..2 8,181.9 4,926.9 8,483.3
93,338.7 18,095.5 10,427.6 12,271.8 12,561.5 101,54.5 6,381.1
10,427.2 16,025.8 18,204.1 13,275.7
.000
.036
.000
.000
.594
.000
.000
.021
.000
.001
.000
.000
.007
.005
.106
.180
.000
.002
.470
.000
.000
.131
.270
.325
.000
.000
.000
.000
.002
.000
.000
.000
.000
.000
.000
.000
.269
.000
.582
.000
.000
.000
.000
.273
.002
.000
.000
.194
.000
.381
.167
.000

24
Table 4 (continued) Torrance West Covina Westlake Whittier Month Fixed Effects (1=yes, 0=no) February March April May June July August September October November December Constant
54,033.7 13,607.9 87,173.8
-39,348.8
3,817.3 9,980.1 9,888.6
16,358.3 15,150.2 18,808.1 20,827.9 26,080.9 20,947.0 23,646.1 23,267.5
-35,355.0
5,440.2 5,415.6
93,292.7 5,965.6
3,939.0 3,607.9 3,684.8 3,552.5 3,562.7 3,639.6 3,528.0 3,593.5 3,779.6 3,633.7 3,606.7
11,770.7
.000 .012 .350 .000
.333 .006 .007 .000 .000 .000 .000 .000 .000 .000 .000 .003
Summary Statistics No. observations = 40,966 F Statistic (prob.) = 1,048.9 (.000) R-Squared = .698
commuter-rail lines were more modest, and again, the Ventura Line yielded negative effects. Discounts were also registered for single-family homes within a half-mile of Red Line subway stations, although there were relatively few such records in the data base. The only instance where a coefficient sign flip-flopped was for the Blue LRT line – single-family homes sold within a half-mile of stations on the Blue line reaped a modest benefit of around $13,000. Negative impacts were recorded for single-family housing sold near the Green LRT line. And as before, prices were lower for properties near BRT stops. In general, the relationships for single -family home prices were statistically less robust than in the case of condominium prices. Control variables shown in Table 4 matched a priori expectations. All else being equal, single-family home prices generally rose with: job accessibility via highways; structure size; unit age; number of bathrooms; neighborhood income; and non-minority neighborhood composition. In contrast to previous findings, being in dense settings – reflected by building heights as well as neighborhood population and employment densities – generally lowered single-family home prices. Being within a half-mile of a freeway also lowered values whereas being within a half mile of the Pacific coastline raised them, on average by nearly $150,000. Having a prestigious address, like Beverly Hills or Malibu, also dramatically increased single-family home prices, by well over a million dollars in the latter case.

25
Expressing the hedonic price results in relative terms, Figure 3 shows the largest premiums were in the neighborhood of 7 percent. Single -family homes near both BRT corridors had the largest “value-losses”, as high as 15 percent in the case of the Wilshire-Whittier BRT corridor. While BRT services had generally been in existence for less than one year at the time of these sales transactions, nevertheless the marketplace appeared to be attaching negative values to homes sold near Metro Rapid stops. Whether this is due to other factors associated with BRT stops that were not explicitly controlled for in the analysis is unclear, as is whether these relationships will hold over the long run. 5.4 Commercial Properties Commercial real estate should reap benefits from being near transit stops to the degree that proximity increases job access and retail sales. Table 5 shows that offices, shops, hotels, and other commercial properties benefited from being near transit in the cases of two Metrolink lines, both LRT lines, and both BRT lines. Relationships were not statistically significant, however, except in the case of the
-15.2%
-6.1%
-1.8%
3.4%
-0.4%
0.6%
1.6%
7.1%
6.6%
-4.7%
-20% -15% -10% -5% 0% 5% 10%
Land Value Premium/Discount, Percent
Metro Red Subway Line
Metrolink Riverside Line
Metrolink San Bernardino Line
Metrolink Orange Line
Metrolink Ventura Line
Metro LRT Blue Line
Metro LRT Green Line
Metro Rapid Ventura BRT Line
Metro Rapid Wilshire-WhittierBRT Line
Metrolink Antelope Valley Line
Figure 3. Single-Family Housing Land-Value Premiums or Discounts in Los Angeles County, by Rail Line

26
Table 5. Commercial Properties: Hedonic Price Model Results — Factors Influencing Commercial Sales Price in Los Angeles County; Year 2000 data,
unless otherwise noted Variable
Coeffi- Cient
Standard Error
Prob. Value
Rail/Highway Proximity Subway (Red Line); within ½ mile of rail station (1=yes; 0=no) -272,451.7 99,635.6 .000 Metrolink Antelope Valley Line: within ¼ mile of station (1=yes; 0=no) Metrolink Riverside Line: within ¼ mile of station (1=yes; 0=no) Metrolink San Bernardino Line: within ¼ mile of station (1=yes; 0=no) Metrolink Ventura Line: within ¼ mile of station (1=yes; 0=no)
136,928.6 -594,334.0 217,779.0 -45,640.8
259,948.7 252,741.0 199,371.5 158,225.0
.598
.019
.275
.773 LRT Blue Line: within ¼ mile of rail station (1=yes; 0=no) LRT Green Line: within ¼ mile of rail station (1=yes; 0=no)
14,876.6 2,573.6
45,055.5 8,422.3
.532
.766 BRT Ventura Line: within ¼ mile of bus stop (1=yes; 0=no) BRT Wilshire-Whittier Line: within ¼ mile of bus stop (1=yes; 0=no)
46,411.9 176,044.7
72,158.6 74,672.3
.520
.019 Interchange Ramp: network distance, in miles, to nearest freeway
ramp
-22,761.4
10,066.4
.024 Accessibility and Location Regional Labor Force Accessibility by Auto: No. employed residents
(in 1,000s, 1995) within 45 minutes peak-period auto travel time on highway network
Regional Labor Force Accessibility by Transit: No. employed residents (in 1,000s, 1995) within 30 minutes peak-period transit travel time, automobile access (park-and-ride)
Distance to Downtown, in straightline miles Pacific coastline: within ½ straightline miles
148.1
435.2
-15,122.1 180,576.5
70.4
120.0
3,073.2 61,607.7
.034
.000
.000
.003 Property Attributes Structure Age, Years Structure Size, Square feet Lot Size, Square feet
-2,510.9
75.6 5.9
596.9
2.4 0.9
.000 .000 .000
Land Use Attributes Office (1=yes; 0=no) Bank (1=yes; 0=no) Professional Building (1=yes; 0=no) Restaurant (1=yes; 0=no) Neighborhood Shopping Center (1=yes; 0=no) Retail Store Store and Office Combined (1=yes; 0=no) Store and Residence Combined (1=yes; 0=no)
-138,908.2 510,244.6
-147,030.4 -48,288.9
-376,545.7 -80,380.2
-117,047.9 -130,085.0
80,887.3
161,552.3 87,638.1 84,965.8
125,633.2 78,715.7 88,351.5 79,716.7
.086 .002 .094 .570 .003 .307 .185 .103
City (or CDP) Fixed Effects (1=yes, 0=no) Agoura Hills Alhambra Arcadia Artesia Beverly Hills Carson Cerritos Compton El Monte Glendora Hawaiian Gardens Los Angeles
16,659.9
245,333.0 78,522.1
281,666.7 917,715.9 239,982.1 462,424.2 144,164.3 122,568.0
-170,210.4 -108,931.5
97,125.6
205,270.1 77,017.7
104,172.6 174,222.0 248,707.5 123,242.5 246,345.1 78,534.0 74,163.9 96,857.5
201,003.6 28,476.9
.417 .001 .451 .106 .000 .052 .061 .067 .099 .079 .588 .001

27
Table 5 (continued) Malibu Manhattan Beach Monterey Park Palmdale Palos Verdes Paramount Pasadena Pico Rivera Pomona Rosemead San Gabriel San Marino Santa Clarita Santa Monica Signal Hill South Gate West Covina West Hollywood Annual Fixed Effects (1=yes, 0=no) 2000 2001 Constant
696,685.5 244,516.7 181,744.0 334,743.1 508,162.4 83,806.3 73,836.7
-296,923.4 183,495.9 233,681.0 175,062.3 198,510.7
-109,242.6 329,676.9 240,600.0 60,283.8
-111,349.4 163,203.7
35,176.9 5,946.8
397,686.4
229,366.7 133,586.8 15,5242.5 34,7917.0 254,516.2 111,319.8 62,576.4
116,676.2 79,525.6
154,524.0 87,895.9
154,821.6 186,558.8 97,029.2
243,062.1 72,450.6
124,563.5 176,998.4
30,210.5 47,532.9
168,209.9
.002 .067 .242 .336 .046 .452 .238 .011 .021 .131 .047 .200 .558 .001 .322 .406 .372 .357
.245 .211 .018
Summary Statistics No. observations = 1,241 F Statistic (prob.) = 47.58 (.000) R-Squared = .700
Wilshire-Whittier Metro Rapid bus corridor. Also, in the case of the Red Line subway and two of the commuter rail lines, negative price effects were recorded. Again, an uneven and unclear picture emerges, with commercial properties appearing to benefit from the presence of high-performance transit in some corridors and worse off in others. Because most relationships were not statistically significant, perhaps the most one can say is the link between proximity to high-performance transit and commercial land values in recent years was weak in Los Angeles County. Control variables shown in Table 5 align with expectations. Offices, restaurants, retail shops, and other commercial uses were worth more as the numbers of households that could be reached within 45 minutes travel-time by car or 30- minutes by transit increased. The land-rent gradient as a function of distance from downtown Los Angeles was downward sloping. Being within a half-mile of the coast increased commercial land prices by, on average, $180,000. Values also rose with structure and lot sizes. Holding other factors constant (including structure size), properties used for banks tended to go for more than those used for offices, retail, and other commercial uses. The largest municipal premiums were in Bevery Hills, Malibu, and Palos Verdes, all over a half million dollars. Lastly, commercial values generally increased after 1999 (the suppressed time-

28
series category). In relative terms, Figure 4 reveals that, among all land uses, the largest land-value premiums and discounts associated with being near transit were for commercial properties. The San Bernardino and Antelope Valley Metrolink lines and the Wilshire-Whittier BRT corridor reaped the largest percentage gains, while the Metrolink Riverside line and Metro Red subway corridor experienced the largest value-losses. Why this particular pattern emerged is unclear, however local contextual factors (e.g., zoning policies) could have played a role, despite the many statistical controls introduced in the analysis. The presence of large premiums for commercial properties along the Wilshire-Whittier BRT corridor also stand out, in contrast to the discounts registered for commercial properties along the Red Line subway. Because the Wilshire Boulevard corridor contains some of Southern California’s most prestigious office and retail addresses, parcels sold near BRT could have reflected this association. In that some of the control variables, like city of sale, picked up the influences of locational factors, there would appear to be some value-added to commercial properties well-served by Metro Rapid buses.
13.3%
3.5%
0.2%
1.1%
-3.4%
16.4%
-29.8%
10.3%
-20.6%
-40% -30% -20% -10% 0% 10% 20%
Land Value Premium/Discount, Percent
Metro Red Subway Line
Metrolink Riverside Line
Metrolink San Bernardino Line
Metrolink Ventura Line
Metro LRT Blue Line
Metro LRT Green Line
Metro Rapid Ventura BRT Line
Metro Rapid Wilshire-Whittier BRT Line
Metrolink Antelope Valley Line
Figure 4. Commercial Land-Value Premiums or Discounts in Los Angeles County, by Rail Line

29
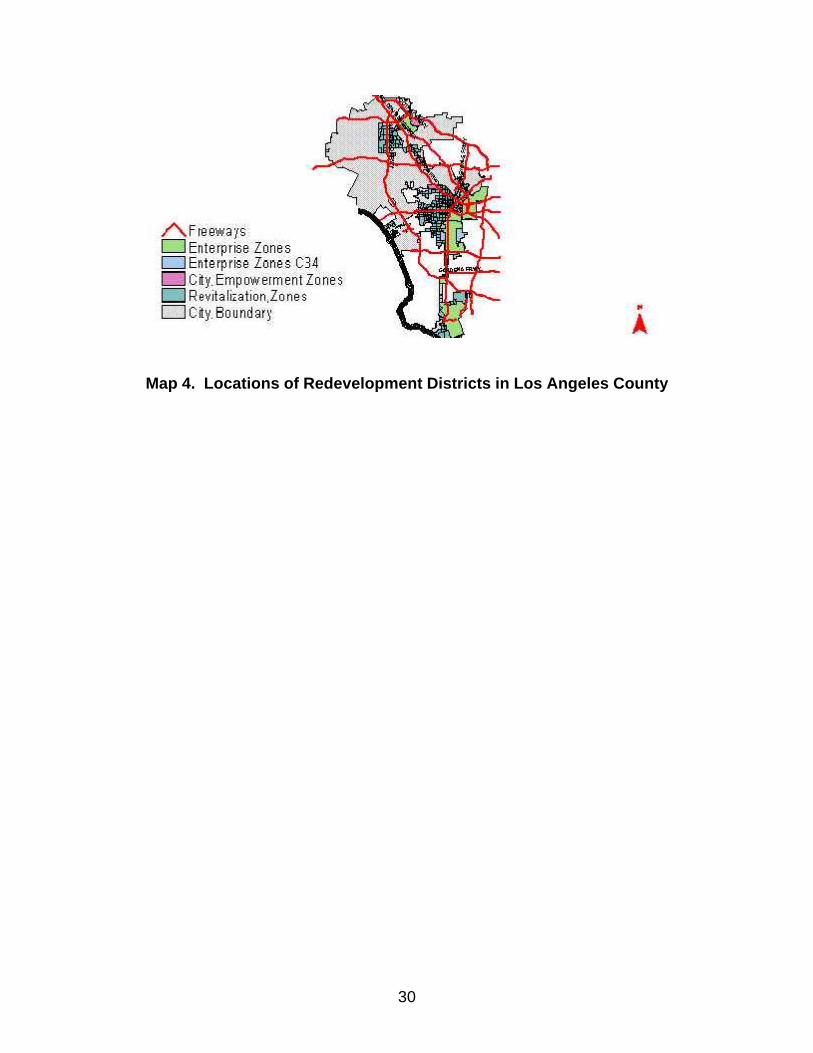
6. CONCLUSION Compared to experiences in Santa Clara County and San Diego County, land-value impacts of high-performance transit in Los Angeles County were uneven and inconsistent. In the case of the Red Line subway, premiums were recorded only for multi-family rental housing; for other uses, properties within half-mile rings of stations tended to sell for less. The least consistent pattern was for Metrolink stations. For the Antelope Valley and San Bernardino corridors, premiums were measured for condominiums, single-family homes, and commercial uses; discounts were found for multi-family housing. For the Metrolink Riverside line, premiums were measured for all but commercial properties. Impacts along the short segments of the Orange line that lies within Los Angeles County were inconsequential and for the Ventura line, they were generally negative. In the case of LRT lines, premiums were found for multi-family housing and commercial uses as well as single-family properties in the case of the Blue Line; discounts were found for condominiums and single-family properties in the case of the Green Line. Lastly, residential properties near BRT stops generally sold for less whereas commercial properties generally sold for more. Why impacts were uneven and inconsistent is unclear, however one explanation for the absence of premiums and in instances the ostensible presence of discounts is that the half-mile rings around many of the County’s rail and BRT stops correspond to redevelopment districts. Lying in distressed inner-city settings apparently lowers land values in many instances despite transit’s presence. Los Angeles County’s Community Redevelopment Agency today operates 31 redevelopment projects covering 21,065 acres, many of which are situated near rail and BRT stops. Map 4 shows the locations of various enterprise, empowerment zones, and revitalization zones -- collectively defined as redevelopment districts – that lie in the County. Many align along the Red Line, the LRT corridors, the Wilshire-Whittier BRT line, and central-city portions of Metrolink lines. Other corridors, like the Ventura BRT line, are substantially outside of the redevelopment zones, thus other factors, including proximity to transit itself, are explaining value-losses. Because some of the County’s high-performance transit services are relatively new, land value trends should be monitored in order to gauge longer term impacts.
30
Map 4. Locations of Redevelopment Districts in Los Angeles County

31
APPENDIX Variable Description parcel parcel id number / from metroscan price sales price / from most recent sale as recorded in metroscan assdland assesed value of land recorded in metroscan assdstr assessed value of structure recorded in metroscan assdtot total assessed value of parcel recorde in metrocan str_age age of structure (2002 - year built) / from metroscan sqft_str structure square footage / from metroscan sqft_lot lot square footage / from metroscan sqft_use usable lot square footage / from metroscan totunits number of units on parcel / from metroscan bathroom number of bathrooms on parcel / from metroscan bathunit average bathrooms per unit bedroom number of bedrooms on parcel / from metroscan bedunit average bedrooms per unit garagesp number of garage spaces on parcel / from metroscan stories building stories form metroscan improved percent of parcel that is improved / from metroscan, scale 0 -100 class building class / from metroscan bus_v distance (miles) from nearest ventura rapid bus stop bus_w distance (miles) from nearest wilshire-whittier rapid bus stop blueline distance (miles) from nearest blue line station grnline distance (miles) from nearest green line station redline distance (miles) from nearest red line station cr_av distance (miles) from nearest metrolink station on the antelope valley line cr_or distance (miles) from nearest metrolink station on the orange line cr_ri distance (miles) from nearest metrolink station on the riverside line cr_sb distance (miles) from nearest metrolink station on the san bernadino line cr_ve distance (miles) from nearest metrolink station on the ventura line shore distance (miles) from the pacific shore line kern distance (miles) from kern county boundary orange distance (miles) from orange county boundary sb distance (miles) from san bernadino county boundary ventura distance (miles) from ventura county boundary hwy_sl straight line distance from the nearest limited access road ramp_sl straight line distance from the nearest limited access road ramp ramp_net network distance from the nearest limited access road ramp dt_sl straight line distance from downtown LA (7th St/Metro Center Station) dt_net network distance from downtown LA (7th St/Metro Center Station) without using limited access roads vbus_q within 1/4 mile of ventura rapid bus stop vbus_h within 1/2 mile of ventura rapid bus stop wbus_q within 1/4 mile of wilshire-whittier rapid bus stop wbus_h within 1/2 mile of wilshire-whittier rapid bus stop blue_q within 1/4 mile of blue line station

32
blue_h within 1/2 mile of blue line station green_q within 1/4 mile of green line station green_h within 1/2 mile of green line station red_q within 1/4 mile of red line station red_h within 1/2 mile of red line station av_q within 1/4 mile of antelop valley Metrolink station av_h within 1/2 mile of antelop valley Metrolink station or_q within 1/4 mile of orange Metrolink station or_h within 1/2 mile of orange Metrolink station ri_q within 1/4 mile of riverside Metrolink station ri_h within 1/2 mile of riverside Metrolink station sb_q within 1/4 mile of san bernardino Metrolink station sb_h within 1/2 mile of san bernardino Metrolink station ve_q within 1/4 mile of ventura Metrolink station ve_h within 1/2 mile of ventura Metrolink station hwy_q within 1/4 mile of grade separated road hwy_h within 1/2 mile of grade separated road hwy_1 within 1 mile of grade separated road shore_q within 1/4 mile of shoreline shore_h within 1/2 mile of shoreline shore_1 within 1 mile of shoreline income average houshold income within 1 mile of parcel / from 2000 SCAG TAZ data pop_cen population within 1 mile radius / from 2000 census block data pop_fem female population within 1 mile radius / from 2000 census block data pop_wht white population within 1 mile radius / from 2000 census block data pop_blk black population within 1 mile radius / from 2000 census block data pop_his hispanic (all races) population within 1 mile radius / from 2000 census block data pop_asn asian population within 1 mile radius / from 2000 census block data pop_ain american indian population within 1 mile radius / from 2000 census block data pop_pac pacific islander population within 1 mile radius / from 2000 census block data pop_18 population under age 18 within 1 mile radius / from 2000 census block data pop_65 population age 65 and over within 1 mile radius / from 2000 census block data pop_age average age of population within 1 mile radius / from 2000 census block data unit_tot housing units within 1 mile radius / from 2000 census block data unit_occ occupied housing units within 1 mile radius / from 2000 census block data unit_own owner occupied housing units within 1 mile radius / from 2000 census block data pop_taz population within 1 mile radius / from 2000 SCAG TAZ data pop_res residential population within 1 mile radius / from 2000 SCAG TAZ data pop_work civilian workers living within 1 mile radius / from 2000 SCAG TAZ data hh_tot households living within 1 mile radius / from 2000 SCAG TAZ data hh_sing single unit households within 1 mile radius / from 2000 SCAG TAZ data emp_tot total jobs within 1 mile radius / from 2000 SCAG TAZ data emp_ret retail jobs within 1 mile radius / from 2000 SCAG TAZ data emp_ser service jobs within 1 mile radius / from 2000 SCAG TAZ data p_white proportion white population within 1 mile radius / from 2000 census block data p_black proportion black population within 1 mile radius / from 2000 census block data p_hisp proportion hispanic (all races) population within 1 mile radius /2000 census block data p_asian proportion asian population within 1 mile radius / from 2000 census block data

33
p_aind proportion american indian population within 1 mile radius / 2000 census block data p_pacf proportion pacific islander population within 1 mile radius / 2000 census block data p_18 proportion population under age 18 within 1 mile radius / 2000 census block data p_65 proportion population age 65 and over within 1 mile radius / 2000 census block data p_vacant proportion housing units that are vacant within 1 mile radius / 2000 census block data p_own prop. of housing units that are owner occupied within 1 mile radius / 2000 census block data p_work prop.of residential population that are civilian workers within 1 mile radius / 2000 SCAG TAZ data p_hhsing prop.of households that are single unit households within 1 mile radius / 2000 SCAG a TAZ data p_retail proportion of jobs that are retail within 1 mile radius / from 2000 SCAG TAZ data p_ser proportion of jobs that are service within 1 mile radius / from 2000 SCAG TAZ data acre_wat water acreage within 1 mile radius / from 2000 census block data acre_lnd land acreage within 1 mile radius / from 2000 census block data den_pop population per acre within 1 mile / from 2000 census block data den_unit units per acre within 1 mile / from 2000 census block data den_emp jobs per acre within 1 mile / from 2000 SCAG TAZ data a60er no. of civilian workers (2000) living within 60 minutes (1997 SCAG travel times) by auto a45er no. of civilian workers (2000) living within 45 minutes (1997 SCAG travel times) by auto a30er no. of civilian workers (2000) living within 30 minutes (1997 SCAG travel times) by auto a15er no. of civilian workers (2000) living within 15 minutes (1997 SCAG travel times) by auto tw60er no. of civilian workers (2000) living within 60 minutes by transit-walking access tw45er no. of civilian workers (2000) living within 45 minutes by transit-walking access tw30er no. of civilian workers (2000) living within 30 minutes by transit-walking access tw15er no. of civilian workers (2000) living within 15 minutes by transit-walking access ta60er no. of civilian workers (2000) living within 60 minutes by transit-auto access ta45er no. of civilian workers (2000) living within 45 minutes by transit-auto access ta30er no. of civilian workers (2000) living within 30 minutes by transit-auto access ta15er no. of civilian workers (2000) living within 15 minutes by transit-auto access a60job number of jobs (2000) living within 60 minutes (1997 SCAG travel times) by auto a45job number of jobs (2000) living within 45 minutes (1997 SCAG travel times) by auto a30job number of jobs (2000) living within 30 minutes (1997 SCAG travel times) by auto a15job number of jobs (2000) living within 15 minutes (1997 SCAG travel times) by auto tw60job no. of jobs (2000) living within 60 minutes by transit-walking access tw45job no. of jobs (2000) living within 45 minutes by transit-walking access tw30job no. of jobs (2000) living within 30 minutes by transit-walking access tw15job no. of jobs (2000) living within 15 minutes by transit-walking access ta60job no. of jobs (2000) living within 60 minutes by transit-auto access ta45job no. of jobs (2000) living within 45 minutes by transit-auto access ta30job no. of jobs (2000) living within 30 minutes by transit-auto access ta15job no. of jobs (2000) living within 15 minutes by transit-auto access city_met city where the parcel is located, as defined in the metroscan database, including unincorporated Census Designated Places (CDPs) incorp parcel is in incorporated area / from census places (dummy) agoura_h in incorported city of agoura hills / from census places (dummy) alhambra in incorported city of alhambra / from census places (dummy) arcadia in incorported city of arcadia / from census places (dummy)

34
artesia in incorported city of artesia / from census places (dummy) azusa in incorported city of azusa / from census places (dummy) baldwin_ in incorported city of baldwin park / from census places (dummy) bell in incorported city of bell / from census places (dummy) bell_gar in incorported city of bell gardens / from census places (dummy) bellflow in incorported city of bellflower / from census places (dummy) beverly_ in incorported city of beverly hills / from census places (dummy) bradbury in incorported city of bradbury / from census places (dummy) burbank in incorported city of burbank / from census places (dummy) calbasa in incorported city of calabasas / from census places (dummy) carson in incorported city of carson / from census places (dummy) cerritos in incorported city of cerritos / from census places (dummy) claremon in incorported city of claremont / from census places (dummy) commerce in incorported city of commerce / from census places (dummy) compton in incorported city of compton / from census places (dummy) covina in incorported city of covina / from census places (dummy) cudahy in incorported city of cudahy / from census places (dummy) culver_c in incorported city of culver city / from census places (dummy) diamond_ in incorported city of diamond bar / from census places (dummy) downey in incorported city of downey / from census places (dummy) duarte in incorported city of duarte / from census places (dummy) el_monte in incorported city of el monte / from census places (dummy) el_segun in incorported city of el segundo / from census places (dummy) gardena in incorported city of gardena / from census places (dummy) glendale in incorported city of glendale / from census places (dummy) glendora in incorported city of glendora / from census places (dummy) hawaii_g in incorported city of hawaii gardens / from census places (dummy) hawthorn in incorported city of hawthorne / from census places (dummy) hermosa_ in incorported city of hermosa beach / from census places (dummy) hidden_h in incorported city of hidden hills / from census places (dummy) huntingt in incorported city of huntington park / from census places (dummy) industry in incorported city of industry / from census places (dummy) inglewoo in incorported city of inglewood / from census places (dummy) inwindal in incorported city of irwindale / from census places (dummy) la_canad in incorported city of la canada-flintridge / from census places (dummy) la_habra in incorported city of la habra heights / from census places (dummy) la_mirad in incorported city of la mirada / from census places (dummy) la_puent in incorported city of la puente / from census places (dummy) la_verne in incorported city of la verne / from census places (dummy) lakewood in incorported city of lakewood / from census places (dummy) lancaste in incorported city of lancaster / from census places (dummy) lawndale in incorported city of lawndale / from census places (dummy) lomita in incorported city of lomita / from census places (dummy) long_bea in incorported city of long beach / from census places (dummy) los_ange in incorported city of los angeles / from census places (dummy) lynwood in incorported city of lynwood / from census places (dummy) malibu in incorported city of malibu / from census places (dummy) manhatta in incorported city of manhattan beach / from census places (dummy)

35
maywood in incorported city of maywood / from census places (dummy) monrovia in incorported city of monrovia / from census places (dummy) montebel in incorported city of montebello / from census places (dummy) monterey in incorported city of monterey park / from census places (dummy) norwalk in incorported city of norwalk / from census places (dummy) palmdale in incorported city of palmdale / from census places (dummy) palos_ve in incorported city of palos verdes estates / from census places (dummy) paramoun in incorported city of paramount / from census places (dummy) pasedena in incorported city of pasadena / from census places (dummy) pico_riv in incorported city of pico rivera / from census places (dummy) pomona in incorported city of pomona / from census places (dummy) rancho_p in incorported city of rancho palos verdes / from census places (dummy) redondo_ in incorported city of redondo beach / from census places (dummy) roll_h in incorported city of rolling hills / from census places (dummy) roll_h_e in incorported city of rolling hills estates / from census places (dummy) rosemead in incorported city of rosemead / from census places (dummy) san_dima in incorported city of san dimas / from census places (dummy) san_fern in incorported city of san fernando / from census places (dummy) san_gabr in incorported city of san gabriel / from census places (dummy) san_mari in incorported city of san marino / from census places (dummy) santa_cl in incorported city of santa clarita / from census places (dummy) santa_fe in incorported city of santa fe springs / from census places (dummy) santa_mo in incorported city of santa monica / from census places (dummy) sierra_m in incorported city of sierra madre / from census places (dummy) signal_h in incorported city of signal hill / from census places (dummy) south_el in incorported city of south el monte / from census places (dummy) south_ga in incorported city of south gate / from census places (dummy) south_pa in incorported city of south pasedena / from census places (dummy) temple_c in incorported city of temple city / from census places (dummy) torrance in incorported city of torrance / from census places (dummy) walnut in incorported city of walnut / from census places (dummy) west_cov in incorported city of west covina / from census places (dummy) west_hol in incorported city of west hollywood / from census places (dummy) westlake in incorported city of westlake village / from census places (dummy) whittier in incorported city of whittier / from census places (dummy) jan sold in january / from metroscan (dummy) feb sold in february / from metroscan (dummy) mar sold in march / from metroscan (dummy) apr sold in april / from metroscan (dummy) may sold in may / from metroscan (dummy) jun sold in june / from metroscan (dummy) jul sold in july / from metroscan (dummy) aug sold in august / from metroscan (dummy) sep sold in september / from metroscan (dummy) oct sold in october / from metroscan (dummy) nov sold in november / from metroscan (dummy) dec sold in december / from metroscan (dummy) y98 sold in 1998 / from metroscan (dummy)

36
y99 sold in 1999 / from metroscan (dummy) y00 sold in 2000 / from metroscan (dummy) y01 sold in 2001 / from metroscan (dummy) landuse land use description / from metroscan convert parcel is condo conversion / from metroscan (dummy) unit_2 parcel is 2 unit complex / from metrocan (dummy) unit_3 parcel is 3 unit complex / from metrocan (dummy) unit_4 parcel is 4 unit complex / from metrocan (dummy) unit_5up parcel is 5+ unit complex / from metrocan (dummy) unit_bad the number of units in the "totunits" variable does not match the number of units described in the "land use" variable (dummy) pool complex has a pool / from metrocan (dummy) bank parcel is "bank, savings and loans" / from metrocan (dummy) off_res parcel is "office building, with residence" / from metrocan (dummy) office parcel is "office building" / from metrocan (dummy) prof parcel is "professional building" / from metrocan (dummy) restrnt parcel is "resaurant, cocktail lounge" / from metrocan (dummy) shop_nbr parcel is "shopping center, neighborhood" / from metrocan (dummy) shop_reg parcel is "shopping center, regional" / from metrocan (dummy) str_off parcel is "store and office combination" / from metrocan (dummy) str_res parcel is "store and residence combination" / from metrocan (dummy) store parcel is "store" / from metrocan (dummy) loft parcel is "loft type building" / from metrocan (dummy) story_2 parcel is "2 story building" / from metrocan (dummy) story_3 parcel is "3 story building" / from metrocan (dummy) story_5 parcel is "5 story building" / from metrocan (dummy)