Land uses in the context of a perfect grid: the case of ...
12
1 Land uses in the context of a perfect grid: the case of Barcelona Rodrigo Mora Universidad Tecnica Federico Santa Maria, Chile Abstract Syntactic analysis of cities has shown that the distribution of land uses in the urban network is influenced by the pattern of syntactic integration, through its effects on the city’s movement patterns (Hillier, 1993; Hillier, 1996). However, the experience has so far been based on the study of deformed or irregular grids, where the grid’s pattern of syntactic integration tends to be strongly differentiated. But what would be therefore the case of regular grids, where the integration lines are likely to be homogeneous, and the effects of the grid on movement therefore likely to be less? This paper attempts to answer this question by syntactic and land use analysis of the regular grid in Barcelona. The initial conjecture was that, because of its lower level of differentiation, the effects of the grid configuration on land uses patterns would be weak. The results show that this is just partially the case. Effects of the grid configuration on land uses patterns can still be found in some instances, even though in other cases even diffusion is the norm. Furthermore, the study shows that the land uses distribution is affected by three main situations: the nature of the good offered, disruptions that occur in the grid (such as oblique streets) or by planned infrastructures that act as “magnets” such municipal markets or hospitals, and by the city’s cultural particularities. 1.- Introduction Since Jacobs (1962), the idea of a more compact, tolerant and socially diverse city has been gradually incorporated into urban planning both in architectural practice and theory (Rogers, 1997), or in urban studies (Hillier, 1996). According to Jacobs, one of the ingredients that would facilitate such a diverse city is the diversity of uses, insofar as it permits an extended occupation of the street during the day as well as facilitates the emergence of a sense of solidarity and mutual care among the street’s users. But how do these uses form and locate? and, perhaps more important for architects and planners, is there any spatial variable behind that? . 1.1.- About the distribution of the uses in a city It is almost a commonplace that location is a key factor in any store’s success or failure. Such a good location (the one that provides enough customers) not only depends on the accessibility but also on the kind of goods the store sells (Brown, 1992). In order to differentiate goods, a normally cited standard classification distinguishes goods as convenience, comparative and specialised goods. The former corresponds to inexpensive merchandise like groceries, newsagents or tobacco and tends to be distributed homogeneously in the city. Comparative goods, on the other hand, correspond to more
Transcript of Land uses in the context of a perfect grid: the case of ...

1
Land uses in the context of a perfect grid: the case of Barcelona Rodrigo Mora Universidad Tecnica Federico Santa Maria, Chile Abstract Syntactic analysis of cities has shown that the distribution of land uses in the urban network is influenced by the pattern of syntactic integration, through its effects on the city’s movement patterns (Hillier, 1993; Hillier, 1996). However, the experience has so far been based on the study of deformed or irregular grids, where the grid’s pattern of syntactic integration tends to be strongly differentiated. But what would be therefore the case of regular grids, where the integration lines are likely to be homogeneous, and the effects of the grid on movement therefore likely to be less? This paper attempts to answer this question by syntactic and land use analysis of the regular grid in Barcelona. The initial conjecture was that, because of its lower level of differentiation, the effects of the grid configuration on land uses patterns would be weak. The results show that this is just partially the case. Effects of the grid configuration on land uses patterns can still be found in some instances, even though in other cases even diffusion is the norm. Furthermore, the study shows that the land uses distribution is affected by three main situations: the nature of the good offered, disruptions that occur in the grid (such as oblique streets) or by planned infrastructures that act as “magnets” such municipal markets or hospitals, and by the city’s cultural particularities. 1.- Introduction Since Jacobs (1962), the idea of a more compact, tolerant and socially diverse city has been gradually incorporated into urban planning both in architectural practice and theory (Rogers, 1997), or in urban studies (Hillier, 1996). According to Jacobs, one of the ingredients that would facilitate such a diverse city is the diversity of uses, insofar as it permits an extended occupation of the street during the day as well as facilitates the emergence of a sense of solidarity and mutual care among the street’s users. But how do these uses form and locate? and, perhaps more important for architects and planners, is there any spatial variable behind that? . 1.1.- About the distribution of the uses in a city It is almost a commonplace that location is a key factor in any store’s success or failure. Such a good location (the one that provides enough customers) not only depends on the accessibility but also on the kind of goods the store sells (Brown, 1992). In order to differentiate goods, a normally cited standard classification distinguishes goods as convenience, comparative and specialised goods. The former corresponds to inexpensive merchandise like groceries, newsagents or tobacco and tends to be distributed homogeneously in the city. Comparative goods, on the other hand, correspond to more
2
expensive products (like, for instance, clothes and furniture), where the customer tends to visit more than one store when selecting and purchasing the products. Finally, specialised goods are those more clearly defined, such as antiquaries or bookstores, addressed at specific groups of the population. The second principle commonly cited on land use distribution is agglomeration, because goods tend to agglomerate within families that create distinctive sub areas within a city. The way in which land uses distribute within the city has been firstly studied by Christaller (1966) who, through its central place theory, suggests that the supply of goods in a city organises in circles with different ranges, according the goods’ own nature. The bid rent theory, on the other hand, sustains that different uses compete for central location on a city, resulting on an unequal distribution of activities organised by their willingness to pay the rents that each location imposes. The idea is that while commercial activity is willing to pay the high rents of central locations, commercial and industrial uses tend to be pushed away to more distant places. But how do the different uses distribute a city? 1.2.- Movement economies and land use patterns The relation between land uses and spatial configuration has been studied by Hillier (1996) in what has been called the “movement economy process” 1996), in which the city’s patterns of movement are influenced by the city’s spatial structure itself. The network then becomes a sort of movement in equalities, which results in a spontaneous assignation of uses, fundamentally of those highly dependent on such a movement, like retail. The process is then a sort of spiral, where the accumulative concentration of land uses attracts more people to these places. Space Syntax experience has demonstrated that, in irregular grids, syntactic parameters such as int r=n and int r=3 are strongly related to vehicular and pedestrian movement (Hillier-Penn 1993). This in turn has influenced the location of retail and shops, forming what has been called a “live centrality” (Hillier 1999). The reason for this phenomenon is that deformed grids present high differences in the length and connections of their streets, which results in a wide range of integration values both in the large and short scales (integration r=n and r=3 respectively). But what would be the effect of spatial configuration upon land use in a regular grid? A network of straight streets disposed at regular intervals forms a regular grid, which tends to produce a rather homogeneous syntactic pattern on its streets. This is the case with one of the most famous examples of city regeneration and also one of the most vibrant and symbolic cities for contemporary urban planning: Barcelona and its central part, L’Example. 2.-Barcelona and the regular grid Barcelona’s regular grid, known as L’Example, was commissioned in 1874 to Idelsonso Cerdá, as a way to sanitise the city (Fernández-Arnesto, 1992), then still constrained within its medieval walls. Cerda’s plan consisted of regular streets that followed the direction of the sea and connected the existent city (now Old City), with the surrounding villages (figure 1).

3
Figure 1 (top left):L’Example (Cerdá plan) in the city Figure 2 (bottom left): Barcelona’s main roads Figure 3 (right):L’Example structure
L’Example was formed by 113m square blocks urbanised parallel to Gran Via, Barcelona’a main street, and divided by north-south, east-west and oblique streets. One of these oblique streets is Diagonal, which intersects Gran Via in Gracies roundabout (see figure 2). All the streets except Diagonal and Gran Via maintain single-traffic directions. The most important of the north-south roads is D’Arago, while east-west roads connect the mountains with the city’s civic centre, Placa Catalunya. Two main streets play a significant role in this: Passeig Gracia and Rambla Catalunya; the former displays the most elegant and significant shops and institutions of the city, while the latter is a popular commercial street that continues to the sea once has crossed Placa Catalunya (see figure 3).
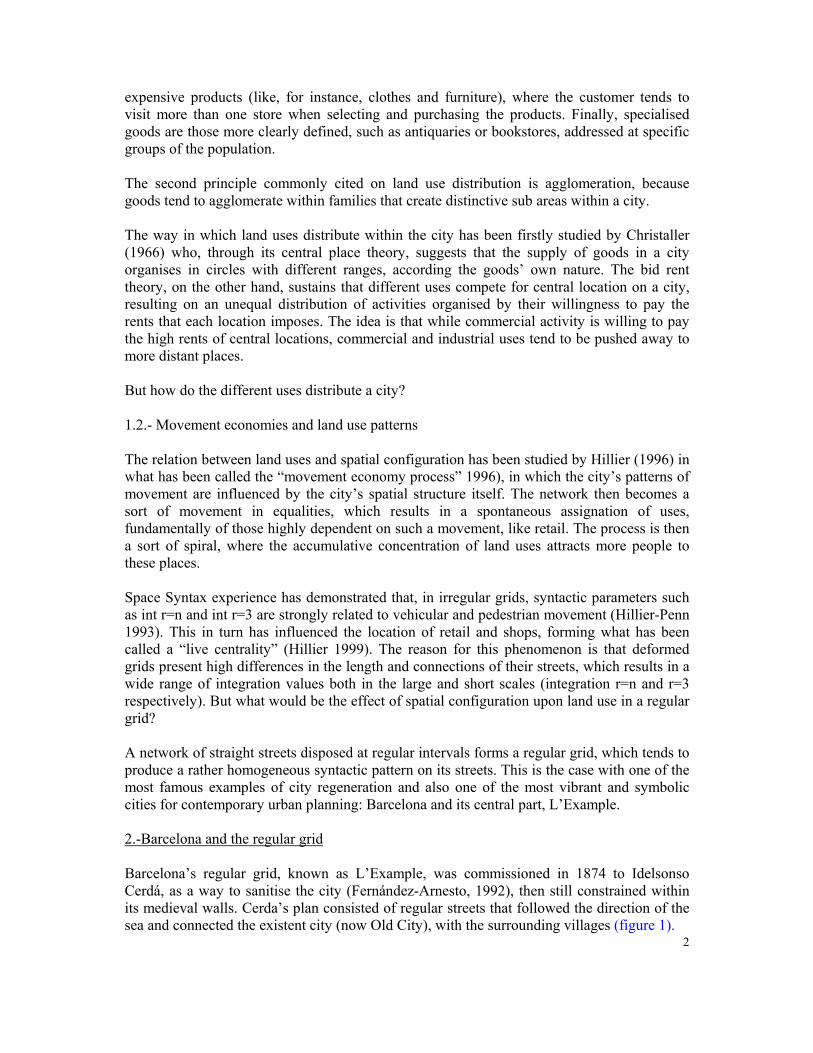
The plan also defined a hierarchy of infrastructures like the Hospital (at its heart), two parks and, at street junctions, the “ochaves”, chamfered blocks for commerce. Figures 4 and 5 show the syntactic plan of Barcelona integration r=n and r=3 respectively. It can be appreciated that L’Example straight structure clearly distinguishes from the rest, insofar its regular streets penetrate the more dense and irregular peripheral districts. This situation expresses syntactically through a homogeneous area of highly integrated lines (although Gran Via and Diagonal have much higher values), becoming a sort of natural central space.
4
Figure 4(top): Barcelona’s 2000 Integration r=n axial map Figure 5(bottom): Barcelona’s 2000 Integration r=3 axial map
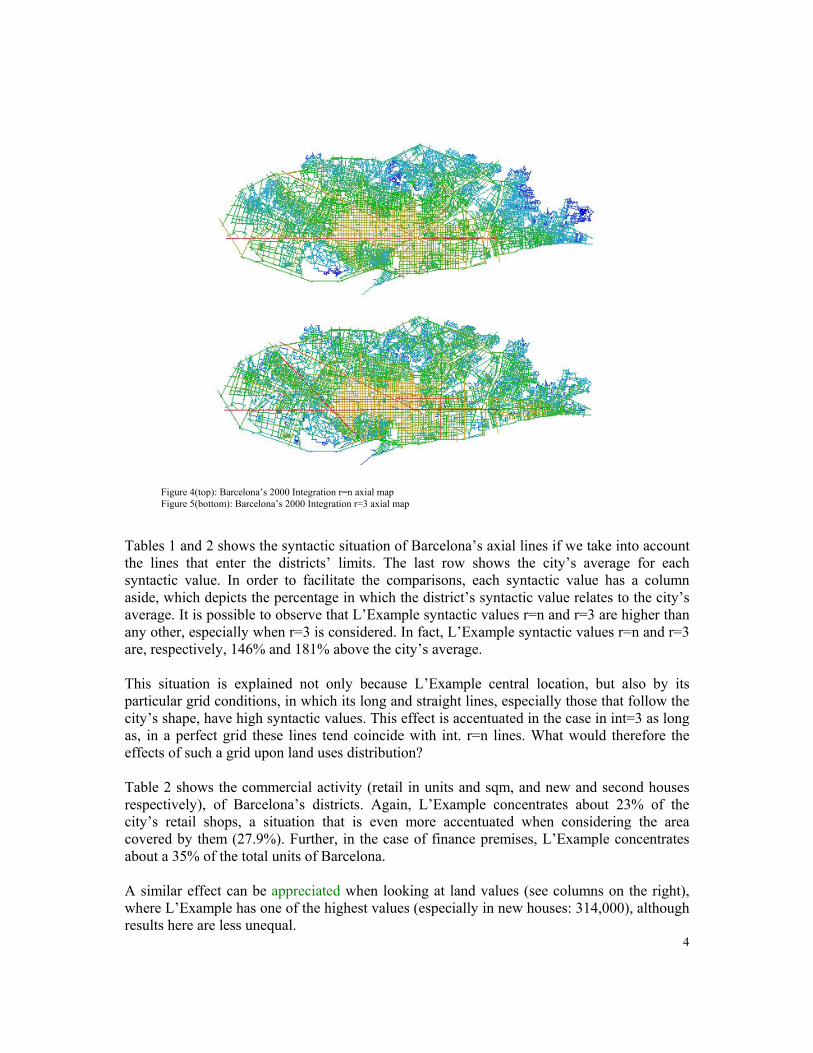
Tables 1 and 2 shows the syntactic situation of Barcelona’s axial lines if we take into account the lines that enter the districts’ limits. The last row shows the city’s average for each syntactic value. In order to facilitate the comparisons, each syntactic value has a column aside, which depicts the percentage in which the district’s syntactic value relates to the city’s average. It is possible to observe that L’Example syntactic values r=n and r=3 are higher than any other, especially when r=3 is considered. In fact, L’Example syntactic values r=n and r=3 are, respectively, 146% and 181% above the city’s average. This situation is explained not only because L’Example central location, but also by its particular grid conditions, in which its long and straight lines, especially those that follow the city’s shape, have high syntactic values. This effect is accentuated in the case in int=3 as long as, in a perfect grid these lines tend coincide with int. r=n lines. What would therefore the effects of such a grid upon land uses distribution? Table 2 shows the commercial activity (retail in units and sqm, and new and second houses respectively), of Barcelona’s districts. Again, L’Example concentrates about 23% of the city’s retail shops, a situation that is even more accentuated when considering the area covered by them (27.9%). Further, in the case of finance premises, L’Example concentrates about a 35% of the total units of Barcelona. A similar effect can be appreciated when looking at land values (see columns on the right), where L’Example has one of the highest values (especially in new houses: 314,000), although results here are less unequal.
5
District Int r=n % Int r=3 % conn %
Ciutat Vella (old city) 1.56 108.4 2.977 98.9 5.44 95.5 L’Example 2.1 146 5.47 181.7 23.2 407.3 Gracia NI NI NI NI NI NI Sans-montjuic 1.8 125.1 3.47 115.3 7.69 135 Les Corts 1.512 105.1 3.017 100.2 5.42 95.1 Sorria 1.459 101.4 3.079 102.3 5.94 104.4 Horta-Guinardo NI NI NI NI NI NI Nou Barris NI NI NI NI NI NI Sant Andreu 1.245 86.5 2.724 90.5 5.01 87.9 Sant Marti 1.79 124.4 3.42 113.6 6.91 121.3 CITY AVERAGE 1.439 100 2.977 100 5.7 100 Table 1:Barcelona’s districts’ syntactic values
district commercial activity land values (*)
retail (units) % retail (m2) % finance
premises % new houses sec-hand houses
Ciutat Vella (old city) 4,206 10.8 290,418 9.3 198 5.8 214,500 165,000
L’Example 9,030 23.3 862,520 27.9 1,192 34.7 314,400 232,000
Gracia 3,285 8.5 196,854 6.3 251 7.3 277,500 211,000
Sans-montjuic 3,852 9.9 304,880 9.8 238 6.9 190,000 202,000
Les Corts 1,819 4.7 243,661 7.8 317 9.2 293,000 248,000
Sorria 3,665 9.4 283,822 9.1 523 15.2 308,000 270,000
Horta-Guinardo 2,995 7.7 170,575 5.5 149 4.3 255,000 203,000
Nou Barris 3,170 8.2 197,685 6.4 145 4.2 278,000 188,000
Sant Andreu 2,636 6.8 220,519 7.1 145 4.2 196,000 191,000
Sant Marti 4,175 10.8 335,851 10.8 282 8.2 252,000 190,000
total 36,833 100 3,112,785 100 3,440 100 257,840 210,000
Table 2:Barcelona’s districts' land values and commercial activity (*) Prices in pesetas Source:Barcelona’s industrial and commercial office, 1998. Statistic Department, Ayuntamiento de Barcelona.
Scattergrams 1 ,2 ,3, 4, and 5 show L’Example’s commercial activity with some syntactic measures. The first two columns (left) compare L’Example mean integration r=n and r=3

6
Scattegrams 1, 2, 3, 4, and 5
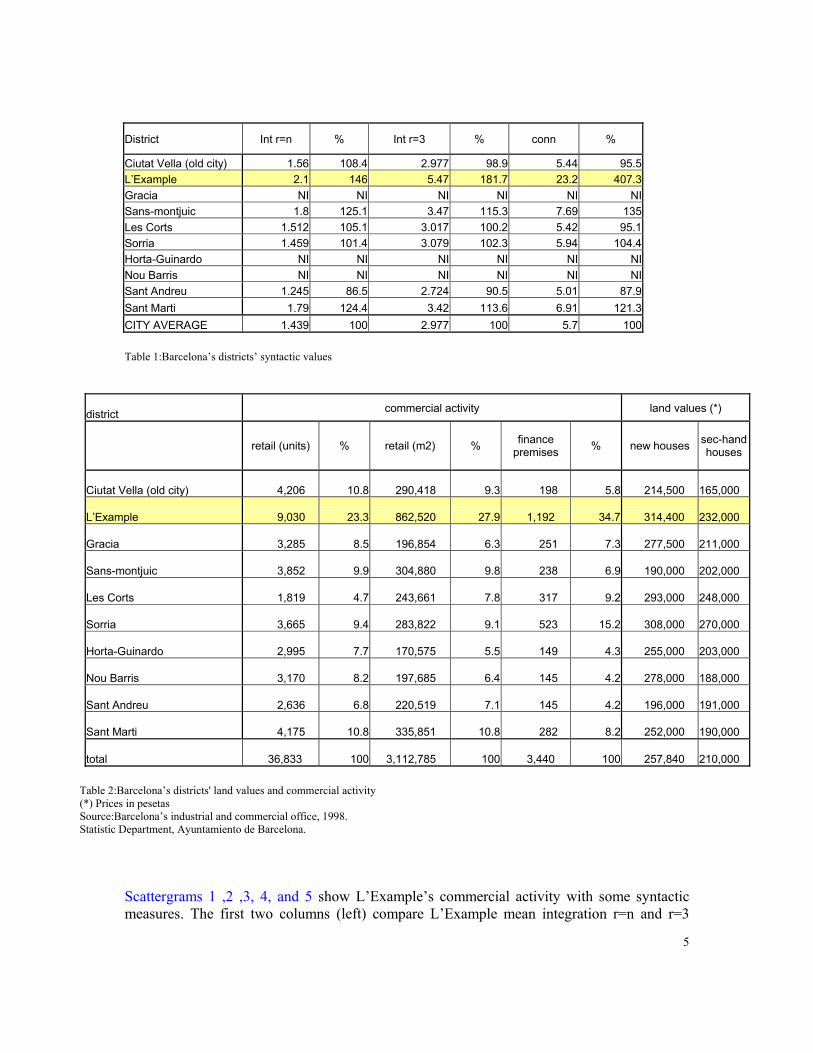
with retail shops (1,2), while the third (center) shows int r=n against finance units. The last scattegrams (right) compare int r=n against new and second homes values respectively. The regressions move form (r=0.64) (second home values) to 0.94 (r=3 against retail shops), which give us an idea of the importance of L’Example in the city’s urban economy. Such differences do not respond necessarily to the district’s size, or number of streets because, as table 3 shows, L’Example is neither the largest district nor has the largest street length. On the contrary, its predominance seems to respond to its central position within the network as well as to its spatial configuration, which with relatively few but long streets links efficiently to the surroundings areas. But how are these uses distributed in such a buoyant commercial area?
7
district street length in m
number of streets
street average in m
area (km2) population density
(inhab/km2)
retail/km2
Ciutat Vella (old city) 83,536 644 129.7 4.3 19,814 97.8
L’Example 113,523 108 1,051.1 7.5 33,122 120.4
Gracia 81,474 320 254.6 4.15 28,001 79.5
Sans-montjuic 155,085 524 296.0 20.1 13,771 19.0
Les Corts 72,488 234 309.8 5.98 6,510 30.4
Sorria 199,706 636 314.0 20.0 27,759 18.3
Horta-Guinardo 143,502 523 274.4 11.9 14,142 25.2
Nou Barris 112,940 374 302.0 8.0 21,105 39.2
Sant Andreu 99,378 360 276.1 6.5 20,689 40.6
Sant Marti 166,252 435 382.2 9.8 20,902 42.6
streets in more than one district
59,913 216 277.4
Barcelona 36,833 4374 351.6 98.2 20,581.5 100
Table 3: Barcelona’s district’s densities and areas Source:Barcelona’s industrial and commercial office, 1998. Statistic Department, Ayuntamiento de Barcelona. 3.- Movement and land use distribution in L’Example In order to test the land use pattern in the zone of L’Example, two surveys were realised in a trip to Barcelona during year 2001. These included a complete land use survey over 220 blocks of L’Example, and a vehicular and pedestrian counting of some of its streets. Vehicular and pedestrian counting were realised on weekdays between 8:30 and 9:30, following a three-minutes intervals gate technique. The gates (37, see figure 6) were distributed all over the areas, trying to take records of main streets. The main findings of the surveys are that pedestrian movement is higher on east-west roads (towards the city’s centre) and, as expected, mainly concentrated on pedestrian streets like Passeig Gracia and Rambla Catalunya. Vehicular movement, on the other hand, follows a more diversified pattern: while those streets that more easily link both sides of the city are predominately vehicular, exactly the contrary occurs on Rambla Catalunya. A more balanced relation pedestrian-vehicular occurs on the rest of the L’Example’s streets.

8
Figure 6:Location of vehicular and pedestrian gates
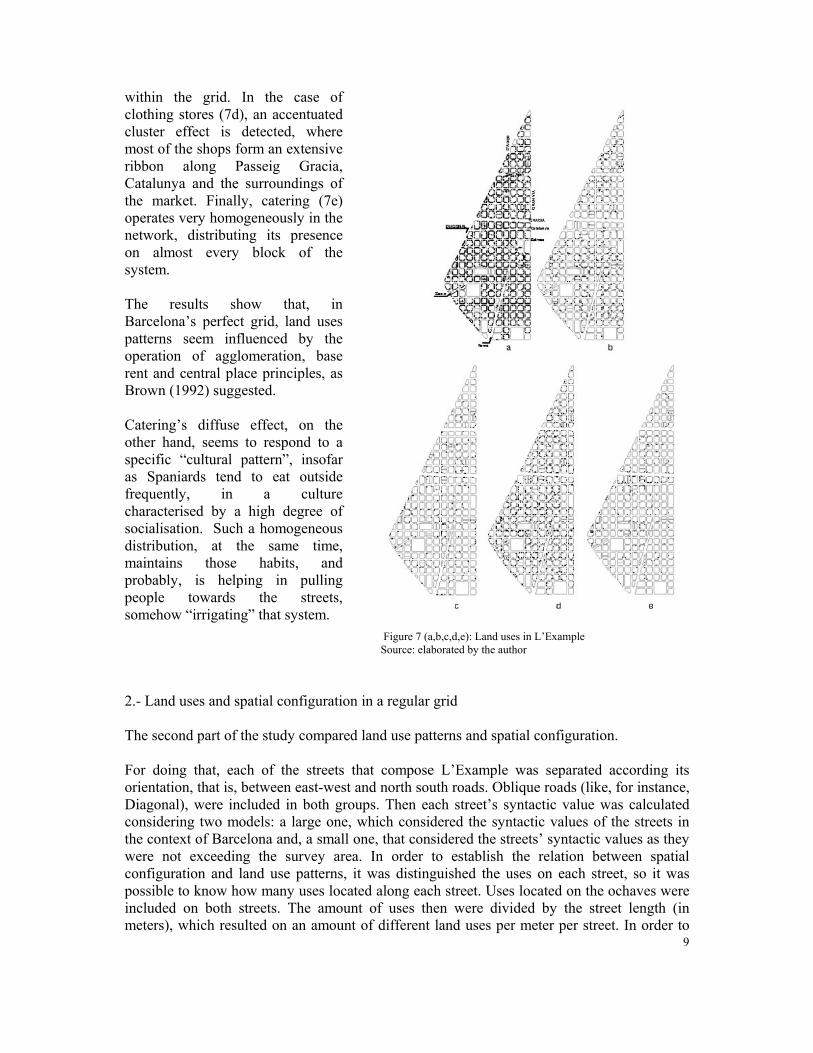
The land use survey was realised over an area of approximately 4,5 km2 (220 blocks), considering the standard classification mentioned before. It was differentiated therefore between small-scale retail and catering (convenience), furniture and clothing stores (comparative), and specialised shops. It was also registered finance premises and professional and non-professional services (like, for instance, hairdressing). Figure 7 (a,b,c,d and e) depicts all the uses (a) , small scale retail (b), finance premises (c), cloth shops (d) and catering (e) stores respectively. The results show that, overall (7a), the distribution of commercial activities follows a more homogeneous pattern than in a deformed grid. In fact, all the blocks show commercial activity except when this is not possible due the existence of universities, parks or hospitals. However, when looking more acutely, certain ribbons of dense commercial activity appear, especially along the main pedestrian streets and to the west of Passeig Gracia. Likewise, a dense concentration of uses exist near the Hospital, and especially around the Municipal Market, where stores seem tightly clustered.
Figure 7b (small-scale shops), shows a rather homogeneous pattern of distribution, although a distance of approximately 100-150 meters is maintained from the main commercial and expensive streets1, Passeig Gracia, Diagonal and Rambla Catalunya. On the other hand, finance premises (7c) tend to group precisely at those avenues, forming clusters of three or four units. When this does not occur, finance premises rather homogeneously distributed
1 Estate agents consulted during the trip defined the area within P. Gracia, Diagonal and Catalunya as the most expensive in the city.
9
Figure 7 (a,b,c,d,e): Land uses in L’Example Source: elaborated by the author
within the grid. In the case of clothing stores (7d), an accentuated cluster effect is detected, where most of the shops form an extensive ribbon along Passeig Gracia, Catalunya and the surroundings of the market. Finally, catering (7e) operates very homogeneously in the network, distributing its presence on almost every block of the system. The results show that, in Barcelona’s perfect grid, land uses patterns seem influenced by the operation of agglomeration, base rent and central place principles, as Brown (1992) suggested. Catering’s diffuse effect, on the other hand, seems to respond to a specific “cultural pattern”, insofar as Spaniards tend to eat outside frequently, in a culture characterised by a high degree of socialisation. Such a homogeneous distribution, at the same time, maintains those habits, and probably, is helping in pulling people towards the streets, somehow “irrigating” that system. 2.- Land uses and spatial configuration in a regular grid The second part of the study compared land use patterns and spatial configuration. For doing that, each of the streets that compose L’Example was separated according its orientation, that is, between east-west and north south roads. Oblique roads (like, for instance, Diagonal), were included in both groups. Then each street’s syntactic value was calculated considering two models: a large one, which considered the syntactic values of the streets in the context of Barcelona and, a small one, that considered the streets’ syntactic values as they were not exceeding the survey area. In order to establish the relation between spatial configuration and land use patterns, it was distinguished the uses on each street, so it was possible to know how many uses located along each street. Uses located on the ochaves were included on both streets. The amount of uses then were divided by the street length (in meters), which resulted on an amount of different land uses per meter per street. In order to

10
Figure 8: L’Example’s small system axial map (int r=n)
avoid including some segments of streets unable to be used for commerce (for instance, a park), those lengths were discounted from the total length. Such an operation resulted in an index, which then was compared to syntactic values. Initial findings showed that, overall, correspondences were weak both for r=n and r=3, although the latter performed better (r= 0.315). So it was compared the streets according to their orientation, resulting in a better correlation in north south lines (0,413) than in east-west ones. Even more, such results improved when Gran Via was extracted (r=0.767), which might be explained due to the civic character of that street, where Universities, institutions and large companies locate, generating a relatively low density of uses. In order to find out what was happening with east-westlines, another exercise was applied. Figures 8 and 9 shows the syntactic axial maps r=n and r=3 respectively of an even smaller system, where all east-west streets are cut by Diagonal. If we consider the syntactic values of such a system, the correlation clearly improves to r=0.433(r=n) and 0.535 (r=3). Why does this occur? The fact may have its roots in Stonor’s study of Manhattan (1991), where it was detected that disruptions that occur on the grid, such as an oblique street, had a profound impact in the way that such a grid was used. The idea is that, in a regular grid, diagonal disruptions are used as a sort of “vehicle” that permits us to move into two directions. That is what could be happening in Diagonal, which seems to be perceived as a “limit” and also, as a way of distributing people into L’Example.

11
Figure 9: L’Example’s small system axial map (int r=3)
3.- Conclusions The study has tried to understand the influence of spatial configuration upon land uses location in the context of the Barcelona’s perfect grid. It was shown that such a grid has had an enormous impact on Barcelona’s commercial uses, impact that seems not related necessarily to attributes like density or size, but to its specific spatial configuration and position within the city’s spatial network. Moreover, such spatial configuration has transformed what was a set of regular streets disposed at regular intervals, in a large checkboard that acts as an extended centre. Such a centre disposes the uses in a rather homogeneous pattern, despite the fact that a simultaneous operation of bid rent, agglomeration and central place theories seems to organise land uses and thus to alter that pattern. Such an alteration can be perceived on the agglomeration or dispersion of certain uses according to their nature, and the predominance of specific uses in expensive sectors. The second factor that alters the initial homogeneity corresponds to the disruptions that occur in the grid, either planned infrastructures or oblique streets, which respectively modify the concentration of uses on certain streets or the way such streets are occupied. The third and perhaps subtler factor seems to be some cultural particularities, like Barcelona’s high number of restaurants, most of them attended by locals. Syntactically, the work showed that int r=3 seems to be the most reliable syntactic measure when considering commercial activities, which is coincident with previous Space Syntax’s experience in deformed grids. To sum up, a complex process seems to occur in a regular grid, a process caused by the interaction of several forces in a constant change, creating therefore a sort of “precarious equilibrium”. Such an equilibrium appears to be constantly changing by new land uses, which utilises the opportunities created by certain niches defined by the absence of competition or
12
precisely for its abundance. A city is, then, a product of such equilibrium, an order made of changes that evolve over time and, at the same time, remains intrinsically the same. Bibliography Christaller, Walter, 1966,”Central places in Germany”, London, Prentice–Hall. Dawson, J.,1980,“Retail geography”, Halsted Press. Fernández-Arnesto, F.,1992, “Barcelona: a thousand years of the city’s past”, Oxford, Oxford University Press. Guy, C.,1994, “The retail development process”, London, Routledge. Hillier, B., Penn A.,1991, “The relation between vehicular and pedestrian movements in the smaller scale urban grid:a pilot study”, SERC GR/G 23609, final report. Hillier, B., 1996,“Space is the machine”, Cambridge, Cambridge University Press. Hillier, B., 1999,“Centrality as a process”, 1999, Urban Design International, 1(3-4). Hillier, B., 2001,“The theory of a city as an object”, 2001, Third Space Syntax Symposium, Atlanta. Rogers, R., 1997, “Cities for a small planet”, London, Faber and Faber. Stonor, T., 1991, “Manhattan: a study of its public spaces and patterns of movement”, MSc Advanced Architectural Studies (thesis). United Nations, 1993, Earth Summit Agenda 21, “The UN programme of action from Rio”, New York. Various authors, 1996, “Cerdá: urbs i territori: planning beyond the urban”, Electra -www.bcn.es (ayuntment de Barcelona)