LAND USE/LAND COVER CLASSIFICATION AND …umpir.ump.edu.my/12142/1/FSKKP - NOR ASHIFAH HAMZAH...
24
i LAND USE/LAND COVER CLASSIFICATION AND CHANGE ANALYSIS BY MULTITEMPORAL REMOTE SENSING DATA NOR ASHIFAH BINTI HAMZAH BACHELOR OF SYSTEM COMPUTER AND SOFTWARE ENGINEERING (GRAPHIC AND MULTMEDIA TECHNOLOGY) UNIVERSITI MALAYSIA PAHANG
Transcript of LAND USE/LAND COVER CLASSIFICATION AND …umpir.ump.edu.my/12142/1/FSKKP - NOR ASHIFAH HAMZAH...

i
LAND USE/LAND COVER
CLASSIFICATION AND CHANGE
ANALYSIS BY MULTITEMPORAL
REMOTE SENSING DATA
NOR ASHIFAH BINTI HAMZAH
BACHELOR OF SYSTEM COMPUTER
AND SOFTWARE ENGINEERING
(GRAPHIC AND MULTMEDIA
TECHNOLOGY)
UNIVERSITI MALAYSIA PAHANG
v
ABSTRACT
Kuantan is a one largest district in Pahang. Kuantan have rapid development in
every aspect. By using Multi-temporal satellite images and application of remote
sensing and GIS for land use and land cover change detection were used. The main
challenge in land use and land cover changes using the remote sensing data which how
to provide the accurate and timely geospatial information. The production of thematic
map from this classification by using an image classification is one of the most common
way application of remote sensing. This research briefly reviews the background,
methods of accuracy assessment that commonly used and recommended in the research
literature.This research also for to access the accuracy of multi-temporal classification
and change detection. Process that involve in this research are selection data satellite,
data correction, classification process, accuracy assessmen

vi
ABSTRAK
Kuantan adalah sebuah daerah yang terbesar di negeri Pahang. Kuantan
mempunyai pembangunan yang pesat dalam setiap aspek. Dengan menggunakan imej
satelit Multi-temporal dan aplikasi penderiaan jauh dan GIS bagi penggunaan tanah dan
perlindungan tanah pengesanan perubahan telah digunakan. Cabaran utama dalam
penggunaan tanah dan perubahan permukaan tanah dengan bagaimana menggunakan
data penderiaan jauh dalam memberikan maklumat geospatial yang betul dan tepat pada
masanya. Pengeluaran peta tematik dari klasifikasi ini dengan menggunakan klasifikasi
imej adalah satu cara aplikasi yang paling biasa untuk penderiaan jauh. Kajian ini
mengkaji secara ringkas latar belakang, kaedah penilaian ketepatan yang biasa
digunakan dan dicadangkan dalam penulisan penyelidikan. Penyelidikan ini juga untuk
mengakses ketepatan multi temporal klasifikasi dan perubahan yang dikesan. Proses
yang terlibat dalam kajian ini adalah pemilihan satelit data, pembetulan data , proses
klasifikasi, dan penilaian ketepatan.

vii
TABLE OF CONTENTS
CHAPTER TITLE PAGE
TITLE PAGE i
STUDENT DECLARATION ii
SUPERVISOR DECLARATION iii
ACKNOWLEDGEMENT iv
ABSTRACT v
ABSTRAK vi
TABLE OF CONTENTS vii
LIST OF FIGURES x
LIST OF FORMULA xi
LIST OF TABLES xii
LIST OF ABBREVIATIONS xiii
1 CHAPTER 1
1.1 Introduction 1
1.2 Problem Statement 2
1.3 Objective 3
1.4 Scope 3
1.5 Thesis Organization 3
2 CHAPTER 2
2.1 Literature review 6
2.2 Role of Remote Sensing in Land Use/ Land Cover
Change Detection
8
2.3 Basic Concept in Image Analysis 9
2.4 Common operations in Digital Image Processing of
Satellite Images
10
2.4.1 Pre-processing 11

viii
2.4.2 Image enhancement 11
2.4.3 Image transformation 11
2.4.4 Image classification 12
2.4.5 Accuracy of image Classification 13
2.4.6 Change detetction approach 14
2.4.6.1 Post classification approach 14
2.4.6.2 Spectral change detection approach 14
3 CHAPTER 3
3.1 Study area 16
3.2 Satellite data 18
3.2.1 Landsat Data 18
3.2.1.1 Standard Parameters 18
3.2.1.2 Levels of Correction 19
3.2.2 Landsat 7 ETM+ 19
3.3 Methodology 23
3.3.1 Reference Data 23
3.3.2 Data Satellite 24
3.3.2.1 Image Classification 24
3.3.2.2 Accuracy Statement 27
3.3.2.3 Change Detection 28
3.3.2.4 Change Detection Accuracy
Assessment
29
4 Chapter 4
4.1 Satellite Data Selection 31
4.1.1 Step in Selecting Data 33
4.2 Data Correction Process 40
4.2.1 Layer Stacking 40
4.3 Classification Process 43
4.3.1 Step in Training Data 45
4.4 Classification Accuracy Assessment 47

ix
4.5 Analysis Classification 48
5 CHAPTER 5
5.1 Land Cover Classification Result 52
5.2 Land Cover Classification Accuracy 54
5.3 Constraints in Classifications 58
6 CHAPTER 6
6.1 Conclusion 59
REFERENCE 61
APPENDIX A 67
APPENDIX B 69
x
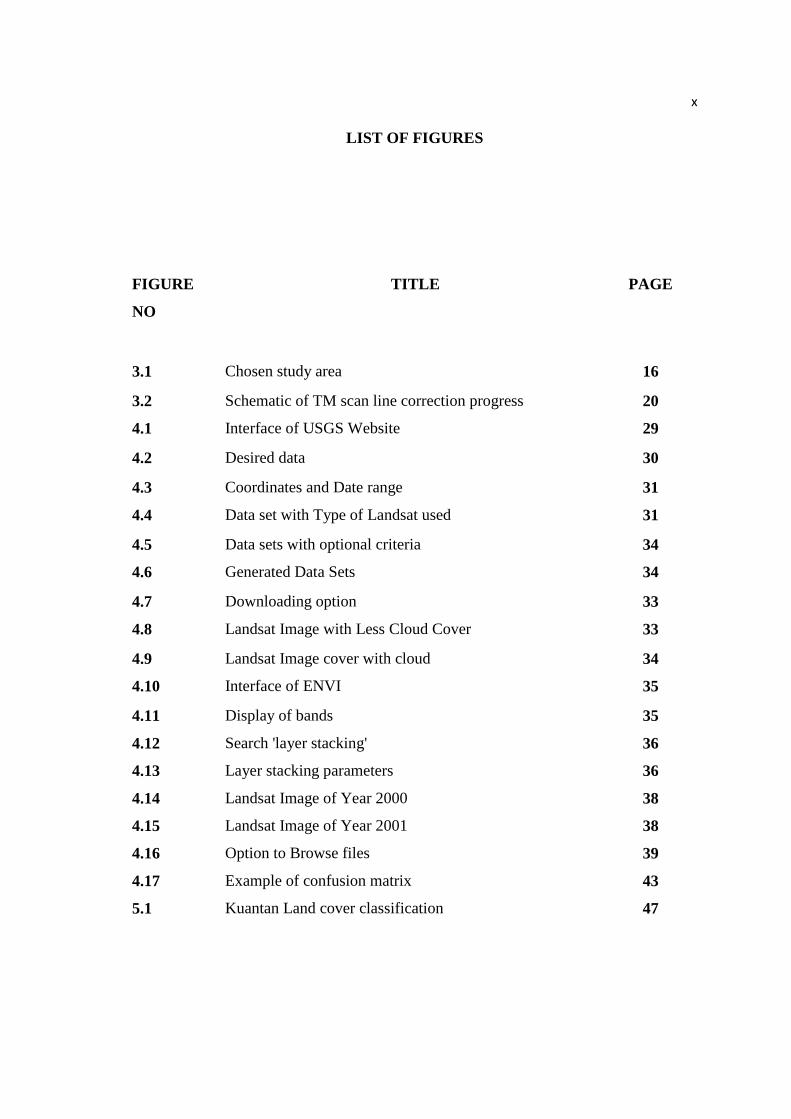
LIST OF FIGURES
FIGURE
NO
TITLE PAGE
3.1 Chosen study area 16
3.2 Schematic of TM scan line correction progress 20
4.1 Interface of USGS Website 29
4.2 Desired data 30
4.3 Coordinates and Date range 31
4.4 Data set with Type of Landsat used 31
4.5 Data sets with optional criteria 34
4.6 Generated Data Sets 34
4.7 Downloading option 33
4.8 Landsat Image with Less Cloud Cover 33
4.9 Landsat Image cover with cloud 34
4.10 Interface of ENVI 35
4.11 Display of bands 35
4.12 Search 'layer stacking' 36
4.13 Layer stacking parameters 36
4.14 Landsat Image of Year 2000 38
4.15 Landsat Image of Year 2001 38
4.16 Option to Browse files 39
4.17 Example of confusion matrix 43
5.1 Kuantan Land cover classification 47
xi
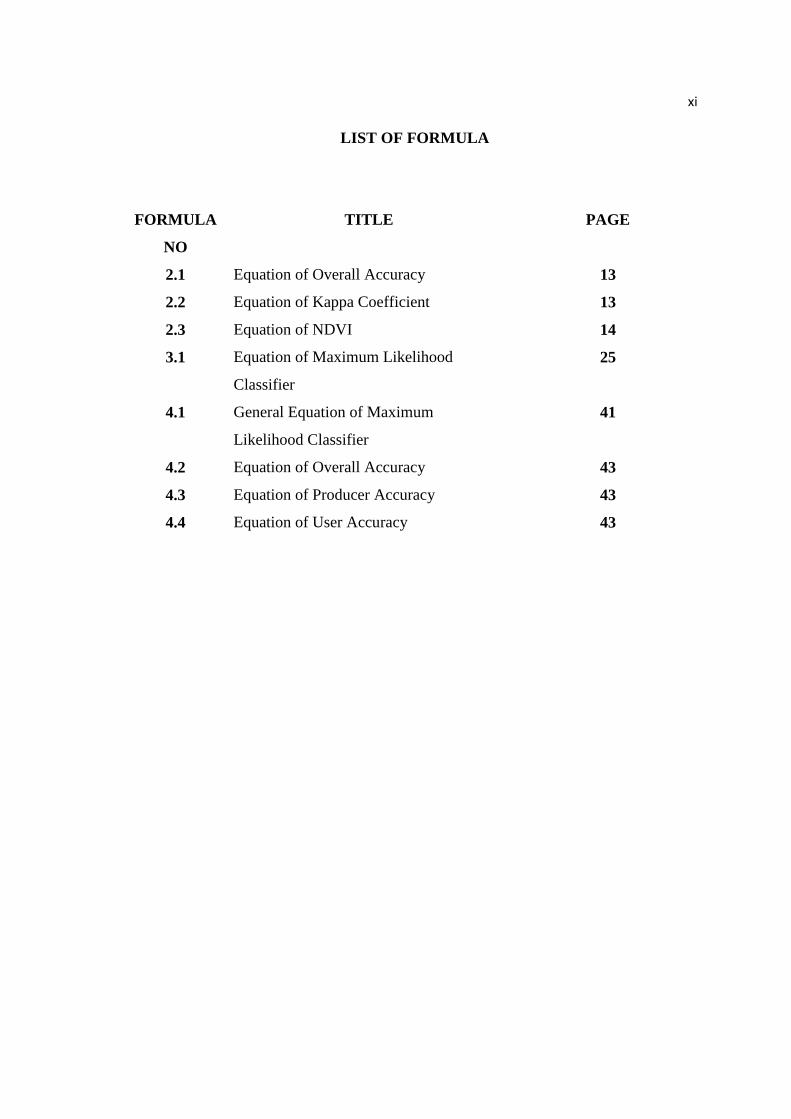
LIST OF FORMULA
FORMULA
NO
TITLE PAGE
2.1 Equation of Overall Accuracy 13
2.2 Equation of Kappa Coefficient 13
2.3 Equation of NDVI 14
3.1 Equation of Maximum Likelihood
Classifier
25
4.1 General Equation of Maximum
Likelihood Classifier
41
4.2 Equation of Overall Accuracy 43
4.3 Equation of Producer Accuracy 43
4.4 Equation of User Accuracy 43
xii
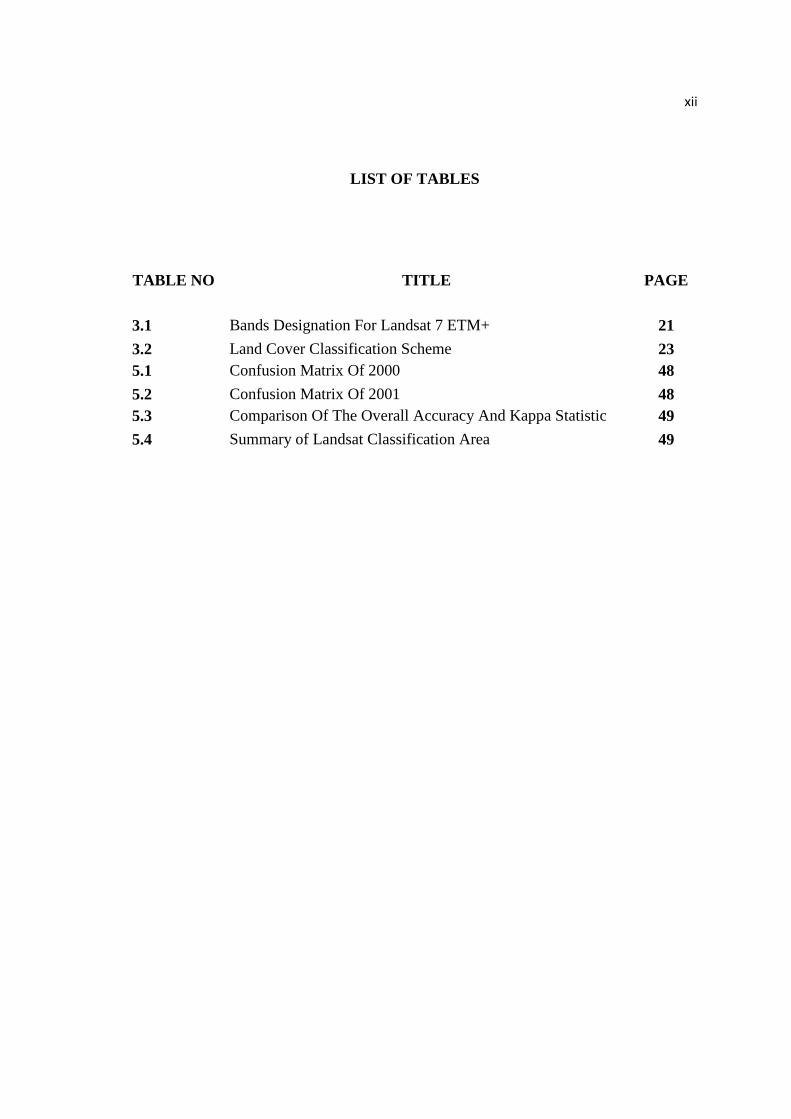
LIST OF TABLES
TABLE NO TITLE PAGE
3.1 Bands Designation For Landsat 7 ETM+ 21
3.2 Land Cover Classification Scheme 23
5.1 Confusion Matrix Of 2000 48
5.2 Confusion Matrix Of 2001 48
5.3 Comparison Of The Overall Accuracy And Kappa Statistic 49
5.4 Summary of Landsat Classification Area 49
xiii
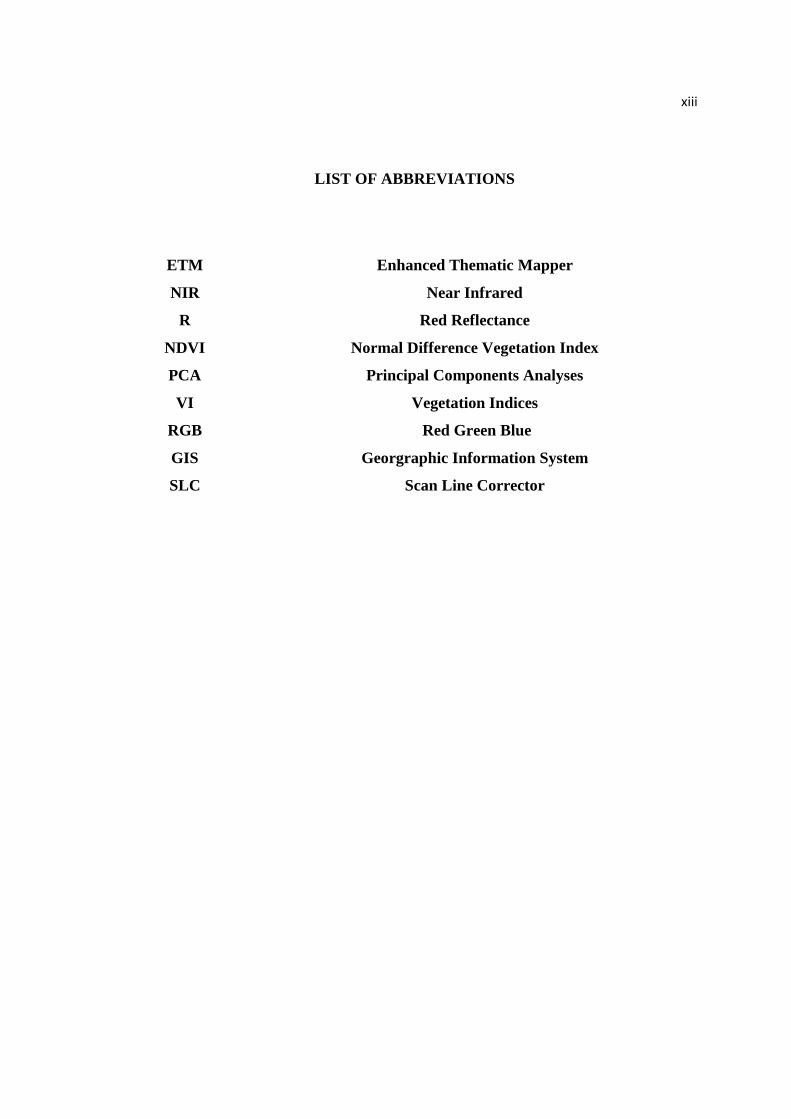
LIST OF ABBREVIATIONS
ETM Enhanced Thematic Mapper
NIR Near Infrared
R Red Reflectance
NDVI Normal Difference Vegetation Index
PCA Principal Components Analyses
VI Vegetation Indices
RGB Red Green Blue
GIS Georgraphic Information System
SLC Scan Line Corrector

1
1
CHAPTER 1
INTRODUCTION
1.1 Introduction
The main challenge in land use and land cover changes using the remote sensing
data which how to provide the accurate and timely geospatial information. Urban
growth has been long considered a sign of regional economic vigor, but its benefit are
increasingly gave negative impacts, to ecosystem, environment, also including about
the road traffic, air quality, loss of farming area, social fragmentation and infrastructure
cost. Natural Resource Management, Planning and Monitoring programs depend on
accurate information about the land cover in a region.
The growing of population and the increasing of socio-economic had create
pressure on land use/land cover which lead to unplanned and uncontrolled changes in
LULC (Seto, K.C ,2002). Its also give a big impact in biodiversity loss, global warming,
and increase the percentage of natural disaster-flooding can be happen. Available data
on LULC changes can provide critical input to decision making of environment
management and planning the future more better (Seto K.C,2002,Prenzel, B, 2004).

2
Methods for monitoring vegetation change range from intensive field sampling
with plot inventories to extensive analysis of remotely sensed data which has proven to
be more cost effective for large regions, small site assessment and analysis. Satellite
remote sensing is an evolving technology with the potential for contributing to studies
for land cover and change detection by making globally comprehensive evaluations of
many environmental and human actions possible.
Satellite image data enable direct observation of the land surface at repetitive
intervals and therefore allow mapping of the extent and monitoring. This problems lead
to using classification detection by using optical remote sensing data, assess the
accuracy of multi temporal classification and change detection and then, analyze urban
growth patterns of the study area. The study area of this research will be Kuantan City,
Pahang Darul Makmur.
1.2 Problem statement
In an urban environment natural and human-induced environmental changes are
of concern today because of deterioration of environment and human health. The study
of land use/land cover (LU/LC) changes is very important to have proper planning and
utilization of natural resources and their management. Remote sensing has become an
important tool applicable to developing and understanding the global, physical
processes affecting the earth. The first challenge in remote sensing on how to derived
land use map by using optical satellite image data. In order to classified the image, it
will using the optical remote sensing data that capture the desired image and easy in
developing to the tools.
A variety studies may have addressed to identified the accuracy of land use map,
but in this study, one of the method been selected for to determine the accuracy. Other
than that, problems that might be faced are on how to calculate the accuracy of derived
land use map. By using remote sensing data, there some of algorithm that can be used to
provide accurate and timely geospatial information of image being captured. By

3
histogram equalization that also can improve the image quality and achieve better
classification accuracy.
Lastly, that might be a issue in this research are how to calculate land use
changing of multi temporal optical satellite image data on Kuantan City. There will
cause some errors in the classification of the land use changing.
1.3 Objective
The aim of the project is about research on land use / land cover classification and
change analysis by multitemporal remote sensing data. The aim will be supported by 3
objectives. the objectives are:
-To derive land use map from optical satellite image using classification method.
-To access the accuracy of derived land use map.
-To calculate land use changing by using multi temporal optical satellite image.
1.4 Scope
In this research, have its own scope that can be the limitation. My research area
are Kuantan city, Pahang Darul Makmur. Classification method that been used only are
optical satellite data. The urban growth analysis are just only between two land use data.
1.5 Thesis Organization
This thesis consists of six (6) chapters. Chapter 1 will discuss on introduction to
system/research.

4
Chapter 1: Introduction
This chapter are consist of introduction, problem statement, objective, scope and also
thesis organization
Chapter 2: Literature review
Purpose of this chapter is to explain about the selected project, which is land use / land
cover classification and change analysis by multi temporal remote sensing data. Review
consist of two parts are divided into two sub research, where the student needs to get
related information with regards to the project.
Chapter 3: Methodology
This chapter will discussing about the overall approach of the research and framework
of this research, land use/land cover classification and change analysis by multi
temporal remote sensing data. It should cover method, technique or approach to be used
in PSMI, and also describing method that will be use in PSM II. Explain on the method
during design and implementation phases then justify their importance. It will also
explaining on the method during design and implementation phases and also will justify
their importance.
This will covered the introduction in describing on how the project was done,
explaining the activities to consider during research development. In methodology, it
will discussing about the selected methodology during development of research,
describe the activities during research process and also explaining
method/techniques/tool/instrument etc. that will be used in the research. Other than that,
it will also tell about hardware and software, describing hardware and software that will
be use in the project, and justify the importance of the chosen hardware and software.
Lastly is the Gantt chart will have to be provided as to show the research phases starting
till the project are complete.
Chapter 4: Design and Implementation
The purpose of this chapter is to develop the framework and model through flow work.
Continuously designing the research which include any planning of data analysis. It will

5
discuss the process and data gathering for research process and sketching the work flow
and model using software that be choosen.it also will explaining how the data/model/
process/ hardware been implemented into selected algorithm.
Chapter 5: Results and Discussion
The purpose of this chapter is to explain about findings or the results from data analysis.
It will covered the result analysis, research constrains
Chapter 6: Conclusion
The purpose of this chapter is to made a conclusion for research that have been done. Its
consist of conclusion of the research, all data that retrieve and observe how far its fit on
the research and objectives, methodology and research implementation conclusion,
future suggestion and enhancement of the research or technique.

6
CHAPTER 2
LITERATURE REVIEW
2.1 Literature Review
Land cover are more refers as the vegetation which is natural and planted, water,
bare rock, sand and similar surface and also man-made construction on earth surface.
Land use are also refers to a series of operation of lands and carried out by humans,
with intention to obtain products and benefits through land resources which including
soil resources and vegetation resources(Debie et al. 1996). Land use are often influences
the land cover. In context, change were defined to alteration of the surface component
of the landscape and only considered to occur if the surface has a different appearance
when viewed on two successive occasions(Lemlem,2007).
Land use/land cover are mostly be pressured on growing population and the
increasing socio-economic necessities. Its result the unplanned and uncontrolled
changes in land use/land change(Seto,2002). It generally caused by mismanagement of
agricultural, urban, range and forest lands. This also can lead to severe environmental
problems such as floods, landslides, earthquake, wild fire and etc.
Earth surface has it‟s own unique which in the cover of it possesses. Land use
and land change are more distinctly linked characteristics. This are the use that can put
7
land could gazing, agriculture, urban development, logging, and mining and any others.
Meanwhile the land covers could be cropland, forest, wetland, pasture, roads, urban
areas among others. According to Meyer (1995), the term land cover originally referred
to the kind and state of vegetation, such as forest or grass cover but it has broadened in
subsequent usage to include other things such as manmade structures like building, soil
type, biodiversity, surface and ground water.
Land cover can also be altered by forces, natural events, such as, wheather,
flooding, fire, climate fluctuations and also ecosystem dynamics that also initiate
modifications on land cover. Land cover mostly use by agriculture and livestock raising,
forest harvesting and management and urban and suburban construction and
development.Some of incidental impacts that can be have on land cover from other
human activities are crops near cities damaged by troposphere ozone which is resulting
from automobile exhaust.
For to use the land optimally, not need to have the information on existing land
use/ land cover but must have the capability to monitor the dynamics of land use
resulting out of both changing demands whether can increase the population anf forces
of nature that acts on shape of the landscape(Meyer,1995). Changes in the area of urban
per se, therefore, do not appear to be central to land-cover change. This claim appears to
support a misconception that urbanization can be ignored in land change studies. In
reality, urbanization affects land change elsewhere throuh the transformation of urban-
rural linkages.
According to Morgan(2005) Ground cover exerts a strong moderating impact on
dissipating the energy supplied by agents of soil erosion especially rain drop. Soil
erosion potential is increased if the soil has no or very little vegetative cover of plants
and/or crop residues. Plant and residue cover protects the soil from raindrop impact and
splash, tends to slow down the movement of surface runoff and allows excess surface
water to infiltrate. The erosion reducing effectiveness of plant and/or residue covers
depends on the type, extent and quantity of cover. Vegetation and residue combinations
that completely cover the soil, and which intercept all falling raindrops at and close to
8
the surface are the most efficient in controlling soil erosion (e.g. forests, shrubs and
permanent grasses).
2.2 Role of Remote Sensing in Land Use/ Land Cover Change Detection
Most of the planners and resource managers are need an reliable mechanism to
access the consequence of changes by the stress imposed on natural resource by
detecting, monitoring and analyzing land use changes quickly and more efficiently.
Remote sensing are more likely refers to the technique in order to obtaining about the
feature or the information through the analysis of data that required by a device that is
have no contact with the object or feature under research (Lillesand and Kiefer, 2000).
Remote sensing technology play a vital role in providing accurate and reliable
information with more cost effective and more lesser time compared to other method
that can be used.
More than that, it also provide a viable source of data which updated land
cover information that can be extracted efficiently and cheaply in order to inventory
and monitor these changes. Its also has become a major application in remote sensed
data because of the repetitive coverage at short intervals and consistent of the image
quality(Mas, 1999).According to Lillesand et.al(2005), remote sensing data has helped
in the development of various environmental management methodologies. Some of
advantages that are synoptic view that facilitate the remote sensing to study the various
between type of features of earth‟s surface and the relation of the spatial. The
accessibility of remote sensing data makes its possible to gather the information about
areas that impossible to be accessible for ground surveys such as mountains or foreign
lands. Since the information can be gathered quickly by using this method, these
techniques are more save the time and the effort.
Satelite imaginery has been used for measuring qualitative and quantitative
terrestial land cover changes(Cambell, 2002). Qualitative changes in landscape occur
either as natural phenomena or can be human induced. Quantitative land cover change
are the wholesale categorical transformation of the land and can occur as natural
phenomenon that be caused by fires and storms, another that usually induced by human

9
activity are the forest clearing, agricultural expansion and urban growth. Both of
qualitative and quantitative changes in land cover successfully monitored by remote
sensing, which dominated by efforts at monitoring change at vegetation and forest
canopies(Cambell, 2002). Urban areas refer a both a type of land utilization and a
particular land cover. These are two concept that essentially identical.
2.3 Basic Concept in Image Analysis
Remote sensing change detection techniques can be classified as pre-
classification or post-classification change methods.A pre-classification process are
more refers to operations that carried out to bring satellite images to the desirable
geometric and spectral standard by correcting the errors, and performed prior to image
classification.Pre-classification methods can be characterized as being spectral or
phenology based. While for post-classification methods are more refers to activities that
done after classification of images like computation of class statistics, accuracy
assessment, and map preparation.
Post -classification approach was considered to be the most reliable approach
and was used to evaluate emerging methods. Factors that can limit the application of
post-classification change detection techniques include cost, consistency, and error
propagation.Numerous pre-classification change detection approaches have been
developed and refined to provide optimal performance over the greatest possible range
of ecosystem conditions.
Remotely sensed data provides an operational GIS with timely and synoptic
data. Image analysis techniques are commonly utilized to perform regional vegetation
mapping and to update existing vegetation maps. The utility of a sensor system for the
detection of surface must be assessed in four dimensions that is spatial resolutions
which area or size of features that can be identified, spectral resolution which number
and width of electromagnetic bands for which data are collected, radiometric resolution
which is the detector sensitivity to various level of incoming energy and the lastly are
temporal resolution which is the frequency of satelite overlaps.

10
Satelite digital sensor collect and store data values for discrete units of the
surface of the earth, they are composed of large matrix of cell which referred to a
picture element or pixel that may correspond to a square meter, hectare or square
kilometer, and depend on the sensor. The spatial resolution are usually expressed as the
length of one side of the cell.
A major attribute to landscape is the spatial pattern and structure. It is shown
that the detection of land-cover change processes by remote sensing is improved when
both spectral and spatial indicators of surface condition like slope and topography are
used. Temporal aspects of natural phenomena are important for image interpretation
because of the factors as vegetation growth and soil moisture that may vary during
every year. The changes in landscape spatial pattern are more likely to reveal long term
and long lasting land cover changes.
2.4 Common operations in Digital Image Processing of Satellite Images
Digital image processing are commonly refers to the interpretation and analysis
by a computer system where to prepare for display aand ectracr useful information from
the choosen image. Its are largely concerned with four basic operations which is, image
retification, image transformation, image enhancement, and image
classification(Lillesand et al 1998).
2.4.1 Pre-Processing
Raw satelite image are full of errors and cannot directly utilized for features
indentification or used for any applications.Pre-processing are done before the main
data analysis and extraction of information. This process involves of two major
processes: geometric correction and radiometric correction or haze correction. Remote
sensing imageries the subjected to the geometric distortions. This may be due to the
perspective of the sensor optics, the motion of scanning system,the terrain relief, and the
motion of the platform which is the platform of altitude, attitude and velocity.

11
This process are aim to correct the distorted data in order to create more clear
representation of the original scene, this more involves the initial of raw image data to
be correct for geometric distortions, to calibrate the data radiometrically and eliminate
noise present in the data.
2.4.2 Image Enhancement
This process are used to increase the detailness of image by assigning the image
maximum and minimum to display the values and done in pixel values. This visual
interpretation easier by increasing visual discrimination between features in scene and
assist human analyst.
Image enhancement techniques can be divided into two broad categories:
1. Spatial domain methods, which operate directly on pixels
2. Frequency domain methods, which operate on the Fourier transform of an image.
2.4.3 Image transformation
According to Richards(1999) transformation are involves processes that are
similar in concept to the processes of image enhancement, but unlike image
enhancement these process are normally applied on multi channel (band) images.
Principal Components Analyses (PCA) and Vegetation Indices (VIs) are among image
transformation processes. The multispectral or multidimensional nature of remote
sensing image data can be replaced by constructing a vector space with as many axes or
dimensions as there are spectral components that associated with each pixel(Richards,
1999).
2.4.4 Image classification
Based on Bakker et al (2000),Image classification is the thematic characteristics
of an area. Example of Thematic characteristic such as land cover, land use, soil type
and etc that can be used for further analysis and input to models. In addition, image

12
classification can also be considered as data reduction that is a number of multispectral
bands resulted in a single value raster file.
This classification are the operation to replace the visual analysis of the image
data with quantitative techniques for automating the identificatin of features.Image
classification is the process of creating thematic maps from satellite imagery. A
thematic map is an informational representation of an image that shows the spatial
distribution for a particular theme.
Based on to Diday(1994),Unsupervised classification is computer-automated
and it enables user to specify some parameters that the computer uses to uncover
statistical patterns that are inherent in the data meanwhile, supervised classification the
image analyst supervises the pixel categorization processes by specifying, to the
computer algorithm, numerical descriptors of the various land cover types present in a
scene.
For Land use/land cover data needed for planning and management purposes,
the accuracy of interpretation at the generalized first and second levels is satisfactory
when the interpreter makes the correct interpretation 85 to 90 percent of the time.
According to Jensen (1996) and Landgrebe (2003), each pixel in the data set is then
compared numerically to each category in the interpretation key and labeled with the
name of the category. There are different algorithms under this classification type,
which minimum distance, variance and covariance of the classes are considered during
classification.
2.4.5 Accuracy of image Classification
The accuracy are measurement of how many ground truth pixels that were
classified correctly.Its important to remember that no map that perfect representation of
reality . There always have error in maps and need to keep in mind how to accurate the
errors and know wheteher the level of accuracy are sufficient for the ways that want to
use the map information(Awotwi, 2009).

13
The result of an accuracy assessment provides with an overall accuracy of the
map based on average of the accuracies for each class in the map.
Overall accuracy=
Kappa is used to measure the agreement or accuracy between the remote sensing
derived classification map and the reference data as indicated by the major diagonals
and the chance agreement, which is indicated by the row and column totals (Jensen
2003). Producer‟s accuracy is the total number of correct pixels in category that divided
by the total number of pixels of that category as derived from the referece data.
The Kappa factor is given by the formula(Jensen 2003):
Kappa(K)=
Where:
Po = is the proportion of correctly classified cases
Pe = is the proportion of correctly classified cases expected by chance.
The user‟s accuracy or reliability is the probability that a pixel classified on the
map actually represent that category on the ground (Jensen 2003). User‟s accuracy is
when the total number of correct pixels in a category divided by the total number of
pixels that were actually classified in that category (row total), the result is a measure of
commission error.
2.4.6 Change detection approach
Change detection is the process of identifying differences in the state of an
object or phenomenon by observing it at different times. It involves the ability to
quantify temporal effects using multi temporal data sets(Singh, 1989). This detection
[2.2]
[2.1]

14
can be broadly divided into post-classification, and spectral change detection
approaches (Chen, 2000).
Post classification approach
This techniques are most widely being used for change detection purpose. Its
approach two images from different dates that be classified and labeled. The are of
changes are the extracted through the direct comparison of the classification results.
Main advantages are its more detailed information. The main disadvantage of the post
classification approach is the dependency of the land cover change results on the
individual classification accuracies. This approach can produce a large number of
erroneous change indications since an error on either data gives a false indication of
change (Singh, 1989).
Spectral change detection approach
According to Chen (2000), a large number of techniques are in the spectral
change identification category. This technique are more rely on the principle that land
cover changes the result in persistent changes in spectral signature of the affected land
surface. These also involves the transformation of two original image into a new single
band or multiband image which area of spectral change are highlighted. Its mostly
based on some type of image diffrencing.According to Singh, 1989, identified image
differencing as the most accurate change detection technique. This technique is
performed by subtracting images from two dates pixel by pixel. Then threshold
boundaries between .change. and .no-change. pixels are determined for the different
image to produce the change map.
Among spectral change detection methods, Normalized Difference Vegetation
Index (NDVI) image differencing emerges as one of the most widely used. NDVI is a
measure derived by dividing the difference between near infrared (NIR) and red
reflectance (R) measurements by their sum (Singh, 1989):
NDVI=
[2.3]