Land Use Committee - Illinois · Based on Land Value Ratio analysis to identify ... Priority...
51
“Knowing there is a world that will outlive you, there are people whose well-being depends on how you live your life, affects the way you live your life, whether or not you directly experience those effects. You want to be the kind of person who has the larger view, who takes other people’s interests into account, who’s dedicated to the principles that you can justify, like justice, knowledge, truth, beauty and morality.” – Steven Pinker, cognitive scientist
Transcript of Land Use Committee - Illinois · Based on Land Value Ratio analysis to identify ... Priority...

“Knowing there is a world that will outlive you, there are people whose well-being depends on how you live your life, affects the way you live your life, whether or not you directly experience those effects. You want to be the kind of person who has the larger view, who takes other people’s interests into account, who’s dedicated to the principles that you can justify, like justice, knowledge, truth, beauty and morality.”
– Steven Pinker, cognitive scientist

Land Use CommitteeMEETING THREE
JULY 21, 2014

3LAND USE COMMITTEEJULY 21, 2014
Welcome

LAND USE COMMITTEEJULY 21, 2014 4
◦Meeting Minutes◦Existing Conditions Assessment –
Preliminary Key Findings◦Cool Spots – Discussion◦Hot Spots – Discussion◦Next Steps◦Questions/Public Comment
Agenda

5LAND USE COMMITTEEJULY 21, 2014
ECAPreliminary Key Findings

LAND USE COMMITTEEJULY 21, 2014 6
Corridor Perspective

LAND USE COMMITTEEJULY 21, 2014 7
Livability

8LAND USE COMMITTEEJULY 21, 2014
Mobility

LAND USE COMMITTEEJULY 21, 2014 9
• Increased road congestion over the last 10-15 years has impacted the area’s quality of life and economy.
• This increased road congestion is due to the growth in population and longer commuting distances.
• Transit ridership has also grown at this time, but not at the rate to relieve the roadway network due to infrastructure, services, and land use characteristics.
• The 53/120 project will help reduce existing congestion.• However, without proper land use and transportation
planning decisions and investments, it is likely that the County will face the same transportation problems in the future.
Mobility


LAND USE COMMITTEEJULY 21, 2014 14
MobilityNo one can simply build their way out of congestion.
It must be addressed from all aspects, including improved transit, smarter land use patterns, transportation demand management strategies, in addition to increased roadway capacity.

15LAND USE COMMITTEEJULY 21, 2014
Market

LAND USE COMMITTEEJULY 21, 2014 16
• Lake County is expected to grow but at a slower pace than historical trends
• Historical development patterns show the Corridor is already capturing a significant share of new County Development
• Communities will not achieve the full build-out depicted in their municipal Future Land Use Plans within the next 30 Years
• Future development patterns are likely to differ from the past
Market

17LAND USE COMMITTEEJULY 21, 2014
Lake County is expected to grow but at a slower pace than historical trends
Notes: CMAP projections were based on estimated 2010employment, in addition to the actual 2013 employment figure.CMAP 2010 population estimate used here is based on actualApril 1 census figures, 2013 is based on ACS estimates. Moody’semployment figures have been adjusted to remove military jobs.
July 21, 2014
Compound Annual Growth Rate
1980-2010 2010-2040
Population 1.6% 1.08 - 1.15%
Employment 2.0% 1.0 - 1.3%
Source: US Census Bureau, Moody’s, Woods and Poole, CMAP, SB Friedman
Moody’s Employment Estimates
CMAP Employment Estimates
Woods and Poole Population Estimates
CMAP Population Estimates

18LAND USE COMMITTEEJULY 21, 2014
Historical development patterns show the Corridor is already capturing a significant share of new County development
July 21, 2014
Source: CoStar, US Census Bureau, SB Friedman
Share of New County Development Captured in Corridor
Non-ResidentialPast 15 Years
ResidentialPast 10 Years

19
Communities will not achieve the full build-out depicted in their municipal Future Land Use Plans within the next 30 Years
Planned Development Estimate
Land UseFuture Added Acres by Land
Use
Planned Development
Estimate
Residential 7,278 12,000 Units [1]
Retail/ Commercial 3,296 35 M SF [1]
Industrial 2,679 48 M SF
Office 1,064 18 M SF [1]
Government & Institutional 224 3 M SF
Open Space 1,387 1,400 Acres
[1] Includes mixed use planned development

20
12,000
34,000
0
10,000
20,000
30,000
40,000
Planned Development Estimate Potential Development Based on PastTrends
Resi
dent
ial U
nits
Residential
Communities will not achieve the full build-out depicted in their municipal Future Land Use Plans within the next 30 Years
0
20
40
60
80
100
120
Planned Development Estimate Potential Development Based onPast Trends
Squa
re F
eet (
mill
ions
)
Office Industrial Retail
Planned Corridor development estimates
MOREthan historical trends
5 M
13 M
35 M
48 M
18 M4 M
Planned Corridor development estimates
LESSthan historical trends

21LAND USE COMMITTEEJULY 21, 2014
Land Use

LAND USE COMMITTEEJULY 21, 2014 22
• Municipal Future Land Use Plans target “greenfield” sites that would cause a significant loss of natural areas and agricultural land
• Additionally, these plans do not identify underutilized or infill sites that could accommodate part of the development demand
• Current zoning in the Corridor does not permit population or employment density necessary to support transit
• The Corridor’s livability goals are not supported by existing plans and policies
Land Use


LAND USE COMMITTEEJULY 21, 2014 25
Future Land Use ChangeFuture Land Use Plans show an increase in developed land and a loss of open space and agricultural land
2 2
22
14
34
31 0
3 2
10
52
6
1
35
5
22
3 3 2
6
2
11
4
00
5
10
15
20
25
30
35
40
Percentage of Corridor per Land Use – 2005 to Future
2005 Land Use Future Land Use

26LAND USE COMMITTEEJULY 21, 2014
Agricultural & Open SpaceLand
If the Corridor is developed based on Municipal Plans, almost 7,000 acres of agricultural land and over 9,000 acres of open space would be lost
14
34
5
22
0
5
10
15
20
25
30
35
40
Agricultural Open Space
6,868 acres
9,160 acres

27LAND USE COMMITTEEJULY 21, 2014
PotentialInfillSites
Based on Land Value Ratio analysis to identify “underutilized” sites

28
Infill has the potential to meet a portion of market demand and reduce the demand for development on agricultural and open space land
892 103 605 2278
0 500 1000 1500 2000 2500 3000 3500 4000 4500
Potential Acres of Infill Development within the Corridor
Industrial
0 500 1000 1500 2000 2500 3000 3500 4000 4500
3,878 Acres of Agricultural & Open Space Land
Retail/ Commercial ResidentialOffice

LAND USE COMMITTEEJULY 21, 2014 29
Transit Supportive Zoning

30LAND USE COMMITTEEJULY 21, 2014
Environmental

LAND USE COMMITTEEJULY 21, 2014 31
Environmental
• Natural Resources cover 53% of land area in the corridor
• Almost 50% of those Natural Resources are outside protected boundaries
• Natural resources in the Corridor are already impaired
• There are significant future threats to the natural resources in the Corridor
• Current zoning ordinances have minimal requirements to balance development and environmental protection

32LAND USE COMMITTEEJULY 21, 2014
The Natural Resources in the corridor cover 53% of land area, which include:
• Parks/Forest Preserves
• Woodlands
• Prairies
• Wetlands
• Rivers/Streams/Ponds
• Agricultural Lands
• Hydric Soils
• Floodplains
• T+E Locations

33LAND USE COMMITTEEJULY 21, 2014
Almost 50% of those resources are NOT in protected areas and thus are susceptible to direct development impacts.
All of the resources are susceptible to indirect impacts and adjacent land use changes.

34LAND USE COMMITTEEJULY 21, 2014
Natural resources within the Corridor are already impaired
There are NO Biologically Significant streams or water bodies in the corridor.

35LAND USE COMMITTEEJULY 21, 2014
There are significant future threats to natural resources in the Corridor:
• Impacts of land development
• Fragmentation/ degradation of natural resources
• Impermeable surfaces and impacts of run-off

36LAND USE COMMITTEEJULY 21, 2014
Current Zoning Ordinances do not address many of the impacts future development will bring to the corridor.
37LAND USE COMMITTEEJULY 21, 2014
Conclusions

LAND USE COMMITTEEJULY 21, 2014 38
Conclusion• The 53/120 parkway will ease congestion and bring
economic development to the Corridor• For those benefits to last, and for the people of Lake County
to retain the quality of life they value, a new mindset must be adopted.
• Policies and plans that guided the area through the decades of explosive growth must be re-imagined.
• With thoughtful planning, a willingness to carefully balance mobility, market, land use and environmental issues, and courage to acknowledge and embrace changing realities, the residents of Lake County can confidently look forward to a bright future.

39LAND USE COMMITTEEJULY 21, 2014
Cool & Hot Spots

LAND USE COMMITTEEJULY 21, 2014 40
Objectives• Hot & Cool Spot analyses is just one tool to help focus attention on
important areas.
• Cool Spots• Identify important or valuable natural resource areas that will be given special
consideration as plans and policy recommendations are developed.
• Hot Spots• Identify areas likely to undergo significant land use change as a result of the
new facility, which will receive additional, detailed planning attention.

LAND USE COMMITTEEJULY 21, 2014 41
Role of LUC• LUC Meeting Three (July)
• Review methodology and provide input• Review draft maps identify areas problem areas
• LUC Meeting Four (September / October)• Review refined scoring and maps• Approve final cool and hot spots to be used in future
phases of the project

LAND USE COMMITTEEJULY 21, 2014 42
Priority Sensitive Lands identified by BRAC 5
ADID wetlands 3-5 Threatened & Endangered Species Locations 5 Illinois Natural Area Inventory Sites 5 Illinois Nature Preserves 5 Corps Wetland Mitigation Sites 5 Biologically Significant Streams 5 Sites with wetland bank potential 5Lake County Forest Preserves 5Dedicated/Protected Open Space 4
◦ Includes the following lands: The Conservation Fund, Conserve Lake County, Deed Restricted Land, Illinois Department of Natural Resources, Libertyville Township Open Space, Prairie Crossing HOA, The Nature Conservancy, Openlands, Natural Resources Conservation Service, Local Parks
Lake County Wetland Inventory 4 (20 acres and larger)
Floodway (FEMA and SMC) 3 SMC Floodplain Buyout Properties 3 Streams 3 303-D Streams 3 Lake County Wetland Inventory (5-20 acres) 3Lake County Wetland Inventory (0-5 acres) 2USGS Flood of Record 2 SMC Flood Hazard Inventory 2 Green Infrastructure Vision - Connectivity Areas 2Forest/Woodland 2Prairie/Savanna 2Lake County Farm Land 2Hydric Soils 1 Erodible Soils 1WDO Buffer Areas 1 Very Highly Permeable Soils 1
Cool Spots Methodology

43LAND USE COMMITTEEJULY 21, 2014
Draft Cool Spots Map

LAND USE COMMITTEEJULY 21, 2014 44
Objective/Market FactorsAreas within 1/4 mile of proposed interchange 4 Areas that front roadway with ADT >30,000 3Areas within 1/2 mile of proposed interchange 3Areas within 1/4 mile of arterial intersections 3Vacant parcels greater than 20 acres in size 3Parcels under common ownership 2Areas within 1/4 mile of arterial intersections 2Areas within 1/2 mile of I-94 interchange 2Areas that front roadway with ADT 2 between 20,000 and 30,000
Municipal Plans/Entitled Sites Areas of Overlapping Planning Jurisdictions 5Entitled/Permitted Projects 3Priority Projects Identified by Municipalities 3
Hot Spots Methodology
Policy FactorsUnderutilized sites from Infill analysis 4Areas within a 1/8 mile of Metra Station 4Areas within a 1/4 mile of Metra Station 3Sites identified as Mixed-Use 2 in the Future Land UseAreas within 200’ of high volume bus stop 1Parcels immediately adjacent to trails 1
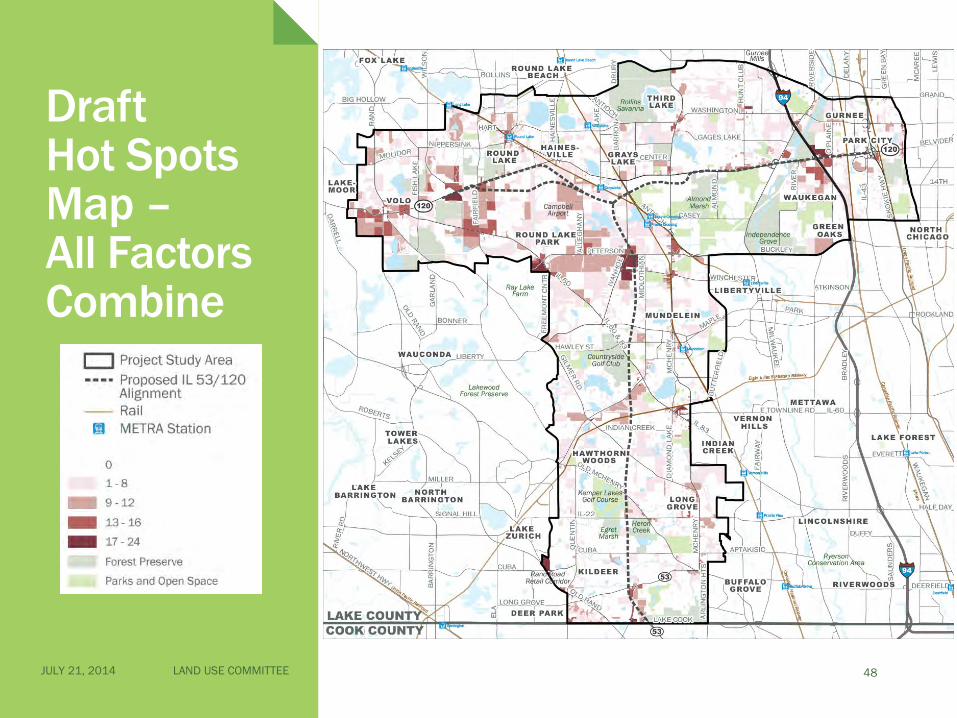
Three sets of factors used/mapped

45LAND USE COMMITTEEJULY 21, 2014
Draft Hot Spots Map –Market Factors

46LAND USE COMMITTEEJULY 21, 2014
Draft Hot Spots Map –Municipal Factors

47LAND USE COMMITTEEJULY 21, 2014
Draft Hot Spots Map –Policy Factors
48LAND USE COMMITTEEJULY 21, 2014
Draft Hot Spots Map –All Factors Combine

LAND USE COMMITTEEJULY 21, 2014 49
Cool/Hot Spots• Next Steps
• Use today’s input to refine methodology and maps• Identify high ranking sites• Bring to LUC in September / October for approval

50LAND USE COMMITTEEJULY 21, 2014
Questions?

51LAND USE COMMITTEEJULY 21, 2014
Thank You