Land Use and Food Security in 2050: A Narrow Road
403
Chantal Le Mouël, Marie de Lattre-Gasquet, Olivier Mora, eds Agrimonde-Terra Land Use and Food Security in 2050: a Narrow Road
Transcript of Land Use and Food Security in 2050: A Narrow Road
Chantal Le Mouël, Marie de Lattre-Gasquet, Olivier Mora, eds
Agrimonde-Terra
Land Use and Food Security in 2050: a Narrow Road


Éditions Quæ
Land Use and Food Security in 2050: A Narrow Road
Agrimonde-Terra
Chantal le Mouël, Marie de Lattre-Gasquet, Olivier Mora, eds
Éditions QuæRD 10
78026 Versailles Cedex, Francehttp://www.quae.com
© Éditions Quæ, 2018 ISBN : 978-2-7592-2879-9 ISSN : 2115-1229ISBN (NUM): 978-2-7592-2880-5ISBN (ePub): 978-2-7592-2881-2
This book is licensed under the Creative Commons Attribution-NonCommercial-NoDerivs 2.0 Generic (CC BY-NC-ND 2.0).https://creativecommons.org/licenses/by-nc-nd/2.0/
3
Contents
Preface
Michel Eddi, Philippe Mauguin 5
Acknowledgements 7
Introduction 9
1. The ’Land Use and Food Security’ SystemMarie de Lattre-Gasquet, Chantal Le Mouël and Olivier Mora 11
2. Agrimonde-Terra’s Foresight Approach to Scenario Construction Olivier Mora and Marie de Lattre-Gasquet 20
3. The GlobAgri-Agrimonde-Terra Database and ModelChantal Le Mouël, Patrice Dumas, Stéphane Manceron, Agneta Forslund and Elodie Marajo-Petitzon 28
4. Land-use Change Trajectories in Existing Scenario StudiesChantal Le Mouël and Agneta Forslund 37
5. Retrospective Overview of Land Uses at Global Level and by World RegionsMarie de Lattre-Gasquet, Marco Barzman, Pauline Marty and Clémence Moreau 55
6. The Global ContextMarie de Lattre-Gasquet and Clémence Moreau 79
7. Climate Change: Impacts and MitigationThierry Brunelle, Patrice Dumas, Christophe Cassen, Stéphane Manceron, Elodie Marajo-Petitzon and Véronique Lamblin 101
8. Dietary Changes, Nutrition Transition and the Future of Global DietsOlivier Mora 113
4
LAND USE AND FOOD SECURITY IN 2050
9. Urbanization, Rural Transformation and Future Urban-Rural LinkagesOlivier Mora, Frédéric Lançon and Francis Aubert 138
10. Farm Structures: Current Shaping Forces and Future FarmsCatherine Donnars, Marie de Lattre-Gasquet, Jacques Marzin and Laurent Piet 155
11. Cropping SystemsOlivier Réchauchère, David Makowski, Eric Malézieux and Florent Maraux 179
12. Livestock SystemsStéphane Manceron, Patrice Dumas, Clémence Moreau, Alexandre Ickowicz, Philippe Lecomte and Philippe Lescoat 194
13. Scenarios of Land Use and Food Security in 2050Olivier Mora 206
14. Land-use Change Impacts of the Agrimonde-Terra Scenarios: An Assessment with the GlobAgri-AgT ModelChantal Le Mouël and Elodie Marajo-Petitzon 247
15. Regional Dimension of the Agrimonde-Terra Scenarios: The Example of sub-Saharan AfricaMarie de Lattre-Gasquet, Clémence Moreau and John Okul 286
16. Lessons on Land Use and Food Security from the ScenariosChantal Le Mouël, Olivier Mora and Marie de Lattre-Gasquet 315
17. Options for Public PoliciesMarie de Lattre-Gasquet 329
Conclusion 342
References 345
Appendix 1 381
Appendix 2 384
Authors 397

5
Preface
In 2006, CIRAD and INRA launched the Agrimonde foresight project, which aimed to explore pathways to feeding nine billion people in 2050 in a sustainable way. This initial phase of the ’Agrimonde adventure’ proposed two sharply contrasted scenarios of food and agricultural systems in 2050, one based on current trends and one involving a transition towards agroecology and a major shift in food diets, including decreased animal food consumption, in a context of environmental protection (Paillard et al., 2010).
Six years later, CIRAD and INRA decided to pursue the adventure by launching a new foresight process on ’land use and food security in 2050’, named Agrimonde-Terra. The Agrimonde-Terra foresight explores the complex array of interactions between land use and food and nutrition security.
According to FAO, over the past 50 years, the world’s arable and permanent crop land area has grown by 12% while the area dedicated to permanent meadows and pastures has grown by 9%, mostly reclaimed on natural areas. In 2015, there were about 570 million farms (35% of these farms in China and 24% in India) contributing to the production of food, feed and energy for 7.3 billion people, and there were about 795 million people undernourished, 600 million obese and 1.9 billion overweight adults across the planet. Concerning current land use and the potential for expanding the agricultural land area in the various world regions, this differs widely according to their land endowment. In North Africa, the Near and Middle East and China, the currently observed cultivated area already exceeds the land area which is supposed to be cultivable in each of these regions. India and the European Union are reaching the limit of their cultivable area. In larger regions such as North America, Latin America, the Former Soviet Union and sub-Saharan Africa, the currently observed cultivated area remains far below the potentially cultivable area, part of which being natural land. The expected growth in the world population, which is set to reach 9.7 billion in 2050, and the availability of cultivable land clearly raise questions about the future of land-use patterns and of their interactions with food security.
This was the aim of Agrimonde-Terra to build scenarios allowing the relationships between land use and food security to be explored. In doing so, we expected to facilitate informed decision making and multi-stakeholder approaches to the future of land use and food security, to contribute to the ongoing debates on land use trajectories and finally to identify new research questions.
Agrimonde-Terra proposes five exploratory scenarios of land use and food security in 2050. The first three scenarios are based on current competing trends identified in most world regions. ’Metropolization’ links the development of megacities with a nutrition transition led by global agri-food companies selling ultra-processed foods or an increase in consumption of animal products, in a global context of development through market forces and rapid climate change. ’Regionalization’ relates the increase of medium-size

6
LAND USE AND FOOD SECURITY IN 2050
cities and their networking with rural areas to the emergence of regional food systems based on family farming and traditional food diets, and a set of regional agreements, notably trade agreements. ’Households’ links strong individual mobility between rural and urban areas and the development of non-farm employment to the emergence of hybrid diets based on both traditional and modern value chains, in a globalized world where family farms and cooperatives are major actors in land use.
The last two scenarios involve potential breaks that could change the entire land use and food security system. ’Healthy’ assumes that due to the increasing cost of malnutrition, a radical move towards healthy diets occurs, driven by global cooperation and public policies in a context of climate change stabilization, involving a re-configuration of agricultural systems backed by new alliances between stakeholders. ’Communities’ assumes that in a context of recurrent crises, development based on small towns and rural communities occurs, focusing on managing common property in agriculture in order to ensure food security.
This book describes the construction, the quantitative and qualitative analysis process, and the outcomes of these five scenarios, along with their main insights. In particular, the overall results suggest that only the ’Healthy’ scenario is likely to be able to ensure sustainably world food security in 2050. ’Metropolization’ and ’Communities’ are not able to achieve this objective, inducing both increased malnutrition and a significant expansion of the agricultural land area with possible loss of natural areas at the global scale. The two other scenarios, ’Regionalization’ and ’Households’, lead to ambiguous results in terms of both food security and land-use patterns.
Among the achievements of Agrimonde-Terra is the coupling of a qualitative and a quantitative analysis of scenarios, which is not common in foresight exercises and deserves to be emphasized. In this regard, the GlobAgri platform, which has been developed as part of the Agrimonde-Terra project and was used to design the specific GlobAgri-AgT database and model for the Agrimonde-Terra foresight, calls for follow-up action. CIRAD and INRA wish that the GlobAgri tool be widely used by the research community.
Finally, Agrimonde-Terra constitutes valuable input for the CIRAD and INRA ’GloFoodS metaprogramme’, a cross-disciplinary research programme focusing on global food security. Furthermore, let’s hope that the Agrimonde-Terra’s results and achievements continue to feed the fruitful debates that we had during the foresight process with diverse research communities and various stakeholders, thus contributing to local and global understanding and improvement of land use and food security in accordance to the mandates of our institutions.
Before inviting you to enjoy this book, we wish to thank everyone who contributed to the Agrimonde-Terra project: the scientists from CIRAD and INRA and the scientists and experts from all over the world who offered us their support and advice, occasionally in workshops or throughout the process as members of the Scenario Advisory Committee.
Michel Eddi, President of CIRAD Philippe Mauguin, President of INRA

7
Acknowledgements
Agrimonde-Terra has benefitted from the knowledge, experience and support of the members of the Scenario Advisory Committee who followed the work throughout the foresight process. We warmly thank them for the time they devoted to Agrimonde-Terra and for their valuable advices:
Agnes Andersson Djurfeldt (Lund University, Sweden) Leïth Ben Becher (Synagri, Tunisia) Mohamed Elloumi (INRAT, Tunisia) Adama Faye (IPAR, Senegal) Richard Guissou/Yves-Gérard Bazie (Ministry of Agriculture and Food Security, Burkina Faso) Holger Kray (World Bank, USA) John Lewis (Terra Global Capital, USA) Patrick Meyfroidt (University of Louvain, Belgium) Marc Mueller (FAO, Italy) Siwa Msangui (IFPRI, USA) Antonio Onorati (International Planning Committee for Food Sovereignty, Italy) Stéphane Parmentier (Oxfam, Belgium) Alain Retière (Cap 2100, France) Roberta Sonnino (Cardiff University, UK) Sébastien Treyer (IDDRI, France) Dominique van der Mensbrugghe (AgMIP, Purdue University, USA) Joost Vervoort (CCAFS and Oxford University, UK) Hisham Zehni (IFAD, Italy).
We also want to thank all the experts who contributed to the thematic workshops held at the beginning of the foresight process:
Agnes Andersson Djurfeldt (Lund University, Sweden); Francis Aubert (AgroSup Dijon, France); Christine Aubry (INRA, France); Philippe Baret (Université catholique de Louvain, Belgium); Lubica Bartova (Slovak University of Agriculture, Slovakia); Denis Bastianelli (CIRAD, France); Didier Bazile (CIRAD, France); Nienke Beitema (CGIAR/IFPRI, USA); Tamara Ben-Ari (INRA, France); Elena Benett (McGill University, Canada); Patrick Bertuzzi (INRA, France); Pascal Bonnet (CIRAD, France); Maryline Boval (INRA, France); Philippe Brabant (AgroParisTech, France); Kate Brauman (University of Minnesota, USA); Perrine Burnod (CIRAD, Madagascar); Nicolas Bricas (CIRAD, France); Philippe Chemineau (INRA, France); Philippe Chotteau (IDELE, France); Jean-Marie Cour (consultant, France); Julien Custot (FAO, Italy); Benoit Daviron (CIRAD, France); Thierry Doré (AgroParisTech, France); Jean-Yves Dourmad (INRA, France); Guillaume Duteurtre (CIRAD, Vietnam); Philippe Ellul (CGIAR Consortium, France); Alessandra Falcucci (FAO, Italy); Guy Faure (CIRAD, France); Günther

8
LAND USE AND FOOD SECURITY IN 2050
Fischer (IIASA, Austria); Martine François (GRET, France); Carl Gaigné (INRA, France); Pierre Gasselin (INRA, France); Hélène Guétat (University of Toulouse Jean Jaurès, France); Petr Havlik (IIASA, Austria); Philipp Heinrigs (Club du Sahel, France); Alexandre Ickowicz (CIRAD, France); Jean-Yves Jamin (CIRAD, France); Satchi Kauschik (INRA, France); Eric Lambin (University of Louvain, Belgium); Frédéric Lançon (CIRAD, France); Frédéric Landy (University Paris Nanterre, France); Luis Lassaletta (CNRS and UPMC, France); Philippe Lecomte (CIRAD, France); Pierre-Yves Le Gal (CIRAD, France); Wilfrid Legg (International Meat Secretariat, France); Philippe Lescoat (AgroParisTech, France); Bruno Losch (CIRAD, France); Graham Mac Donald (University of Minnesota, USA); Karen Macours (INRA, France); Pascale Magdelaine (ITAVI, France); David Makowski (INRA, France); Eric Malézieux (CIRAD, France); Florent Maraux (CIRAD, France); Jacques Marzin (CIRAD, France); William Masters (Friedman School of Nutrition Science and Policy at Tufts University, USA); Michel Merlet (AGter, France); François Moriconi-Ebrard (CNRS, France); Paule Moustier (CIRAD, France); Daniel Mueller (IAMO, Leibnitz Institute, Germany); Claude Napoléone (INRA, France); Thomas Nesme (Bordeaux Sciences Agro, France); Yves Nys (INRA, France); Antonio Onorati (International Planning Committee for Food Sovereignty, Italy); Martine Padilla (CIHEAM, France); Laurent Piet (INRA, France); Jan Douwe van der Ploeg (Wageningen University, The Netherlands); René Poccard Chapuis (CIRAD, Brazil); François Purseigle (ENSAT, France); Miroslava Rajcaniova (Slovak University of Agriculture, Slovakia); Didier Richard (Conseil Vétérinaire, France); Jonathan Rigg (Durham University, National University of Singapore, Singapore); Michel Rieu (IFIP, France); Ophélie Robineau (CIRAD, France); Adrian Rodriguez (ECLAC, Chile); Tévécia Ronzon (Joint Research Center, Spain); Alberto Salamanca (Stockholm Environment Institute, Asia Centre, Thailand); Chloé Salembier (INRA, France); Daniel Sauvant (AgroParisTech, France); Florian Schierhorn (IAMO, Leibnitz Institute, Germany); Marie-Hélène Schwoob (IDDRI, France); Harris Selod (World Bank, USA); Bayuni Shantiko (Center for International Forestry Research, Indonesia); Dimitri Skuras (University of Patras, Greece); Roberta Sonnino (Cardiff University, UK); Christophe Soulard (INRA, France); Akiko Suwa-Eisenmann (INRA, France); Cecilia Tacoli (IIED, UK); Elise Thomazo (Total, France); Daniela Toccaceli (University of Florence, Italy); Emmanuel Torquebiau (CIRAD, France); Abdrahmane Wane (CIRAD, Kenya); Tom Wassenaar (CIRAD, France); Erik Westholm (Swedish University of Agricultural Sciences, Sweden).

9
Introduction
After the first Agrimonde foresight study published in 2011 on ’Feeding the world in 2050’, CIRAD and INRA have turned their attention to a new foresight process on ’Land use and food security in 2050’. The subject is particularly important because of uncertainties about the planet’s capacity to feed a growing population (set to reach 9.7 billion in 2050) in a context of climate change and ongoing debates regarding land-use change trajectories. What are the main drivers of land-use changes and how do they interact and influence food and nutrition security? How will the agricultural land area change over the next 40 years, globally and regionally? What will be the main issues for food and nutrition security in 2050? What tensions will there be between food and nutrition security and climate change mitigation in 2050? This study seeks to answer these questions, highlighting levers that could modify ongoing land-use patterns for improved food and nutrition security. Based on a foresight approach and on quantitative modeling, it provides decision makers, stakeholders, non-governmental organizations and researchers with a tool for dialogue and learning.
First, the long-term dynamics of the land use and food security system were analyzed, with a focus on five dimensions of land use (agronomic potential, access to land, degree of intensity of land use, distribution of land between different uses and services provided by land). This analysis made it possible to detect and then to select key drivers of land-use change, such as global governance and economic development pathway, climate change, food diets, rural-urban relationships, farm structure, cropping and livestock systems. By identifying a range of variables influencing each driver and its dynamics, alternative hypotheses on how each driver might evolve in 2050 were then produced. Secondly, five contrasted scenarios were built by combining one or several hypotheses per driver. Each scenario describes a situation of land use and food security in 2050 and has been translated into a narrative. Thirdly, the impacts of the scenarios in terms of land use, agricultural production and trade in 14 world regions and globally have been assessed through quantitative simulations using the GlobAgri-AgT biomass balance model. The five scenarios and their outcomes were then appraised both quantitatively and qualitatively. Finally, use of this tool for dialogue has begun in Tunisia.
This book presents the results of the work described above, undertaken by the Agrimonde-Terra team with the support and invaluable advice of 80 experts from all over the world and an international Scenario Advisory Committee, from 2013 to 2016.
The first three chapters focus on the methodology used. Chapter 1 describes the ’land use and food security system’ used for the analysis. In Chapter 2 the foresight approach and the method used for building the scenarios are detailed. The GlobAgri-AgT biomass balance model is presented in Chapter 3. The two following chapters describe the background of our foresight exercise regarding land use. Chapter 4 summarizes the main results in the
10
LAND USE AND FOOD SECURITY IN 2050
literature about current global land uses and availability and on land use trajectories up to 2050. Chapter 5 offers a retrospective analysis of land-use change, according to the five dimensions of land use, over past decades. Then, Chapters 6 to 12 report on the work which has been conducted on the drivers of the land use and food security system. In each chapter, the driver and its key variables are defined, the main trends observed over past decades as well as emerging trends are reported and, finally, the alternative hypotheses for the driver in 2050 which have been built are detailed. Chapters 6 to 8 focus on the so-called ’external’ drivers: global context, climate change and food diets respectively. Chapters 9 to 12 relate to the so-called ’direct’ drivers: rural-urban relationships, farm structures, cropping systems and livestock systems respectively.
Chapter 13 describes the five Agrimonde-Terra scenarios of land use and food security in 2050 and provides their narratives. Chapter 14 reports on the quantitative work. It first describes, for each driver, how its envisaged alternative development patterns were translated into quantitative hypotheses, readily processible by the GlobAgri-AgT model. It then analyzes each scenario’s simulation results. Chapter 15 offers a mean of going further in the regional dimension of the Agrimonde-Terra scenarios by contextualizing these scenarios for sub-Saharan Africa. Chapter 16 details the main insights that can be drawn from the qualitative and quantitative analysis of the five Agrimonde-Terra scenarios. Finally, in Chapter 17 we propose six general objectives for public policies whatever the trajectory that will be taken, and identify a few leverage points which could boost the change towards more diversified and healthier diets, while limiting agricultural land expansion.
In the conclusion, we discuss the main strengths and limits of the Agrimonde-Terra scenarios. We also propose several directions for further research.
11
1. The ’Land Use and Food Security’ SystemMarie de Lattre-Gasquet, Chantal Le Mouël and Olivier Mora
Introduction
The central concept of a ’system’ embodies “a set of elements connected together which form a whole, thus showing properties which are properties of the whole, rather than properties of its component parts” (Checkland, 1981). Foresight processes borrow heavily from systems analysis (de Jouvenel, 2004; Loveridge, 2009; FTP, 2014). Also, in many countries of the world, systems analysis is seen as a major driver of innovation and sustainability improvement in agriculture. The complexity of questions facing agriculture has led to a wide adoption of the systems approach in this sector, and the expressions farming systems, cropping systems, food systems, agricultural systems etc. are very commonly used. The systems approach makes it possible to overcome disciplinary specialization, simple relations between inputs and outputs, linear schemes and interactions between spatial scales.
CIRAD and INRA opted for a systems approach for the Agrimonde-Terra foresight process on land use and food security in 2050 because it makes it possible to focus on interactions between causes of changes and emerging properties. All the factors that could have an influence on land use and food security were identified and studied, the most important ones were selected and their interrelations were analyzed; then the system was described. Drivers and actors of change were taken into account. The linkages between land use and food security go through the political context, diets, value chains, climate change, consumers’ revenues etc. and their interactions. In the ’land use and food security’ system, Agrimonde-Terra considers that land-use changes: (i) result from complex and dynamic interactions between direct and external drivers; (ii) may be characterized using five complementary and interlinked dimensions; and (iii) have an impact on the four dimensions of food and nutrition security defined by FAO (CFS, 2009) at different scales ranging from the household to global level. This means that there is a web of processes, actors and interactions involved in land use and leading (or not) to food and nutrition security at global, national or household levels, i.e. the Sustainable Development Goal (SDG) No. 2 ’Zero hunger’. However, because of the multi-factorial approach, land use will also affect at least another seven SDGs, i.e. ’No poverty’ (goal 1), ’Good health and
12
LAND USE AND FOOD SECURITY IN 2050
wellbeing’ (goal 3), ’Clean water and sanitation’ (goal 6), ’Affordable and clean energy’ (goal 7), ’Responsible consumption and production’ (goal 12), ’Climate action’ (goal 13) and ’Life on land’ (goal 15). The ’Partnerships for the goals’ (goal 17) will be very important and will help in reaching all goals if there is a common and shared vision on the future of land use and food security.
In this chapter, we describe the processes of the ’land use and food security’ system, its main actors and its spatial dimensions.
The processes of the ’land use and food security’ system
The first step of the foresight approach adopted by Agrimonde-Terra consisted in defining the system it was going to work on as well as its sub-systems. This was done through literature reviews and four workshops, which involved about 80 researchers (Chapter 2).
❚❚ Land use and food security
The expression ’land use system’ was introduced by FAO in the 1970s (Bouma, 1997) because many countries had developed their own systems of land evaluation which made the exchange of information difficult, and created a need for standardization. It was defined as “a specified land utilization type practiced on a given land unit, and associated with inputs, outputs and possibly land improvements” (FAO, 1976). From there on it was used, although there were further discussions about its definition and no new formal agreement. It was recognized that land use systems should be defined differently at different scales (Bouma, 1997) and that different spatial scales interacted (Verburg et al., 2002), often leading to unexpected outcomes with profound implications for sustainability (Liu et al., 2013).
The basic concepts underlying the terms ’food security’ were articulated in the early 1940s during World War II when more than 40 governments met “to consider the goal of freedom from want in relation to food and agriculture. They concluded that ’freedom from want’ meant a secure, adequate and suitable supply of food for every man, woman and child, where ’secure’ referred to the accessibility of the food, ’adequate’ referred to the quantitative sufficiency of the food supply and ’suitable’ referred to the nutrient content of the food supply” (CFS, 2012). The definition of ’food security’ at the World Food Summit in 1974 also focused on availability. It was in the 1980s that the ’access’ dimension was added to the food security definition. A definition of food security was proposed in 1996 and modified in 2001: “Food security exists when all people, at all times, have physical, social and economic access to sufficient, safe and nutritious food that meets their dietary needs and food preferences for an active and healthy life. The four pillars of food security are availability, access, utilization and stability. The nutritional dimension is integral to the concept of food security and to the work of CFS” (CFS, 2009). Work on indicators

13
1. The ’Land Use and Food Security’ System
aiming to capture various aspects of food and nutrition insecurity is on-going at FAO and in research projects.
❚❚ Land-use changes result from interactions between direct and external drivers
Drivers of land-use changes have been identified through the analysis of local situations or sectors (de Koning et al., 1999; Geist and Lambin, 2002; Lambin et al., 2003; Ostwald et al., 2009; Garrett et al., 2013; Matthiesa and Karimov, 2014; Nesheim et al., 2014) as well as in conceptual work (Stomph et al., 1994; Lambin et al., 2001; Lambin and Geist, 2006; Hersperger et al., 2010; Meyfroidt et al., 2013). They are usually classified as direct (or proximate causes) and underlying (or indirect causes) (Lambin et al., 2003).
Indirect (or underlying) causes of land-use changes “are fundamental forces that underpin the more proximate causes of land-cover change. They operate more diffusely (i.e., from a distance), often by altering one or more proximate causes” (Lambin et al., 2003). Authors identify and classify these drivers in different ways according to the geographical space that is observed and their approach. Geist and Lambin (2002) and Lambin et al. (2003) identify demography, economic factors, technologies, policy and institutions, and cultural factors. Observing land-use changes in a Chinese region, Ostwald et al. (2009) identify economic, policy, climate and political factors as underlying driving forces of land-use change. In the International Assessment of Agricultural Knowledge, Science and Technology for Development (IAASTD) report, van Vuuren et al. (2009) identify demography, economics and international trade, socio-political factors, science and technology, education, culture and ethics, and changes in biophysical environment as indirect drivers of agricultural change. Hersperger et al. (2010) “have identified five groups of driving forces: political, economic, cultural, technological, and natural driving forces. Population (or demography) usually falls into the category of cultural driving forces but sometimes forms an additional group”. Meyfroidt et al. (2013) underline that “Land use changes are strongly influenced by globalized flows of commodities, information, capital and people, and are increasingly driven by factors in distant markets, often associated with the growing urban consumer class in emerging markets. Local to national-scale interventions to promote sustainable land use may have unintended effects abroad owing to a displacement of land use across countries.” Matthiesa and Karimov (2014) point out the role of financial drivers. Neishem et al. (2014) also point out economic growth, technological development, population growth and climate change.
The Agrimonde-Terra team chose to classify the drivers of the ’land use and food security’ system as direct and indirect, but adopted a definition for each category which differs from the one found in above mentioned literature. In Agrimonde-Terra, direct drivers are the ones which affect directly land use and then food security, while indirect drivers (called ’external’ drivers) affect both and simultaneously land use and food security.

14
LAND USE AND FOOD SECURITY IN 2050
The Agrimonde-Terra team designed a ’land use and food security’ system (Figure 1.1) composed of three external drivers and five direct drivers which interact. The foresight approach establishes the causal relationships that exist between all the factors of change. The mix of driving forces of land-use change varies in time and space. In order to have a clearer understanding of the links between natural and human processes that affect land use, and consequently food security, Agrimonde-Terra has decided to focus on one direction: the consequences of the interactions of drivers of land use on food security.
Agriculture and forestry activities (cropping systems, livestock systems and forestry systems), farm structures and urban-rural relationships have a direct impact on land use. External drivers include climate change, food diets and the global context, i.e. political context and governance, economic context (including trade, resources and research and innovation) and human development. Each direct and external driver has been studied in detail with the objective of identifying both past and emerging trends as well as potential disruptions, and building alternative hypotheses for the future up to 2050. Table 1.1 reports the list of drivers and their own causes of change. Forest systems had been identified as direct drivers of change but have not been considered in detail during the Agrimonde-Terra foresight process due to lack of resources. Although no hypotheses about the evolution of forest systems in 2050 have been built, the impacts of climate change on the forestry sector and forest area have been taken into account and the competition for land between arable and permanent crops, pasture and forest uses is an outcome of the quantitative simulations.
Figure 1.1. The Agrimonde-Terra ’land use and food security’ system.
15
1. The ’Land Use and Food Security’ System
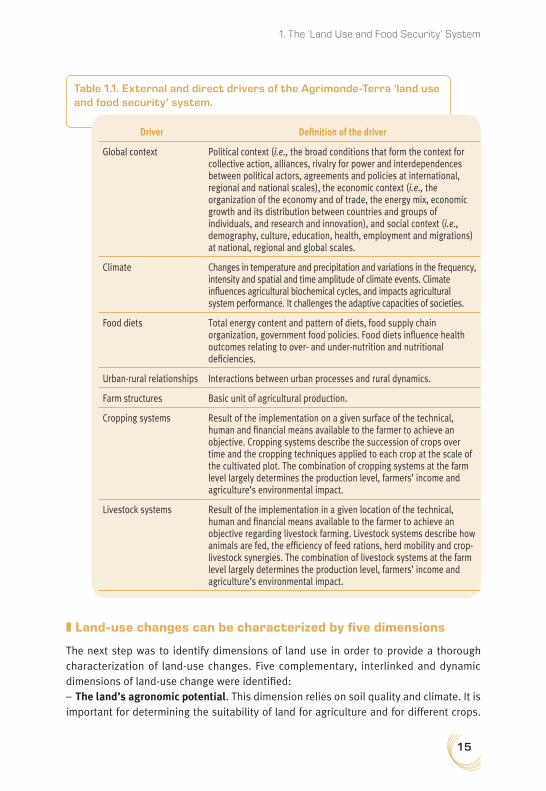
Table 1.1. External and direct drivers of the Agrimonde-Terra ’land use and food security’ system.
Driver Definition of the driver
Global context Political context (i.e., the broad conditions that form the context for collective action, alliances, rivalry for power and interdependences between political actors, agreements and policies at international, regional and national scales), the economic context (i.e., the organization of the economy and of trade, the energy mix, economic growth and its distribution between countries and groups of individuals, and research and innovation), and social context (i.e., demography, culture, education, health, employment and migrations) at national, regional and global scales.
Climate Changes in temperature and precipitation and variations in the frequency, intensity and spatial and time amplitude of climate events. Climate influences agricultural biochemical cycles, and impacts agricultural system performance. It challenges the adaptive capacities of societies.
Food diets Total energy content and pattern of diets, food supply chain organization, government food policies. Food diets influence health outcomes relating to over- and under-nutrition and nutritional deficiencies.
Urban-rural relationships Interactions between urban processes and rural dynamics.
Farm structures Basic unit of agricultural production.
Cropping systems Result of the implementation on a given surface of the technical, human and financial means available to the farmer to achieve an objective. Cropping systems describe the succession of crops over time and the cropping techniques applied to each crop at the scale of the cultivated plot. The combination of cropping systems at the farm level largely determines the production level, farmers’ income and agriculture’s environmental impact.
Livestock systems Result of the implementation in a given location of the technical, human and financial means available to the farmer to achieve an objective regarding livestock farming. Livestock systems describe how animals are fed, the efficiency of feed rations, herd mobility and crop-livestock synergies. The combination of livestock systems at the farm level largely determines the production level, farmers’ income and agriculture’s environmental impact.
❚❚ Land-use changes can be characterized by five dimensions
The next step was to identify dimensions of land use in order to provide a thorough characterization of land-use changes. Five complementary, interlinked and dynamic dimensions of land-use change were identified:
– The land’s agronomic potential. This dimension relies on soil quality and climate. It is important for determining the suitability of land for agriculture and for different crops.
16
LAND USE AND FOOD SECURITY IN 2050
In the case of agricultural use, the land’s agronomic potential is generally measured in terms of crop yield potentials under different technical management systems. Agrimonde-Terra uses the GAEZ classification and data on land suitability to identify this dimension of land-use change. 1 The metrics are areas of land suitable for agriculture. The agrono-mic potential of land varies over time. Firstly, it is linked to land use and changes in land use. For instance, converting an agricultural area into an urbanized area sharply reduces its agronomic potential, regardless of soil quality and climate. Secondly, the land’s agro-nomic potential can evolve even when the activity on the land remains the same. This may occur as a result of climate change, farmers’ decisions and technical progress, as well as the policies that affect all three drivers.
– The distribution of land between different uses. The evolution in arable and perma-nent crop areas, permanent pasture areas, forest areas and some other areas (including sparsely vegetated and barren land, for instance) is the result of farmers’, herders’ and foresters’ decisions and interactions, provided land has agronomic potential and there is access to land. Therefore, how land is allocated to different uses depends on all the factors that influence landowners’ and users’ decisions, including demography and the economic environment. The distribution of land between different uses provides infor-mation on the geographic location of activities within regions (for example, areas used predominantly for cereals or pasture, forest areas, urbanized areas etc.) and worldwide. Key factors of change include diets, demography, climate, but international trade and its main drivers, e.g. tariff/non-tariff barriers, transport costs etc. are also important. Agrimonde-Terra uses the FAO classification and data on land use (FAOStat) to charac-terize this dimension of land use.2
– Access to land and the decision-making powers that determine land use. This depends on land tenure systems and land policy, which are affected by several factors, including the geopolitical situation, the degree of competition for land, farmers’ incomes and access to credit etc. Although the national legal framework is a core driver for access to land, in many countries local governance is even more important. It influences how the law is applied and how competing interests linked to land are managed. Land rights do not always have a legal framework. However, ’informal’ rights can be secured when institu-tions recognize that land rights stem from social consensus and when national authori-ties acknowledge the legitimacy of local arrangements. Agrimonde-Terra provides only a qualitative analysis of access to land.
– The degree of intensity of land use. This concerns farming practices, which depend on available techniques and farmers’ decisions. Therefore, all factors and policies that
1. In the Global Agro-Ecological Zones (GAEZ) approach, land is classified according to its quality or suitability for agricultural production. There are eight classes ranging from ’very suitable’ to ’not suitable’. For more details, http://www.fao.org/nr/gaez/fr/. GAEZ data are used to estimate the maximum cultivable area in each region considered in GlobAgri-AgT (Chapter 3 and Chapter 14).
2. For more details on classification and available data, http://faostat3.fao.org/. FAOStat data are also used for the retrospective analysis of land use provided in Chapter 5.

17
1. The ’Land Use and Food Security’ System
modify available techniques (e.g., technical progress) and farmers’ decisions (farmers’ knowledge and level of training, farmers’ organization, input and output prices, agricul-tural support policies etc.) affect the intensity of land use. Agrimonde-Terra uses two main indicators to measure the degree of intensity of land use: observed yields and the ratio of area harvested over area cultivated (Chapter 3).3 They are interlinked and calcu-lated using FAOStat data.
– The services provided by the land. In the case of agricultural land, these depend on land use and farming practices. Therefore, all drivers that influence the allocation of land between different uses and the intensity of land use affect the services provided by the land. Such services include: provision of services, such as food and water quality; regu-latory services, such as flood and disease control; cultural services, such as spiritual and recreational; supporting services, such as nutrient cycling that maintains the conditions for life on Earth; other services such as employment. In Agrimonde-Terra, there is a qua-litative analysis of the services provided by the land.
❚❚ Land-use changes have an impact on the four dimensions of food security
The various drivers interact to result in changes in land use, which in turn, impacts food and nutrition security. GlobAgri-AgT, a biomass balance model (Chapter 3), has been used to simulate the impacts of the scenarios on world and regional land use, agricultural production and agricultural trade in 2050. Thus, the information on the four dimensions of food and nutrition security provided in the narratives of the Agrimonde-Terra scenarios is supported, at least partially, by quantitative results (Chapter 14). These quantitative results provide information on the availability dimension of food and nutrition security. As far as the access dimension of food security is concerned, quantitative results do not give direct information. However some quantitative results may provide indirect indication. Indeed, quantitative results show how competition for land could evolve and to what extent trade and the dependence of certain regions on world markets (either as importers or exporters) could change. These quantitative results thus give some indication on potential impacts of the various scenarios in terms of food access, notably output prices changes, in relation to competition for land, and import and export dependence of regions. Overall, one must acknowledge that Agrimonde-Terra has not been able to say much about the impacts of scenarios on the utilization and stability dimension of food security.
3. Both indicators are used for the retrospective analysis of land use (Chapter 5) as well as for the quantification of the hypotheses of change of cropping systems, which are involved in the various Agrimonde-Terra land-use scenarios.
18
LAND USE AND FOOD SECURITY IN 2050
The temporal and spatial dynamics in the ’land use and food security’ system
Land use can be examined from different geographical scales, e.g. the plot of land, the farm, the territory, the sub-region and the national or global levels. At each scale, the changes that are captured are not the same; the links of causalities between drivers and the influence of actors may also change. The same holds true for food security, which can be examined from the individual or household perspective through to a sub-region, a country or global scale.
Interactions between geographical scales are important (Lambin and Meyfroidt, 2011; Lerin and Louafi, 2012), and decisions on land use should not take into account only the local context (Liu et al., 2013). Displacement of production, expansion or reduction of land use will have major impacts on food security.
Land-use changes can be observed during short periods (a few years), a decade or several decades, and the observation can be done at different geographical scales. The temporal and geographical scales of observation influence the types of changes observed. At the scale of a plot or a territory, land-use changes can be observed rapidly. At larger scales, longer periods of time are necessary to observe changes.
The actors in the ’land use and food security’ system
A wide variety of actors are active in the ’land use and food security’ system. Their roles, networks and alliances vary over time, as well as the business models, value chain organizations and other institutional arrangements they establish. They are active at different geographical scales, some actors being very local whereas others are present from the local to the global scales. The main actors in the ’land use and food security’ system are:
– Farmers, herders, foresters, hunters etc. who use land at a local scale through their cropping, livestock and forestry systems, and their farm structures and their collabora-tive organizations, e.g. farmers’ organizations.
– Citizens who live in urban and rural areas and their associations, and are consumers of products. They can buy agricultural products from local or non-local sources.
– Governments, through their different ministries, administrations (agriculture, environ-ment, trade, education, health etc.) and policymakers who set up and implement policies, market rules including norms and facilitate the resolution of conflicts. In some countries, aid agencies provide financial, logistical and material support, including food aid.
– Local, territorial, and national public and private institutions for land and water plan-ning, city planning, sanitation services, infrastructure and roads, conservation areas, envi-ronmental protection etc. as well as institutions which provide information and inputs
19
1. The ’Land Use and Food Security’ System
to farmers, herders, foresters and citizens, or co-construct organizations, knowledge and technologies with them. These are, for example, extension agents, health services for crops and animals, trainers, financial institutions, research and development institu-tions, and health institutions.
– Financial institutions, local, national or international, which invest in land, agriculture, agribusinesses or provide credits or subsidies.
– International institutions, such as the United Nations institutions, which provide advice, aid, rules for exchanges etc. as well as international conventions.
– Regional political and economic institutions. – Enterprises, small, large or multinational, who are buyers, traders, processors, trans-
formers and sellers of agricultural products and of inputs for production; logging and mining firms. They can form lobbies.
– Non-governmental organizations (NGOs) active in land and environmental issues inclu-ding protection of indigenous populations.
– Media.
Conclusion
The Agrimonde-Terra ’land use and food security’ system emphasizes inter-linkages and interactions between the external and direct drivers of change and their consequences on food security. It demonstrates that achieving food security is dependent not only on increasing production, improving quality and ensuring access and utilization to all, but that external drivers of change such as the political, economic and human context at global, regional, national and territorial levels, food diets and climate change play an extremely important role. It explains why it is so difficult to reach food security. Like the Sustainable Development Goals, it forms an ’indivisible whole’ which leads to the necessity of creating connections between policies and actors, and avoiding operating in silos.
20
2. Agrimonde-Terra’s Foresight Approach to Scenario Construction Olivier Mora and Marie de Lattre-Gasquet
Introduction
The foresight approach has become widespread over the past decade, particularly in the fields of climate, energy, agriculture and the environment, as a means of anticipating future developments in a long-term perspective. It differs from work using projections as it takes into account the radical indeterminacy of the future, weak signals and possible ruptures in system trajectories, and the complexity of long-term dynamics. In the words of Gaston Berger, the future from a foresight perspective is not considered “as a thing already decided and which, little by little, will be revealed to us, but as a thing to be done” (1967). By design, it is the domain of contingency and action rather than necessity.
Foresight aims to increase the capacity of actors to prepare and shape their future by informing their decision-making with the anticipation of possible futures. So, foresight has both a heuristic function whose challenge is to better understand the potential and risks of contemporary dynamics (de Jouvenel, 1986), and an empowerment and decision support function (Miller, 2007; Godet, 2000). The Agrimonde-Terra foresight study aims to open and participate in the debate on the possible future of land use and food security, and to contribute to strategic thinking, research and public deliberation.
Choosing a systemic and exploratory approach to understand a complex problem
The method employed here is firstly a response to the complexity and the high degree of uncertainty which characterize the issue being studied. It stems from the fact that issues of land use and food and nutritional security can be considered as ’wicked problems’ (Rittel and Webber, 1973). According to Rittel’s definition, ’wicked problems’ are those with ill-defined outlines, marked by a high degree of uncertainty, where it is difficult to consider all the possible consequences of an action because

21
2. Scenario Construction
of the interdependence of factors and a multiplicity of values and actors that are present in the definition of the problem and its solution (Turnpenny et al., 2009). So, depending on the actor under consideration, food security may be defined at a household, country or global scale, it may or may not incorporate nutritional issues (in particular the question of diet-related chronic disease), it may or may not focus on food availability and international trade, it may or may not be concerned with individual access to food and incomes. In addition, the term ’wicked problems’ characterizes problems for which a simple and definitive formulation cannot be posed, to which a single solution cannot be applied. Answering one aspect of the problem may lead to or generate other problems because the dynamics are interlocked and the system is constantly changing. So the future relationship between land use and food security cannot be reduced to a single issue, for example population growth, but it is necessary to take into account changes in agricultural, environmental, climate and food systems etc.
Taken separately, the evolution by 2050 of each driver in the ’land use and food security’ system (Chapter 1) is subject to great uncertainty, whether it be the impact of climate change, the energy transition, the intensification and transformation of agricultural systems and their impact on natural resources, nutritional transitions and the globalization of food supply chains, but also the processes of urbanization, or changes in international governance and public policies. But by 2050, these dynamics will actually act simultaneously and in an intermingled fashion to determine land use and food security. These interdependencies will increase the uncertainty tenfold. The foresight approach chosen by the Agrimonde-Terra project is a systemic approach for exploring the transformations in this complex system of interdependencies.
Agrimonde-Terra has been defined as an exploratory study whose goal is to prepare actors for different possible futures, by providing them with elements for understanding and anticipating future issues in the form of scenarios. A scenario describes the trajectory and future state of the system, defined by a plausible and consistent combination of hypotheses about the previously mentioned drivers and their relationships. Each scenario offers both a reformulation of the problem of the relationship between land use and food security by 2050, identifies the issues to be addressed and, in some cases, provides a series of options to solve them.
The scenarios constructed are not strictly normative because they also include undesirable situations and situations with ambiguous consequences. Nor are they simply projections or extrapolations of current trends because they take into account possible ruptures and weak signals. The development of exploratory scenarios made it possible to update a variety of possible system trajectories. Ultimately, the set of scenarios developed by Agrimonde-Terra aims to contribute to public and scientific debate and deliberative processes by functioning as a learning device (Rhisiart et al., 2015) through which actors can become acquainted with and anticipate the challenges to come.

22
LAND USE AND FOOD SECURITY IN 2050
A scenario approach combining morphological analyses, foresight forums and a quantitative simulation tool
The method adopted by Agrimonde-Terra to consider the future of land use and world food security by 2050 combines various approaches: a scenario method based on morphological analysis (Ritchey, 2011) and applied at various system scales, the implementation of foresight forums to discuss hypotheses on evolutions of the system (Jouvenel, 1972; Mermet, 2009), and the construction and use of a modelling and simulation tool, called GlobAgri-AgT. From a methodological point of view, these different types of approaches are inspired by the French ’prospective’ school (Godet, 2000; de Jouvenel, 2000).
The choice of the foresight method meets both the study’s objectives and the characteristics of the system being studied. In the case of Agrimonde-Terra, the method responds to both the challenges posed by the complexity of the system, taking into account long-term changes and high degrees of uncertainty, and also to the study’s aim of being exploratory. Using the scenario method based on morphological analysis makes it possible to consider a large number of alternative scenarios based on a common analysis of the system’s dynamics, while taking into account a high degree of uncertainty (Zurek and Henrichs, 2007). In comparison, a four-quadrant scenario method (Schwartz, 1991), which might seem appropriate for systems with some stability over time, allows for only a small degree of differentiation between scenarios and reduces uncertainties to two factors (the two axes of the quadrants), which structure the future of the system.
Using morphological analysis in scenario construction makes it possible to conduct a systematic analysis and exploration of all the relationships which exist between the multiple dimensions of complex problems (Ritchey, 2011). Developed by Fritz Zwicky in the 1940s, morphological analysis is a qualitative method which alternates analysis and synthesis in order to imagine the multiple states of a given system. It is a rigorous and creative method. In scenario building, morphological analysis begins by analytically breaking down the system into sub-systems or drivers, for which alternative hypotheses of changes to 2050 are constructed. Following this, morphological analysis makes it possible to systematically visualise all the possible combinations of the hypotheses, and to identify among them the alternative combinations, both plausible and internally consistent, which give shape to different scenarios describing the future states of the system. Morphological analysis ensures the traceability of the scenario construction process by making explicit all the hypotheses used in the different phases of the process. Finally, it is a question of reducing the number of possible configurations of the morphological space by defining relevant configurations of hypotheses which trace the contours of a ’space of possible futures’, which is a morphological sub-space. It is in this space that organisations and individuals will have to navigate, anticipate and act in the future.

23
2. Scenario Construction
Within Agrimonde-Terra, different morphological analyses were carried out successively, first at the scale of the system drivers and then at the scale of the system as a whole. The various morphological analyses conducted on the drivers provided the base required for constructing a morphological analysis of the entire system, acting as a series of ’nested boxes’. This architecture, coupled with the hypotheses and scenarios, makes the scenarios that have been developed highly robust. Indeed, the construction of hypotheses and the choice of hypotheses forming the scenario are both transparent and traceable and, in particular, comparisons can be made between the hypotheses selected for each scenario.
Each sequence of the foresight work relied on a specific forum of experts to formulate hypotheses for changes and for the scenarios. To study the future evolution of drivers, four separate expert forums worked in parallel to conduct foresight reflections on four themes, bringing together 80 researchers from developed, emerging and developing countries. At the system scale, scenario building was based on the expertise of a Scenario Advisory Committee made up of around 15 international researchers and decision-makers. This committee met four times to discuss and validate the hypotheses about the future of the drivers of the ’land use and food security’ system, the combinations of hypotheses and the scenario narratives, the quantification of the scenarios and the results of the simulations.
Finally, Agrimonde-Terra brings together a qualitative approach to scenario building through morphological analysis and a modelling approach based on the construction of a data platform and the Globagri-AgT biomass balance model (Chapter 3). As Laurent Mermet (2005) points out, “conducting foresight reflection using models requires the ability to take into account very heterogeneous levels of analysis, from the philosophical concepts underlying the architecture of the suggested model, through to the choice of the data used, or the writing of certain model equations”. In Agrimonde-Terra, the choice was made to use a conceptually relatively simple biomass balance model. The advantage of balance models is the high degree of flexibility for which they can be used. The balance model can easily be adapted to a variety of relationships between system drivers and can simulate highly contrasting scenarios. The fact that the scenarios are based on morphological analysis makes it possible to systematically link the qualitative hypotheses and their quantitative translation into simulation input data (Chapter 14). The morphological table in which the hypotheses used in each scenario are listed provides a unified reasoning framework which enables the use of the quantified model. This approach responds to some of the issues identified in the scientific literature by explaining the relationship between the quantification model and the consistency of the hypotheses (van Vuuren et al., 2012). The coherence of hypotheses at the system scale is qualitatively assured by the morphological analysis on which the scenarios are built; while the biomass balance model specifies the scale and scope of changes described in the scenarios and provides the elements to compare scenarios.

24
LAND USE AND FOOD SECURITY IN 2050
The steps in scenario construction
The construction of the scenarios took place in four steps: (1) the definition of the ’land use and food security’ system; (2) the construction of the alternative hypotheses of changes to 2050 for each driver of the system; (3) the development of land use and food security scenarios by combining hypotheses and the construction of narratives describing the scenarios, and (4) the implementation of simulations illustrating the quantified impact of the qualitative assumptions on land use and food security.
❚❚ Step one: Defining the ’land use and food security’ system
Through an analysis of land use and food security, the Agrimonde-Terra foresight study identified a system of land use and food security defined by four direct drivers and three external drivers of changes in land use (Chapter 1). All of these drivers were considered separately, first by examining their possible changes to 2050 (see Step 2), and then interacting within the framework of the construction of scenarios where the drivers are linked according to pertinent and consistent configurations (see Step 3 and 4).
❚❚ Step two: Construction of alternative hypotheses to 2050 for direct and external drivers of changes in land use
In order to construct alternative hypotheses describing the state of each driver in 2050, past changes in the direct and external drivers of the ’land use and food security’ system, as well as the weak signals of change and possible ruptures in the future, were studied in detail.
The four direct drivers – urban-rural relationships, farm structures, cropping systems and livestock systems – were examined by four expert groups comprising 20 or so national and international specialists in each field. The prospects for each driver by 2050 were the subject of at least two days of thematic workshops which brought the experts together. In advance of the thematic workshops, a dedicated team composed in general of two scientific managers and a coordinator (Box 2.1), conducted an analysis of the past dynamics of the driver’s evolution through a preliminary review of the literature. These results were discussed in the two-step workshops. After characterizing each driver according to a set of variables (Table 1.1, Chapter 1), past trends, weak signals of changes and possible future ruptures were identified for each variable on the basis of the literature review and expert analysis (Chapters 6 to 12). Based on a morphological analysis, hypotheses describing the possible evolution of the driver by 2050 were then sketched out with the experts in the field. Downstream of the workshops, the dedicated team developed and formalized the conclusions of the workshops in the form of alternative hypotheses for the evolution of the driver, making these results available for the following step. This process was repeated for each of the four direct drivers of land-use change.
25
2. Scenario Construction
With regard to the three external drivers of change – climate, diet and the global context – the hypotheses for their evolution to 2050 were developed on the basis of a literature review of existing trends and scenarios, and the development of a morphological analysis.
❚❚ Step three: Building land use and food security scenarios
Step three involved the construction of land use and food security scenarios. It was carried out with constant interaction between the project team and the group of international experts forming the Scenario Advisory Committee (Box 2.1) over a period of one and a half years.
Box 2.1. Agrimonde-Terra Organization
Agrimonde-Terra was composed of:• Project team: Marie de Lattre-Gasquet (Coordinator, CIRAD), Chantal Le Mouël
(Coordinator, INRA), Olivier Mora (INRA, organiser for scenario building), Catherine Donnars (INRA), Patrice Dumas (CIRAD) and Olivier Rechauchère (INRA), with the collaboration of Thierry Brunelle (CIRAD), Stéphane Manceron (INRA), Elodie Marajo-Petitzon (INRA), Clémence Moreau (CIRAD), Marco Barzman (INRA), Agneta Forslund (INRA) and Pauline Marty (INRA).
• Steering committee: Pierre Fabre (replaced in 2015 by Alain Billand) (CIRAD), Hervé Guyomard (INRA), Etienne Hainzelin (CIRAD) and Bertrand Schmitt (INRA).
• Scenario Advisory Committee (international experts chosen intuitu personae): Agnes Andersson Djurfeldt (Lund University, Sweden), Leïth Ben Becher (Synagri, Tunisia), Mohamed Elloumi (INRAT, Tunisia), Adama Faye (IPAR, Senegal), Richard Guissou /Yves-Gérard Bazie (Ministry of Agriculture and Food Security, Burkina Faso), Holger Kray (World Bank, USA), John Lewis (Terra Global Capital, USA), Patrick Meyfroidt (Louvain University, Belgium), Marc Mueller (FAO, Italy), Siwa Msangui (IFPRI, USA), Antonio Onorati (International Planning Committee on Food Sovereignty, Italy), Stéphane Parmentier (Oxfam, Belgium), Alain Retière (Cap 2100, France), Roberta Sonnino (Cardiff University, UK), Sébastien Treyer (IDDRI, France), Dominique van der Mensbrugghe (AgMIP, Purdue University, USA), Joost Vervoort (CCAFS and Oxford University, UK) and Hisham Zehni (IFAD, Italy).
• Scientific coordinators and managers of the thematic workshops: { Urban-rural relationships: Olivier Mora (Coordinator, INRA), Francis Aubert (AgroSup Dijon) and Frédéric Lançon (CIRAD).
{ Production structures: Catherine Donnars (Coordinator, INRA), Jacques Marzin (CIRAD) and Laurent Piet (INRA).
{ Cropping systems: Olivier Réchauchère (Coordinator, INRA), David Makowski (INRA), Eric Malézieux (CIRAD) and Florent Maraux (CIRAD).
{ Livestock systems: Stéphane Manceron (Coordinator, INRA), Patrice Dumas (Coordinator, CIRAD), Philippe Lecomte (CIRAD), Alexandre Ickowitz (CIRAD) and Philippe Lescoat (AgroParisTech).
• 80 experts who participated in the thematic workshops.

26
LAND USE AND FOOD SECURITY IN 2050
The composition of the Scenario Advisory Committee and the choice of experts were driven by the need for a multidisciplinary approach, for expertise in various fields and for expertise from stakeholders. On the one hand, the construction of scenarios on land use required the involvement of experts from different fields in order to understand the complexity of the phenomena of land use and food security. On the other hand, in order to take into account the point of view of actors engaged in these fields and their visions of the future, experts from international and national institutions (World Bank, FAO, IFAD, IFPRI and Ministries of Agriculture) and civil society stakeholders were included in the committee. The latter were leaders of farmers’ organisations and non-governmental development organisations involved in the international arena where food security and land use issues are debated.
In the first step, the Scenario Advisory Committee examined and discussed all the alternative hypotheses for the evolution of the direct and external drivers produced in previous workshops. A basis for analysis was created, describing the current situation of the ’land use and food security’ system and its past dynamics. On this basis, the project team constructed a morphological table showing all the alternative hypotheses for the evolution of all the drivers in the system (Figure 13.1). This table served as the basis for the rest of the forward-looking thinking as well as for the simulations carried out using the GlobAgri-AgT model, and for the production of the scenarios, followed by the regionalization of the scenarios. In a second step, five land use scenarios were constructed in close collaboration with the Scenario Advisory Committee. Each scenario consistently and plausibly combines the evolution hypotheses for each driver and provides an image of the state of the system in 2050. A narrative was elaborated for each scenario describing the change trajectories in land use and food security and the causal relationships which link drivers to each other were identified. Finally, the scenarios were enriched by the production with the committee of regional variations for each scenario. This work was based on a retrospective analysis of regional changes in land use and each driver of the system in six world regions.
❚❚ Step four: Quantifying of hypotheses and simulating scenarios
The scenarios were illustrated quantitatively using the GlobAgri-AgT data and model developed and run by a dedicated team. The results and the consistency of the scenario simulations were discussed with the Scenario Advisory Committee, an exchange which made it possible to specify the ways of quantitatively translating the evolution hypotheses for the drivers, to finalise the results of the simulations and to interpret them. This simulation work made it possible to evaluate how each region fits into a scenario and to identify regional issues.
The outcomes of Agrimonde-Terra and their use
The whole process led to the finalization of the scenarios presented in Chapters 13, 14 and 15, with the five scenarios constructed by Agrimonde-Terra available for different
27
2. Scenario Construction
world regions. For each scenario, a narrative of the future situation in the ’land use and food security’ system in 2050 details land use in five dimensions, and food and nutritional security in four dimensions (availability, physical and economic access, food utilization and stability of access over time). The narrative specifies the system’s trajectory, in other words, the events, ruptures, causal relationships and public policies that have influenced the evolution of the system (Chapter 13). Based on the morphological analysis of the ’land use and food security’ system, simulations from the GlobAgri-AgT model provide quantified estimates for each scenario in terms of changes in land use, production and use of agricultural products, international trade and food availability at global and regional scales (Chapter 14).
Agrimonde-Terra’s outputs have been developed to provide a tool for dialogue and reflection for stakeholders in decision-making on land use and food security. Three Agrimonde-Terra outputs are likely to be used in other regional or national foresight reflections: the retrospective and prospective analysis of the factors of change (Chapters 6 to 12), the five Agrimonde-Terra scenarios (Chapter 13) and their quantitative illustration using the GlobAgri-AgT model (Chapters 3 and 14). At the regional scale, Agrimonde-Terra’s conceptual framework and outputs provide elements for analyzing the current land use and food security situation, the current trends leading to each scenario and possible changes to the ’land use and food security’ system by 2050, as has been done for sub-Saharan Africa (Chapter 15). Furthermore, Agrimonde-Terra’s outputs and the existing methodology can be reused by ad hoc groups of public and private actors in order to build land use and food security scenarios at the territorial, national or large regional scale. This has already been done, for example, in Tunisia (de Lattre-Gasquet et al., 2017a).
Conclusion
The foresight method developed within Agrimonde-Terra combines a consideration of complexity, an exploratory approach envisaging a plurality of futures and a combination of qualitative scenarios and model-based simulations. The partial and overall results from the study can be used within the context of national or regional foresight exercises conducted by groups of actors (researchers, professionals, NGOs and public decision-makers) reflecting on the links between land use and food security in the long-term.
28
3. The GlobAgri-Agrimonde-Terra Database and ModelChantal Le Mouël, Patrice Dumas, Stéphane Manceron, Agneta Forslund and Elodie Marajo-Petitzon
With contributions from: Mario Herrero (CSIRO, Brisbane), Petr Havlik (IIASA, Vienna) and Hervé Guyomard (INRA, Rennes)
Introduction
The GlobAgri platform was set up by CIRAD and INRA to generate consistent databases and biomass balance models using data from FAOStat as well as data shared by colleagues from different institutions.4 The databases generated are balanced and account for the links between products (through animal feed or oilseed crushing for instance). Biomass balance models provide a balance equation between resources (domestic production plus imports minus exports) and utilization (food, feed and other) for each region and each agri-food product. In each equation, imports are a linear function of total domestic use and exports are a linear function of the world market size. A world trade balance equation ensures that world imports equal world exports for each agri-food product. The system of balance equations can simulate land-use change in each region induced by changes in the use of agri-food products, provided hypotheses made on changes of a set of variables (such as plant and animal yields, maximum available cultivable land, trade conditions etc.).
The GlobAgri platform has been used to generate a database and a biomass balance model specifically customized for Agrimonde-Terra (specific product and country aggregation, specific rules for co-product handling and specific rules for model closure). The resulting tool is named GlobAgri-Agrimonde-Terra (GlobAgri-AgT). It encompasses 33 aggregates of agri-food products (25 plants, seven animal aggregates and a miscellaneous “Other products”) and covers 14 broad regions.
4. These colleagues are warmly thanked as well as their institutions: the Center for Sustainability and the Global Environment (SAGE), the Commonwealth Scientific and Industrial Research Organisation (CSIRO), the International Institute for Applied Systems Analysis (IIASA), the Institute of Soil Science of the Chinese Academy of Sciences, the Joint Research Center (JRC), Princeton University, the World Fish Institute, the World Resources Institute (WRI) and the Woodrow Wilson School of Public and International Affairs.
29
3. GlobAgri-AgT
We first detail the product and geographic nomenclatures of GlobAgri-AgT. Then we describe briefly how the biomass balance model functions. Finally, we examine the model’s entry variables.
Product and country aggregation in GlobAgri-AgT
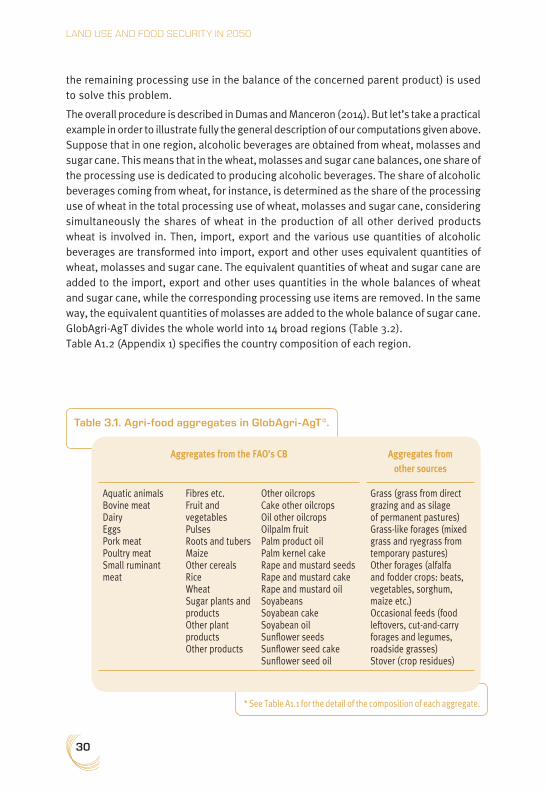
In GlobAgri-AgT the whole set of FAO’s ’commodity balances’ (CB) is aggregated into 33 agri-food aggregates (Table 3.1). As the FAO’s CB do not cover some of the key ingredients fed to animals, such as grass and various forage plants, GlobAgri-AgT considers five additional aggregates. Corresponding data are from Herrero et al. (2013) and Monfreda et al. (2008). Table A1.1 (Appendix 1) details the composition of all the product aggregates considered. Oilcrop products are rather detailed in order to be able to account for the link between the oilseed and both crushing co-products, oil and cake, which is specific for each type of oilseed.
For each product in each country, the FAO’s CB provide the resource-utilization balance where the utilization involves food, feed, other uses (biofuels, for example), waste and processing. The latter reports the quantity of the primary product which has been processed into derived products (sugars, sweeteners, alcohols, oils and cakes, for example). In GlobAgri-AgT, oils and cakes are explicitly accounted for as product aggregates and there is no need for specific computations. Sugars, sweeteners and alcohols, however, are not explicit product aggregates but are accounted for through their equivalent quantities in the balance of the parent product from which they are derived. In this case, the processing use in a parent product balance is replaced by the appropriate items of the balances of its derived products (import, export, various uses), in equivalent quantities using transformation coefficients. When the processing of a parent product into a derived product generates co-products, their import, export and various use quantities are also merged with the balance of the parent product, on the basis of their energy content. As a first step in these overall computations, one must be able for each derived product to disentangle the various sources of its supply or, equivalently, for each parent product to split the processing use between the various derived products produced. We achieve this by first assuming that the share of a parent product as a source of production of a derived product is correlated to the share of the processing use of this parent product in the total processing use of all parent products contributing to the production of this derived product (for example, if in a region sweeteners are produced from both wheat and maize, and wheat processing use accounts for one-third of the total processing use of wheat and maize, then one-third of the sweeteners produced will be considered to come from wheat). Secondly, as we must deal with cases where one parent product is used for the production of several derived products (taking the previous example, if wheat is also used for producing alcoholic beverages), the shares of this parent product in the production of each derived product need to be determined simultaneously. A minimization program (of
30
LAND USE AND FOOD SECURITY IN 2050
the remaining processing use in the balance of the concerned parent product) is used to solve this problem.
The overall procedure is described in Dumas and Manceron (2014). But let’s take a practical example in order to illustrate fully the general description of our computations given above. Suppose that in one region, alcoholic beverages are obtained from wheat, molasses and sugar cane. This means that in the wheat, molasses and sugar cane balances, one share of the processing use is dedicated to producing alcoholic beverages. The share of alcoholic beverages coming from wheat, for instance, is determined as the share of the processing use of wheat in the total processing use of wheat, molasses and sugar cane, considering simultaneously the shares of wheat in the production of all other derived products wheat is involved in. Then, import, export and the various use quantities of alcoholic beverages are transformed into import, export and other uses equivalent quantities of wheat, molasses and sugar cane. The equivalent quantities of wheat and sugar cane are added to the import, export and other uses quantities in the whole balances of wheat and sugar cane, while the corresponding processing use items are removed. In the same way, the equivalent quantities of molasses are added to the whole balance of sugar cane.GlobAgri-AgT divides the whole world into 14 broad regions (Table 3.2). Table A1.2 (Appendix 1) specifies the country composition of each region.
* See Table A1.1 for the detail of the composition of each aggregate.
Table 3.1. Agri-food aggregates in GlobAgri-AgT*.
Aggregates from the FAO’s CB Aggregates from other sources
Aquatic animals Bovine meat Dairy Eggs Pork meat Poultry meat Small ruminant meat
Fibres etc. Fruit and vegetables Pulses Roots and tubers Maize Other cereals Rice Wheat Sugar plants and products Other plant productsOther products
Other oilcrops Cake other oilcrops Oil other oilcrops Oilpalm fruit Palm product oil Palm kernel cake Rape and mustard seeds Rape and mustard cake Rape and mustard oil Soyabeans Soyabean cake Soyabean oil Sunflower seeds Sunflower seed cake Sunflower seed oil
Grass (grass from direct grazing and as silage of permanent pastures) Grass-like forages (mixed grass and ryegrass from temporary pastures) Other forages (alfalfa and fodder crops: beats, vegetables, sorghum, maize etc.) Occasional feeds (food leftovers, cut-and-carry forages and legumes, roadside grasses) Stover (crop residues)
31
3. GlobAgri-AgT
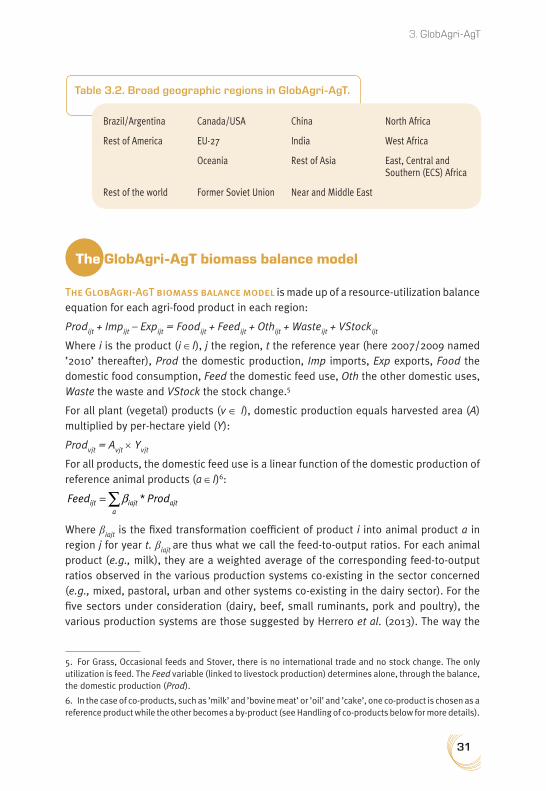
The GlobAgri-AgT biomass balance model
The GlobAgri-AgT biomass balance model is made up of a resource-utilization balance equation for each agri-food product in each region:
Prodijt + Impijt – Expijt = Foodijt + Feedijt + Othijt + Wasteijt + VStockijt
Where i is the product (i ∈I), j the region, t the reference year (here 2007/2009 named ’2010’ thereafter), Prod the domestic production, Imp imports, Exp exports, Food the domestic food consumption, Feed the domestic feed use, Oth the other domestic uses, Waste the waste and VStock the stock change.5
For all plant (vegetal) products (v ∈ I), domestic production equals harvested area (A) multiplied by per-hectare yield (Y):
Prodvjt = Avjt × Yvjt
For all products, the domestic feed use is a linear function of the domestic production of reference animal products (a ∈I)6:
ijt iajta
ajtFeed Prodβ= ∑ *
Where βiajt is the fixed transformation coefficient of product i into animal product a in region j for year t. βiajt are thus what we call the feed-to-output ratios. For each animal product (e.g., milk), they are a weighted average of the corresponding feed-to-output ratios observed in the various production systems co-existing in the sector concerned (e.g., mixed, pastoral, urban and other systems co-existing in the dairy sector). For the five sectors under consideration (dairy, beef, small ruminants, pork and poultry), the various production systems are those suggested by Herrero et al. (2013). The way the
5. For Grass, Occasional feeds and Stover, there is no international trade and no stock change. The only utilization is feed. The Feed variable (linked to livestock production) determines alone, through the balance, the domestic production (Prod).
6. In the case of co-products, such as ’milk’ and ’bovine meat’ or ’oil’ and ’cake’, one co-product is chosen as a reference product while the other becomes a by-product (see Handling of co-products below for more details).
Table 3.2. Broad geographic regions in GlobAgri-AgT.
Brazil/Argentina Canada/USA China North Africa
Rest of America EU-27 India West Africa
Oceania Rest of Asia East, Central and Southern (ECS) Africa
Rest of the world Former Soviet Union Near and Middle East

32
LAND USE AND FOOD SECURITY IN 2050
feed-to-output ratios are computed at the production system level and at the sector level is described in detail in Dumas (2014). One may notice that GlobAgri-AgT assumes that there is no substitution between feed ingredients within feed rations: when the animal product quantity increases, the feed demand of each ingredient increases proportionally while the composition of the ration remains unchanged.
Finally, for all products i, imports are written as a fixed share of total domestic use:
Impijt = αijt * (Foodijt + Feedijt + Othijt + Wasteijt + VStockijt)
Where αijt is the import dependence coefficient of region j for product i in year t. In other words, GlobAgri-AgT assumes that when total domestic use of one product increases in region j, a fixed share of the additional need is covered by imports from abroad, while the remaining share is covered by increased domestic production, provided that region j’s maximum cultivable area is not binding (see below).
Exports of product i by region j are written as a fixed share of the world market size of product i:
ijt ijt ijtj
Exp Impσ = ∑*
Where σijt is the world export market share of region j for product i in year t.
Import and export specifications in GlobAgri-AgT imply some rigidity in international trade: each region imports a fixed share of its domestic use and regional world export market shares are constant. Such rigidity may result from several factors such as the slow change in regional comparative advantages, and slow change in transport infrastructures and commercial channels. However, such specifications are rather restrictive when dealing with mid- to long-term analysis. We should emphasize, however, that import dependence coefficients (αijt) and/or world export market shares (σijt) may be changed exogenously as part of simulated scenarios (e.g., the ’Regionalization’ scenario) and may change endogenously as part of the scenario simulations in regions where the maximum cultivable land area is binding (see below). In both cases such adjustments of import dependence coefficients and world export market shares may figure changes in regional comparative advantages or transport or trade costs potentially implied by trade, agricultural and/or environmental policies for instance.
Finally, when replacing in the balance equations all variables by their respective expression in the additional equations, one realizes that, provided that Vstock is fixed, Food, oth and Waste are the model’s exogenous variables while the area harvested (A) is the model’s endogenous variable.
❚❚ The handling of co-products
Among the 33 agri-food aggregates of GlobAgri-AgT, there are some sets of co-products, namely ’Bovine meat’ and ’Dairy’ in the dairy sector and ’Oil’ and ’Cake’ in the oilseed crushing sectors (Table 3.1). For these sets of co-products, the balance equations reported
33
3. GlobAgri-AgT
above apply for one of the co-products, which is chosen as the reference product, but they must be changed for the other, which is called the by-product.
In GlobAgri-AgT, we decided to choose ’Dairy’ and ’Cake’ as reference products. Balance equations were thereby adapted for ’Bovine meat’ (in fact for the dairy by-product share of ’Bovine meat’ only) and for all oilseeds ’Oils’. In these cases, the production variable (Prod) no longer freely adjusts following a change in utilizations, but is pre-set by the quantity produced of the reference product and one of the various uses (most often the Food use) becomes endogenous.
This modelling makes it possible to maintain the existing link between co-products. However, this creates some difficulties for simulating changes in food diets since it requires an exogenous setting of the quantities consumed of each product, including ’Bovine meat’ and ’Oils’, in each region. This problem is easily dealt with for ’Bovine meat’ as there is another source of production unlinked to ’Dairy’: the beef sector. As far as ’Oils’ are concerned, there is no oilseed producing only oil but we circumvent the problem by ignoring the link between ’Palm kernel cake’ and ’Palm product oil’ in the model. Hence, in both cases we are able to calculate the food consumption shocks for the share of ’Bovine meat’ produced by the beef sector and for ’Palm product oil’ required for the overall changes in ’Bovine meat’ and ’Oils’ food consumption to correspond exactly to the changes in food diets which are to be simulated.
❚❚ Model closure
The model is closed firstly adding a world trade equilibrium equation for each product and secondly adding an agricultural land constraint equation in each region.
For each product i, the world trade equilibrium equation is written:
ijt ijtj j
Imp Exp=∑ ∑While for each region j, the agricultural land constraint equation is:
vjt jtv
Surf Surf≤∑This agricultural land constraint may be defined for various sets of products v so that the Surf and Surf may have different meanings: the land constraint may be defined for the cropland area, for the pastureland area or for the total agricultural land area for instance, or for all other sets of products. In GlobAgri-AgT, because of the lack of data regarding the maximum pastureland area in each region, we defined the agricultural land constraint on the cropland area. Hence Surfvjt is the cultivated area devoted to crop product v in region j during year t and Surfjt is the maximum cultivable area in region j in year t. Let’s emphasize at this stage that defining the land constraint on the cropland area has important implications since it means that pastureland may adjust freely to all the shocks introduced into the model. This is one important limit of our Agrimonde-Terra quantitative analysis. This limit does not result from the GlobAgri-AgT model since the latter can very easily deal with other levels of agricultural land constraints. It results
34
LAND USE AND FOOD SECURITY IN 2050
from the lack of data on potential maximum areas which could be shifted to permanent pasture in each region.
Finally, as in the balance equations the domestic production of each crop v in each region j is linked to the harvested area and the per-hectare yield of corresponding products and regions, we need an additional equation linking the harvested area to the cultivated area for each crop in each region:
vjt jt vjtv v
Surf e * A=∑ ∑( )
Where ejt measures the ratio of total cultivated area over total harvested area in region j for year t. This ratio is lower than one when the cultivated area is lower than the harvested area, indicating the extent of multi-cropping (or the level of cropping intensity) in the concerned region. In contrast, the cropping intensity coefficient is greater than one when the cultivated area is greater than the harvested area, indicating the extent of fallow land or of harvest abandonment due to difficult climatic, economic or geopolitical conditions.
❚❚ Model solving
In the initial ’2010’ situation, domestic resources-utilizations and world trade are balanced for all products and the observed cropland area is lower or nearly equal to the maximum cultivable area in all regions.
Let’s assume that food consumption of product i increases in region j. According to our model specification, this increase is covered partly by rising imports and partly by expanding domestic production. This results in an expansion of cropland and, possibly, pastureland areas in region j. At this stage two situations may arise:
– Region j’s cropland area is still lower than region j’s maximum cultivable area, then the resolution of the model stops.
– Region j’s cropland area becomes greater than region j’s maximum cultivable area, then two stages are considered:
1. Region j’s exports are first evenly reduced (through equi-proportional decrease in its world export market shares σijt) until the domestic cropland area falls below the maxi-mum cultivable area. At this stage, the resolution of the model stops.
2. If, even with zero exports, region j still needs more cropland area than its maximum cultivable area, then region j starts increasing its imports (through increases in import dependence coefficients αijt). In other words, region j increases the share of its food needs which is covered by imports in order to reduce the required rise in domestic production and save some cropland area. As initial regional import dependence coefficients vary widely across products, we defined intervals of initial levels upon which the αijt coefficients are increased evenly, making it possible to differentiate the level of increase by band.
Therefore, in the last case, the world export market shares and import dependence coefficients of regions constrained by their maximum cultivable land area become endogenous.
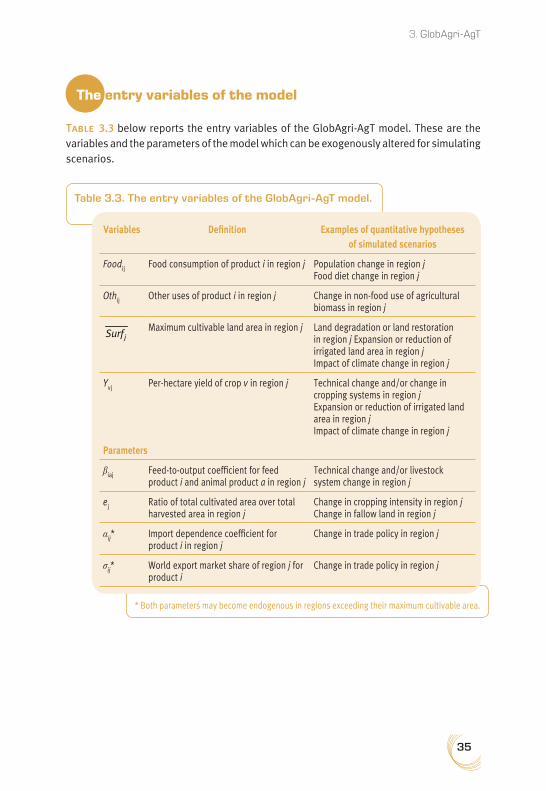
35
3. GlobAgri-AgT
The entry variables of the model
Table 3.3 below reports the entry variables of the GlobAgri-AgT model. These are the variables and the parameters of the model which can be exogenously altered for simulating scenarios.
* Both parameters may become endogenous in regions exceeding their maximum cultivable area.
Table 3.3. The entry variables of the GlobAgri-AgT model.
Variables Definition Examples of quantitative hypotheses of simulated scenarios
Foodij Food consumption of product i in region j Population change in region j Food diet change in region j
Othij Other uses of product i in region j Change in non-food use of agricultural biomass in region j
jSurf
Maximum cultivable land area in region j Land degradation or land restoration in region j Expansion or reduction of irrigated land area in region j Impact of climate change in region j
Yvj Per-hectare yield of crop v in region j Technical change and/or change in cropping systems in region j Expansion or reduction of irrigated land area in region j Impact of climate change in region j
Parameters
βiaj Feed-to-output coefficient for feed product i and animal product a in region j
Technical change and/or livestock system change in region j
ej Ratio of total cultivated area over total harvested area in region j
Change in cropping intensity in region j Change in fallow land in region j
αij* Import dependence coefficient for product i in region j
Change in trade policy in region j
σij* World export market share of region j for product i
Change in trade policy in region j
36
LAND USE AND FOOD SECURITY IN 2050
Conclusion
GlobAgri-AgT is a biomass balance model accounting for physical flows under physical constraints. It is thus different from a market and trade economic model relying on economic behaviors of agents and functioning with prices. It is obvious that our model is more rigid and implies less smooth adjustments than an economic model, due to the fact that we have no prices, which absorb part of the needed adjustment in an economic model, and no substitution possibilities between products, which contribute to smooth the needed adjustment across products in an economic model.
Despite the limits of a biomass balance model such as GlobAgri-AgT, we chose this kind of model for tractability and simplicity reasons. First of all, in a biomass balance model, many variables are exogenous, thus implementing long-term scenarios in this type of tool is rather easy. This is not the case with market and trade economic models, in which most of the variables are endogenous (especially in computable general equilibrium models). For example, in the case of long-term changes in food diets, the modeler can directly introduce alternative future diets into the biomass balance model (through shocks on the food quantities of the various products) while with a market and trade model this is not possible since the food quantities are endogenous. In the latter case, the modeler can only indirectly implement the long-term changes in food diets through shocks on consumers’ income and preferences. Secondly, the use of a biomass balance model seemed more appropriate for this present exercise. It appeared like a simpler, a more transparent, and above all a better pedagogic tool compared to economic models, making discussions about the results and their main insights easier across economists and non-economists and across scientists and other stakeholders.

37
4. Land-use Change Trajectories in Existing Scenario StudiesChantal Le Mouël and Agneta Forslund
Introduction
Land use and land-use change have become core issues in the debate on the future of agricultural and food systems around the world. On the one hand, the world will be facing a growing food demand in the coming decades, following the expected increase in both world population and income per capita. Historically, increased global food needs were met by an expansion in the agricultural area and increased agricultural productivity through the intensification of production systems. Such historical adjustments of agricultural land area and yields have been thrown into question since they are detrimental to the environment. On the other hand, agriculture is acknowledged as a significant lever for climate change mitigation, through bioenergy production and through the close relationship between land use and land-use change and greenhouse gas (GHG) emissions. In both cases, promoting mitigation strategies could likely challenge agriculture’s food production objective.
Because the future of agricultural and food systems is closely related to the future of climate change and because land-use change is a key factor in the food-climate nexus, scenario studies dealing with the future of agricultural and food systems from a food security perspective, a climate change perspective or both, are increasing their emphasis on the future of land use and on land-use change trajectories.
The objective of this chapter is to review the prospects on land-use change at world and regional scales provided by these scenario studies. Convergences and divergences in hypotheses and results across the studies are also identified in order to draw out the major remaining uncertainties and the major issues that deserve further work.
The rest of the chapter is organized as follows. We first report on the prospects on land-use change from selected scenario studies. Then, we describe the main hypotheses underlying land-use change results, which may, at least partly, explain the discrepancies across scenario studies. Finally, we provide an overview of estimates of the land area that would be available for agriculture all over the planet, in order to check the consistency of land-use change results in selected scenario studies.
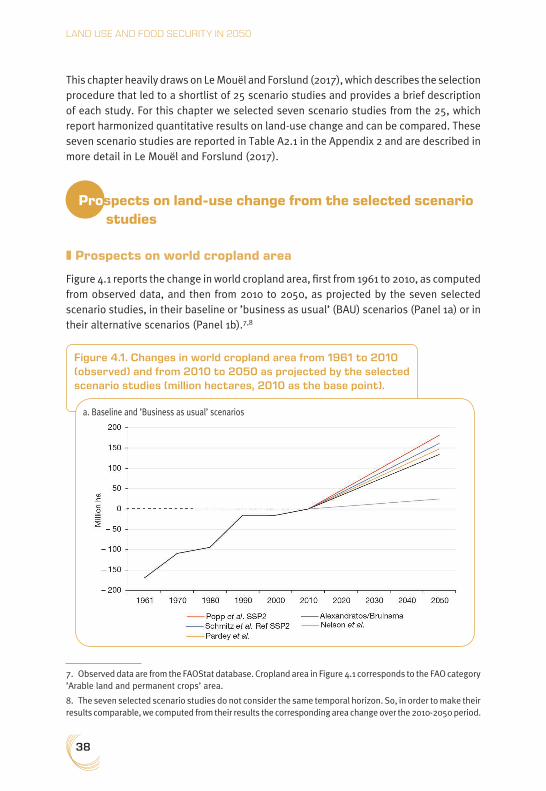
38
LAND USE AND FOOD SECURITY IN 2050
This chapter heavily draws on Le Mouël and Forslund (2017), which describes the selection procedure that led to a shortlist of 25 scenario studies and provides a brief description of each study. For this chapter we selected seven scenario studies from the 25, which report harmonized quantitative results on land-use change and can be compared. These seven scenario studies are reported in Table A2.1 in the Appendix 2 and are described in more detail in Le Mouël and Forslund (2017).
Prospects on land-use change from the selected scenario studies
❚❚ Prospects on world cropland area
Figure 4.1 reports the change in world cropland area, first from 1961 to 2010, as computed from observed data, and then from 2010 to 2050, as projected by the seven selected scenario studies, in their baseline or ’business as usual’ (BAU) scenarios (Panel 1a) or in their alternative scenarios (Panel 1b).7,8
7. Observed data are from the FAOStat database. Cropland area in Figure 4.1 corresponds to the FAO category ’Arable land and permanent crops’ area.
8. The seven selected scenario studies do not consider the same temporal horizon. So, in order to make their results comparable, we computed from their results the corresponding area change over the 2010-2050 period.
Figure 4.1. Changes in world cropland area from 1961 to 2010 (observed) and from 2010 to 2050 as projected by the selected scenario studies (million hectares, 2010 as the base point).
a. Baseline and ’Business as usual’ scenarios
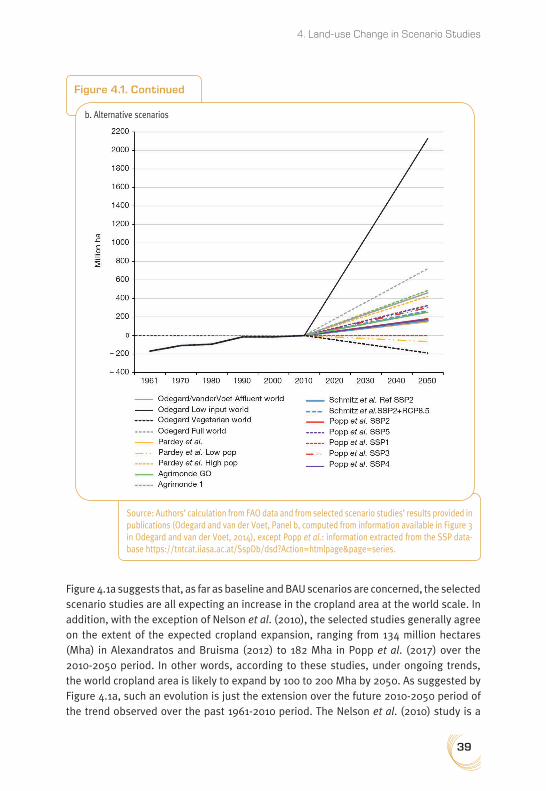
39
4. Land-use Change in Scenario Studies
Figure 4.1a suggests that, as far as baseline and BAU scenarios are concerned, the selected scenario studies are all expecting an increase in the cropland area at the world scale. In addition, with the exception of Nelson et al. (2010), the selected studies generally agree on the extent of the expected cropland expansion, ranging from 134 million hectares (Mha) in Alexandratos and Bruisma (2012) to 182 Mha in Popp et al. (2017) over the 2010-2050 period. In other words, according to these studies, under ongoing trends, the world cropland area is likely to expand by 100 to 200 Mha by 2050. As suggested by Figure 4.1a, such an evolution is just the extension over the future 2010-2050 period of the trend observed over the past 1961-2010 period. The Nelson et al. (2010) study is a
Figure 4.1. Continued
Source: Authors’ calculation from FAO data and from selected scenario studies’ results provided in publications (Odegard and van der Voet, Panel b, computed from information available in Figure 3 in Odegard and van der Voet, 2014), except Popp et al.: information extracted from the SSP data-base https://tntcat.iiasa.ac.at/SspDb/dsd?Action=htmlpage&page=series.
b. Alternative scenarios
40
LAND USE AND FOOD SECURITY IN 2050
notable exception since it is the only one expecting a significant decrease in the future growth rate of world cropland area relative to the one observed over the past, leading to a much more limited 25 Mha world cropland expansion up to 2050.
When enlarging the analysis to more contrasted scenarios, future trajectories of changes in cropland area at the world scale, as projected by our selected studies, are logically more differentiated (Figure 4.1b). Indeed, the alternative scenarios considered in these studies involve contrasted hypotheses for the future of the main drivers of world agricultural and food systems. These are world population, income per capita and/or food diets, and non-food demand for bioenergy production on the demand side; climate change, crop yields and livestock productivity on the supply side; and world market integration or fragmentation on the trade side. It is therefore not surprising that the change induced in the world cropland area by 2050 differs quite widely according to the study or scenario.
In Pardey et al. (2014), scenarios are differentiated according only to demographic changes. As the extent of the increase in world population directly affects the extent of the world’s food needs, Pardey et al.’s ’High population’ scenario requires more cropland at the world level than their baseline scenario (+423 Mha versus +148 Mha, respectively). The reverse effect is observed following their ’Low population’ scenario, which leads to a slightly declining world cropland area from 2010 to 2050 (–66 Mha).
There is only one other scenario inducing a decrease in world cropland area by 2050: the ’Vegetarian world’ in the Odegard and van der Voet (2014) study. This scenario relies on a specific hypothesis for the future of food diets: it involves a shift in diets all over the world towards a limited share of animal-based foods (9%). This share is significantly smaller than the levels currently observed in Western-like food diets and corresponds roughly to the levels currently observed in food diets with a low reliance on animal-based foods, such as diets in North Africa, Near and Middle East, India and sub-Saharan Africa. According to Odegard and van der Voet (2014), this scenario would imply a –190 Mha decline in the world cropland area from 2010 to 2050. It is worth noting that in our seven selected studies, scenarios built on future food diets involving lower levels of energy intake and/or of animal-based foods (as a world average) tend to use less cropland at the world level (see, for example, the SSP1 scenario in Popp et al., 2017, which leads to a stable world cropland area up to 2050).
Besides the scenarios mentioned above, all the others in our selected studies induce an increase in the world’s cropland area from 2010 to 2050, with a maximum increase of more than 2,000 Mha in Odegard and van der Voet’s (2014) ’Low input world’. As suggested by Figure 4.1b, this ’Low input world’ may appear as an outlier since all the upper-range results in other studies lie well below this, at around 400 to 700 Mha. So, ignoring this ’Low input world’ scenario, the expectations of the reported scenarios range from zero to 723 Mha (’Full world’ in Odegard and van der Voet, 2014) of additional cropland at the global scale.
Of course, discrepancies across studies can be explained, at least partly, by differentiated hypotheses involved in their scenarios, whether that be on the demand, supply or trade side (see below).
41
4. Land-use Change in Scenario Studies
❚❚ Prospects on world pastureland area
As emphasized by Le Mouël and Forslund (2017), few scenario studies provide information on the induced impacts of their scenarios on world and regional pastureland areas. This is confirmed by Figure 4.2, which indicates that among our seven selected studies only two report on changes in the world pastureland area up to 2050.9
Both studies propose one scenario involving driving forces towards more sustainable agricultural and food systems: Agrimonde 1 in Paillard et al. (2010) and SSP1 in Popp et al. (2017). In both scenarios, these driving forces involve a smaller share of animal products in food diets in developed regions, and reduced food wastage at household and retail levels all over the world. As shown by Figure 4.2, these two scenarios are also the ones implying a decrease in world pastureland area over the 2010-2050 period: –428 Mha in Agrimonde 1 and –344 Mha in SSP1.
Other scenarios, which are more in line with current trends in world agricultural and food systems, especially in world food diets, lean towards an increase in world pastureland area, the rise ranging from +54 Mha in Agrimonde GO (Paillard et al., 2010) to +208 Mha in SSP4 (Popp et al., 2017). The SSP5 in Popp et al. (2017) is an exception, however, since although involving a hypothesis about the Westernization of world food diets (implying increasing levels of both energy intake and share of animal products, at least in developing regions) like the other scenarios mentioned above, it involves a reduced world pastureland area by 2050 (–157 Mha). As we will see later, the hypothesis on high crop yield growth and the probably optimistic hypothesis on productivity improvements in livestock systems in scenario SSP5 could likely explain this result.
❚❚ Prospects on regional agricultural land areas
Figures 4.1 and 4.2 deal with changes in cropland and pastureland areas for the world as a whole. They hide the differentiated trajectories of cropland and pastureland areas that can be obtained from the scenarios for the various world regions under consideration.
Taking Figure 4.1a, the baseline or BAU scenarios of our selected studies all expect an increasing world cropland area up to 2050. In all these scenarios, cropland expansion mainly arises in sub-Saharan Africa and Latin America and the expansion in both zones exceeds the expected decline in some other regions (most often developed regions).
The same picture arises from scenarios reported in Figure 4.1.b. In scenarios leading to an overall increase in the world’s cropland area, the expected expansion, mainly in sub-Saharan Africa and Latin America, overcomes the expected decline in some other regions (mainly in developed regions). In scenarios implying an overall reduction in the
9. In Figure 4.2, data from 1961 to 2010 are observed data extracted from the FAOStat database. Pastureland area in Figure 4.2 corresponds to the FAO category ’Permanent meadows and pastures’ area. As in Figure 4.1, as the two studies do not consider the same temporal horizon, the corresponding change in area over the 2010-2050 period has been computed from their results.

42
LAND USE AND FOOD SECURITY IN 2050
world’s cropland area, the expected expansion, still mainly arising in sub-Saharan Africa and Latin America, is more than outweighed by the expected decline in some other regions (most often developed regions but also Asian regions in some scenarios).
Regarding changes in pastureland area, once again when scenarios lead to an overall expansion at the world level, expansion arises mainly in sub-Saharan Africa and, to a lesser extent, in Latin America, while in most other regions the pastureland area either
Figure 4.2. Changes in world pastureland area from 1961 to 2010 (observed) and from 2010 to 2050 as projected by the selected scenario studies (million hectares, 2010 as the base point).
Source: Authors’ calculation from FAO data and from selected scenario studies’ results provided in publications, except Popp et al.: information extracted from the SSP database https://tntcat.iiasa.ac.at/SspDb/dsd?Action=htmlpage&page=series.
43
4. Land-use Change in Scenario Studies
declines slightly or remains stable until 2050. However, in scenarios leading to an overall reduction in the world pastureland area, the area often decreases in most regions.
Main hypotheses driving the land-use change results of the selected scenario studies
In each scenario study, alternative scenarios combine different hypotheses for the future of the main drivers of world agricultural and food systems. Hence, in each scenario study, these differentiated hypotheses for the future explain the differences in land-use change impacts of the scenarios. When considering together several selected studies, the discrepancies in land-use change impacts of the various scenarios are still partly explained by differentiated hypotheses for the future of drivers but also by the data and models used, which are different across and, in some cases, even within, studies (for example, Schmitz et al., 2014, and Popp et al., 2017).10
The hypotheses involved in the various scenarios of our seven selected studies are reported in detail in Le Mouël and Forslund (2017). In this chapter, we only attempt to shed a little light on the role of some major hypotheses involved regarding the range and discrepancies of land-use change results across scenarios and studies.
❚❚ Baseline and BAU scenarios
In baseline and BAU scenarios, as reported in Figure 4.1a, the population is usually expected to increase according to the medium variant of the United Nations (UN) projections, meaning a world population reaching 9.1 to 9.5 billion in 2050 depending on the study in question. All these scenarios are expecting continuing trends in the evolution of food diets, meaning a convergence of food diets towards Western-type diets all over the world, implying increasing energy intakes, rising shares of animal products, vegetable oils and sugar and sweeteners, and decreasing shares of staples such as cereals and roots and tubers. In all scenarios, these trends are expected to be significantly more marked in developing regions than in developed ones, where food diets would remain rather stable. In all these scenarios, changes in population and in food diets drive up food needs until 2050 at the world level and for most world regions. Baseline and BAU scenarios also consider the additional expected need for biomass for non-food purposes (mostly biofuels in our selected studies), even if, as pointed out in Le Mouël and Forslund (2017), the selected studies do not provide detailed quantitative information on their hypotheses in this regard.
Globally, baseline and BAU scenarios agree on increasing world food and non-food needs up to 2050, to be covered by rising agricultural production at the world level. According to
10. On this point see, for example, von Lampe et al. (2014).

44
LAND USE AND FOOD SECURITY IN 2050
these scenarios, crop yields would continue to increase all over the world, though more slowly than in previous decades, mainly due to the expected negative effects of continuing trends in climate change. Livestock productivity would also continue to improve. However, as suggested by Figure 4.1a, the expected improved performance of agriculture all over the world would not be sufficient and, according to all reported baseline and BAU scenarios, cropland expansion at the world level would be necessary to reach the required increase in world agricultural production.
As shown by Figure 4.1a, differences in the extent of the expansion of world cropland area according to these studies are not so significant, except for the Nelson et al. (2010) study, which results in a significantly smaller cropland expansion. These differences arise from both the hypotheses involved in scenarios, but also from the data and models used. Indeed, even if all baseline and BAU scenarios consider qualitatively similar hypotheses for the future of the various drivers of the world agricultural and food systems, these studies do not adopt the same quantitative translation of such hypotheses. One key element in this regard is the expected economic growth rate, both the world average and for the different regions, adopted by the various studies. As indicated in Le Mouël and Forslund (2017), baseline and BAU scenarios in the selected studies consider differentiated economic growth rates both at the world level and for the various regions. As hypotheses for the future on food diet changes and on technical progress (i.e., expected crop yields and livestock productivity) are either implicitly or explicitly, closely related to the expected economic growth in scenarios, this is likely to result in different expected food diets as well as crop yield and livestock productivity levels up to 2050 in the various studies. In addition, as economic growth rates and market liberalization are closely interrelated in scenarios, this may also be a cause of discrepancies in the results across studies.11 Finally, economic growth may also be closely related to the future of climate change in scenarios, which may also result in differentiated hypotheses for the future of agriculture’s productive performance all over the world.
The other source of discrepancies in the results across the studies lies in the different data and models they use. Indeed, because the data and models used are different across studies, the simulation of the baseline or BAU scenario in each of them does not result in the same sharing of the required adjustments between prices and quantities. In other words, even if quantitative hypotheses involved in the scenarios were exactly the same in all studies, the results for land-use change would differ across studies, as would the results for price changes (of agricultural products and of land), when included in these studies.12
11. Further market liberalization makes it possible in economic models such as the ones used in these studies, to deepen comparative advantages so less cropland is needed at the world level for a given level of agricultural production.
12. Le Mouël and Forslund (2017) for more details in this regard.

45
4. Land-use Change in Scenario Studies
❚❚ Alternative scenarios
Contrary to the baseline and BAU scenarios, alternative scenarios in our selected studies (Figures 4.1b and 4.2) consider contrasted hypotheses for the future of the drivers of world agricultural and food systems. This explains the wider range of results obtained, in terms of both cropland and pastureland trajectories to 2050.
Let’s consider first the Pardey et al. (2014) study. The three scenarios proposed involve contrasted hypotheses for the future of world and regional population. So, comparing the results for world changes in cropland area for these scenarios gives an indication of the sensitivity of the future trajectory of world cropland to demography: from –66 Mha for low population to +423 Mha for high population, as compared to +148 Mha for the baseline, over the period 2010-2050.
Turning to the Schmitz et al. (2014) study, two scenarios are considered, differentiated according to the hypothesis for the future of climate change. The ’Reference-SSP2’ scenario extends to 2050 the ongoing trends in climate change, while the ’Reference-SSP2-RCP8.5’ scenario considers a hypothesis of more rapid climate warming (as proposed by the IPCC through its most extreme climate change pathway, RCP8.5). Therefore, comparing the results in world cropland changes of both scenarios provides an indication of the sensitivity of the future trajectory of world cropland to climate change: from +161 Mha with ongoing trends to +266 Mha with more rapid climate warming, over the period 2010-2050. In terms of world average, the rapid climate warming pathway is likely to negatively affect growth in crop yields, so more cropland is necessary to cover world food and non-food needs in 2050.
In all the other selected studies, one can find one scenario involving especially optimistic hypotheses on economic growth, which comes with significant further liberalization of world markets (conventional development hypothesis). These are scenario ’SSP5’ in Popp et al. (2017), scenario ’Agrimonde GO’ in Paillard et al. (2010) and scenario ’Affluent world’ in Odegard and van der Voet (2014). In all these scenarios, the optimistic economic growth and further liberalized markets lead to a rapid Westernization of food diets (implying higher food needs in 2050) and rapid technological progress (implying higher crop yields and more productive livestock systems in 2050). As shown in Figure 4.1b, such scenarios tend to use more cropland at the global scale compared to the previous baseline and BAU scenarios. As regards pastureland area however, results are more ambiguous: while ’Agrimonde GO’ would involve an additional 54 Mha of world pastureland area from 2010 to 2050, ’SSP5’ would require 153 Mha less pastureland area at the global scale over the same period. Even if information in this regard is scarce in both studies, this discrepancy could result from the differentiated hypotheses adopted on the future of livestock productivity on the one hand, and on the extent of substitution in food diets between ruminant meat and pork and poultry meat on the other.
The same studies also offer one scenario involving driving forces towards more sustainable world agricultural and food systems (sustainable development hypothesis): ’SSP1’ scenario in Popp et al. (2017), ’Agrimonde 1’ scenario in Paillard et al. (2010) and ’Vegetarian world’
46
LAND USE AND FOOD SECURITY IN 2050
scenario in Odegard and van der Voet (2014). In these scenarios, world food needs increase less rapidly to 2050 since food diets are evolving towards healthier diets, which are less energy-rich (as a world average and, at least, for developed regions) and less animal-rich (as a world average and for developed and some emerging regions), while food wastage is reduced all over the world. With the exception of ’Agrimonde 1’, such scenarios are among those using the least cropland and lead to a stable (’SSP1’) or decreased (–190 Mha in ’Vegetarian world’) world cropland area between 2010 and 2050. Such scenarios also use the least pastureland and involve a reduced world pastureland area over the period 2010-2050 (–344 Mha in ’SSP1’, –428 Mha in ’Agrimonde 1’).
In terms of the world cropland area, the result in the ’Agrimonde 1’ scenario deserves further investigation since despite the induced lower increase in world food needs, it still leads to a significant area expansion (+486 Mha over the period 2010-2050). The main reason for this result probably lies in the hypothesis for the future of cropping systems adopted in ’Agrimonde 1’. Indeed, this scenario assumes that the driving forces towards higher sustainability would lead to a shift towards agroecological cropping systems, which would supposedly result in a significant reduction in the world’s average growth in crop yields. Odegard and van der Voet (2014) propose a very similar assumption in the ’Low-input world’ scenario where the focus is on sustainability and cropping systems shift towards low-input systems.13 As shown by Figure 4.1b, both scenarios are among those using the most cropland. This result points out the high sensitivity of future cropland trajectories to the evolution of cropping systems and highlights the complexity of finding a path to more sustainable agricultural and food systems.
Finally, both Popp et al. (2017) and Odegard and van der Voet (2014) envisage one scenario with the fragmentation of world markets as a main driving force: ’SSP3’ scenario in Popp et al. (2017) and ’Full world’ scenario in Odegard and van der Voet (2014). In these scenarios, both economic growth and technological progress are rather slow. Therefore, both the small increase in agricultural productivity and rising trade barriers contribute to increasing the world cropland and pastureland areas required to cover food and non-food needs by 2050. Indeed, in each study ’SSP3’ and ’Full world’ are among the scenarios using the most cropland worldwide (Figure 4.1b). ’SSP3’ is among the Popp et al. (2017) scenarios using the most pastureland (Figure 4.2). This result emphasizes the key role of world trade in future land-use change trajectories.
As already mentioned, one source of differences in the land-use change impacts of scenarios lies in the different models used. The fact that in some of our selected scenario studies (namely, Agrimonde, Odegard and van der Voet, 2014, and Pardey et al., 2014), the models used are not economic models involving price equilibrium mechanisms should
13. In addition, the ’Low-input world’ scenario in Odegard and van der Voet (2014) assumes fragmented world markets implying no trade between the world regions under consideration. This is certainly one cause explaining the particularly large expansion in the world’s cropland area induced by the ’Low-input world’ scenario compared to Agrimonde 1 as well as to all other reported scenarios.

47
4. Land-use Change in Scenario Studies
be underlined. Price adjustment mechanisms clearly contribute to smooth adjustments in the quantities needed (including cropland and pastureland areas: when food demand increases, product prices adjust up, making food supply rise as well as demand for agricultural land and finally land prices; because of these food and land price adjustments, food consumption and production quantities as well as land areas finally need to adjust less than if prices had remained constant). Therefore, it is not so surprising that these scenario studies using non-economic models are also those exhibiting the largest land-use change impacts following their various scenarios. Obviously, one must remain cautious though since we cannot measure exactly in these land-use change impacts what is due to the hypotheses involved in scenarios and what is due to the type of model used.
Estimates of available land for agriculture at the world level
There are two main databases providing data on current land use for the whole planet at various geographic levels (agro-ecological zones, countries, large regions and the world): FAOStat and the SAGE database (Center for Sustainability And the Global Environment, University of Wisconsin). There are also two databases providing data on the agricultural potential of land all over the world: the GAEZ database (Global Agro-Ecological Zones, International Institute for Applied Systems Analysis, IIASA, Vienna, and FAO) and the above mentioned SAGE database. These databases have been used in a number of studies dealing with land-use change for food security and/or for climate change purposes. One key question in such studies is how much land is currently used for agriculture all over the world and how much additional land could be converted to agriculture.
In the following, we use some of these studies, namely Ramankutty et al. (2008), Erb et al. (2009), Fischer et al. (2011), Lambin and Meyfroidt (2011) and Bajzelj et al. (2014) to provide an evaluation of current land reserves, both globally and in various world regions, that would be suitable for agriculture. We also use Roudart’s 2010 analysis, which provides a detailed comparison of the three databases mentioned above and of their results regarding current land use and agricultural potential of land all over the world. Finally, we add the data on land use and the agricultural potential of land that we extracted from the FAOStat and GAEZ databases for the Agrimonde-Terra foresight study, in order to compare the data we used with the data used in existing literature.14
❚❚ How much land is already used by agriculture around the world?
Land used by agriculture comprises cropland (or arable land and permanent crops area according to the FAOStat definition)15 and pastureland (or permanent meadows and
14. These data are part of the GlobAgri-AgT database. See Chapter 3 for more details.
15. We also use the term ’cultivated land’ for this category.

48
LAND USE AND FOOD SECURITY IN 2050
pastures land area according to the FAOStat definition). While the first category is well defined, uniformly named and rather homogenous across studies, the second is more complex, making its manipulation more delicate for comparison purposes. Indeed, the definition of pasture is not clear and is subject to uncertainty. There are many different types of meadows and pastures (cultivated and natural, from poorly productive savannah grassland or rangelands through to highly productive meadows in Western Europe, for example). Consequently, there are many different ways to classify them either as pastureland or in other land-use categories (for example, is grazing in a semi-arid area reported as pastureland or natural land in global databases? Is grazing underneath forest trees reported as pastureland or forest land?). This complexity in defining pastureland is confirmed by the many different terms used in studies to name it: permanent meadows and pasture (FAOStat), pasture land (Ramankutty et al., 2008; Lambin and Meyfroidt, 2011; Bajzelj et al., 2014), grazing land (Erb et al., 2009), and grass and wood land (Fischer et al., 2011).
It therefore comes as no surprise that while the studies under consideration more or less agree on the world cropland area currently used, their assessments of the world pastureland area show significant discrepancies. As suggested by Table 4.1, all studies converge on approximately 1,500 Mha of cropland used across the planet over the past decade (estimates are for 2000, 2007-09 or 2009 depending on the study). However, as far as pastureland area is concerned, estimates become more divergent. They range from 2,810 Mha in 2000 according to Ramankutty et al. (2008) to 4,688 Mha in 2000
Source: extracted from publications and from the FAOStat database.Note: n.a. = not available. Ramankutty et al. (2008): data for 2000 issued from the SAGE database; Bajzelj et al. (2014): data for 2009 based on Ramankutty et al. (2008) and FAO (2010), category ’Other uses’ covering ’Natural land’ and ’Built-up’; FAOStat: average data for 2007-2009 as used in the GlobAgri-AgT database; Fischer et al. (2011): data for 2000 based on GAEZ data and various other sources, ’Other uses’ category covering ’Sparsely vegetated and barren land’ and ’Settlement and infrastructure’; Erb et al. (2009): data for 2000 based on Erb et al. (2007), ’Other uses’ cate-gory covering ’Non-productive land’, ’Unused productive land’ and ’Infrastructure’.
Table 4.1. Land use at the global scale according to the studies considered (Million hectares).
Study Cropland Pastureland Forestry Other (incl. Infrastructure)
Total
Ramankutty et al. (2008) 1,500 2,812 n.a. n.a. n.a.
Bajzelj et al. (2014) 1,563 2,810 2,730 5,930 (110) 13,033
FAOStat 1,535 3,373 4,044 4,067 13,019
Fisher et al. (2011) 1,559 4,612 3,736 3,141 (152) 13,049
Erb et al. (2009) 1,523 4,688 3,496 3,391 (136) 13,038

49
4. Land-use Change in Scenario Studies
according to Erb et al. (2009), and from 2,812 Mha in 2009 according to Bajzelj et al. (2014) to 3,373 Mha in 2007-09 according to FAOStat. It is worth noting that, as suggested by Table 4.1, some areas accounted for as ’pastureland’ in Erb et al. (2009) and Fischer et al. (2011) are reported as forest land and/or other land in FAOStat or as natural land in Bajzelj et al. (2014).
Bajzelj et al. (2014) use the estimate of the world pastureland area provided by Ramankutty et al. (2008). As Ramankutty et al. (2008) explain, their final predicted world pastureland area is significantly lower than FAOStat data, mainly because their estimates for some countries are significantly lower than the pastureland area reported by these countries in their national census and/or in FAO statistics. The largest difference is found in China (400 Mha pasture reported in national statistics versus 290 Mha predicted by Ramankutty et al.), followed by Australia (320 Mha reported versus 270 Mha predicted) and Mongolia (130 Mha reported versus 90 Mha predicted). Ramankutty et al. (2008) emphasize that these three countries have large amounts of semi-arid land, which may be grazed or not depending on annual climate conditions, and consequently be reported as pastureland or other land according to the various databases.
The world pastureland estimate provided by Fisher et al. (2011) is 1,239 Mha higher than FAOStat data and 1,800 Mha higher than Ramankuttty et al.’s estimate. One explanation is that the definition of pastureland adopted by Fischer et al. (2011) is broader than the one used in both other studies. First, Fischer et al.’s pastureland category includes woodland ecosystems and second, it can be seen from Table 4.1 that compared to FAOStat data, over the additional 1,239 Mha of pastureland area in Fischer et al. (2011), 308 Mha are reported as forest land and 926 Mha are reported as land for other uses in FAOStat. The same conclusion can be drawn when dealing with the Erb et al. (2009) world pastureland estimate, which is very close to that of Fischer et al. (2011).
Finally, according to the existing literature, around 12% of the global land area is currently devoted to crops (annual and permanent) and from 20 to 35%, depending on the study, is currently used as pasture. Hence, depending on the study, agriculture currently uses from less than 35% to more than 47% of the global land area. The GlobAgri-AgT database includes the FAOStat data on land use, computed as a 2007-2009 average. Therefore, for Agrimonde-Terra we consider that cropland currently accounts for 12% of the total world land area and pastureland for 26%. Thus, 38% of the global land area is used for agriculture.
❚❚ How much productive land around the world?
Having assessed the current extent of agricultural land across the planet, the second important question is how much land could be used at most for agriculture all over the world? The GAEZ approach offers a method for assessing land’s suitability for agricultural production following a series of steps. First, the land resource is characterized (for each AEZ, at the grid cell level) through the components of climate, soil, landform and current land cover. Then, the potential agro-climatic yield and the maximum attainable
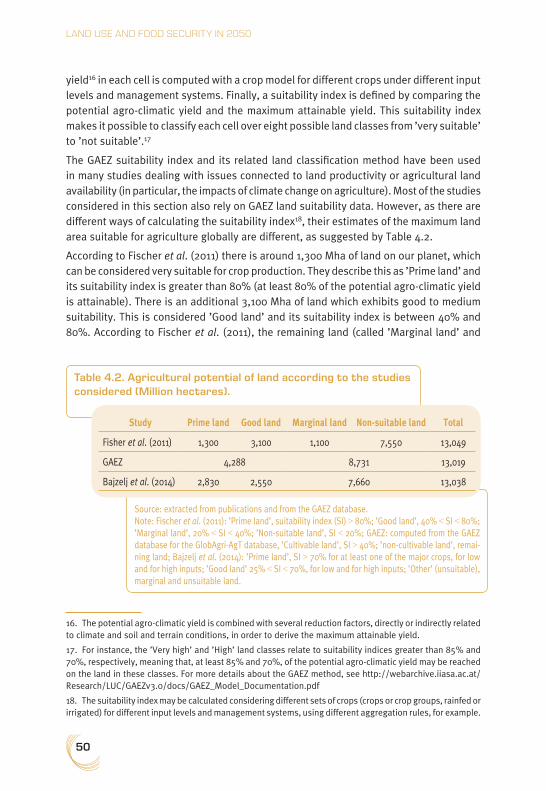
50
LAND USE AND FOOD SECURITY IN 2050
yield16 in each cell is computed with a crop model for different crops under different input levels and management systems. Finally, a suitability index is defined by comparing the potential agro-climatic yield and the maximum attainable yield. This suitability index makes it possible to classify each cell over eight possible land classes from ’very suitable’ to ’not suitable’.17 The GAEZ suitability index and its related land classification method have been used in many studies dealing with issues connected to land productivity or agricultural land availability (in particular, the impacts of climate change on agriculture). Most of the studies considered in this section also rely on GAEZ land suitability data. However, as there are different ways of calculating the suitability index18, their estimates of the maximum land area suitable for agriculture globally are different, as suggested by Table 4.2.
According to Fischer et al. (2011) there is around 1,300 Mha of land on our planet, which can be considered very suitable for crop production. They describe this as ’Prime land’ and its suitability index is greater than 80% (at least 80% of the potential agro-climatic yield is attainable). There is an additional 3,100 Mha of land which exhibits good to medium suitability. This is considered ’Good land’ and its suitability index is between 40% and 80%. According to Fischer et al. (2011), the remaining land (called ’Marginal land’ and
16. The potential agro-climatic yield is combined with several reduction factors, directly or indirectly related to climate and soil and terrain conditions, in order to derive the maximum attainable yield.
17. For instance, the ’Very high’ and ’High’ land classes relate to suitability indices greater than 85% and 70%, respectively, meaning that, at least 85% and 70%, of the potential agro-climatic yield may be reached on the land in these classes. For more details about the GAEZ method, see http://webarchive.iiasa.ac.at/Research/LUC/GAEZv3.0/docs/GAEZ_Model_Documentation.pdf
18. The suitability index may be calculated considering different sets of crops (crops or crop groups, rainfed or irrigated) for different input levels and management systems, using different aggregation rules, for example.
Source: extracted from publications and from the GAEZ database.Note: Fischer et al. (2011): ’Prime land’, suitability index (SI) > 80%; ’Good land’, 40% < SI < 80%; ’Marginal land’, 20% < SI < 40%; ’Non-suitable land’, SI < 20%; GAEZ: computed from the GAEZ database for the GlobAgri-AgT database, ’Cultivable land’, SI > 40%; ’non-cultivable land’, remai-ning land; Bajzelj et al. (2014): ’Prime land’, SI > 70% for at least one of the major crops, for low and for high inputs; ’Good land’ 25% < SI < 70%, for low and for high inputs; ’Other’ (unsuitable), marginal and unsuitable land.
Table 4.2. Agricultural potential of land according to the studies considered (Million hectares).
Study Prime land Good land Marginal land Non-suitable land Total
Fisher et al. (2011) 1,300 3,100 1,100 7,550 13,049
GAEZ 4,288 8,731 13,019
Bajzelj et al. (2014) 2,830 2,550 7,660 13,038

51
4. Land-use Change in Scenario Studies
’Non-suitable land’) is not suitable for crop production.19 Therefore, according to Fischer et al. (2011), there is around 4,400 Mha of land which is suitable for crop production across the world.
Bajzelj et al. (2014) also rely on the GAEZ method and data, and also use the ’Prime land’ and ’Good land’ classes. However, as shown by Table 4.2, these land classes mean different things in the two studies. Indeed, the definition of ’Prime land’ and ’Good land’ is different in Bajzelj et al. (2014): it is significantly more flexible for ’Prime land’ and stricter for ’Good land’ (Table 4.2 notes). According to Bajzelj et al. (2014), our planet would benefit from 2,830 Mha of ’Prime land’, more than double Fischer et al.’s estimate. This would leave 2,550 Mha of ’Good land’ and, in total, 5,380 Mha of land would be suitable for crop production across the planet. This means there is a difference of nearly 1,000 Mha between the estimates of Fischer et al. and Bajzelj et al. on the area suitable for crop production, which is far from negligible. This corresponds roughly to the so-called ’Marginal land’ in Fischer et al. (2011). Hence, one explanation of the discrepancy between the studies is that the method adopted by Bajzelj et al. to compute the suitability indices and to classify land leads them to consider ’Marginal land’ as suitable for crop production while Fischer et al. exclude this land type from land suitable for crop production.
In Agrimonde-Terra, we also use the GAEZ approach and data and we chose to consider the land with a suitability index greater than 40% as the land suitable for crop production or as the maximum cultivable land area. As indicated in Table 4.2, this makes our estimate (4,288 Mha) very close to that of Fischer et al. (2011).
At this stage, it is still not possible to evaluate how much additional land could be converted to agriculture in the future. Indeed, land suitable for crop production is not restricted to crop production and may well be devoted to other uses. Both Fischer et al. (2011) and Bajzelj et al. (2014) also provide information on the distribution of land suitable for crop production (or agriculture) over the current land use, both globally and for various regions.
❚❚ How much productive land is available for agriculture?
As suggested in Table 4.3, Fischer et al. (2011) and Bajzelj et al. (2014) provide different patterns of current land-use distribution over land suitability classes. Unsurprisingly, this results in different estimates of land reserves for agriculture across the world.
Comparing Tables 4.1 and 4.2, we could conclude that globally the current world cropland area (around 1,500 Mha) is much smaller than the land considered suitable for crop production (4,288 to 5,380 Mha depending on the study), leaving large reserves of potential cropland for the future. Probably based on this logic, the first assessments of the world’s agricultural land reserves were rather optimistic. Roudart (2010), for example, states that
19. As we will see later, this does not mean that such land is not suitable for agriculture since some ’Marginal land’ could be used as pasture for instance.

52
LAND USE AND FOOD SECURITY IN 2050
in 2005, only 38% of the world’s cultivable land (i.e., suitable for crop production) is cultivated (specifically, 1,563 Mha of cropland compared to 4,152 Mha of cultivable land).
Looking at Table 4.3, we can see that these estimates could be even more optimistic since part of the land considered as not suitable for crop production by Fischer et al. (2001) and by Bajzelj et al. (2014) is already used for crop production. These areas amount to 300 Mha and 360 Mha respectively (on marginal or non-suitable land). This land should be added to the estimates of the world’s land area suitable for crop production in both studies. This would then rise to 4,700 Mha and 5,740 Mha respectively. Therefore, given that the current world cropland area is about 1,500 Mha, the world’s reserve of cultivable land would reach 3,200 Mha according to Fischer et al. (2011) and 4,240 Mha for Bajzelj et al. (2014). Both studies point out that most of this reserve is located in Latin America and sub-Saharan Africa.
However, some authors have started to challenge these early very optimistic estimates, arguing that it is somewhat misleading to consider areas already used for other purposes
Source: extracted from publications.Note: Fischer et al. (2011): data for 2000, ’Pasture’ category covering ’Grass and woodland’, ’Other uses’ category covering ’Sparsely vegetated and barren land’ and ’Settlement and infrastructure’; ’Prime land’, suitability index (SI) > 80%; ’Good land’, 40% < SI < 80%; ’Marginal land’, 20% < SI < 40%; ’Non-suitable land’, SI < 20%; Bajzelj et al. (2014): data for 2009, ’Other uses’ category covering ’Natural land’ and ’Built-up’; ’Prime land’, SI > 70% for at least one of the major crops, for low and for high inputs; ’Good land’ 25% < SI < 70%, for low and for high inputs; ’Other’ (unsuitable), marginal and unsuitable land.
Table 4.3. Land-use distribution over suitability classes (Million hectares).
Study Prime land Good land Marginal land Non-suitable land Total
Fisher et al. (2011)
Cropland 400 800 300 0 1,500
Pastureland 400 1,100 500 2,600 4,600
Forestry 500 1,100 300 1,800 3,700
Other 0 0 0 3,200 3,200
Total 1,300 3,100 1,100 7,550 13,050
Bajzelj et al. (2014)
Cropland 730 470 360 1,560
Pastureland 540 640 1,630 2,810
Forestry 660 540 1,540 2,740
Other Incl. Infrastructure
900 50
900 30
4,130 30
5,930 110
Total 2,830 2,550 7,660 13,040

53
4. Land-use Change in Scenario Studies
in the cultivable land reserve. This idea was already present in Roudart (2010), who suggested several estimates for the world’s reserve of cultivable land under different hypotheses, notably one excluding cultivable areas already under forest use. According to Table 4.3, adopting the same hypothesis would reduce the world’s reserve of cultivable land to 1,600 Mha for Fischer et al. (3,200 Mha reserve of cultivable land minus 1,600 Mha of cultivable land already under forest use) and to 2,640 Mha for Bajzelj et al. (4,240 Mha minus 1,600 Mha).
We could adopt the same logic regarding the cultivable land area already used for pasture, arguing that once the world’s cropland has expanded, at least part of current pastures would move on to land under forest or other uses. According to Table 4.3, adopting such a hypothesis would further reduce the world’s reserve of cultivable land to 100 Mha for Fischer et al. (1,600 Mha minus 1,500 Mha) and to 1,460 Mha for Bajzelj et al. (2,640 Mha minus 1,180 Mha). In other words, while for Fischer et al. (2011) an expansion of the world’s agricultural land (cropland and pastureland) would necessitate further deforestation, this could potentially be avoided in Bajzelj et al. (2014) since the expansion of agricultural land could take place on areas currently under other uses (called ’Natural land’ in Bajzelj et al.).
According to Erb et al. (2009), the global ’uncultivated productive land’ area would amount to 1,578 Mha in 2009. This figure is close to the global land reserve of cultivable land estimated above from Bajzelj et al.’s results. On the other hand, the alternative estimate provided by Lambin and Meyfroidt (2011) is closer to Fischer et al.’s results. Lambin and Meyfroidt state that estimates of the global land reserve (i.e., uncultivated productive land) “are often too optimistic as many of these areas are under natural forests, are already used as permanent pastures, are protected areas, include marginal lands, or are only suitable for a single crop (e.g., olive trees in Mediterranean drylands)” (Lambin and Meyfroidt, 2011, supporting information, p. 1). They use a high estimate of 445 Mha for the global land reserve based on the results of a World Bank report (Deininger et al., 2011), the latter using a study by Fischer and Shah (2010) built on GAEZ data.
At this stage, two conclusions are possible. First, if we assume that current cropland can expand on all the cultivable land available across the planet whatever its current use (except infrastructure), there is a large global land reserve: between 3,000 Mha and more than 4,000 Mha depending on the study, the majority of it in Latin America and sub-Saharan Africa. Conversely, however, if we assume that current cropland can expand only on the cultivable land which is not already under pasture, forest or infrastructure use, the global land reserve is much more limited: from 100 Mha to around 1,400 Mha depending on the study, the majority again in Latin America and sub-Saharan Africa.
Conclusion
In conclusion, we can compare the results of the scenario studies we have examined in terms of land-use trajectories and the estimates of the world’s reserve of cultivable land,

54
LAND USE AND FOOD SECURITY IN 2050
according to the existing literature. As far as baseline and BAU scenarios are concerned, it is worth noting that their anticipated expansion in the world’s cropland area by 2050 (ranging from +25 to +182 Mha, Figure 4.1a) fall into the range of the estimates of the world’s reserve of cultivable land, even the more restrictive ones (100 to 1,400 Mha).
However, the conclusions are more ambiguous when we consider the alternative scenarios in these studies. Given their anticipated expansion in the world’s cropland, ranging from +175 Mha (SSP4) to +486 Mha (Agrimonde 1), +723 Mha (’Full world’) and +2,130 Mha (’Low-input world’, Odegard and van der Voet), it is clear that the compatibility of these cropland increases with global land reserves depends crucially on the hypothesis used for estimating these reserves. Considering the most restrictive estimates of global maximum cultivable land, it is clear that some scenarios would not be sustainable, as they would involve further deforestation.

55
5. Retrospective Overview of Land Uses at Global Level and by World RegionsMarie de Lattre-Gasquet, Marco Barzman, Pauline Marty and Clémence Moreau20,21
Introduction
The foresight process integrates the long-term dimension, past and future. In this chapter we concentrate on the past dimension and present a rapid review of the evolution of the five dimensions of land use between 1960 and the early 2010s, at both a global level and for six world regions. Describing past trends and breaks in the five dimensions of land use helps to grasp their long-term dynamics as well as the roots of the current situation in land use and food security.
As presented in Chapter 1, Agrimonde-Terra considers that there are five complementary, interlinked and dynamic dimensions of land use. The land’s agronomic potential is the first dimension and determines the suitability of land for agriculture and, within agriculture, for different crops. Land’s agronomic potential varies over time as a result of climate change, farmers’ decisions and technical progress, as well as policies through their impacts on these drivers. Access to land is the second dimension. It depends on land tenure systems and land policy, which are affected by the geopolitical situation, the degree of competition for land, farmers’ incomes and access to credit etc. A qualitative analysis of the evolution of access to land can be provided. The distribution of land between different uses is the third dimension. Diets, demography, climate, and international trade are important drivers of this dimension. The fourth dimension is the degree of intensity of land use. It evolves over time as it is influenced by available techniques (e.g., technical progress) and farmers’ decisions. The final dimension of land use is the services land provides. These services depend on how land is used (agriculture vs. forests, for instance) and, as
20. Marco Barzman prepared a retrospective of land use in OECD countries and in Latin America and the Caribbean (LAC). Pauline Marty prepared a retrospective of land use in Former Soviet Union (FSU) and in Middle East and North Africa (MENA). Clémence Moreau prepared a retrospective of land use in Asia and in sub-Saharan Africa (SSA).
21. The authors thank Chantal Le Mouël for all her suggestions and proofreading of this chapter.
56
LAND USE AND FOOD SECURITY IN 2050
far as agricultural land is concerned, on farming practices. This dimension of land use focuses on the linkages between ecosystems and human well-being, and has grown in importance since the 1990s.
Most of the data used in this chapter are from FAOStat. Data on land use thus use the
FAO classification.22
The agronomic potential of land
In recent decades, and in all regions of the world, the agronomic potential of land, i.e. its suitability for cultivation, has been, in some places, positively influenced by agricultural practices that have restored soil nutrients, improved soil organic matter and soil biotic activity, protected soils from strong winds and erosive water flows, enhanced biological interactions and synergies (UNEP, 2014). However, in most places of the world, the agronomic potential of land has been negatively affected by land-management activities such as mechanized agriculture, monoculture practices, inappropriate use of inputs and overgrazing, as well as by urban and industrial expansion and mining activities (UNEP/UNECE, 2016). Other on-going trends are the impacts of natural factors, such as floods, landslides and land sealing, and extreme climate events on the agronomic potential of land (UNEP/UNECE, 2016). Water reserves are also depleting in a number of regions. Millions of households are located in areas where the agronomic potential of land and water reserves are in decline and this has a major impact on their food security. Scherr (1999) estimates that about one fourth of the global soils and 38% of arable land and permanent crops area are degraded. Of a total of around 1,900 million hectares of degraded land, around 1,200 hectares is estimated to be ’seriously degraded’, and persistenly high rates of erosion affect more than 1,100 million hectares of land worldwide (Lavelle et al., 2005, cited by UNEP, 2014).
The past and current agronomic potential of land in the various regions of the world differ widely according to their land endowment, to human activities and natural events. Figure 5.1 presents the observed land use (arable land, pasture, forest and others; Box 5.1 for a glossary of terms on land use) and maximum cultivable area (i.e., GAEZ 1 to 4, Chapter 4) in 2010.23 North Africa, the Near and Middle East, China, India and West Africa have the lowest areas of land suitable for crop production. Arable and permanent crops areas in North Africa, the Near and Middle East and China are about to reach or already exceed areas considered suitable for cultivation which means that arable and permanent
22. For more details on classification and available data in FAOStat, see http://faostat3.fao.org/. Data series in some regions (especially FSU, MENA, Asia and SSA) are not always reliable.
23. As presented in Chapter 4, land with a suitability index greater than 40% has been considered as suitable land for crop production and considered as the maximum cultivable land area for regions whose cultivated land area in 2010 does not exceed this assumed maximum cultivable land area.

57
5. Retrospective Overview of Land Uses
crops are already planted on land where potentially attainable yields are considered relatively low. In India, arable and permanent crop areas are close to the 231 million hectares considered suitable for crop production. In highly densely populated countries of sub-Saharan Africa (SSA), such as Rwanda and Burundi, the maximum cultivable area has also been reached. In large regions such as Canada/USA, Latin America, East, Central and South (ECS) Africa and the Former Soviet Union (FSU), there are still vast areas suitable for crop production. These areas however may be currently devoted to other usages such as forests or infrastructure, for instance, and thus not directly available for agriculture (e.g., Lambin and Meyfroidt, 2011). The largest cultivable areas are found in ECS Africa (928 million hectares), followed by Brazil and Argentina (615 million hectares), and Canada and USA (593 million hectares).
The Latin America and Caribbean region (LAC) is rich in natural resources and more than 52% of its total area has a good agronomic potential (GAEZ 1 to 4). However, degradation is one of the greatest challenges in the region and all countries are affected by one or more processes of soil, water and air contamination in at least part of their territory
Source: FAO statistics division - Food and Agriculture Organization of the United Nations, Last updated April 2014.
Box 5.1. Glossary of terms used relative to land use.
Agricultural area: sum of areas under “Arable land and Permanent crops” and “Permanent meadows and pastures”.
Arable land: land under temporary agricultural crops (multiple-cropped areas are counted only once), temporary meadows for mowing or pasture, land under market and kitchen gardens and land temporarily fallow (less than five years). The abando-ned land resulting from shifting cultivation is not included in this category. Data for “Arable land” are not meant to indicate the amount of land that is potentially cultivable.
Forest area: land spanning more than 0.5 hectares with trees higher than 5 metres and a canopy cover of more than 10%, or trees able to reach these thresholds in situ. It does not include land that is predominantly under agricultural or urban land use.
Permanent crops: land cultivated with long-term crops which do not have to be replanted for several years (such as cocoa and coffee); land under trees and shrubs producing flowers, such as roses and jasmine; and nurseries (except those for forest trees, which should be classified under “forest”). Permanent meadows and pastures are excluded from land under permanent crops.
Other land: land not classified as Agricultural land and Forest area. It includes built-up and related land, barren land, other wooded land etc.
Permanent meadows and pastures: land used permanently (five years or more) to grow herbaceous forage crops, either cultivated or growing wild (wild prairie or grazing land).
Agrimonde-Terra uses the term “Cultivated area” to designate arable land + per-manent crops.
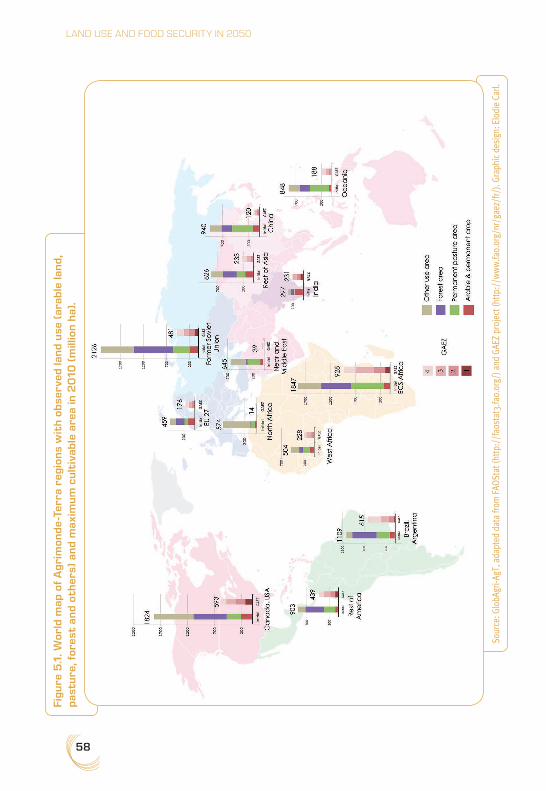
58
LAND USE AND FOOD SECURITY IN 2050
Figu
re 5
.1. W
orld
map
of
Agr
imon
de-
Terr
a re
gion
s w
ith
obse
rved
lan
d us
e (a
rab
le la
nd
, p
astu
re, f
ores
t an
d o
ther
s) a
nd
max
imum
cul
tiva
ble
are
a in
20
10 (
mill
ion
ha)
.
Sour
ce: G
lobA
gri-A
gT, a
dapt
ed d
ata
from
FAO
Stat
(http
://f
aost
at3.
fao.
org/
) and
GAE
Z pr
ojec
t (ht
tp:/
/ww
w.fa
o.or
g/nr
/gae
z/fr/
). Gr
aphi
c de
sign
: Elo
die
Carl.
59
5. Retrospective Overview of Land Uses
(UNEP-lac, 2016). This deterioration is caused by deforestation and excessive grazing, over-exploitation of the soil due to monoculture practices, failure to rotate crops, and improper intensive irrigation. The development of infrastructure, urbanization, mining and oil exploitation are also affecting the areas suitable for agriculture. The pressures on water differ vastly within the sub-regions, but agricultural, industrial and household demand for water resources increases with population growth, economic development and frequency of extreme climatic events (UNEP-lac, 2016). The region has started to reforest, but plantations are mostly on land no longer suitable for agriculture, either because of land degradation or because of the costs required for transforming them into areas suitable for new agricultural production systems (UNEP-lac, 2016).
In North Africa, land with a good agronomic potential represents only 2% of the total area. In West and ECS Africa, land with a good agronomic potential represents between 45 and 50% of the total area respectively. In many countries of North and sub-Saharan Africa, because of the small area with good agronomic potential, farmers cultivate or graze their animals on environmentally fragile areas without appropriate conservation measures, poor fertilizer management and inefficient irrigation practices. This leads to degradation, especially loss of top soil, salinization and desertification (UNEP-africa, 2016). The most severe land degradation has occurred on grasslands (40% are degraded), forestland (about 26% are degraded) and cropland (12% degraded) (Nkonya et al., 2016). In SSA, it is estimated that land degradation affects up to two-thirds of the productive land area and 65% of the entire African population (ELD Initiative and UNEP, 2015). Natural factors, such as climate variability and extreme climate events, wind and water erosion, play a major role in land degradation. Demand for agricultural products and fuelwood, inappropriate cultivation practices, commercial logging, urbanization, mining activities and industrialization are also affecting the agronomic potential (Rudel, 2013).
In Asia, about 28% of the total area has a good agronomic potential. However, this is an average hiding high variability across Asian countries; corresponding figures are 70% for India and only 12% for China. Over past decades, the agronomic potential of land and water reserves have been significantly depleted by agricultural intensification, urbanization, and development of infrastructure, demand for biofuels, mining and industrial activities (UNEP-asia, 2016). Over-application of chemical fertilizers, irrigation at a large scale and with poor drainage, rapid crop rotation and overgrazing have led to soil pollution (including pollution by heavy metals), erosion, compaction, acidification, salinization, declining soil organic matter, weed infestation, soil fertility depletion, and biological degradation, which need urgent attention according to UNEP (UNEP-asia, 2016).
In Europe, North America and the Former Soviet Union, the area with good agronomic potential represents about 28% in average of the total area. The land is affected by farming and land-management practices, urbanization, especially the creation of urban-rural ’fringe’ areas, and the development of infrastructure and recreation areas. This is leading to soil erosion and loss of organic matter, but also to soil contamination, loss of biodiversity, compaction and other physical deterioration, salinization, floods, landslides
60
LAND USE AND FOOD SECURITY IN 2050
and land sealing (UNEP/UNECE, 2016). There are sub-regional differences: land sealing is prevalent in Western Europe, and land abandonment is prevalent in Eastern Europe and FSU. Climate change could accelerate the intensity of these threats to soil quality.
In the future, the above-mentioned events could continue to negatively impact the agronomic potential of land and agricultural productivity unless there are radical changes in policies and practices. In addition, future climate change will affect the agronomic potential of land all over the planet (Chapter 7).
Access to land
Access to land is a major dimension of land use and poor access to land, either in the form of landlessness or because of insecure and contested land rights, often leads to rural poverty and food insecurity (Cotula et al., 2006). In many countries, a wide array of overlapping, and at times contradictory, rules, laws, customs, traditions, perceptions and regulations that govern access, use, control and transfer of land, are found (IFAD, 2008). Therefore, farmers have various means of access to land. The main paths are intra-family transfers, community membership, land markets for purchases and leases, and land reforms and programmes by States or decentralized institutions and groups (e.g., land registration, redistribution of land, restitution and recognition of land rights) (de Janvry et al., 2001). This means that access to land does not only have a legal dimension, but it also has a social, cultural and demographic dimension, a political dimension and an economic dimension. The expansion of a classic understanding of property rights that results in a market for land rights is therefore only one of the means to improve access to land (de Schutter, 2011). Lack of access to land can result in poverty, exclusion and food insecurity, especially when access to other economic activities is difficult.
In most countries of Africa, Asia, Latin America and the Caribbean, land tenure systems have been influenced by colonial patterns. During the colonial period, to secure economic advantages from their possessions, the colonial agents took the richest natural resources for themselves and paid little attention to local people. Several land tenure systems co-existed: the system of the colonial power, customary rights to land set by traditional authorities who determined who used land, and areas without control of any authorities (Rudel and Hernandez, 2017). After independence, each country set up agrarian reforms in its own way. Some countries produced State-secured land tenure systems, but others did not manage to do so.
Over the past 40 years, access to land in Latin America and the Caribbean has remained mostly inequitable and insecure, despite efforts to reform aspects of property rights, to regularize land registration of rural and urban land and to modernize land registration systems. The colonization process led to the establishment of immense estates and the fact that there is often hardly any limit to the exclusive character of private property (Merlet, 2010). Extensive land reforms started in the 1910s in Mexico, and agrarian reforms
61
5. Retrospective Overview of Land Uses
and redistribution programmes took place in a number of other countries as an outcome of revolutions and changes in policies to redress the dualistic latifundias-minifundias land tenure structure. Some of the land in the haciendas was expropriated; access to land and, later, land titles, were given to former permanent workers of these estates. Modernization projects targeting traditional structures were set up. Starting in the 1970s, and mostly in the 1990s, Latin American governments, often encouraged by the United States, reoriented their agrarian policies and enacted laws which encouraged the land market as a solution to the agricultural problem. Today, the land tenure systems have led to three pathways: the subdivision of farms, which is found in Mexico, Central America and the Andean nations, the concentration and foreignization of land in the Southern Cone countries, and the pre-eminence of State land ownership in the Caribbean (ECLAC-FAO-IICA, 2013). Land tenure in frontier regions remains highly contested (Borras et al., 2011) and unequal. This situation leads to land conflicts, as multiple actors compete for the same land (UNEP-lac, 2016). About 80% of the total arable land is in farms of more than 100 hectares and this land is frequently under-used or left idle; 2% of the land is controlled by 50% of the smallest and subsistence farms which overuse it (ECLAC-FAO-IICA, 2013; Lowder et al., 2016). In the past decade, land grabbing has been an important issue, especially in Argentina and Brazil. In many cases, it results in the incorporation, mostly adversely, of smallholders and indigenous communities into the emerging plantations and value chains (FAO, 2014). Peasants may retain some access to land but lose their control over activities and are forced to diversify their sources of income. Therefore, important tensions between landless farmers and very smallholders on the one hand, and large landowners on the other, still remain. Finally, it is important to note that in Latin America, concomitantly, actions have been taken to facilitate the ownership and control of land by indigenous peoples and local communities. They now own 18% of the land and control an additional 5%, which is high compared to the global situation, where they own 10% of land and control an additional 8% (Rights and Resources Initiative, 2015).
After independence, most Asian countries implemented land reform programmes. Socialist reforms were implemented by revolutionary governments in China and Vietnam, and later followed by de-collectivisation. Land reforms were implemented in Japan, South Korea and Taiwan and considered successful. In India, land reforms are carried out at the sub-national State level and therefore security of access to land, paths to land market liberalization and land provision for specific private players differ from one sub-national State to the other (Sud, 2014). In other Asian countries, trends were towards land markets. Over the years, rapid population growth and high population density created pressures on land and access to land for small farmers became increasingly difficult. There was some rethinking of the role and functions of the central state, greater decentralization, and peasant movements and civil society organizations became more influential. Today, access to land is still insecure because of the unfinished agenda of land reforms, especially land reforms for forests and the ’public domain’ which have been neglected (Quizon, 2013). Agriculture is dominated by smallholders who depend largely on household labour and have less than two hectares of cropland; pressure on land is very high. Nevertheless, this does not prevent

62
LAND USE AND FOOD SECURITY IN 2050
large-scale acquisitions or leasing of lands by corporations, leading to the displacement of small farmers, settlers and indigenous communities. According to Land Matrix data, 305 large-scale deals involving 4.9 million hectares have been concluded in Asia (mostly Cambodia, Laos, Indonesia and the Philippines) since 2000 (Nolte et al., 2016). A number of South-East Asian investors, notably Malaysian companies, but also companies in Singapore, India, Hong Kong and China, which have high population pressures, are also engaging in major land deals and accessing land at the expense of smallholders. Leaving aside China, which has recognized a significant portion of its land as community-owned, indigenous peoples and local communities formally own less than 1% of the land in Asia.
In Africa, secure, equal and equitable access to land is also a major issue. The concept of ’State-owned land’ is of particular importance and covers a wide range of situations (Chouquer, 2011). It is usually accompanied by a system of concessions or use rights, which regulate the way that the State makes land available for use by others and plays an important role in the current search for land by corporations. As far as access to land by women is concerned, “the pattern that women own less land than men, regardless of how ownership is conceptualized, is remarkably consistent”, and in many cases, the gender gaps are quite large (Doss et al., 2013, p. 29). Access to land for most African women is “still linked to their relationship with a male family member and is forfeited if the relationship ends” (Al-Zubaidi and Assubuji, 2013, p. 5).
In North Africa, a number of countries (for example, Algeria, Egypt, Libya and Tunisia) have undertaken extensive land reform programmes but land rights often remain extremely complex and include registered lands, melk lands (private lands), habous lands (or waqf) and customary forms of pastoral land management (AUC-ECA-AfDB Consortium, 2010). The consequence is persisting land tenure insecurity and conflicts. In some countries, a dual form of agriculture is found with large properties and public domains on the one hand, and very small plots cultivated for subsistence by family farmers on the other hand. Women’s rights over land are very poorly recognized.
After independence in sub-Saharan Africa, a variety of land administrative reforms were introduced reflecting different types of national coalitions and alliances. During the structural adjustment programmes, land reforms became subject to two countervailing pressures: the promotion of land markets as well as the promotion of private land rights, which required convertibility of customary rights into statutory tenure, decentralizing administration, giving greater roles to civil society and communities, and establishing policies that protect the livelihood interests of the poor (Amanor, 2012). Support to local institutions to undertake intermediate forms of land registration has been effective in a number of places, with careful checks of local and external interests, measures to limit disputes and to ensure that the needs of those with the least power are given due weight (Toulmin, 2009). Nevertheless, access to land is still the cause of many conflicts between farmers and herders, local populations and migrants, local populations and corporations, as well as displacements. Tensions are particularly high when the agronomic potential is high because of access to water, as well as when population densities are
63
5. Retrospective Overview of Land Uses
high. Purchases and leases of land by local urban and foreign investors are increasing the pressures on local and small farmers. According to Land Matrix data, Africa is by far the most targeted continent by foreign investors. Since 2000, 422 agricultural deals were concluded involving a total area of almost 10 million hectares; they are mostly located along the major rivers (Nolte et al., 2016).
In FSU, access to land is still marked by the collectivization period despite the collapse of Soviet Union in 1991. The land reform of the early 1990s was extremely rapid. In theory, the state monopoly on land was repudiated and the ownership of agricultural land was transferred free of charge from the State to private individuals and collective farms, and required farms to reorganize as joint-stock companies. In addition to peasants, the land was to be distributed to any other qualified individuals who requested it and intended to use it for agricultural purposes. However, in practice, the process of establishing land property and rights has been slow, incomplete and variable from country to country. This is favouring the purchasing and leasing of land by foreigners; Ukraine and Russia are second and third in terms of target countries for foreign investments in land (Nolte et al., 2016).
In OECD countries, land tenure is considered secure. The French Civil Code, British Common Law, and the German-style land book, all contribute to securing land access and transferability of rights. From a legal point of view, access to land by men and women is possible. From an economic point of view, younger people find it increasingly difficult to access, and some countries have set up systems to facilitate their access to land. Nevertheless, there is an increase in the degree of foreign ownership of farmland. This is especially noticeable in some parts of Spain and Eastern and Central Europe. Small farmers are being thrown out of farming every year while large farms and agribusinesses are expanding their scope widely and rapidly. For example, in Romania, 0.4% of farms exploit 49% of the agricultural area (Levesque, 2014). In Australia, about 9.78% of the cultivated area is considered ’grabbed’ (Rulli et al., 2013). In a number of OECD countries, land sealing (e.g., infrastructural development and urban sprawl) is limiting the development of agricultural areas and contributing to higher value for land.
Finally, land has always been a basic repository of wealth and value. For producers, farmland generates income through production. For investors, income is generated either through lease payments collected from tenant farmers, or as a percentage of harvest revenues. Over the past decade, farmland valuations have increased in the USA, Brazil and Australia.24 Investment in farmland has switched from an asset class limited to farmers, wealthy individuals and a few financial institutions to a sought-after asset class that provides good returns on investments. According to Nolte et al. (2016), investors target two groups of countries. The first group consists of countries with a high Global Hunger Index (GHI) and a high dependence on their agricultural sectors. Their presence in these countries is supposed to lead to higher food production and job creation. The second group consists of countries with a much lower GHI and agriculture is proportionally less
24. http://www.informaecon.com/MCSGlobalFarmSurveyJul2014.pdf
64
LAND USE AND FOOD SECURITY IN 2050
important to their national economies. Acquisitions take place in the context of a transition from centrally planned state economies to more capitalist and free market economies. In South America, the State is rarely involved as an intermediary.
This very brief description demonstrates that in many regions of the world, access to land is still insecure, unequal and inequitable. Many States do not have tenure systems which can prevent the concentration and foreignization of land. There are tensions between processes of decentralization of the administration of land tenure and political centralization, use and access to national land, land markets and fiscal resources. Also, there are a growing number of contracts (concessions) between States and investors. The value of land has increased and buying land is increasingly considered as a good investment by companies and individuals. However, small farmers are starting to develop a variety of strategies to adapt.
Distribution of land between different uses
❚❚ Global overview
Since the 16th century, the total global area of permanent cropland has almost doubled every century from 300 million hectares around 1700, to 420 million hectares around 1800, to 850 million hectares around 1900 and to 15,300 million hectares around 2000 (Klein Goldewijk et al., 2011). In 2010, cropland comprises about 10% (around 1,500 million hectares) of the world land area, whereas agricultural area in total made up around 33% (around 4,900 million hectares). Between 1961 and 2010, world arable and permanent crops areas have increased by about +12% (from 1,368 million hectares to 1,527 million hectares) (Figure 5.2). This net increase is the result of an area of land newly brought into cultivation that is greater than the area of land which came out of production during the same period. During this period, the global irrigated area has doubled, accounting for most of the net increase in cultivated land, and land under rainfed systems have shown a very slight decline (FAO, 2011b).
Between 1961 and 2010, within harvested areas (Box 5.1) of arable and permanent crops, the share of the area dedicated to cereals shrunk from 67% to 55% and that of oil crops rose from 8% to 18% (Figure 5.3). However, there was an expansion of the area for the major cereals (maize, rice and wheat) between 1965 and 1982, stagnation until 2002, and a decrease since then (Figure 5.4 and Grassini et al., 2013). Overall, the share of the major cereals in world harvested areas of arable and permanent crops decreased slightly from 44% in 1961 to 42% in 2010. Oil crops, especially soyabean, have expanded rapidly since the early 2000s (Figure 5.5). Globally, the share of the area dedicated to fruit and vegetables increased from 5% to 8%, that of pulses fell from 7% to 6%, while that of roots and tubers as well as fibres fell from 5% to 4%. The share of sugar plants and products has stayed around 2% (starch was found in other products) and the share of other plant products climbed from 2% to 3% (Figure 5.3). These evolutions impact nutritional security.
Areas devoted to permanent meadows and pastures increased from the 1960s to the mid-1990s and then slowly decreased. Over the whole period, the world area of permanent

65
5. Retrospective Overview of Land Uses
Figure 5.2. World agricultural area evolution from 1961 to 2010 (1,000 hectares).
Source: FAOStat.
Figure 5.3. Shares of the world harvested areas of 8 crops in 1961 and 2010 (%).
Source: FAOStat.

66
LAND USE AND FOOD SECURITY IN 2050
meadows and pastures rose from 3,078 million hectares in 1961 to 3,358 million hectares in 2010, i.e. about +7.3 million ha per year (Figure 5.2). There are, however, regional differences. In China, Brazil, MENA (Middle East and North Africa), and FSU, permanent
Figure 5.4. Evolution of world harvested areas of cereals from 1961 to 2010 (1,000 hectares).
Source: FAOStat.
Figure 5.5. Evolution of world harvested areas of oil crops from 1961 to 2010 (1,000 hectares).
Source: FAOStat.
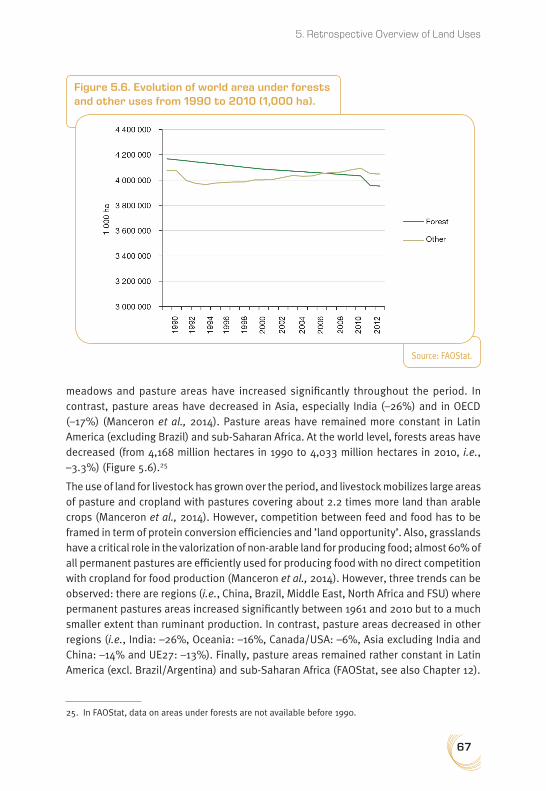
67
5. Retrospective Overview of Land Uses
meadows and pasture areas have increased significantly throughout the period. In contrast, pasture areas have decreased in Asia, especially India (–26%) and in OECD (–17%) (Manceron et al., 2014). Pasture areas have remained more constant in Latin America (excluding Brazil) and sub-Saharan Africa. At the world level, forests areas have decreased (from 4,168 million hectares in 1990 to 4,033 million hectares in 2010, i.e., –3.3%) (Figure 5.6).25
The use of land for livestock has grown over the period, and livestock mobilizes large areas of pasture and cropland with pastures covering about 2.2 times more land than arable crops (Manceron et al., 2014). However, competition between feed and food has to be framed in term of protein conversion efficiencies and ’land opportunity’. Also, grasslands have a critical role in the valorization of non-arable land for producing food; almost 60% of all permanent pastures are efficiently used for producing food with no direct competition with cropland for food production (Manceron et al., 2014). However, three trends can be observed: there are regions (i.e., China, Brazil, Middle East, North Africa and FSU) where permanent pastures areas increased significantly between 1961 and 2010 but to a much smaller extent than ruminant production. In contrast, pasture areas decreased in other regions (i.e., India: –26%, Oceania: –16%, Canada/USA: –6%, Asia excluding India and China: –14% and UE27: –13%). Finally, pasture areas remained rather constant in Latin America (excl. Brazil/Argentina) and sub-Saharan Africa (FAOStat, see also Chapter 12).
25. In FAOStat, data on areas under forests are not available before 1990.
Figure 5.6. Evolution of world area under forests and other uses from 1990 to 2010 (1,000 ha).
Source: FAOStat.

68
LAND USE AND FOOD SECURITY IN 2050
❚❚ Regional overview
The Second World War has had a profound effect on the spatial distribution of land (FAO, 2000). Agriculture suffered massive devastation during the war throughout Europe, in the USSR, in large areas of Asia and the Pacific, and in North Africa. In sharp contrast, food supplies were abundant in producer countries that had been relatively spared by the conflict – Canada, the United States, Australia and Argentina – and these countries took on the role of food suppliers for their allies and made a special effort to stimulate their output. After the war, Asia was considered to have problems of an almost insurmountable nature because it had half of the world’s population but only one-fifth of the earth’s land; the political situation was extremely unstable. Africa’s situation then looked better as the war years had led to a strong demand for agricultural commodities, especially many industrial crops, and minerals, whose production had developed. We will now look at what happened in each region since 1960.
Agricultural areas have decreased in OECD countries between 1961 and 2010. The decrease has been much sharper in the EU27 (from 141 to 119 million hectares for arable and permanent crops areas, i.e. –15.6%, and from 78 to 68 million hectares for permanent meadows and pastures, i.e. –12.8%) than in Canada and USA (from 231 to 207 million hectares, i.e. –10.4%, and from 282 to 264 million hectares, –6.4% respectively).
Since the 1970-1990 period, there has been a territorial specialization in the distribution of land in Europe. On the one hand, there are highly productive intensive farming and forestry areas and, on the other, increasingly marginalized small-scale farm mosaics and extensive land use systems, or even abandoned land. Hotspots for the decline of cropland are found mainly in Eastern Europe and the Mediterranean. Cropland expansion has been rare overall, and occurred mainly in the Netherlands, Northern Germany, some areas in central France and Ireland. Large areas of Europe have been characterized by stable cropland patterns (Kuemmerle et al., 2016). Wheat, maize, oats, barley, oilseed rape and soyabean have progressively become the crops covering the majority of cultivated areas. Bovine and especially dairy production have grown rapidly but without increasing pasture areas thanks to yield improvements, animal feed imports, geographic concentration and increasing specialization of rations, species, and systems. The contribution of these systems to water contamination is increasingly questioned.
In the FSU, since 1991, the arable land and permanent crops area has decreased by –14.6% and reached 195 million hectares in 2010. This has mostly taken place in Russia, Ukraine and Belarus. In this land abandonment, socio-economic factors have probably played a greater role than physical factors (Alcantara et al., 2013). The decrease in arable and permanent crops areas has been compensated by an increase in permanent meadows and pastures: between 1991 and 2010 meadows and pastures have experienced a +11% expansion, reaching 362 million hectares in 2010. Within the arable and permanent crops harvested area, the share of sunflower grew considerably (from less than 3% in the 1990s to more than 9% in 2010), while the share of cereals (mainly wheat, corn, and barley) decreased (from 77% in the 1990s to less than 74% in 2010). Nevertheless, cereals remain

69
5. Retrospective Overview of Land Uses
the main production, with wheat representing 2/3 of cereal areas. Large areas are also devoted to sugar plants (13% of harvested area in 2010). Urban agriculture covers small areas but is practiced by half of the urban population (Boukharaeva and Marloie, 2011).
In North Africa and the Near and Middle East, there has been an +11% increase in arable and permanent crops areas over the 1960-2010 period because of the expansion of permanent crops areas (+117%) reflecting the growth of fruit trees production for exports. Other major productions are cereals (mainly wheat) and sugar plants. Permanent meadows and pastures areas increased until the early 2000s and has decreased since then. Livestock production has grown four-fold, driven by intensification in dairy and poultry breeding; cereals and cakes are imported. In the MENA region, since 1990, 100% of the land considered as suitable for agriculture is exploited.
Arable land increased only slightly in Asia, between 1961 and 2010 (from about 340 to 369 million hectares) but permanent crop areas more than tripled (from about 22 to 74 million hectares). Permanent meadows and pastures climbed from 276 to 541 million hectares. The regional expansion of agricultural land and practices such as shifting cultivation has caused deforestation (UNEP-asia, 2016). While the largest areas of arable land are still devoted to rice and sugar plants, there has been a major increase in the area devoted to fruit and vegetables, soyabean, fibres, oil palm, and maize. Areas devoted to other cereals and pulses have decreased. The expansion of permanent pasture is due to the growing consumption of animal products in the region (a 10-fold increase over the period).
In Latin America, between 1961 and 2010, the land area devoted to arable and permanent crops has risen from about 100 million hectares to 184 million hectares (+84%); the area of meadows and pastures went up from 460 million hectares to 559 million hectares (+22%) and seems to stabilize by the end of the period. LAC, especially Brazil and Argentina, has become a major producer of soyabean, overtaking North America, but also of sugar plants in addition to fruit and vegetables; the share of soyabean in total harvested area has gone from 0.5% in 1961 to nearly 40% in 2010. LAC has remained a major producer of maize and wheat. Starting in the 1980s, Brazil and Argentina took advantage of the huge increase in demand from China and deforested to plant soyabean. Since the 2000s, soyabean is essentially planted on acid soils previously considered unsuitable for agriculture. Between 1961 and 2010, the area under forests went down by –9%.
In SSA, between 1961 and 2010, arable land and permanent crops increased from about 144 to 230 million hectares (i.e. +60%), permanent meadows and pastures went from 801 million to 827 million hectares (i.e. +3%); forests areas decreased from 741 million hectares in 1990 to 666 million hectares in 2010 (i.e. –10%). SSA differs from the other regions: most food commodities are for domestic consumption and interactions between crops and livestock are strong. In this region, in 2010 about 22% of the land listed as agricultural is actually cultivated for crops, and the majority is grazing land used for breeding livestock. In 1960, 15% of the land listed as agricultural was cultivated for crops. Plant-based food production has increased by +2.6% per year on average since 1970, a rate similar to the one seen in Asia (+2.7%) and slightly higher than the global average

70
LAND USE AND FOOD SECURITY IN 2050
(+2.15%). The largest areas of arable land are devoted to ’other cereals’ (millet, sorghum etc.), maize, roots and tubers, pulses, and fruit and vegetables, which is linked to domestic diets. Areas devoted to ’other cereals’ have increased by about +87% between 1961 and 2010. Areas devoted to oil palm have decreased but current restrictions on logging and the acquisition of land in Asia are pushing investors back to West Africa and the Congo Basin.
Degree of intensity of land use
The degree of intensity of land use concerns farming practices, which depend on the techniques available and farmers’ decisions. It is affected by technical progress, farmers’ decisions and policies. Over the past 40 years, the intensity of land use has increased considerably at global level. According to the FAO (2011), in 1961, 0.45 hectare was necessary to feed one person. In 2010, about 0.23 hectare is cultivated per head of the world’s population. High-income countries cultivate more than twice the area per capita (0.37 hectare) than low-income (0.17 hectare) countries, while middle-income countries cultivate 0.23 hectare per capita (FAO, 2011b). Europe today has some of the most intensively managed croplands in the world (Kuemmerle et al., 2016).
We present here a retrospective overview of cropping intensity ratios and observed yields per hectare, the two quantitative indicators used by Agrimonde-Terra in the foresight process as far as land use intensify is concerned. In order to improve the intensity of land use, since the 1960s the transfer of technology model has dominated the organization of agricultural knowledge processes in developing countries and meant disseminating improved seeds, training farmers in chemical input use and simplified practices, and developing irrigation and mechanization (McIntyre et al., 2009). We will present a very brief retrospective of yields of major cereals crops and cropping intensity ratios. Then we will also present a retrospective of the use of improved and genetically modified crops, of fertilizers and pesticides, of irrigation and of mechanization, which have contributed to improving the intensity of land use in the different regions of the world.
❚❚ Cropping intensity ratios
According to Ray and Foley (2013, p.2): “the growth in annually harvested cropland and standing cropland has been changing in recent decades… While standing cropland area increased at the rate of about 3.5 million ha/year (from about 1.37 billion ha in 1961 to about 1.55 billion ha in 2011), the annually harvested land increased at a much faster rate of about 5.5 million ha/year (to reach about 1.38 billion ha in 2011 from about 1.06 billion ha in 1961). The ratio of annually harvested land to total standing cropland has been increasing over time as well (from 0.78 to 0.89 between 1961 and 2011), showing that the world’s cropland harvesting frequency has been increasing significantly. In fact, the frequency of land harvesting increased even faster between 2000 and 2011; globally, annually harvested land increased at the rate of about 12.1 million ha/year which was approximately 4 times faster than the rate for standing cropland expansion (about 2.9 million ha/year).”
71
5. Retrospective Overview of Land Uses
Ray and Foley (2013) point out regional differences in the cropland harvest frequency: in most of Western Europe, land is used consistently; however, a few countries (e.g., Austria, France, Germany, Portugal and Italy) are increasing cropland harvest frequency. A number of Eastern European countries are decreasing their cropland harvest frequency with the exception of Poland and Ukraine. In America, many countries are increasing their cropland harvest frequency with the exception of Argentina, Mexico, Cuba and the Dominican Republic, where it is decreasing. Most Asian countries have increased their cropland harvest frequency. In the past decade, China has gone from 1.24 to 1.40 harvest per year and India from 1.08 to 1.21 harvest per year. Given the quality of soils, this growth will probably not last in the future. In many sub-Saharan African countries, the trend is towards negative cropland harvest frequency change, either because of an increase in crop failures or fallow periods, or an increase in cropland areas that have not been brought into production, or of a reduction in double- and triple-cropping, or the fact that more than 95% of agriculture area is rainfed.
❚❚ Yields of major cereal crops
Average cereal yields over the last 50 years varied from about 373 kg per hectare in Namibia to 6,215 kg per hectare in the Netherlands, and there were 38 countries that had average yields over 3,000 kg per hectare (Liu et al., 2015). The average cereal yield increased from 1,258 kg per hectare in 1961 to 2,925 kg per hectare in 2010 (Liu et al., 2015). A retrospective evolution of maize, rice and wheat yields is provided by Ray et al. (2012), Iizumi et al. (2014) and Grassini et al. (2013), and despite different datasets and methods, they show quite consistent results and highlight different aspects. After a period of significant yield improvements, three yield trajectories are identified: continued growth, stagnation and decline. Globally, rice and wheat yields have reached upper plateaus (33% and 27% of cases reported by Grassini et al., 2013) or are stagnating (23% and 24% of Grassini et al.’s 2013 cases, and in 35% and 37% of harvested areas according to Ray et al., 2012). Maize (26%) has fewer cases of yields reaching an upper plateau (5% of cases according to Grassini et al., 2013) and stagnation (33% of cases according to Grassini et al., 2013, and 26% of harvested areas according to Ray et al., 2012). Ray et al. (2012) also report yield stagnation for 23% of areas with soyabean. Collapses of yields are identified in 3% of maize areas, 1% of rice areas and 1% of wheat areas (Ray et al., 2012).
In Europe, there is evidence of wheat yield stagnation and, in some areas, of maize. In the United States, especially in the western part, wheat yields are stagnating. In Asia, there is evidence of maize, rice, wheat and soyabean stagnation; rice yields are stagnating in China, India, and Indonesia across 79%, 36% and 81% of rice-growing areas respectively (Ray et al., 2012). This raises major concerns for the future of production under current conditions. In Africa, there are major intra-regional differences for maize as well as for rice in West Africa. In Botswana, Kenya, Madagascar, Zambia, and Zimbabwe, maize yields are collapsing (Iizumi et al., 2014). In Latin America, maize yields are still improving nearly everywhere except in Mexico, and soyabean yields are stagnating in some parts of Brazil (Ray et al., 2012).
Based on literature reviews, Grassini et al. (2013) make hypotheses about the factors contributing to yield plateaus and stagnation. These are the fact that the crop reaches

72
LAND USE AND FOOD SECURITY IN 2050
its biophysical yield ceiling in the region where it is produced, but also “cyclical weather patterns, land degradation, shift in the location of production area to regions with poorer soils and climate, policies on the use of fertilizers and pesticides, and insufficient or poorly oriented investment in agricultural research and development,” (Grassini et al., 2013, p.5).
❚❚ Improved and genetically modified crops
Breeding programmes developed early in the 20th century in the USA and European countries. There had been major technological advances in the 1950s. In the 1990s, molecular breeding accelerated the pace of progress and the precision of plant genetics and breeding. Since the 2000s, the introduction of a multitude of ’omics’ tools provided an unprecedented ability to dissect the molecular and genetic basis of traits as well as the characterization of whole genomes (Kumpatla et al., 2012).
Since 1960, the crop varieties planted by farmers in cultivated systems have shifted from locally adapted and developed populations to more widely adapted varieties produced through formal breeding systems (modern varieties). Roughly 80% of the wheat area in developing countries and three-quarters of the rice area in Asia is planted with modern varieties (MEA, 2005b). For other crops, such as maize, sorghum and millet, the proportion of area planted with modern varieties is far smaller (MEA, 2005b). International research programmes for the improvement of maize, wheat and beans, with funding from the Rockefeller and the Ford Foundations, played a major role in the creation and diffusion of improved varieties in Latin America, Asia and Africa (McIntyre et al., 2009). Private companies also invested very early in plant breeding and since the 1990s, seed, agrochemical, and pharmaceutical companies have merged into ’life science’ companies. Commercial transgenic crops were introduced in 1996; they covered about 4% of the global cropland area in 2004 and 12% in 2016 (185 million hectares) (ISAAA, 2016). The crops mostly concerned are maize, soyabean, cotton and beets. In 2016, genetically modified crops were found in 26 countries, 19 developing and seven industrial countries; the USA grew 39% of the global total, Brazil 27%, Argentina 13%, Canada 6%, and India 6% (ISAAA, 2016).
This has been facilitated by evolutions in the international and legal contexts. The International Convention for the Protection of New Varieties of Plants (UPOV) was signed in 1961 providing a sui generis protection to crop varieties with important exemptions for farmers and breeders (McIntyre et al., 2009). In the 1970s, the European Patent Convention stated that plants and animals are not patentable, but in the 1980s, the first patents were granted to living organisms by US courts, and the European Patent Office moved to grant patents on plants in 1999 (McIntyre et al., 2009). In the 1990s, the Agreement on Trade Related Aspects of Intellectual Property Rights (TRIPS) spurred a debate on plants and varieties in developing countries. The UPOV Act prohibited farmers from sharing seed of protected varieties. Throughout the period, the FAO was involved in discussions, notably with the Commission on Plant Genetic Resources for Food and Agriculture (CPGRFA) and the FAO-International Undertaking (IU-PGRFA), but did not really manage to protect local varieties and small farmers (McIntyre et al., 2009).
73
5. Retrospective Overview of Land Uses
❚❚ Fertilizers and pesticides
The application of chemical fertilizers and pesticides in agricultural systems has been considered to be an important means to improving crop yields. Over the past two decades, efficiency of use, and impacts on yields and the environment have however been widely debated, and inefficiency and negative impacts are increasingly noted (Liu et al., 2015; Mueller et al., 2017).
The fertilizer industry is linked to the countries which control the production of the primary materials needed to produce fertilizers, i.e. Canada, China, the United States, India and Russia (IPES-Food, 2017).
Globally, there is unequal availability of fertilizers, and therefore application rates. Consumption per hectare of harvested area and nitrogen use efficiency vary a lot per country and within countries (Nesheim et al., 2014; Liu et al., 2015; Mueller et al., 2017). In Asia, the consumption of fertilizers was promoted during the Green Revolution (Pingali, 2012) and its use is widely spread. East Asia accounts for 41% of global nitrogen consumption, 37% of global phosphate consumption and 31% of global potash consumption, and South Asia accounts for 19%, 22% and 17% of global consumption of the three fertilizer types respectively (UNEP, 2013); Malaysia consumed more than 800 kg of fertilizers per hectare of harvested area in 2010 (Liu et al., 2010). In contrast, most African countries use few fertilizers: 80% of African countries lack nitrogen and in 2010, eleven countries were using less than 50 kg of fertilizer per hectare (Liu et al., 2015). In Latin America, phosphorus scarcity is widespread. However, at global level, the observed nitrogen use efficiency (NUE) has “declined from an average of 54% N recovery in harvested materials during 1961–1977 to 47% N recovery during 1994–2009.” (Mueller et al., 2017, p.7).
As far as pesticides (insecticides, herbicides, fungicides and bactericides) are concerned, the USA consumed the largest amount of insecticides followed by India. Twenty countries consumed more than 2 kg per hectare of insecticides in 2010, with 12 nations in North and South America; whereas countries located at high latitudes used less than 45 g per hectare (Liu et al., 2015). In Africa, most countries officially import few pesticides, but smuggling of pesticides is largely practiced (Chapter 15). Most pesticides are provided by agricultural input industries which have become highly concentrated during the period 1994-2009 (Fuglie et al., 2011). In 2014, the world’s six largest agrochemical corporations controlled 75% of the global pesticides market and also 60% of the global seed market (IPES-Food, 2017).
❚❚ Irrigation
Agriculture is by far the biggest economic sector to use water. Irrigated systems have an impact on land intensity as it can boost agricultural production. Between 1961 and 2010, while the arable and permanent crop area increased by +12%, land under irrigation more than doubled and continues to grow; 40% of irrigated areas are reliant on groundwater either as a primary source or in conjunction with surface water (FAO, 2011b). In 2012, more than 324 million hectares were equipped for irrigation worldwide, i.e. 21% of the
74
LAND USE AND FOOD SECURITY IN 2050
area devoted to arable land and permanent crops. However, 71% of the irrigated areas (about 230 million hectares) are in Asia, and 25% are in the Americas and Europe. In Asia, in 1961, 19.6% of area devoted to arable and permanent crops was irrigated and this percentage climbed to 41% in 2012. Asia’s irrigated areas are mostly in China and India. In South America, the percentage rose from 6.5% to 10.5% between 1961 and 2012. In North Africa, it went from 17.1% to 25.6%, whereas in sub-Saharan Africa, it went from 2.4% to 3.4%. Inefficient use of water for crop production depletes aquifers, reduces river flows, degrades wildlife habitats and leads to salinization of irrigated land (FAO, 2016a).
❚❚ Mechanization
At the production level, agricultural mechanization (e.g., for crop establishment, weeding, fertilization, irrigation, crop protection and harvesting) leads to substitution of labour by capital. There are different levels of mechanization and sizes of machines (Böttinger et al., 2013), and the machines can contribute in various manner to increasing the intensity of land use. According to Böttinger et al. (2013), in the European Union, there are a high number of machines per hectare reflecting over-mechanization and a tendency to fewer and higher-powered machines; in the USA, farms are completely mechanized and there is a trend towards larger and higher-horsepower equipment and automation; in Japan, agriculture is highly mechanized but mostly with small, sophisticated and specialized machines, with a trend towards more automation; in FSU, machines and tractors are old and their replacement is slow. In Latin America, Asia and the Near East, there has been an increase in engine power leading to a fall in the number of draught animals, although at local level animals can still be very important. For example, in Latin America and the Caribbean, tractor numbers increased 1.7 times between 1961 and 1970, and thereafter tripled to reach 1.8 million in 2000 (FAO, 2016a); in Asia, the number of tractors increased five-fold between 1961 and 1970, and then ten-fold, reaching 6 million units in 2000 (Sims et al., 2016).
In sub-Saharan Africa, in 1961, the number of tractors in use (172,000) exceeded the number both in Asia and the Near East, but have since increased slowly, peaking at 275,000 in 1990, before falling to 221,000 in 2000 (Sims et al., 2016); draught animal power and human muscle power still play a major role.
Services provided by land: employment, regulating, supporting and cultural services
Land use provides employment, and benefits from and influences ecosystem services, such as the provision of services (the material benefits people obtain from ecosystems such as water, food, wood and other goods), regulating services (maintaining air and soil quality, providing flood and disease control, or pollinating crops), supporting services (providing living spaces for plants or animals and maintaining a diversity of plants and animals), and cultural services (the non-material benefits people obtain from ecosystems).
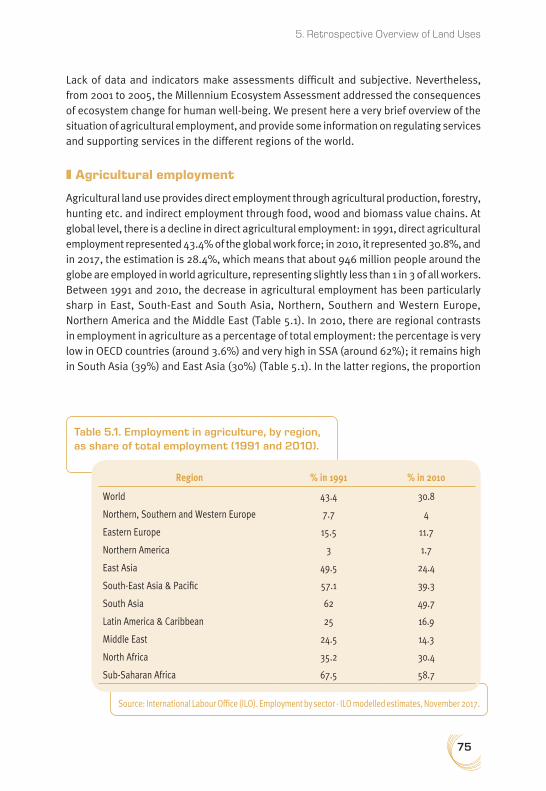
75
5. Retrospective Overview of Land Uses
Lack of data and indicators make assessments difficult and subjective. Nevertheless, from 2001 to 2005, the Millennium Ecosystem Assessment addressed the consequences of ecosystem change for human well-being. We present here a very brief overview of the situation of agricultural employment, and provide some information on regulating services and supporting services in the different regions of the world.
❚❚ Agricultural employment
Agricultural land use provides direct employment through agricultural production, forestry, hunting etc. and indirect employment through food, wood and biomass value chains. At global level, there is a decline in direct agricultural employment: in 1991, direct agricultural employment represented 43.4% of the global work force; in 2010, it represented 30.8%, and in 2017, the estimation is 28.4%, which means that about 946 million people around the globe are employed in world agriculture, representing slightly less than 1 in 3 of all workers. Between 1991 and 2010, the decrease in agricultural employment has been particularly sharp in East, South-East and South Asia, Northern, Southern and Western Europe, Northern America and the Middle East (Table 5.1). In 2010, there are regional contrasts in employment in agriculture as a percentage of total employment: the percentage is very low in OECD countries (around 3.6%) and very high in SSA (around 62%); it remains high in South Asia (39%) and East Asia (30%) (Table 5.1). In the latter regions, the proportion
Source: International Labour Office (ILO). Employment by sector - ILO modelled estimates, November 2017.
Table 5.1. Employment in agriculture, by region, as share of total employment (1991 and 2010).
Region % in 1991 % in 2010
World 43.4 30.8
Northern, Southern and Western Europe 7.7 4
Eastern Europe 15.5 11.7
Northern America 3 1.7
East Asia 49.5 24.4
South-East Asia & Pacific 57.1 39.3
South Asia 62 49.7
Latin America & Caribbean 25 16.9
Middle East 24.5 14.3
North Africa 35.2 30.4
Sub-Saharan Africa 67.5 58.7
76
LAND USE AND FOOD SECURITY IN 2050
of poor people in the agricultural sector is very high and the role of women, children and forced labour is largely unrecognized. Also, many agricultural workers are excluded from national labour laws, have low wages and dangerous working conditions (ILO, 2007).
❚❚ Regulating, supporting and cultural services
The Millennium Ecosystem Assessment (2005) reports that: “Over the past 50 years, humans have changed ecosystems more rapidly and extensively than in any comparable period of time in human history, largely to meet rapidly growing demands for food, fresh water, timber, fibre, and fuel. This has resulted in a substantial and largely irreversible loss in the diversity of life on Earth. The changes that have been made to ecosystems have contributed to substantial net gains in human well-being and economic development, but these gains have been achieved at growing costs in the form of the degradation of many ecosystem services, increased risks of nonlinear changes, and the exacerbation of poverty for some groups of people. These problems, unless addressed, will substantially diminish the benefits that future generations obtain from ecosystems” (MEA, 2005b, p.1). In 2005, approximately 60% (15 out of 24) of the ecosystem services examined during the Millennium Ecosystem Assessment were degraded or used unsustainably, and therefore there was a degradation of regulating, supporting and cultural services. The harmful effects of the degradation of ecosystems are the emission of greenhouse gases, a significant rise in the number of floods and wildfire, land, water and air degradation and pollution, a decline in genetic diversity among cultivated species, a decline in the occurrence and diversity of wild pollinators26 and an increase in the incidence of infectious diseases and zoonotic pathogens etc. (MEA, 2005b). They are especially being borne by the poorest, contributing to growing inequities. A few years later, Rockström et al. (2009) proposed the concept of “planetary boundaries” to describe “thresholds that will trigger non-linear, abrupt environmental change within continental- to planetary-scale systems” (Rockström et al., 2009, p.1). Steffen et al. (2015) estimate that changes at the level of sub-systems will impact the functioning of the Earth’s system as a whole.
Biodiversity decline and loss has been very high in Eastern and Western Europe, but with lower rates in Central Europe, Russia and Central Asian countries. The Caucasian Mountains, the Carpathians, the mountains of Central Asia and the Irano-Anatolian highlands still have high species richness and harbour many endemic species (UNEP/UNECE, 2016). Wild pollinators, in North West Europe and North America, have declined in occurrence and diversity (and abundance for certain species) at both local and regional scales (IPBES, 2016). Human habitat, infrastructure, agriculture, industry and mining as well as poor waste management put heavy pressures on land and are badly affecting soil and water quality, and leading to the removal of open and green spaces and impairing
26. The volume of production of pollinator-dependent crops has increased by 300% over the past five decades, and overall these crops have experienced lower growth and lower yield stability than pollinator-independent crops (IPBES, 2016). They are affected by intensive agricultural practices.

77
5. Retrospective Overview of Land Uses
cultural services. Pesticide use and stockpiles of hazardous chemicals are a major concern for public health and ecosystem integrity (WHO, 2010).
In Africa, biodiversity is considered to still be very high both in terms of species and ecosystem types and, with certain notable exceptions, in remarkably good condition. The Congo Basin rainforest is the second largest tropical rainforest in the world and Lake Victoria is the second largest freshwater lake in the world (UNEP-africa, 2016). Biodiversity is contributing to food supply, traditional medicines and tourism. However, it “faces significant threats from illegal trade in wildlife, mono-cropping, air and water pollution, forest loss, climate change, and increased prevalence of invasive alien species” (UNEP-africa, 2016, p.77). Lack of valuation of biodiversity contributes to inadequate conservation efforts. On average, the population has sufficient water to meet their needs, but assessments at the local level reveals disparities in access to water resources. The cultural value of ecosystems is rated highly by both traditional local and affluent urban communities (MEA, 2005b).
LAC benefits from an exceptional variety in its biodiversity (e.g., in Brazil, Colombia, Ecuador, Mexico, Peru and Venezuela), and has been the centre for the domestication of plant species (cassava, common beans and maize, for example, in Central America and the Andes-Amazon). At the household and local levels, huge varieties of plants are cultivated for food, fibre and medicinal purposes. Land plays an important role in the culture of indigenous populations. Many countries are involved in initiatives to reduce emissions from deforestation and forest degradation (REDD), and to foster and recognize the environmental services of forests for the region and the world. They seek to achieve a valuation of environmental services provided by forests, as well as for carbon capture and biodiversity conservation. However, land-use change, including degradation and fragmentation of natural habitats, conversion of natural habitats to agriculture and pastureland, and expansion of certain crops such as sugar cane, soyabean and coffee plantations as well as places to rear livestock put the services provided by land at risk (UNEP-lac, 2016).
In Asia and the Pacific, biodiversity has been damaged by agriculture, overgrazing and conversion to forest plantations and natural forest logging (UNEP-asia, 2016). Of the 2 billion hectares of dryland in Asia, more than half are affected by desertification; the increasing dust storms are attributed to wind-related desertification processes, resulting from human impacts in arid, semi-arid and sub-humid regions of Northern China (UNEP-asia, 2016). Shifts in the composition of forests and water scarcity are also diminishing ecosystem services.
Conclusion
The retrospective overview of land use in the world underlines important challenges for the five dimensions of land use.
The agronomic potential of land is already over utilized in North Africa, the Near and Middle East, the South Mediterranean zone, China, Rwanda and Burundi. In India, the rest
78
LAND USE AND FOOD SECURITY IN 2050
of Asia, EU27 and West Africa, arable and permanent crops areas are getting close to the maximum cultivable area according to our retained assumption (i.e., suitability index 1 to 4 from the GAEZ project). In these regions and/or countries which are highly populated, there is a scarcity of land for crops. All regions except Brazil/Argentina, Rest of America, North America, FSU and ECS Africa face constraints on the availability of land with good agronomic potential. As in the past, land’s suitability for cultivation has been affected by inappropriate land-management practices, natural factors and climate change. The challenge of maintaining the agronomic potential of land in these areas and in the rest of the world is very important for global and local food security
Access to land has a legal dimension, but it also has social, demographic, political, economic, cultural and biophysical dimensions. Despite land reforms, access to land remains insecure in many countries. In recent decades, growing food demand, increased population density and conflicts have contributed to insecure access to land for millions of people, especially younger people and women, who wish to cultivate land, cannot access land or have access only to areas with a low agronomic potential, or their rights are contested, or they are kicked off their land, or are far away from markets, or their land is contested by other groups etc. Providing secure access to land is of crucial importance for the food security of millions of households.
As far as the distribution of land is concerned, the main challenge seems to be to control the expansion of areas for oil products (for food, feed and energy) and animal feed, and to ensure that land distribution provides healthy diets to the population. Pasture represents 2.2 times more land than arable land and a major challenge is to increase its capacity to store carbon in soils with appropriate management techniques.
Technology-driven intensification has improved the intensity of land use, especially yields, but the most common pattern has been the simultaneous increase in agricultural yields and cultivated areas (Rudel et al., 2009). The relationship between yields and land saving is complex (Stevenson et al., 2013), and technological change is only one parameter in land savings, and profitability for farmers plays a major role in land expansion at a local level (Angelsen and Kaimowitz, 2001). Over the past decade, yield plateaus and even falling yields have been identified in many crops and in many areas, despite the continuous progress in crop genetics and technologies. The negative impacts of the use of inorganic fertilizers and pesticides on human health and the environment are increasingly noted.
Finally, as far as the regulating and supporting services provided by land are concerned, there have been major breaks in the past 50 years. One challenge is the maintenance and development of pollinators and biodiversity, as these have a major impact on food production. Providing agricultural employment in Africa is another important challenge as the proportion of people employed in agriculture remains very high and other economic sectors are not developing.
79
6. The Global ContextMarie de Lattre-Gasquet and Clémence Moreau27
Introduction
As presented in Chapter 1, there are a number of indirect causes of land-use change which operate diffusely. Agrimonde-Terra decided to consider the ’global context’ as a driver of change in the land use and food security system. Three forces were identified in the global context: (a) governance, i.e. political factors, alliances between actors and policies, (b) economic development and resources, i.e. economic growth and inequalities, energy mix, international trade, research and innovation, and (c) human development, i.e. demography, education, culture and ethics.
In this chapter, we first present a number of past and on-going trends as well as uncertainties that have been identified at the global level relative to these three forces, and look at their influence on land use and food security. Then, we describe the hypotheses for 2050 relative to the global context, which have been built by the Agrimonde-Terra team and discussed with the Scenario Advisory Committee.
Upon the recommendation of this Committee, the five “alternative pathways of future societal development, described as shared socioeconomic pathways (SSPs)” (O’Neill et al., 2017) prepared by the climate change research community were not adopted for two reasons. First, they were developed for another purpose as their ultimate goal was “to produce integrated scenarios that will indeed include socioeconomic and environmental conditions as affected by both climate change and climate policy” (O’Neill et al., 2014, p. 389). They describe future conditions that are relevant for adaptation and mitigation of climate change whereas the Agrimonde-Terra’s hypotheses are about the global context for land use and food security. Second, at the time of the development of the Agrimonde-Terra’s hypotheses relative to the global context, the concept of SSPs had started to be developed (O’Neill et al., 2014) but the elements of the SSPs were not yet precise and assumptions were not yet published.
Governance
Fukuyama (2013) defines governance as “a government’s ability to make and enforce rules, and to deliver services, regardless of whether that government is democratic or not”
27. The authors thank Denis Lacroix for his comments on this chapter.
80
LAND USE AND FOOD SECURITY IN 2050
(p.348). Governments are therefore the major actors involved in the governance of the land use and food security system. However, a number of other institutions, such as international and regional organizations and initiatives, private companies, NGOs and philanthropic associations, as well as citizens, are also active. Alliances between these actors are formed and rivalries for power exist. They frame access to land, as well as the priorities for policies, public investments, and regulations related to land, to the environment and climate change, to agricultural production and food processing, and to diets.
❚❚ Political instability and conflicts in the poorest regions of the world
While a number of countries have improved the governance of their land over the past 40 years, a great number of countries remain unstable, subject to frequent coups d’état, protracted conflicts and corruption. They are unable and/or not ready to effectively govern on land use and food security issues. During this period, the number of member countries of the United Nations has grown from 149 to 193, some of them as a result of the division of countries.28 There has also been a rise in the number of inter-ethnic conflicts, terrorism and piracy activities. Armed violence is resulting in the death of many civilians, or their displacement and migration, and their lack of access to land and food. In 2017, the World Bank believed that two billion people lived in countries where development outcomes were affected by fragility, conflict and violence.29 Natural resources are rarely the sole cause of conflicts, but land is implicated in all phases of conflicts, from the outbreak of violence to the resolution, and conflicts lead to land degradation, deforestation, the decrease in cultivated areas and production, and migration. Non-controlled areas are home to illicit trade and armed rebels. In the future, demographic growth, climate change, economic instability and tensions over resources will contribute to the increase in political instability and concentration of fragility in areas where multiple vulnerabilities intersect; a protracted ’ecosystemic crisis’ impacting several generations and causing irreversible damage will develop (Maietta et al., 2017). Such crises are already taking place in the Lake Chad Basin, the Ganges Delta and the Aral Sea. Also, whereas in the past rich countries have contributed to the extraction of resources in fragile areas, in the future they could face significant tensions due to political instability in Africa, the Middle East and Latin America.
❚❚ Globalization, integration, national sovereignty and local governance
From a political and economic point of view, an increasing number of countries are hesitating between integration and national sovereignty. There is also increased demand for recognition of governance at more local levels, be they cities or territories (Caron et al., 2017).
28. http://www.un.org/en/sections/member-states/growth-united-nations-membership-1945-present/index.html (accessed 21 September 2017).
29. http://ida.worldbank.org/theme/conflict-and-fragility (accessed 21 September 2017).
81
6. The Global Context
Global governance is promoted by a number of specialized United Nations (UN) agencies and other international institutions and programmes. The relationships between international institutions and countries are complex. On the one hand, States are members of the UN agencies and other international institutions. States participate in collective work and finance international institutions. However, in the past 20 years, core funding by countries has been decreasing and earmarked contributions have grown. International institutions are now financed with hybrid arrangements that weaken them and lead to a fragmentation of their strategies (Jenks and Topping, 2016). On the other hand, a number of agencies can impose their point of view on countries and even challenge the authority of governments. In some cases, domestic policies are influenced by the recommendations and funding of these international institutions. In other cases, countries do not take into account the recommendations of these reports, or there is a long time span between the publication of the report or the signature of the agreement and the implementation of a policy. While the world was alerted about the limits of resources 45 years ago (Meadows et al., 1972), sustainable development became an objective 30 years ago (Brundtland, 1987), the first global report on climate change (IPCC) was written 26 years ago and the first Conference of Parties on Climate Change was held 21 years ago, these have not yet radically modified the policies of most governments, the strategies of many enterprises, and the attitudes of most farmers and citizens towards resources (Box 6.1 for other major events in the global governance of land use and food security). It is now widely recognized that international institutions need reforms and there are uncertainties about their future capacity to govern and provide strategic directions.
Historically, regional governance has been based on geographical proximity. Countries decided to cooperate for their mutual security, e.g. the European Union and ASEAN. However, trans-national cooperation is now essentially driven by trade. The development of information and communication technologies increases the importance of shared interests or ideology and regional entities can now link cities or territories. Over the past two decades, the world has become increasingly multipolar and no State currently seems able to find a solution to conflicts or impose its view of the world. In the future, regional governance could become more amorphous, of a pop-up nature. Initiatives could be set up to pursue particular purposes and these will be easily disbanded. However, regional cooperation could emerge from people engaging in social and cultural exchange (Jarrar, 2016).
The concept of ’sovereignty’ is used in law, political philosophy and geopolitics. It relies on the idea that entities are impenetrable to one another and are, for that reason, delineated by precise boundaries that define their identity (Latour, 2016). On the one hand, sovereignty is used at the national level to defend the Nation State, national values and protectionism, as well as by groups who share the same ethnic, religious, linguistic or other cultural categories to claim some form of independence. On the other hand, sovereignty is challenged by global issues such as climate change (Latour, 2016).
Also, over the past 30 years, cities and territories have become geographical scales in which new types of governance are developing. Elinor Ostrom (2011) considered that territories

82
LAND USE AND FOOD SECURITY IN 2050
Box 6.1. Some major events in the global governance of land use and food security.
1945 FAO: creation of the Food and Agriculture Organization
1961 World Food Programme is created because of concern about potential world food shortage.
1963 FAO and WHO: creation of the Codex Alimentarius Commission for harmonized interna-tional food standards to protect the health of consumers and ensure fair trade practices
1964-67 GATT: Kennedy round Wheat Trade Convention (WTC) and Food Aid Convention (FAC)
1972 Club of Rome: publication of ’Limits to growth’
1973-79 GATT’s Tokyo round: increased trade liberalization but modest agreement on agriculture
1973 First recognized world food crisis creation of Committee on Food Security (CFS)
1979 FAO: World Conference on Agrarian Reform and Rural Development
Brundtland Report on environment and development
1990 IPCC First Assessment Report
1992 Rio Earth Summit
Convention on Biological Diversity
1994 United Nations Framework Convention on Climate Change (UNFCCC)
United Nations Convention to Combat Desertification (UNCCD)
1986-94 GATT’s Uruguay round: agreement on agriculture, limiting domestic support and export subsidies, prohibiting non-tariff import restrictions, and establishing special and diffe-rential treatment for developing countries
1995 WTO: creation of World Trade Organization
First Conference of Parties (COP 1) on Climate Change
1996 FAO: “Food security exists when all people, at all times, have physical and economic access to sufficient, safe and nutritious food which meets their dietary needs and food prefe-rences for an active and healthy life”
2000 Adoption of the eight Millennium Development Goals (MDGs)
2001-05 Millennium Ecosystem Assessment (MEA)
WTO’s Doha round: negotiations on agriculture
2005-08 International Assessment of Agricultural Knowledge, Science and Technology for Development (IAASTD)
2008 United Nations Collaborative Programme on Reducing Emissions from Deforestation and Forest Degradation (REDD)
2012 FAO – CFS: Voluntary Guidelines on the Responsible Governance of Tenure of Land, Fisheries, and Forests in the context of National Food Security
2013 WTO’s Bali package: agreement to negotiate a permanent solution to public stockholding for food security purposes, call for more transparency in tariff quota administration, expan-sion of the list of General Services and declaration to reduce all forms of export subsidies
2015 WTO’s Nairobi package: elimination of agricultural export subsidies by developed countries, except for a handful of agricultural products; developing countries have longer periods to do so.
2016 World Forum on Access to Land and Natural Resources
Adoption of 17 Sustainable Development Goals (SDGs)
83
6. The Global Context
are a prime area for applying new governance processes situated somewhere between collective action and public action, and at the interface between the State and markets.
As far as land is concerned, there is no global governance or international convention related to the issue because “land is seen as too politically sensitive or too technically complicated to lend itself to meaningful resolution” (UN Interagency Framework Team for Preventive Action, 2012). Nevertheless, ’Voluntary Guidelines on the Responsible Governance of Tenure of Land, Fisheries and Forests in the Context of National Food Security’ (FAO, 2012) were developed through a broad partnership of international, regional and national organizations. They outline principles and practices that governments can refer to when making laws and administering land, fisheries and forest rights. Further, a World Forum on Access to Land was held in 2016 at the initiative of associations. Land governance is mostly conducted at national level. However, there is also the promotion of land governance at the territorial level as well as ’terroir’ or origin-linked products. As far as food security is concerned, a large number of institutions are active on the issue but “none has the authority and legitimacy to take responsibility for all aspects or to coordinate the various institutions and manage potential conflicts” (Fouilleux et al., 2017).
❚❚ Changes in the role of governments
Traditionally, governments have three main responsibilities: “To provide goods and services (e.g., education and health care); regulate the interactions within society and the economy; and redistribute income (e.g., through the tax and transfer system). Among many other responsibilities, governments are also responsible for managing risks, ensuring fairness in society, fighting corruption and protecting the environment. To finance these activities, governments raise money in the form of revenues (e.g., taxation) and/or through borrowing” (OECD, 2017). Over recent decades, a number of countries have made efforts to transform the management of their public sector, for example, by promoting the adoption of private sector practices, reducing the costs of the public sector, transferring traditional public sector responsibilities to the private sector or to decentralized services, developing a culture of performance, evaluation and impact, encouraging holistic strategies and coordinated actions etc. Evidence of declining public trust has also been seen for some time in declining voter turnouts, the growing appeal of populist and extremist ideologies in some regions and, above all, in negative perceptions of the government as an institution prone to corruption (Bertucci, 2006). For the future, major uncertainties are related to the capacity of governments to regain trust, to decrease debts and adjust budgets to new expenses, and to adapt to the digital age.
84
LAND USE AND FOOD SECURITY IN 2050
❚❚ Policies: From Millennium Development Goals to Sustainable Development Goals and land use policies
The evolution from the eight Millennium Development Goals (MDGs) through to the 17 Sustainable Development Goals (SDGs) represents an important change in the global governance of development issues (Box 6.1). The eight MDGs emanated from UN Summits and Conferences of the 1990s and were endorsed in the United Nations Millennium Declaration of 8 September, 2000. They formed a blueprint for action agreed by all of the world’s countries and leading development institutions to eradicate poverty, illiteracy, hunger, discrimination against women, unsafe drinking water and degraded environment. They reflected widespread public concern about the issues and marked a historic and effective method of global mobilization (Sachs, 2012). During the MDG era, the number of hungry people in the world declined but “much of humanity’s progress has come at a considerable cost to the environment. High-input, resource-intensive farming has contributed to deforestation, water scarcity, soil depletion and high levels of greenhouse gas emissions” (FAO, 2017a, p. 14).
Beginning in 2016, 17 SDGs and 169 targets to wipe out poverty, fight inequality and tackle climate change over the next 15 years were adopted. The SDGs mark some changes in global governance because they were developed after wide consultation with people from all sectors of society. The notion of developed and developing countries has changed – Brazil, India, and China are increasingly influential in global politics – and connections between places have rapidly developed. The SDGs do not focus on the end goal alone, but also on the means used to achieve it. There is recognition that natural resources (including land use), food and livelihoods cannot be looked upon separately. Interconnections between the goals are recognized and taken into account. There is an attempt to break the ’silos approach’ as well as the lack of coordination between sectors and policies, which means that governments will need to have a more holistic and coherent approach to problems and will need to monitor and evaluate policies (OECD, 2017). All countries – whether they are upper, middle or low income – are concerned by the SDGs and have to make tangible improvements to the lives of their citizens. There are uncertainties about delivering the SDGs by 2030, globally and in particular countries. It will depend on many factors, such as the ability to connect local innovation capacity with global parameters (Leach et al., 2012), to break the silos in government actions, to make stakeholders accountable and to find the necessary financial resources.
In relation to these goals, there has been an evolution in the ’measure’ of governance. Starting in the early 1990s, expert thinking in the international development community focused on the concept of ’good governance’ with the expectation of a strong positive correlation with improved economic performance. Large investments were made to improve public administration and transparency and broaden democratic participation. However, there was a progressive realization that policy bottlenecks and political conflicts that impede good governance are complex and could not be easily resolved.
85
6. The Global Context
Three aspects of governance are now increasingly considered: good governance (the processes of decision-making and their institutional foundations), effective governance (the capacity of countries to pursue sustainable development) and equitable governance (distributive outcomes) (Bierman et al., 2014). Also, official development assistance (ODA) which used to encourage convergence between less and more developed economies is increasingly focused on protecting global public goods and on delivering SDGs (Severino and Ray, 2009). It is confronted with the interventions of a variety of new actors, especially large private foundations and the private sector, as well as local interventions.
❚❚ Growing role of large corporations in global governance
There is a great variety of enterprises in the world, both formal and informal. There are an estimated 125 million formal micro-small-medium enterprises (Kushnir et al., 2010) and 100,000 multinational enterprises (MNEs) and among the latter, 1,500 are State-owned MNEs which own more than 86,000 foreign affiliates (UNCTAD, 2017). Large corporations – industrial, financial and service companies – are major political, economic, environmental and cultural forces in the world. Until the end of Cold War, most multinational corporations focused their strategies on influencing home and host governments and policies (Gilpin, 1975). Since then, many countries have introduced policies to attract potential investors. Information technologies and management capacities have allowed firms to maximize efficiencies, to set up global supply chain across countries, to improve productivity and also to gain bargaining power vis-à-vis governments (Detomasi, 2007). As these companies benefit from the lack of fiscal coordination between countries and “play by the rules they are given” (Reich, 2008), they often pay as little tax as possible and can endanger Nation States’ sources of revenue. They are accountable only to their own self-selected boards and “rationalize their actions as necessary to address market failures” (Birn, 2014), and promote new technologies, innovation, and management techniques. The influence of MNEs and of their affiliates on global governance is also found in the public-private partnerships they form. Furthermore, over the past decade, private companies and their philanthropic branches, foundations and trusts are increasingly implicated in the humanitarian sector as funders and direct implementers (Maietta et al., 2017).
Agro-industrial, trading and food processing companies, alongside large supermarkets and digital companies, as well as investments funds, are major actors in the global land use and food security system. In past decades, they have provided modern inputs, technology, machinery and skills to modernize production techniques, which have contributed to higher yields, resistance to pests and diseases, easier work for farmers and increased food availability. However, over time, they have also contributed to the specialization and standardization of production, and the use of inputs which may have negative impacts on soils, water and health. They have led to a homogenization of cultivated varieties, reduction in the use of local varieties and their exchange, increased erosion of biological diversity, heavy debts for farmers and market dependence. Private companies are the main
86
LAND USE AND FOOD SECURITY IN 2050
large-scale buyers of land, followed by stock exchange-listed companies and investment funds (Nolte et al., 2016). These companies promote “both productionist and productivist visions of food security. They are organized globally and offer global technical solutions for a problem presented as a global one, using food security as a justification for their business by citing the need to increase productivity levels to feed nine billion people” (Fouilleux et al., 2017, p.11). They have contributed to improved access to food and nutrition transition (Chapter 8).
❚❚ Global activism by civil society groups
A great variety of NGOs, civil-society groups, churches and faith-based organizations, producers’ and consumers’ associations are involved in global governance, including land use and food security issues. They gain access to political arenas. As far as land is concerned, there are NGOs which are influential at international level (e.g., La Via Campesina, the Farmer Network, COPA-COGECA in the European Union, Agricultural Producers’ Organizations of West Africa – ROPPA) and some of them strongly oppose productivism and agribusinesses. Other groups concentrate on the rights of indigenous populations on their land. As far as food security is concerned, the approach of these groups is “to re-politicize the debate by asking questions about how food is produced and by whom” (Fouilleux et al., 2017, p. 13). A number of associations and NGOs actively campaign to influence political and economic actors and their strategies. NGOs, for example, have played a key role in shaping new private regulatory schemes that have emerged (Busch, 2007).
❚❚ Development of alliances between a wide variety of actors
A number of alliances of public and private actors are formed. For example, there are alliances of public and private actors that “interact with traditional public forms of land use regulation, leading to ’hybrid’ interventions” (Lambin et al., 2014, p. 129). Their interventions can take the form of instruments such as “eco-certification, geographical indications, commodity round tables, moratoria, and payments for environmental services” (Lambin et al., 2014). There are many other examples, too. For instance, environmental performance standards and standards for socially responsible production are established by NGOs and industry associations (Gulbrandsen, 2012). Non-State actors “such as mining companies, conservation NGOs, consultants, scientists and foreign aid donors” influence the State in order to control and secure forests for wealth generation or biodiversity conservation (Corson, 2011). The ’New Alliance for Food Security and Nutrition’ has been formed by G8 countries led by the USA, several African governments and transnational corporations and aims to facilitate foreign investment in Africa without any obligations to protect local farmers. Another example is social networking, which enables citizens to coalesce and leads to open, participatory and peer-driven power (Heimans and Timms, 2014).
87
6. The Global Context
Economic development and resources
❚❚ Global economic growth and structural transformation of economies
The global per capita GDP has increased almost five-fold in the 20th century and tripled over the past 30 years with the average global GDP/capita (in constant 2010 US $) climbing from $3,800 (1961) to $9,516 (2010) and 10,283 (2015).30 Global employment grew at an average annual rate of 1.7% between 1991 and 2007, but since then employment growth has slowed to 1.2% per annum. For the future, there are questions about the evolution of the economy, and unemployment could continue to rise as the labour force expands (ILO, 2015).
The sectoral and spatial distribution of economic activities has also changed. According to UNIDO (2013), in developing countries, the percentage of GDP originating in agriculture was 37% in 1950, 21% in 1980 and 16% in 2005. The percentage of GPD originating in manufacturing rose from 12% in 1950 to around 17% in 1980 and 15% in 2005 (UNIDO, 2013). In advanced countries, the percentage of GDP originating in agriculture fell from 16% in 1950 to 4% in 1980 and 2% in 2005. The percentage originating in manufacturing fell from 23% in 1980 to 16% in 2005. For services, the percentage climbed from 60% in 1980 to 71% in 2005. However, manufacturing and agriculture still play a major role in employment. According to ILO modelled estimates starting in 1991, at this date 43.4% of the world’s population was employed in agriculture, 23.7% in industry and 42.1% in services; in 2015, the estimates were 27.2% for employment in agriculture, 24.1% in industry, and 42.1% in services. The decrease in the percentage of the population employed in agriculture has been particularly high in South East Asia and the Pacific, in Eastern Asia and Latin America. In 2015, the percentage of the population employed in agriculture was about 57.6% in sub-Saharan Africa, 29% in Northern Africa, 33.3% in South East Asia and the Pacific, 18.5% in Eastern Asia, 14.2% in Latin America and the Caribbean, 4.5% in European Union 28, and 1.7% in Northern America. In the future, agricultural employment, like the other economic sectors, could change due to the development of automation technologies.
Productivity gaps between agriculture and other sectors can contribute to an explanation of the differences between countries in agriculture’s contribution to GDPs and employment shares. These gaps are mainly related to the levels of technology currently applied in the agricultural sector: “At the global level, agricultural work remains largely manual and mechanization is limited. As a result, agricultural productivity has been decoupled from other types of activities, resulting in lower agricultural incomes, which are also impacted by changes in relative prices between agricultural and non-agricultural goods. The consequence is that the value added of other sectors rises much faster than in the
30. https://data.worldbank.org/indicator/NY.GDP.PCAP.CD?page=6.

88
LAND USE AND FOOD SECURITY IN 2050
agricultural sector, which, nevertheless, continues to employ a significant proportion of the working population. Given the importance of agriculture in rural areas, these processes explain the income gap between towns and the countryside and account for the broad extent of rural poverty” (Losch, 2016, p. 7).
Also, since the 1970s, policies have been liberalized, there has been a greater concentration of assets and a growing role for financial markets. This includes deregulation for banks and equity funds and rapid financial innovation (Crotty, 2009) which have contributed to economic growth but also to growing debts for all economic actors and a major financial crisis in 2007-08. In the mid-2015, the total global debt-to-GDP ratio is significantly higher than it was before the 2008 crisis. Whereas advanced economies got indebted before the 2008 crisis, in emerging and developing countries aggregate debt levels have increased sharply since that period and represent a major risk for the future (WEF, 2018). The debt level of enterprises and governments has also increased (WEF, 2018). These processes have major impacts on agriculture and the rural economy in developing countries, especially off-farm diversification and on-farm specialization (Losch et al., 2012). Also, new financial models for agriculture are being developed (Kloeppinger-Todd and Sharma, 2010). Banks and investment funds are increasingly engaging in commodity and farmland investments, and conventional agrifood firms are acting like financial institutions (Clapp et al., 2016). Land is increasingly considered a financial asset, and that could impact the land market dynamics (Fairbairn, 2014; Ducastel and Anseeuw, 2017). Food chains are increasingly managed to facilitate mass production and standardization, and the development of trade (McCullough et al., 2008; Rastoin and Ghersi, 2010). Nevertheless, a variety of agrifood systems remain (Fournier and Touzard, 2017) (Chapter 8).
❚❚ Income and wealth disparity
Per capita income has diverged across countries for decades, but since the 1990s and in particular since the 2000s, there is evidence of convergence at the global level (UN-DESA, 2015). The convergence between rich and poor countries has been driven by Asian countries, first China and India, and now the whole Asian region. However, in East Asia, widening income inequality gaps between inhabitants of rural and urban areas have been linked to higher incomes associated with good education and rapid industrialization. Over the past decade, income growth has been seen in Latin American and the Caribbean. Africa and Oceania have hardly contributed to global convergence. Nevertheless, the top richest 1% in the world has more wealth than the rest of the world combined (Piketty, 2013) and sub-Saharan Africa and South Asia account for more than 80% of the world’s poor. Almost three-fifths of the world’s extreme poor are concentrated in five densely populated countries: Bangladesh, China, the Democratic Republic of Congo, India and Nigeria.31 In all regions of the world inequality in income distribution within countries
31. https://globalmillennials.org/poverty

89
6. The Global Context
compels some citizens to live in poverty. In OECD member states, since the 2007-2008 recession, inequality levels are at their highest since data collection started (OECD, 2015). The same trend is observed across many countries across the world.
❚❚ Production: energy and water use, and digital transformation
Wood and later coal, oil and natural gas have played an enormous role in the development of society. Nuclear energy, renewable sources of energy (hydroelectric, solar, wind and biomass) and non-conventional hydrocarbons started to play a role much later. Global energy consumption has grown rapidly over the past 40 years in response to economic development and demographic growth, especially in emerging economies such as China and India. The future availability of fossil fuels (especially oil and natural gas) and their impacts on greenhouse gas (GHG) emissions are leading to major questions about the means to reduce their production and use (Stern, 2006). Fossil fuels are used in many agricultural and food processing activities, such as mechanization, irrigation, drying and cooking, and the production of fertilizers and herbicides. Smith et al. (2007) have estimated that agriculture accounted for 10-12% of total global anthropogenic GHG emissions, and that agricultural CH4 and N2O emissions increased by nearly 17% from 1990 to 2005.
Biomass energy includes garbage, wood, landfill gases and biofuels. First-generation biofuels are produced from traditional food and feed crops. World biofuel production grew five-fold between 2001 and 2011 but is still a minor source of energy. However, its efficiency, impact on land and forest use, food prices and GHG emissions remain very controversial. The steepest rise in biofuel production occurred in 2007-2008, concomitantly with a sharp rise in food commodity prices (HLPE, 2013), quickly followed by food riots in the cities of many developing countries. Research is currently being conducted on the development of second-generation biofuels produced from various sources of biomass which do not directly compete with food and feed crops and whose production is more efficient (Guyomard et al., 2011).
Water is used in industry and mining, in agriculture (including for livestock), in households, but also for energy production and ecosystems’ livelihood. The first three uses of water have grown much faster than population growth over the last forty years. In 1960, 2,000 km3 of water were used every year; since 2000, the annual consumption of water is about 4,000 km3 (see Aquastat32), which is more than capacities of renewal. Around 20% of total water used globally is from ground water resources (renewable or not), and this share is rising rapidly, particularly in dry areas. At global level, the withdrawal ratios are 69% agricultural, 12% municipal and 19% industrial. However, a large percentage of water withdrawn by agriculture is consumed by vapor-transpiration whereas the industry or domestic uses restitute most of the water they use. Agricultural use is the highest in Asia (81% in 2010) and the lowest in Europe (25%). Over the years, uses of water by agriculture
32. http://www.fao.org/NR/WATER/AQUASTAT/water_use/indexfra.stm

90
LAND USE AND FOOD SECURITY IN 2050
and industry have become a major source of pollution of groundwater, watercourses and soils. Water resources have become a real political and economic issue for governments of emerging and developing countries, and a major source of potential conflicts.
Over the past two decades, automation and digitalization have had an impact on production in all economic sectors as well as on patterns of consumption (less ownership and more pay-per-use) and partnerships. Agriculture and the food industry are quickly entering the era of platform economics. Some digital platforms are a meeting place for farmers and consumers (short supply chains), for distributors and farmers (for inputs, spare parts or small farming equipment), for the sharing of equipment, for promoting local production and combating waste, for crowdfunding etc. In the future, data and intelligence could be at the centre of business models; data qualification, ownership and security will become crucial, including for land use and food processing.
❚❚ Changes in trade
International trade in goods and services has gone from about 124 billion US$ in 1960, to 4 trillion US$ in 1995, to 24 trillion US$ in 2014, and has slightly declined since, which may be a sign a diminishing interdependence and integration between countries (UNCTAD, 2015b). At the same time there has been the development of (a) a multilateral trading system promoting liberalization, elimination of tariffs and quotas, but also facilitating the development of non-tariff trade barriers such as the Sanitary and Phytosanitary (SPS) agreement, Technical Barriers to Trade (TBT) agreement and the Agreement on Trade-Related Intellectual Property (TRIPs) (Box 6.1); and (b) preferential and regional trade agreements and international trade corridors; these were traditionally in Europe and North America, but have shifted to the Asia-Pacific region. Also, there has been the development of Fair Trade, which seeks to re-engineer value chains between small producers in developing countries and buyers, in order that a greater proportion of the overall rents accrue to those who provide the inputs (Nicholls and Huybrechts, 2017). Trade is a key element in land-use changes and food security strategies, a driver of changes in ecosystems (Pace and Gephart, 2017) as well as a vector for the introduction of alien species (Hulme, 2009). Perceptions of future food and resource limitation are causing changes in trade (Pace and Gephart, 2017), especially as structural production surpluses have nearly disappeared and there are no more big players with large stocks (Daviron and Douillet, 2013).
Global agricultural trade has grown much slower than trade in other products. Farm products accounted for more than 30% of all merchandise traded globally until 1960, but since the early 2000s, its share has averaged less than 9% (Anderson, 2010). The value of global agricultural exports nearly tripled between 2000 and 2012, while agricultural exports increased by about 60% in volume terms over the same period (FAO, 2015a). The geography of agricultural trade is changing quickly (Daviron and Douillet, 2013). In Asia, imports as a share of apparent consumption increased regularly between 1960 and 2004 (from 4% to 14%) (Anderson, 2010) and Asia has become the fastest growing net importer
91
6. The Global Context
since then, driven especially by China, South East Asia and India. The Latin American share of agricultural production was stable (around 25%) between 1960 and 2004 (Anderson, 2010) but over the past decade, Latin America has become the largest net exporter of food, with significant production growth outstripping sustained consumption growth (FAO, 2015a). North America was the second largest net exporter but has lost its domination. Eastern Europe and Central Asia are shifting from being net importers to becoming net exporters (FAO, 2015a). Sub-Saharan Africa’s net imports have been growing as food production is unable to keep pace with growing population and demand.
❚❚ Research and innovation: growing role of the private sector
Over the past 40 years, scientific breakthroughs and technological and organizational innovations have fuelled substantial gains to the economy, and they are continuing to do so to the point that experts say that we are on the brink of a technological revolution that will fundamentally alter the way we live, work, and relate to one another. Agriculture and food systems have been transformed by technological advances in material and life sciences which have led to major improvements, for example, genetic engineering, vaccines for livestock, Integrated Pest Management (IPM), minimum tillage systems, geographical information systems, and robotic systems.
In the agri-food sector, research and development in the public and the private sectors contributed to major gains in agricultural productivity in industrial countries after World War II, and to the spread of the Green Revolution beginning in the 1960s, allowing food output to more than keep pace with demand. Over the years, the geographical distribution of Agricultural Research and Development (Ag R&D) has changed. The governments of middle-income nations are now investing more in agriculture research than those in high-income ones, and the gap between spending by high-income and low-income countries is widening. Rich countries accounted for 56% of global public sector spending on Ag R&D in 1960, but only 47% in 2011 (Pardey et al., 2016). Globally, private sector spending on agricultural research and development is catching up with public sector spending. “In 2011, an average of 52.5% of the research on crop breeding, informatics, fertilizers, pesticides and food technologies in rich countries was being done by private firms (in 1980, the figure was 42%). For middle-income countries, the private proportion of domestic spending was 37% in 2011 (up from 19% in 1980). Middle-income countries’ share of private AgR&D spending in 2011 was 35.5%, up from close to 16% in 1980” (Pardey et al., 2016, p. 302). The growing role of the private sector means that intellectual property rights in agriculture, such as plant patents, plant breeders’ rights, utility patents, trade secrets, trademarks and geographical indicators, are going to play a major role and influence who will benefit from the research. It also means that the pursuit of public research leading to common goods and the capacity of governments to fund public research are going to be major challenges in the future (Piesse and Thirtle, 2010).
Furthermore, for many decades, society in richer countries has had total confidence in the capacity of science and technology (S&T) to overcome many problems. This situation
92
LAND USE AND FOOD SECURITY IN 2050
is changing because S&T now involves diverse sets of actors which leads to a complex distribution of power and struggles over which directions should be taken (EFS, 2013). Youth interest in science is declining and budget constraints are triggering tensions about the governance of science and technology. The perceptions of S&T’s impacts on society and the environment are increasingly diverse.
Human development
❚❚ Demography: concentration of population growth in Asia and Africa
The world’s population almost quadrupled in the twentieth century, rising from 1.6 to 6 billion people. More precisely, it has gone from 3 billion in 1960 to 6.96 billion in 2010, and in 2016, the world population reached about 7.4 billion.33 The global population growth rate is declining: this growth rate was 2.1% in the 1960s and 1.2% in the 2010s. In 2016, Asia represented about 59.7% of the world’s population (55.2% in 1950), Africa accounted for 16.4% (9.1% in 1950), OECD countries for 15.3% (29% in 1950) and Latin America and the Caribbean for 8.6% (6.7% in 1950). The growth of the population is therefore concentrated in Africa and Asia.
The average annual rate of change of the urban population has tended to decrease at world’s level: 2.99% for the period 1960-1965, down to 2.20% for the period 2005-2010, and 2.05% for the period 2010-2015. It is decreasing in all regions of the world, including Africa where it remains however very high (3.55% for the period 2010-2015) and Asia (2.5% for the period 2010-2015). The average annual rate of growth of the rural population in less developed regions has fallen drastically (from 0.72% in 1960-1965 to 0.21% in 2010-2015), but in sub-Saharan Africa it has remained very high (2% for the period 1960-1965 and 1.86% for the period 2010-2015).
As a share of the world’s population, international migration is increasing slightly faster than the world’s population. International migration represents 3% of all people today, compared with 2.6% in 1960, according to United Nations statistics. South-South migration flows (i.e. across developing countries) are growing compared to South-North movements (from developing to developed countries) (UN-DESA, 2017). The vast majority of refugees are hosted in Asian and African countries (UN-DESA, 2017). Out-migration from rural regions is also a major trend that leads to a decrease in rural labour. Once they get out of rural areas or move across borders, many migrants send money (remittances) back to families in their countries of origin; the overall annual flow of such remittances has nearly tripled since 2000 (Connor et al., 2013). Remittances help to make vulnerable communities more resilient to shocks (Lambin and Meyfroidt, 2011); they give receiving
33. https://esa.un.org/unpd/wpp/Download/Standard/Population/

93
6. The Global Context
groups the capacity to opt for more risky or costly agricultural choices. Migrations from rural areas can lead to labour shortages and therefore to shifts to less labour-intensive practices (Mendola, 2008; Radel et al., 2010) or to adoption of monoculture practices (Schmook and Radel, 2008).
Unprecedented changes are occurring worldwide as fertility and mortality rates decline in most countries and the population ages (236 million people over 60 in 1960; 769 million in 2010, and 969 million in 2015). According to the United Nations Population Fund, the proportion of people aged 60-plus is already higher in less developed regions than in developed regions; it is rising at a fast pace in the developed regions which have little time to adjust to the adverse impacts of ageing. The youth (ages 10 to 24) constitutes more than 1.8 billion of the world’s population and is at its highest ever level; 226 million youth aged 15-24 live in Africa and represent 19% of the global youth. For Africa, youth represents both an opportunity and a challenge: they need to be educated and employed, fed in a healthy fashion and cared for, but they are also full of energy, creativity and talents.
The levels of development have improved all over the world. UNDP (2016) reports that “every developing region’s Human Development Index (HDI) value has increased considerably between 1990 and 2015, although progress has been slowing since 2010. This reflects important advances not only in income, but also in health and education. Between 1990 and 2010, the aggregate HDI value of the least developed countries increased by 46%.” (UNDP, 2016, p. 26). The global extreme poverty rate (1.90 $ a day) has fallen from 60% in 1990 to 3.5% in 2013 in East Asia and the Pacific, and from 44% to 15% in South Asia during the same period (UNDP, 2016).
❚❚ Persistence of global divide in education and gender inequity
Since the 1970s, there has been a strong focus on primary school enrolment in developing countries and secondary school enrolment has also progressed. Nevertheless, a great divide remains between the poorest and richest countries: in 2010, about 33% of the population over the age of 15 had no schooling in South Asia and sub-Saharan Africa and 23.8% in the Middle East and North Africa (Barro and Lee, 2010). However, significant progress has been made by developing countries in terms of reducing gender inequality in education among the overall population over the age of 15; for example, the ratio of female to male average years of schooling increased from around 62.5% in 1950 to 81.2% in 1990 and 85.9% by 2010 (Barro and Lee, 2010). This situation has an impact on land use and food security as education is a necessary, though not sufficient, driving force for alleviating hunger and poverty. Better education levels can facilitate social and technological change.
More generally, women’s participation in the labour force is significantly less compared to men; women have substantially lower salaries for the same type of work and a higher percentage of women are employed in vulnerable or irregular jobs. In no country do women have the same opportunities as men to participate in economic and social decision-making processes. In agriculture, the population is ageing and increasingly feminized as men migrate
94
LAND USE AND FOOD SECURITY IN 2050
for longer periods and for further destinations. Data must be considered with caution but FAO estimated that in 2010, 43% of the workforce in agriculture was feminine. There are however large differences between countries, and the share of women’ employment in agriculture varies from crop to crop, from activity to activity and from age group to age group (de Schutter, 2013). Women are often farm workers and sometimes independent food producers, and they face then different kinds of issues (de Schutter, 2013).
❚❚ Importance of culture in land use and food consumption
The importance of culture in land use has been widely recognized thanks to the Millennium Ecosystem Assessment (MEA, 2005b) which posits that “people are integral parts of ecosystems and that a dynamic interaction exists between them and other parts of ecosystems, with the changing human condition driving, both directly and indirectly, changes in ecosystems and thereby causing changes in human well-being”. A number of the Millennium Ecosystem sub-global assessments found that human cultures, knowledge systems, religions and social interactions have been strongly influenced by ecosystems; how societies and individuals organize landscapes, production and consumption are also influenced by behavioural factors related to culture, ethics and values. The International Assessment of Agricultural Knowledge, Science and Technology for Development (IAASTD) (McIntyre et al., 2009) has played a major role in the assessment of the importance of local and traditional knowledge in agriculture. Local, traditional and indigenous communities are increasingly recognized as a reservoir of knowledge about agricultural practices and diets.
Future global contexts in 2050
The general purpose of the narratives about the political, economic and social contexts is to provide broad descriptions of future conditions that will indirectly but strongly impact the land use and food security system. Five hypotheses have been built and their main characteristics are presented in Table 6.1. Each column in Table 6.1 describes one hypothesis for the global context in 2050, which is a combination of assumptions of change in the three identified forces: governance, economic development and resources, and human development. Below are very brief narratives for each hypothesis. They appear in greater detail in the section ’How did we get there?’ of the narratives of the Agrimonde-Terra scenarios (Chapter 13).
As far as demography is concerned, Agrimonde-Terra adopted the same assumption for all hypotheses for the global context in 2050. Based on the median projection provided by the United Nations (2015 revision), it is assumed that the world population will reach 9.7 billion people in 2050. The situation between 2010 and 2050 will vary in each region: stability in the European Union, Former Soviet Union and China; strong increases in West Africa, and in East, Central and South Africa (+192% and +155%, respectively), in North Africa and the Near and Middle East (+72% and +70%, respectively), and to a lesser extent in India (+45%) (Chapter 14).
95
6. The Global Context
When a foresight exercise on land use and food security is carried out at a regional, national or territorial scale, assumptions about governance, economic development and resources, and human development should also be built at the scale that is considered.
❚❚ Hypothesis 1: Sustainable and cooperative world
There is a major rupture in this hypothesis: a change in the attitudes of institutions and individuals which leads to cooperation towards sustainability. States cooperate amongst themselves and with businesses, civil society organizations and international institutions and they all make strong commitments towards the mitigation of climate change, regulation of the nutritional quality of food products, health and a shift to a green and collaborative economy. Over the years, energy, climate, agriculture, logistics and food policies are integrated and converge. Land reforms are adopted and there is secure access to land for all. Policies also support the reduction of energy consumption and GHG emissions; they place limits on transport, improve carbon sequestration, encourage efficient use of inputs which are harmless for the health, advocate for consumer restraint and are people-centred. In developing countries, with technology transfer, technical assistance and financial resources, efficient energy production systems are established which generate little pollution and operate on small scales. Agri-food companies are committed to improving the nutritional quality of their food products, diversifying production and limiting their ecological footprint. Efforts are made to reduce losses and waste. Economic growth is moderate (in 2050, per capita GDP is $20,000 in 2050). Trade is liberalized but regulated through social and environmental norms. In developed and developing countries, research is highly participative, and innovation is technological, social and organizational. The fight against poverty is multifaceted and world inequalities are reduced.
❚❚ Hypothesis 2: Regionalization and energy transition
The major break that leads to this hypothesis is that States join and form large, supranational blocs to face together recurrent crises caused by climate, social and economic change, and to implement a ’food sovereignty and subsidiarity’ principle based on regional food supplies and supported by businesses and civil society organizations. Countries regroup by regions and globalization is abandoned.
Policies are steered towards regional issues. Each region uses its own energy resources. In regions with little fossil fuel, large quantities of renewable energy, especially biomass energy, are produced and efforts are made to reduce energy consumption. Economic growth is moderate (per capita GDP is $20,000) with a strong intra-regional trade. Trade between regions is limited. Investment in research varies according to the region. Regions with more limited financial resources concentrate on social innovation and on modernizing organizations, allowing them to remain competitive in a digital world. Within each region, countries network to improve education and research.

96
LAND USE AND FOOD SECURITY IN 2050
Tab
le 6
.1. C
har
acte
rist
ics
of t
he
five
hyp
oth
eses
for
fu
ture
glo
bal
con
text
s in
20
50
.
Hypo
thes
es
for 2
050
Sust
aina
ble
and
coop
erat
ive
wor
ldRe
gion
aliz
atio
n an
d en
ergy
tran
sitio
nEc
onom
ic a
nd p
oliti
cal
fragm
enta
tion
Conv
entio
nal
deve
lopm
ent l
ed b
y m
arke
t for
ces.
Dom
inan
ce o
f non
-Sta
te
acto
rs
Gove
rnan
ce
Coop
erat
ion
amon
g St
ates
, bus
ines
ses,
civ
il so
ciet
y or
gani
zatio
ns a
nd
inte
rnat
iona
l ins
titut
ions
.
Stat
es jo
in to
form
larg
e,
supr
anat
iona
l reg
iona
l bl
ocs
to fa
ce re
curr
ent
cris
es w
hile
pre
serv
ing
thei
r ow
n cu
ltura
l sp
ecifi
citie
s. C
ompe
titio
n am
ong
regi
ons
rem
ains
.
Man
y co
untr
ies
have
un
stab
le g
over
nmen
ts,
unab
le to
cop
e w
ith
cris
es. L
ocal
com
mun
ities
sh
are
and
man
age
reso
urce
s.
Allia
nces
bet
wee
n m
ultin
atio
nal c
ompa
nies
, in
vest
men
t fun
ds a
nd
inte
rnat
iona
l ins
titut
ions
. W
eak
Stat
es.
Dom
inat
ion
of h
ybrid
an
d ag
ile c
oalit
ions
m
ade
up o
f NGO
s, M
NEs,
fo
unda
tions
, ass
ocia
tions
an
d lo
cal a
utho
ritie
s.
Gove
rnm
ents
try
to
coor
dina
te th
eir a
ctio
ns.
Cohe
rent
and
inte
grat
ed
polic
ies
and
regu
latio
ns.
Polic
ies
base
d on
regi
onal
in
tere
sts
Few
pol
icie
sFe
w p
olic
ies
or in
fluen
ced
by th
e in
tere
sts
of
com
pani
es.
Polic
ies
for c
limat
e ch
ange
miti
gatio
n an
d to
fig
ht p
over
ty
Econ
omic
de
velo
pmen
t an
d re
sour
ces
Mod
erat
e ec
onom
ic
grow
th. S
hift
to a
circ
ular
an
d gr
een
econ
omy.
Ge
ogra
phic
al p
roxi
mity
be
twee
n pr
oduc
ers
and
cons
umer
s. D
iffer
entia
tion
of p
rodu
cts,
qua
lity.
Aver
age
GDP/
cap:
$2
0,00
0.
Mod
erat
e ec
onom
ic
grow
th. P
rinci
ple
of
’food
sov
erei
gnty
and
su
bsid
iarit
y’ a
t the
re
gion
al b
loc
leve
l.
Aver
age
GPD/
cap:
$2
0,00
0.
Low
eco
nom
ic g
row
th.
Prod
uctio
n an
d pr
oces
sing
mos
tly c
arrie
d ou
t by
smal
l uni
ts a
nd
exch
ange
d lo
cally
. Sev
ere
natio
nal d
ebts
.Av
erag
e GD
P/ca
p:
$18,
000.
Stea
dy e
cono
mic
gro
wth
. Su
bsid
ized
con
sum
ptio
n fo
r the
poo
rest
in u
rban
ar
eas
to a
void
soc
ial
tens
ions
. Agr
o-in
dust
rial
food
sys
tem
.Av
erag
e GD
P/ca
p:
$24,
000.
Econ
omic
gro
wth
at
glob
al le
vel b
ut e
cono
mic
si
tuat
ion
of g
roup
s an
d in
divi
dual
s de
pend
on
thei
r cap
acity
for
netw
orki
ng. S
prea
d of
ICT.

97
6. The Global Context
Tab
le 6
.1. C
onti
nu
ed.
Hypo
thes
es
for 2
050
Sust
aina
ble
and
coop
erat
ive
wor
ldRe
gion
aliz
atio
n an
d en
ergy
tran
sitio
nEc
onom
ic a
nd p
oliti
cal
fragm
enta
tion
Conv
entio
nal
deve
lopm
ent l
ed b
y m
arke
t for
ces.
Dom
inan
ce o
f non
-Sta
te
acto
rs
Gove
rnan
ce
Coop
erat
ion
amon
g St
ates
, bus
ines
ses,
civ
il so
ciet
y or
gani
zatio
ns a
nd
inte
rnat
iona
l ins
titut
ions
.
Stat
es jo
in to
form
larg
e,
supr
anat
iona
l reg
iona
l bl
ocs
to fa
ce re
curr
ent
cris
es w
hile
pre
serv
ing
thei
r ow
n cu
ltura
l sp
ecifi
citie
s. C
ompe
titio
n am
ong
regi
ons
rem
ains
.
Man
y co
untr
ies
have
un
stab
le g
over
nmen
ts,
unab
le to
cop
e w
ith
cris
es. L
ocal
com
mun
ities
sh
are
and
man
age
reso
urce
s.
Allia
nces
bet
wee
n m
ultin
atio
nal c
ompa
nies
, in
vest
men
t fun
ds a
nd
inte
rnat
iona
l ins
titut
ions
. W
eak
Stat
es.
Dom
inat
ion
of h
ybrid
an
d ag
ile c
oalit
ions
m
ade
up o
f NGO
s, M
NEs,
fo
unda
tions
, ass
ocia
tions
an
d lo
cal a
utho
ritie
s.
Gove
rnm
ents
try
to
coor
dina
te th
eir a
ctio
ns.
Cohe
rent
and
inte
grat
ed
polic
ies
and
regu
latio
ns.
Polic
ies
base
d on
regi
onal
in
tere
sts
Few
pol
icie
sFe
w p
olic
ies
or in
fluen
ced
by th
e in
tere
sts
of
com
pani
es.
Polic
ies
for c
limat
e ch
ange
miti
gatio
n an
d to
fig
ht p
over
ty
Econ
omic
de
velo
pmen
t an
d re
sour
ces
Mod
erat
e ec
onom
ic
grow
th. S
hift
to a
circ
ular
an
d gr
een
econ
omy.
Ge
ogra
phic
al p
roxi
mity
be
twee
n pr
oduc
ers
and
cons
umer
s. D
iffer
entia
tion
of p
rodu
cts,
qua
lity.
Aver
age
GDP/
cap:
$2
0,00
0.
Mod
erat
e ec
onom
ic
grow
th. P
rinci
ple
of
’food
sov
erei
gnty
and
su
bsid
iarit
y’ a
t the
re
gion
al b
loc
leve
l.
Aver
age
GPD/
cap:
$2
0,00
0.
Low
eco
nom
ic g
row
th.
Prod
uctio
n an
d pr
oces
sing
mos
tly c
arrie
d ou
t by
smal
l uni
ts a
nd
exch
ange
d lo
cally
. Sev
ere
natio
nal d
ebts
.Av
erag
e GD
P/ca
p:
$18,
000.
Stea
dy e
cono
mic
gro
wth
. Su
bsid
ized
con
sum
ptio
n fo
r the
poo
rest
in u
rban
ar
eas
to a
void
soc
ial
tens
ions
. Agr
o-in
dust
rial
food
sys
tem
.Av
erag
e GD
P/ca
p:
$24,
000.
Econ
omic
gro
wth
at
glob
al le
vel b
ut e
cono
mic
si
tuat
ion
of g
roup
s an
d in
divi
dual
s de
pend
on
thei
r cap
acity
for
netw
orki
ng. S
prea
d of
ICT.
Hypo
thes
es
for 2
050
Sust
aina
ble
and
coop
erat
ive
wor
ldRe
gion
aliz
atio
n an
d en
ergy
tran
sitio
nEc
onom
ic a
nd p
oliti
cal
fragm
enta
tion
Conv
entio
nal
deve
lopm
ent l
ed b
y m
arke
t for
ces.
Dom
inan
ce o
f non
-Sta
te
acto
rs
Econ
omic
de
velo
pmen
t an
d re
sour
ces
Decr
ease
d re
lianc
e on
fo
ssil
fuel
s an
d in
crea
sed
use
of 1s
t and
2nd
ge
nera
tion
biof
uels
. Ca
rbon
as
a co
rner
ston
e of
ene
rgy
mar
kets
.En
ergy
con
sum
ptio
n:
696
EJ
Tran
sitio
n to
rene
wab
le
ener
gy (3
00 E
J), e
spec
ially
bi
omas
s. R
egio
nal c
arbo
n tr
adin
g sc
hem
es.
Use
of fo
ssil
fuel
whe
n lo
cally
ava
ilabl
e an
d us
e of
rene
wab
le e
nerg
y in
ot
her c
ases
. Wea
k ac
cess
to
ene
rgy
in s
ome
regi
ons.
Heav
y re
lianc
e on
low
-co
st fo
ssil
fuel
and
ra
re m
etal
s le
adin
g to
de
plet
ion
of re
serv
es. L
ow
conc
ern
for e
nviro
nmen
t. En
ergy
con
sum
ptio
n:
879
EJ
Deve
lopm
ent o
f re
new
able
ene
rgy.
De
cent
raliz
ed p
rodu
ctio
n an
d sm
art n
etw
orks
.
Free
trad
e bu
t reg
ulat
ions
to
ass
ure
qual
ity o
f pr
oduc
ts.
Stro
ng in
tra-
regi
onal
tr
ade.
Trad
e lim
ited
to
neig
hbou
ring
coun
trie
s or
cou
ntrie
s w
ith w
hom
bi
late
ral a
gree
men
ts h
ave
been
sig
ned.
Trad
e is
libe
raliz
ed; l
ow
barr
iers
and
sub
sidi
es,
harm
oniz
atio
n of
st
anda
rds
Free
trad
e an
d ac
tive
inte
rnat
iona
l mar
kets
.
Publ
ic-p
rivat
e pa
rtne
rshi
ps fo
r R&
I. Sh
ared
inte
llige
nce
and
part
icip
ativ
e re
sear
ch.
Com
plex
ity, i
nteg
ratio
n,
inte
rdis
cipl
inar
ity.
Inve
stm
ents
in R
&D
depe
nd o
n re
gion
’s
reso
urce
s.
Join
t res
earc
h pr
ojec
ts s
uppo
rted
by
crow
dfun
ding
pla
tform
s an
d ru
n by
vol
unte
er
activ
ists
. Har
dly
any
publ
ic re
sear
ch.
Stro
ng in
fluen
ce o
f R&
I’s p
riorit
ies
of
priv
ate
sect
or. F
ull
confi
denc
e in
tech
nolo
gy.
Spec
ializ
atio
n.
Deve
lopm
ent o
f ’om
ics”
’, bi
g da
ta, r
emot
e se
nsin
g.
Rese
arch
pro
ject
s fu
nded
join
tly b
y pr
ivat
e se
ctor
and
NGO
s.
Rese
arch
ers
are
mob
ile,
and
adap
tabl
e. H
igh
relia
nce
on in
form
atio
n te
chno
logi
es.
Hum
an
deve
lopm
ent
Low
mig
ratio
n le
vel.
Figh
t aga
inst
pov
erty
, hi
gh a
ttent
ion
to h
ealth
an
d ed
ucat
ion
Mig
ratio
ns w
ithin
regi
ons.
Atte
ntio
n to
em
ploy
men
t, ed
ucat
ion
and
heal
th,
but s
ituat
ions
var
y fro
m
one
regi
on to
the
othe
r. Co
llabo
ratio
n w
ithin
re
gion
s.
Unco
ntro
lled
mig
ratio
ns.
High
une
mpl
oym
ent;
soci
al in
stab
ility
.Ed
ucat
ion
at c
omm
unity
le
vel i
f ava
ilabl
e.
Mig
ratio
ns fr
om re
sour
ce-
poor
cou
ntrie
s to
rich
er
ones
. Ac
cept
ance
of
ineq
ualit
ies.
Det
erio
ratio
n of
pub
lic h
ealth
. Hig
h em
ploy
men
t rat
es, e
xcep
t in
agr
icul
ture
.
Circ
ular
mob
ility
bet
wee
n ur
ban
and
rura
l are
as, a
nd
betw
een
coun
trie
s.Gr
owth
of m
iddl
e cl
ass.
Dev
elop
men
t of
e-le
arni
ng. A
ttent
ion
to
heal
th.
98
LAND USE AND FOOD SECURITY IN 2050
❚❚ Hypothesis 3: Economic and political fragmentation
There are on-going trends towards this hypothesis which assumes political and economic fragmentation, as well as severe geostrategic tensions. Some countries have been in chaos for many years and their situation worsens with monetary and financial crises, States struggle to cope with their debt, there is the rise of nationalism in a few countries, unemployment and social instability are problems and international and regional institutions are unable to roll out coherent policies to help governments overcome their difficulties. International fossil energy markets are hit and access to energy is reduced in some regions. Crises in developed countries trigger more crises in emerging nations. Political instability aggravates economic difficulties and leads to internal conflicts in some countries. Global economic growth is low (per capita GDP stands at $18,000) but there are huge differences within countries and between countries. The informal economy is widely developed. Trade is limited to neighbouring countries. Education develops in an informal yet rather efficient manner through the exchange and sharing of experience; healthcare follows a similar trend. Groups of researchers and other interested stakeholders set up joint research and innovation projects supported by crowdfunding platforms and run by volunteer activists. Local communities of farmers and users of spaces gradually organize themselves to share and manage the use of resources.
❚❚ Hypothesis 4: Conventional development led by market forces
There are many on-going trends towards this hypothesis: a high reliance on fossil fuels and low level of concern for environmental issues, faith in technological progress to solve all problems, global markets and belief that competitive markets contribute to economic growth.
In this hypothesis, there is an alliance between multinational corporations, investments funds and international institutions to push towards this model. Economic growth is based on low-cost fossil fuel, and trade barriers are low. Above all, people have confidence in technology to overcome limited natural resources, as well as in education and information and communication technologies. Research focuses on industrial efficiency and cost reduction. The convergence of technologies allows considerable progress, but at the price of a number of accidents with serious effects on health and the environment. There are large inequalities at global and national levels. However, this development leads to an increasing number of environmental, health, economic and social catastrophes. Energy prices rise sharply as conventional oil and then gas resources become increasingly rare; reserves of phosphate and rare metals with low extraction costs are depleted. Competition over water is fierce. Public health deteriorates sharply due to pollution and unhealthy diets. Migrations from resource-poor countries to richer ones are very large.
99
6. The Global Context
❚❚ Hypothesis 5: Dominance of non-State actors
The on-going trends towards this hypothesis are the globalization of the economy, the digitalization of relationships and the multiplication of initiatives by non-State actors such as NGOs, civil society organizations, philanthropic associations, faith-based organizations and academic institutions.
In a highly globalized world, where mobility is very common, rather than uniting around a national government, people tend to join groups that share common interests, thereby creating powerful currents of opinion. The consensus within public opinion regarding the main challenges and growth of the middle classes provide the foundation on which the power of the non-State interest groups is based. Urbanization and information technologies facilitate the development of multiple coalitions which are independent of national governments. Governments perceive their role as being organizers and coordinators of the ’hybrid’ coalitions of State and non-State actors that evolve according to the challenges concerned. Transnational interest groups have the ability to bypass national governments seeking to regulate their activities. They challenge traditional jurisdictions and regulations. The power of the networks and ad hoc coalitions raises security issues and generates geopolitical uncertainty, although such changes also bring greater global wealth. Energy production is decentralized. The economic situation of groups is dependent on their networking capacities, and there are large inequalities. Researchers are versatile and mobile; there is confidence in their capacity to find solutions to many of the challenges faced by the world.
Conclusion
The global context has changed drastically over the past forty years. A number of political, economic, social and technological trends and stakeholders are manifesting themselves, and opposing each other, creating major disruptions.
In the past forty years, the population has concentrated in Asia and Africa, and this represents a major challenge for future land uses and food security at global level and in these regions.
Global economic growth has been very rapid and contributed to changes in food systems and diets as well as major investments in agricultural research and development. Trade has evolved influenced by the simultaneous development of a multilateral trading system and the development of non-tariff trade barriers and preferential and regional trade agreements, and these evolutions have influenced the distribution of land uses. The pace of technological change has been very rapid, influencing heavily land use intensity in certain countries and less in others, especially in Africa and Asia. The share of agriculture in the economy and employment has evolved at different speed in different regions of the world.
100
LAND USE AND FOOD SECURITY IN 2050
Global governance of land uses and food security has been promoted while there has been increased attention paid to national sovereignty and even recognition of governance of land uses at the levels of territories. Political instability and conflicts represent major risks for land uses and contribute to food insecurity. Large corporations are extremely influential and civil society organizations have become extremely active, and new alliances could shape the land uses and food security.
101
7. Climate Change: Impacts and MitigationThierry Brunelle, Patrice Dumas, Christophe Cassen, Stéphane Manceron, Elodie Marajo-Petitzon and Véronique Lamblin
Introduction
Agriculture, Forestry and Other Land Use (AFOLU) is at the forefront of climate change issues as it is both concerned by its impacts and will be a major actor in its mitigation. AFOLU is responsible for just under a quarter (~10-12 GtCO2eq/yr) of anthropogenic greenhouse gas (GHG) emissions, mainly from deforestation and agricultural emissions from livestock, soil and nutrient management, and among the economic sectors has one of the most important mitigation potentials. In particular, AFOLU offers the possibility of producing negative emissions, which will be essential to limit global temperature changes below 2°C or 1.5°C above pre-industrial levels.
There is also evidence of the impacts of historical and recent climate change on food production, with a global net loss in average wheat and maize yields of –3.8% and –5.5% respectively relative to what would have been achieved without the climate trends in 1980-2008 (Lobell et al., 2011). Extreme weather events played an important role in the food crisis of 2007-2008 and continue to multiply. While it is too early to attribute these phenomena to anthropogenic activities, major changes in temperature and precipitation due to the increased concentration of greenhouse gases could greatly disrupt agricultural production systems and threaten world food security.
Food security is a complex issue, which has several dimensions and should not be confused with food production. Evaluating the impact of climate change on food security is particularly challenging as it results from a complex process of estimations involving four main sources of uncertainty: the emissions scenario, the climate scenario, the induced variation in crop yields and cultivable area, and the impact on food security. Assessing the interactions between climate mitigation and food security is even more challenging as they depend fundamentally on the way mitigation options are implemented.
As a contribution to the ongoing reflection, this chapter presents the three narratives for climate change impacts and mitigation in 2050 used in the Agrimonde-Terra foresight exercise. Before, to contextualize these narratives, we first present a literature review on

102
LAND USE AND FOOD SECURITY IN 2050
the impacts of climate change on agriculture and then a brief overview of the agricultural mitigation pathways and the international negotiation process that should drive them.
Overview on the impacts of climate change on agriculture
❚❚ Projected impacts of climate change on agriculture
The IPCC (Intergovernmental Panel on Climate Change) scenarios
Climate projections made within the IPCC Fifth Assessment Report (AR5) are based on a set of four ’Representative Concentration Pathways’ (RCP). The RCPs are scenarios that specify radiative forcing (expressed in watt/m2) and corresponding emissions, but are not directly based on socio-economic storylines like the previous Special Report on Emissions Scenarios (SRES) (IPCC, 2013). Four RCP scenarios were selected from the published
Figure 7.1. Global mean temperature change averaged across all Coupled Model Intercomparison Project Phase 5 (CMIP5) models (relative to 1986–2005) for the four RCP scenarios.
Source: IPCC (2013), FAQ 12.1, Figure 1, pp. 1037.Note: RCP2.6 (dark blue), RCP4.5 (light blue), RCP6.0 (orange) and RCP8.5 (red). Likely ranges for global temperature change by the end of the 21st century are indicated by vertical bars.
103
7. Climate Change
literature: the lowest pathway RCP2.6 (also referred to as RCP3-PD) which peaks at 3 W/m2 and then declines to approximately 2.6 W/m2 by 2100; the medium-low RCP4.5 and the medium-high RCP6 aiming for stabilization at 4.5 and 6 W/m2, respectively around 2100; and the highest scenario, RCP8.5, which implies a radiative forcing of 8.5 W/m2 by 2100.
Projected changes in global mean surface air temperature in 2046-2065 range from +1.0°C (confidence interval = 0.4°C-1.6°C) in RCP2.6 to +2.0°C (1.4°C-2.6°C) in RCP8.5 (Figure 7.1). AR5 models project a gradual increase in global precipitation over the 21st century: +0.05 mm/day in RCP2.6 to +0.15 mm/day in RCP8.5, with, however, a relatively large spread in model projections. In spite of these uncertainties, surface soil drying is projected with high confidence, especially under RCP8.5, in some regions: the Mediterranean, Northeast and Southwest South America, Southern Africa and Southwestern USA.
Projected impacts on potential agricultural land
Assessments of the suitability of land for agricultural use under climate change conditions at the global scale demand large amounts of data and for this reason are relatively sparse. We present here the study conducted by Zabel et al. (2014) which is used in the quantification of the Agrimonde-Terra scenarios.
Zabel et al. (2014) evaluate land resources based on ecological rules relating to the suitability of land for agricultural use based on eight parameters (mean temperature, precipitation, texture, coarse fragments, gypsum concentrations, base saturation, pH, organic carbon, salinity, sodicity and slope). The projections presented in Zabel et al. (2014) are made under the A1B climate scenario, which lies between RCP6.0 and RCP8.5. According to their results, climate change leads to a 560 million hectare (Mha) increase in suitable cropland area until 2100, which comes mostly from high latitude countries such as Canada, Russia and China. This result is consistent with previous estimates from Ramankutty et al. (2002). Net loss of suitable areas is expected in some regions, most notably sub-Saharan Africa, Middle East-North Africa and Australia-New Zealand. Also a strong decrease in multiple cropping area is projected in Brazil (–160 Mha) and sub-Saharan Africa (–150 Mha). In spite of a larger area suitable for agriculture, the overall productive capacities of global ecosystems will not necessarily be expanded by climate change as the actual crop yields should also be taken into account (see following paragraph).
Projected impacts on crop yields
Based on the abundant literature on the impact of climate change on crop yields published since AR4, the AR5 report comes to the following conclusions: (i) crop yields of wheat, maize and rice in both tropical and temperate regions are negatively affected beyond 3°C of local warming without adaptation, even with the benefits of higher carbon dioxide (CO2) and rainfall; (ii) crop yields of wheat and maize in tropical regions diminish significantly even with a slight rise in temperature (1 to 2°C); (iii) there is a potential for yield loss in all three temperate crops at low temperature changes.
104
LAND USE AND FOOD SECURITY IN 2050
The potential benefits of adaptation are clear for wheat and rice, but have not been demonstrated for maize. The gains from incremental crop-level adaptation are estimated at 7-15% on average (Challinor et al., 2014). Among the possible adaptation strategies studied (planting date, fertilizer, irrigation, cultivar or other agronomic adjustment), cultivar adjustment appears to be the most effective, with irrigation also showing benefits.
South Asia and Southern Africa are the two regions that, in the absence of adaptation, would suffer the most negative impacts on several important crops (Lobell and Burke, 2008; IPCC, 2014a).
Projected impacts on livestock
Production of meat and milk may be impacted by climate change in many ways: changes in the quantity and quality of feed, heat stress and water scarcity, increased incidence of livestock disease, loss of genetic diversity etc. However, there are important knowledge and data gaps on the future impact of climate change on livestock production (Thornton et al., 2009), especially in the tropics and sub-tropics, making it difficult to assess each of these potential effects.
The actual impact on livestock production is also difficult to assess because of the large range of possible adaptations available. Extensive livestock systems occur over a huge range of biophysical and socio-ecological systems, with a consequent large range of potential adaptations. In many cases, these livestock systems are highly adapted to past climate risk, which should provide a sound starting point for climate change adaptation (Thornton et al., 2009). In developed countries, livestock systems are generally adaptable and resilient. In developing countries, in contrast, households which are dependent on keeping livestock may be much more vulnerable to changes in climate and climate variability, with the potential for increased poverty and decreased food security (Thornton, 2008).
Projected socio-economic impacts
In response to changes in temperature and precipitation, AR5 reports estimates of increases in food prices ranging from 3-84% to 2050 (IPCC, 2014a).34 However, these results are difficult to interpret as they depend to a large extent on the adaptation capacities represented in the models: for the same shock, the more flexible the model (in terms of technology, farming practices, trade etc.), the lower the impact on food prices (Nelson et al., 2014). For this reason, biophysical models are considered to project higher impacts than economic models, in which adjustments to changing environmental conditions by farmers are easier (Mendelssohn, 1994).
Beyond the impact on food prices, some studies have tried to directly estimate the impact of climate change on undernourishment. To do so, Baldos and Hertel (2014) incorporated
34. Most of these studies did not include the CO2 fertilization effect, considering that it balances the bias of omitting the negative effect of elevated ozone and increased weed and pest damage (IPCC, 2014a).

105
7. Climate Change
into a partial equilibrium model of global agriculture a food security module linking changes in prices to changes in average dietary energy intake and to shifts in the full caloric distribution. Using the yield estimates from Müller et al. (2010), they show that climate change could result in an increase of +27 million in the global malnourished population in 2050, compared to a baseline scenario. Sub-Saharan Africa and South Asia are the two regions the most severely hit, with the incidence of malnutrition increasing by more than +20% (compared to the baseline) in both regions. When the effects of CO2 fertilization are added, the number of malnourished people declines by around –35 million compared to the baseline. Overall, the contribution of climate change to the malnutrition headcount is nonetheless of a secondary order compared to socio-economic drivers such as population and per capita income. This conclusion about the prevailing role of non-climate drivers on food security is shared by the academic literature and the IPCC.
A drawback of many socio-economic assessments is their consideration of incomes as exogenous, while they may be a more important driver of food insecurity than commodity price changes themselves (Hertel et al., 2010). In so doing, they neglect some of the various mechanisms that limit access to food. If producers are price-takers for outputs and if the farm-level demand is inelastic, then a reduction in supply will boost incomes with potential benefits for food security for this category of household. Therefore, the actual impact of climate change on poverty and food security depends crucially on where households earn their income. To study this effect, Hertel et al. (2010) use the general equilibrium model GTAP to account for the feedback between prices and incomes, combined with the distribution of households aggregated into groups based on their primary source of earnings over a sample of 15 developing countries. They showed that if the poor are mostly self-employed in agriculture, poverty can be reduced by a modest adverse shock in productivity, while it will be increased by the same shock if poverty is dominated by wage earners and urban poverty.
Ricardian analysis is used as an alternative approach to economic models for estimating the impact of climate change on agriculture, especially in West Africa. The Ricardian approach measures the relationship between net revenues from crops and climate using cross-sectional evidence.
Impact of changes in climate variability on food security
Changes in the inter-annual variability of yields are seen by many authors to be a major driver of food insecurity by undermining the resilience of food systems and affecting the stability of food availability and access (IPCC, 2014a).
However, only a few estimates of climate variability are available in the literature and studies on the effects of climate variability and extreme climatic events on food systems are also scarce (Thornton et al., 2014). There is, for example, no mention of studies assessing the impact of climate variability on food price and food security in AR5. In a review of possible impacts of changes in climate variability, Thornton et al. (2014) stress that the treatment of the impacts of climate variability is a heavily under-researched area,
106
LAND USE AND FOOD SECURITY IN 2050
particularly how harvest failures in one continent may influence food security outcomes in others.
Based on the global gridded crop model LPJmL, Müller and Robertson (2014) simulated the year-to-year variability for the 2000s (1980-2009) and 2050s (2040-2069) expressed as the coefficient of variation (CV) in the RCP8.5 climate scenario. Their results indicate an increase of more than +5% in CV in 64% of grid cells and a decrease of more than –5% in 29% of cases. However, it is difficult to draw conclusions in terms of food security from these results as there is no indication on the geographical distribution of impacts. Furthermore, increases in CV can be due to reductions in mean yields and/or increases in the standard deviation of yields, and often simulated changes are a combination of the two (IPCC, 2014a).
Devereux (2007) shows that food crises triggered by extreme climatic events can be schematically described as a sequence of “entitlement failures”. This hypothesis implies that food crises do not generally result from isolated weather shocks, but from a succession of shocks, that progressively undermine the capacity of societies to respond to climatic events (e.g., by selling farming equipment). At each new shock, the societies reach gradually a new step in the sequence of “entitlement failures”, until experiencing a food crisis.
Studies at the local scale provide some insights on the potential impacts of climate variability on food security. A survey conducted in three communities in Ghana shows how extreme climatic events are impacting food security (Codjoe and Owusu, 2011). Flooding and cold conditions hamper food storage, while extreme dryness facilitates it. Excessive flooding may also destroy feeder roads that link food production area and major markets, cutting some regions off from access to food. Adaptation strategies that enhance transportation and storage facilities can therefore adequately alleviate food insecurity. Providing farmers with early warning systems, extending credit to farmers and the use of supplementary irrigation are other effective adaptive options.
Mitigation pathways
❚❚ Main insights from AR5
The AFOLU sector is responsible for around a quarter of anthropogenic GHG emissions (~10-12 GtCO2-eq/yr) on average over the decade 2000-2009, with global emissions of 5.0-5.8 GtCO2eq/yr from agriculture and around 4.3-5.5 GtCO2eq/yr from forestry and other land uses (IPCC, 2014b). AFOLU emissions have stabilized since the decade 1990-1999 thanks to a reduced rate of deforestation, most notably in Brazil, and afforestation, most notably in China, Vietnam and India. Net annual baseline CO2 emissions from AFOLU are projected to decline over time, partly driven by technological change and partly by the projected declining rates in the expansion of the agriculture area related to the expected slowing in population growth (IPCC, 2014b). Historical and projected trends of AFOLU

107
7. Climate Change
emissions are, however, particularly uncertain due to specific measurement difficulties in the AFOLU sector.
Land-based mitigation represents a potential large share of the total cumulative abatement (20 to 60% to 2030, and 15 to 40% to 2100; IPCC, 2014b) and is therefore essential to limit global temperature changes to 2 or 1.5°C above pre-industrial levels. In contrast to the transport and energy sectors, a significant share of AFOLU’s mitigation potential is located in developing countries, which may raise possible issues in terms of food security. Mitigation in the AFOLU sector can be carried out both by reducing the GHG emission intensity per kg of output (through improved cropland and livestock management), and by conserving or enhancing carbon stocks in soils or vegetation (through afforestation/reforestation and BECCS: bioenergy with carbon capture storage). Trade-offs between both strategies may appear in some cases, because a reduction in emission intensity may lead to lower yields and fewer areas for carbon sequestration.
The development of integrated environment/climate/agricultural production practices, such as agroecology or sustainable intensification, is a way to bridge this conflict by optimizing crop production per unit area, taking into account the sustainability aspects. Consumption-based measures, such as changes in diet or a reduction in food loss and waste, are another way to bridge this conflict by reducing the overall tension on land. They may enable both lower use of inputs and larger areas for afforestation/reforestation or bioenergy production. Therefore they offer a substantial mitigation potential (1.5-15.6 GtCO2-eq/yr), greater than supply-side measures (1.5-4.3 GtCO2-eq/yr at carbon prices between 20 and 100 US$ tCO2-eq/yr) (Popp et al., 2010). However, they seem particularly complex to enforce as they are considered to impinge on individual liberties in many countries. Given these difficulties, some authors recommend that they should be designed to contribute to other policy agendas, such as improving environmental quality (Smith et al., 2012) or improving dietary health (Macdiarmid et al., 2011).
Important barriers to the implementation of supply-side measures also exist as it implies profound changes in agricultural practices and land-use in some regions. Among the main obstacles, AR5 mentions access to market and credits, technical capacities to implement mitigation options, accurate monitoring of emission levels and institutional frameworks and regulations. Large-scale bioenergy production raises many issues about possible adverse effects on biodiversity, food security, water use and access to land, and the scientific debate on the overall benefits of specific bioenergy pathways remains unresolved (IPCC, 2014b).
AFOLU mitigation measures may be associated with socio-economic and environmental co-benefits provided that they are sustainably implemented. For bioenergy, for example, this means it must be integrated with food production, notably through suitable crop rotation schemes, or use of by-products and residues (Berndes et al., 2013). Mitigation options designed to enhance carbon stocks in soils may also have a positive impact on food security by improving land quality (Lal, 2004). Other potential co-benefits include, for example, human health and well-being through more adapted diets, clarification of land tenure,
108
LAND USE AND FOOD SECURITY IN 2050
synergies with other international agreements, including the United Nations Convention to Combat Desertification (UNCCD, 2011), or the Convention on Biological Diversity (CBD).
❚❚ The climate negotiation process
Climate negotiations were initiated at the Earth Summit in Rio de Janeiro in 1992 with the adoption of the United Nations Framework Convention on Climate Change (UNFCCC, 1992) as the first pillar of the international climate regime. The convention established general principles of the climate regime: Article 2 calls for the prevention of “dangerous anthropogenic interference with the climate system” and Article 3 establishes an equity principle based on common but differentiated responsibilities (CBDR).35 Since its ratification in 1994 by 194 countries (the so-called parties to the Convention), the convention proceeds through annual diplomatic meetings called Conference of the Parties (COP).
The Copenhagen Conference (COP15 held in 2009) was supposed to achieve an ambitious global treaty and launch a new round of negotiations for the next decade. The conference gave rise to high expectations among civil society but finally led to a simple agreement signed by 28 countries, whose content was officially institutionalized in Cancun (COP16 held in 2010). Reasons for the failure include geopolitical factors (limited room for manoeuvre of the US administration), clumsiness of the Danish presidency and the unwillingness of developing countries to back a global agreement without, in turn, significant commitments from developed countries (Bodansky, 2010; Grubb, 2010; Rajamani, 2010). The increasing role of the BASIC countries (Brazil, South Africa, India and China) has reflected a new balance of power in international relations since the early 2000s.
However, the Copenhagen agreement represents a turning point in climate negotiations. First, the 2°C target appears for the first time as an ultimate global objective for emission reduction. Second, while the Kyoto Protocol reflected a top-down approach in climate negotiations, that is to say starting from a common global objective deriving into domestic commitments, the Copenhagen Accord emphasizes a bottom-up approach through a nationally-determined pledge (Bodansky, 2010). For the first time, developing countries committed to reduce their emissions, with both domestic efforts and the help of developed countries. Developed countries committed to a financial target of $100 billion per year by 2020 and on the creation of a Green Climate Fund (GCF) designed to channel a significant share of this financial backing. A monitoring system called MRV (Measuring, Reporting and Verification) regarding the mitigation measures was planned but its modalities remained a controversial issue with China and India.36
35. The CBDR means that all parties to the convention recognize their responsibilities in climate change but some countries are more responsible than others. In practice, industrialized countries (mostly in the Northern hemisphere) are considered more responsible.
36. China and India rejected all kinds of binding system but ultimately agreed on a voluntary monitoring system of ’measurement, reporting and verification’ in accordance with guidelines adopted by the COP (paragraph 5) communicated each year.

109
7. Climate Change
From Copenhagen to Paris (COP21), discussions followed an incremental process of adjustment of the climate regime while laying the foundations for a global agreement. In particular, the Durban platform (COP17 held in 2011) initiated a negotiation process aimed at producing a ’protocol, or other juridical instrument’ and adopted the second phase of commitment of the Kyoto protocol (2013-2020). The Warsaw conference in 2013 invited parties to communicate before the Paris conference their Intended Nationally Determined Contributions (iNDCs) (Decision 1/CP.19, Para. 2b).
The adoption of the Paris Agreement on 12 December 2016 (UNFCCC, 2016) institutionalized a new paradigm of climate negotiations initiated at Copenhagen (Bodansky, 2016). It is a global agreement, which applies not only to developed countries, like the Kyoto Protocol, but also to developing countries, accounting for a growing share of global emissions. It calls for a limit to the increase in the global temperature well beyond the 2°C target and to pursue efforts to limit the temperature increase to 1.5°C above pre-industrial levels (Art 2) and recognizes the necessity to “foster climate resilience and low greenhouse gas emissions development, in a manner that does not threaten food production” (Art 2). To achieve these objectives and fill the gap with the current content of iNDCs renamed NDC (National Determined Contributions) it institutionalizes an iterative process every five years (Art 14). This global stocktaking will review collective progress and put forward emission reduction plans for the next five-year period. Although the agreement does not include any type of compliance system, it establishes a common transparency and accountability framework. The 100 billion $/yr target by 2020 to finance adaptation and mitigation measures is confirmed and will be a floor by 2025 (Decision, paragraph 54).
COP 21 is an important step from the food security point of view, as for the first time in a global climate agreement, the fundamental priority of food security and its vulnerability to climate change have been recognized. COP21 also marked the official launch of the ’4 per 1000’ international initiative which aims to address in an integrated way the issues of food security, adaptation to climate change and mitigation of anthropogenic emissions by increasing the soil carbon stock by 4‰ per year.
Future climate change impacts and mitigation in 2050
Based on the available literature, three narratives for climate change impacts and mitigation in 2050 have been developed.
❚❚ Hypothesis 1: Stabilization of Global Warming
Ambitious targets on temperature changes to 2100 set by the COP21 have created a momentum towards strong mitigation efforts. Nationally Determined Contributions (NDC) decided at COP 21 have been the basis for much more ambitious action plans. Through a proactive political approach and a strong commitment from civil society, a broad range of options are deployed to stabilize climate change. Instruments for emissions reduction
110
LAND USE AND FOOD SECURITY IN 2050
– carbon tax, cap-and-trade systems, low-carbon standards etc. – are implemented in most countries of the world, steering investments towards low-carbon goods and technologies. The total consumption of fossil energy is significantly reduced through energy efficiency measures and efforts to encourage greater moderation. At the same time, the production of renewable energy (solar, wind, hydro and biomass) increases significantly. Climate mitigation is also facilitated by relatively low climate sensitivity (i.e., the temperature change in response to the change in radiative forcing).
The agriculture, forest and other land-use (AFOLU) sector plays a key role in mitigation efforts. All mitigation options are considered, including carbon storage in agricultural soils (through, for example, the 4 per 1000 initiative) and resource use efficiency measures, especially concerning the use of synthetic nitrogen. These strategies are adapted to local situations to create synergies with yield increases and the limitation of land degradation. The global production of modern biomass energy37 reaches 102EJ/yr in 2050, mostly used for producing electricity in association with carbon capture and sequestration (Chapter 14 for more details). The development of first-generation biofuel ceases because of its poor environmental assessment. In this scenario, as in the two others, the evolution of forest areas mirrors the evolution of agricultural areas, which are themselves driven by our hypotheses for the future of the other drivers of the ’land use and food security’ system: global context, food diets, rural-urban relationships, cropping systems and livestock systems as described in chapters 6, 8, 9, 11 and 12 respectively.
As a result, global temperature changes are maintained well below +2°C to 2100 (and +1°C to 2050) and changes in precipitation remain limited (<+0.05 mm/day in 2100). In this context, the agricultural system does not experience any major change compared to the current situation due to climate conditions. Crop yields are not significantly affected by climate change in both temperate and tropical zones. Similarly, elevated CO2 and O3 concentrations have few impacts on crop yields and crop protein content. The area of cropland suitable for agricultural production does not notably change compared to the current situation.
❚❚ Hypothesis 2: Runaway climate change
International agreements adopted under the United Nations Framework Convention on Climate Change (UNFCCC) do not lead to significant effective emission reductions. NDCs are not actually enforced in most countries, especially in the largest emitting ones, because of the lack of political will and the influence of fossil energy producers. At the local, national and regional scales, citizens’ initiatives do not balance the influence of the oil industry and the belief that technical change will solve the climate issue. The world’s economies remain dependent on fossil energies whose availability is still high thanks to
37. We use the expression ’modern biomass energy’ as opposed to the traditional use of biomass energy such as firewood for cooking and heating.

111
7. Climate Change
the exploitation of shale and unconventional resources, fossil energy reserves in the Arctic and deepwater drilling. Agriculture is based on the conventional development model with large consumption of synthetic fertilizers and pesticides. No specific measure to increase the carbon storage in soils or vegetation is taken. The production of modern biomass energy (60 EJ/yr in 2050 – Chapter 14 for more details), used as second-generation biofuel or bioelectricity, is encouraged by government subventions to develop additional industrial and agricultural capacities based on past experiences of bioenergy (deployment of ethanol from maize in the USA, ethanol from sugar cane in Brazil and biodiesel in Europe). Production of first-generation biofuel is constant at its 2015 level, hindered by the cheap price of fossil fuel.
In this context, greenhouse gas emissions continue to rise sharply positioning the climatic system in a scenario corresponding to the RCP8.5. Global temperature changes reach +4°C in 2100 (+2°C in 2050) and changes in precipitation amount to +0.15 mm/day in 2100. Under this scenario, there are strong impacts on the agricultural system. The area of cropland suitable for agricultural production increases by approximately 600 Mha by 2100 (Zabel et al., 2014; including +120 Mha for moderately suitable to very suitable land). However, this increase is unevenly allocated, as it mainly concerns Northern latitudes while arable cropland areas decrease in tropical regions. The average suitability of cropland areas also decreases significantly. On average at the global scale, wheat yield decreases by –13% between 2010 and 2050, maize yield by –14%, rice yield by –16%, soybean by –30% and groundnut by –21% (Müller and Robertson, 2014). Extreme events (heat waves, floods etc.) become more frequent, leading to increased inter-annual variability in crop yields. Increases in CO2 and O3 concentrations may also have a direct impact on crop yields (positive for CO2, negative for O3) and on the protein content of crops (negative for CO2, positive for O3).
❚❚ Hypothesis 3: Moderate warming
In a context characterized by the collapse of the international governance system, the UNFCCC negotiation process has eventually failed to provide an effective action plan towards emission reductions. NDCs are progressively abandoned by the States and climate change mitigation is now considered only as a co-benefit of adaptation measures, as well as reduced food and energy consumption due to lower economic activity and/or energy independency strategies. The latter strategies concern, for example, the development of biomass energy, whose production reaches 150 EJ/yr globally in 2050. The rise in bioenergy production is especially strong in regions without abundant fossil resources. Two variants of bioenergy production are considered, differing due to the share of dedicated energy crops and wood biomass (Chapter 14 for more details).
Global temperature changes reach +2°C in 2100 (+1°C in 2050) and changes in precipitation amount to +0.08mm/day in 2100. The moderate warming assumed in this scenario
112
LAND USE AND FOOD SECURITY IN 2050
generates discernible impacts on the agricultural system.38 On average, at the global scale, wheat yield decreases by –6% between 2010 and 2050, maize yield by –7%, rice yield by –8%, soybean by –15% and groundnut by –10%. Yield losses will be greater in tropical regions than in Northern latitudes. The area of cropland suitable for agricultural production increases by +100-200 Mha by 2050 (+60 Mha for moderately suitable to very suitable lands). However, this increase is unevenly allocated as it mainly concerns Northern latitudes while arable cropland areas decrease in tropical regions. The average suitability of cropland areas decreases moderately. The frequency of extreme weather events increases (heat waves, floods etc.), leading to a moderate rise in the inter-annual variability in crop yields. The biogeochemical composition of the atmosphere changes (CO2, O3), but without significantly affecting yields and crop quality.
Conclusion
In spite of some uncertainties and research gaps, particularly on climate variability and impact on livestock, scientific literature agrees that climate change, whether through impacts or mitigation, will be a major driver of world agriculture in the coming decades. Based on these conclusions, we have endeavored in this chapter to construct narratives representative of the possible futures in terms of impact and mitigation of climate change. Because we are still at the crossroads where most options remain possible, we built a set of hypotheses covering a large range of pathways, from the most optimistic one (’Stabilization of global warming’) to the most pessimistic (’Runaway climate change’).
38. Climate change impacts on agriculture under this climate pathway are supposed to be half those under the ’Runaway climate change’ pathway (for more details, Chapter 14).

113
8. Dietary Changes, Nutrition Transition and the Future of Global DietsOlivier Mora39
Introduction
Through food supply chains, diets determine production in agriculture and thus act indirectly on land use. Indeed, the generalization of Western diets rich in animal products (meat, dairy products and eggs) leads to an increase in livestock production, which is a major contributor to agricultural land expansion (van Dooren et al., 2014). However, diets are also directly linked to health outcomes. Although the improvement of diets in terms of macro-nutrient intakes has reduced undernutrition globally, insufficient and poor quality foods still contribute to an important level of undernutrition and micronutrient deficiencies in developing countries (Smith and Haddad, 2015). Furthermore, dietary changes have led to a dramatic increase in obesity and diseases such as diabetes, cardiovascular diseases and certain cancers. A dietary change from traditional and minimally processed foods to refined and ultra-processed foods seems partly responsible for this increase. Currently emerging countries are experiencing a rapid nutrition transition based on energy-dense and micronutrient poor foods, and facing a double burden of malnutrition where overnutrition coexists with undernutrition. Dietary changes are therefore a major contributor both to land-use change and food security.
This chapter examines past and future changes in global diets taking into account both developing and developed countries. The forward analysis of dietary changes focuses on four characteristics: nutrition transition and dietary patterns in terms of the types of foods consumed; health outcomes of diet changes and malnutrition; the changes in food value chain and the impact of urbanization and increasing incomes; and food and nutrition policies. At the end of the chapter, we present four narratives for food diets in 2050 that are based on the previous trend analysis. Our objective is to contribute to the current debates on dietary changes by exploring a plurality of plausible futures for global
39. I thank Anthony Fardet for his comments and thoughts to improve hypotheses on future diets, and Chantal Le Mouël for her suggestions and proofreading of this chapter.
114
LAND USE AND FOOD SECURITY IN 2050
diets, describing the associated challenges and issues, and presenting some pathways for healthier diets at the global level.
Understanding changes in diets through types of food and calorie availabilities
❚❚ Changes in the availability of food calories across world regions: an uneven distribution
Food balance sheets produced by the Food and Agriculture Organization of the United Nations (FAO) show a worldwide increase in daily calorie availability over the past two decades. Between 1991 and 2008, this grew globally from 2,600 kcal/person/day to 2,810 kcal/person/day. However, these increases are not uniform. For example, growth has been more rapid in developing countries, increasing by +250 kcal/person/day, than in developed countries, which increased by +140 kcal/person/day over this period. The distribution of calorie availability across countries remains very uneven. Developed countries averaged 3,370 kcal/person/day in 2010, while developing countries averaged 2,710 kcal/person/day. Sub-Saharan Africa and South Asia had the lowest levels of food availability, at under 2,400 kcal/person/day.
Growth has varied considerably from region to region. The largest gains were in East Asia, Latin America and the Caribbean, with increases of +260 to +480 kcal/person/day. China experienced an increase of +480 kcal/person/day between 1991 and 2008, reaching 3,060 kcal/person/day, and Brazil a +400 kcal/person/day rise, up to 3,230 kcal/person/day. In sub-Saharan Africa, calorie availability increased by +210 kcal/person/day from 1991 to 2008, reaching 2,380 kcal/person/day. The smallest gains were in South Asia and Oceania, where increases were less than +100 kcal/person/day. Food availability in India has remained largely stagnant, with a small +70 kcal/person/day increase over the period, up to 2,330 kcal/person/day in 2008. Moreover, in India, the average calorie intake per person has actually decreased over the past 25 years, particularly for the poorest segments of the population (Deaton and Drèze, 2009).
Nonetheless, one can observe a relative reduction of the disparity in food availability between developed countries and developing countries between 1991 and 2008. In developed countries, calorie availability seems to have reached a plateau at 3,370 kcal/person/day and even shows a slight decline of –40 kcal/person/day between 2008 and 2010.
❚❚ Changes in the relative share of food products in diets
Major differences in the types of food available contribute to the disparity in dietary calorie availability between developed and developing countries. Between 1963 and 2003, developing countries experienced significant growth in calories from meat (+119%),
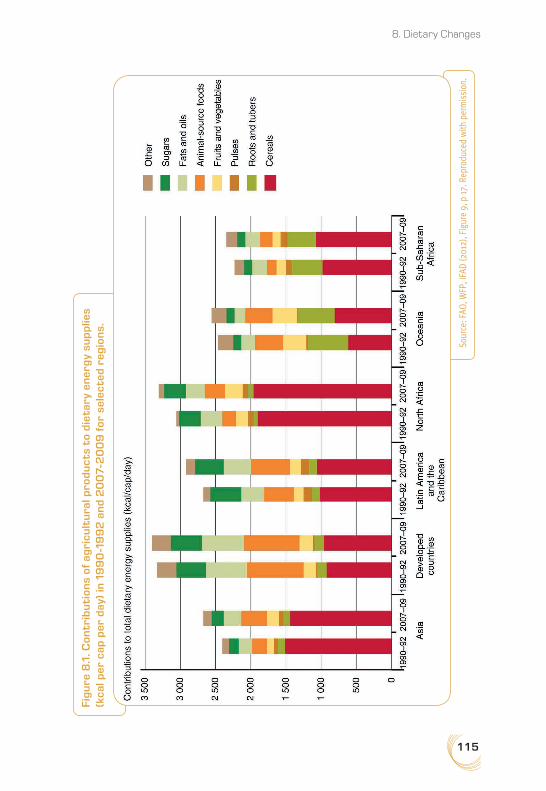
115
8. Dietary Changes
Figu
re 8
.1. C
ontr
ibu
tion
s of
agr
icul
tura
l pro
du
cts
to d
ieta
ry e
ner
gy
sup
plie
s (k
cal p
er c
ap p
er d
ay)
in 1
99
0-1
99
2 a
nd
20
07-
20
09
for
sel
ecte
d re
gion
s.
Sour
ce: F
AO, W
FP, I
FAD
(201
2), F
igur
e 9,
p 17
. Rep
rodu
ced
with
per
mis
sion
.
116
LAND USE AND FOOD SECURITY IN 2050
sugar (+127%) and edible plant oils (+199%), whereas in developed countries, growth was mainly due to an increase in edible plant oils (+105%), with much smaller increases in the calories available from meat (+15%) and cereals (+15%) (Kearney, 2010).
Worldwide consumption of cereals rose from 128 kg/person/year to 147 kg/person/year between 1961 and 2009, an increase of 15% (Keats and Wiggins, 2014). Although the share of cereals and roots and tubers in dietary calorie availability fell slightly between 1990 and 2006, from 56% to 51% (FAO, 2013), cereals continue to play an important part in dietary calorie availability, providing around half of the average daily intake across the world. Cereals are particularly important in developing countries, where they provide up to 70% of the dietary calorie availability and less so in developed countries (32%) (Kearney, 2010; FAO, 2013). Wheat is the main cereal crop and worldwide consumption has increased much more quickly than any other cereal, especially in developing countries. The availability of secondary cereals (barley, sorghum, rye, millet, oats etc.) has fallen, though millet and sorghum remain an important source of calories in many sub-Saharan countries.
Overall, dietary availability of roots and tubers fell by –21%, from 77 kg/person/year to 61 kg/person/year between 1961 and 2009. There was a +48% increase in the availability of animal products over this period, with the strongest growth in North Africa, East Asia (China) and Southeast Asia.
Between 1990-92 and 2007-09, marked differences and contradictory trends were observed at regional levels (Figure 8.1). For example, in Asia, dietary calorie availability from cereals and roots and tubers declined while that from animal products and edible plant oils increased. Over the same period, calorie availability from cereals increased in sub-Saharan Africa, raising concern over a reduction in the diversity of food products available and subsequent effects on health and food security.
❚❚ The diverse dynamics of malnutrition: towards a greater overall burden of malnutrition
A global reduction of undernutrition but with major regional differences
Undernutrition has decreased rapidly in developing countries, mainly as a result of the improved availability of food. But 780 million people are still undernourished, suffering from chronic hunger (FAO, IFAD and WFP, 2015).
Childhood undernutrition reflected in stunting (too short for their age) has declined by –40% in developing countries since 1990 (Table 8.1). While 44% of children under five were stunted in 1990, the rate dropped to 29% in 2010 (Smith and Haddad, 2015). The number of stunted children globally has decreased from 253 million in 1990 to 165 million in 2011 (Black et al., 2013). It’s a figure that remains high however. Undernutrition, including nutrient deficiencies, is a cause of 3.1 million child deaths annually, representing 45% of all child deaths in 2011 (ibid.) There are major regional differences behind these figures.
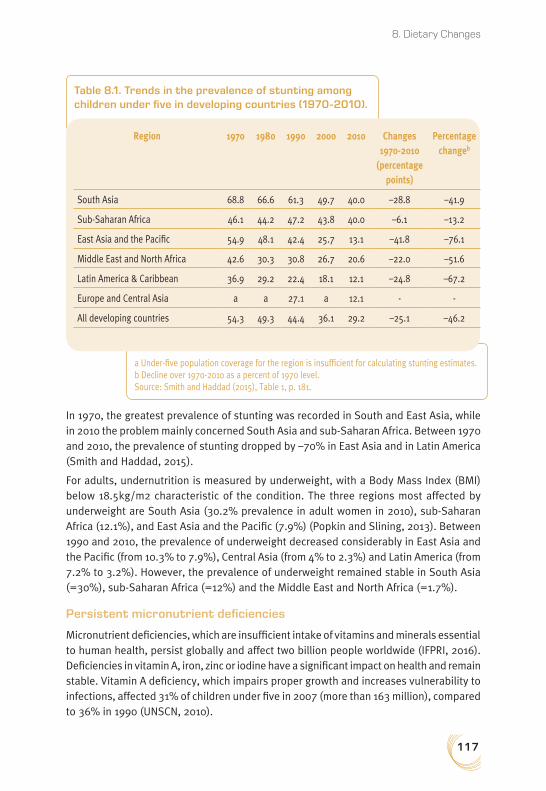
117
8. Dietary Changes
In 1970, the greatest prevalence of stunting was recorded in South and East Asia, while in 2010 the problem mainly concerned South Asia and sub-Saharan Africa. Between 1970 and 2010, the prevalence of stunting dropped by –70% in East Asia and in Latin America (Smith and Haddad, 2015).
For adults, undernutrition is measured by underweight, with a Body Mass Index (BMI) below 18.5kg/m2 characteristic of the condition. The three regions most affected by underweight are South Asia (30.2% prevalence in adult women in 2010), sub-Saharan Africa (12.1%), and East Asia and the Pacific (7.9%) (Popkin and Slining, 2013). Between 1990 and 2010, the prevalence of underweight decreased considerably in East Asia and the Pacific (from 10.3% to 7.9%), Central Asia (from 4% to 2.3%) and Latin America (from 7.2% to 3.2%). However, the prevalence of underweight remained stable in South Asia (=30%), sub-Saharan Africa (=12%) and the Middle East and North Africa (=1.7%).
Persistent micronutrient deficiencies
Micronutrient deficiencies, which are insufficient intake of vitamins and minerals essential to human health, persist globally and affect two billion people worldwide (IFPRI, 2016). Deficiencies in vitamin A, iron, zinc or iodine have a significant impact on health and remain stable. Vitamin A deficiency, which impairs proper growth and increases vulnerability to infections, affected 31% of children under five in 2007 (more than 163 million), compared to 36% in 1990 (UNSCN, 2010).
a Under-five population coverage for the region is insufficient for calculating stunting estimates. b Decline over 1970-2010 as a percent of 1970 level.Source: Smith and Haddad (2015), Table 1, p. 181.
Table 8.1. Trends in the prevalence of stunting among children under five in developing countries (1970-2010).
Region 1970 1980 1990 2000 2010 Changes 1970-2010
(percentage points)
Percentage changeb
South Asia 68.8 66.6 61.3 49.7 40.0 –28.8 –41.9
Sub-Saharan Africa 46.1 44.2 47.2 43.8 40.0 –6.1 –13.2
East Asia and the Pacific 54.9 48.1 42.4 25.7 13.1 –41.8 –76.1
Middle East and North Africa 42.6 30.3 30.8 26.7 20.6 –22.0 –51.6
Latin America & Caribbean 36.9 29.2 22.4 18.1 12.1 –24.8 –67.2
Europe and Central Asia a a 27.1 a 12.1 - -
All developing countries 54.3 49.3 44.4 36.1 29.2 –25.1 –46.2
118
LAND USE AND FOOD SECURITY IN 2050
Undernutrition is directly linked to dietary intake (the result of insufficient intake compared to an individual’s nutritional requirements) and health status. Food availability is not the only factor in reducing malnutrition. It depends on household resources, health environment and services, and resources for care for mother and children (Smith and Haddad, 2015). Factors such as food diversity, the education level and status of women and the sanitary environment play a major role. In a sample of 116 countries over the period 1970 to 2012, Smith and Haddad (2015) showed that food diversity contributed 15.2% to the reduction in child malnutrition, measured using stunting as the indicator, with improved food availability contributing 18.2% (ibid.). Food diversity’s role was particularly significant in Asia, where improved diversity accounted for 13.8% of the decline in stunting, whereas food availability accounted for only 4.2%. Increasing food diversity therefore plays a role roughly equal to the increase of available calories in reducing stunting.
A dramatic increase of overweight and obesity and diet-related non-communicable diseases
As a result of dietary and lifestyle changes, over-nutrition has developed with the intake of food products which are too rich in calories, proteins, fat, carbohydrates and sugar. There has been a significant shift from undernutrition to overnutrition as a predominant issue and the emergence of overweight and obesity and diet-related non-communicable diseases in developing countries.
The rise in overweight and obesity is a consequence of dietary change. Overweight and obesity is caused by increased calorie intake, changes in dietary composition and reduced physical activity levels (Ng et al., 2014). Overweight is defined as a BMI between 25 kg/m2 and 30 kg/m2 and obesity as a BMI of more than 30 kg/m2. In the past 30 years, the global rise in overweight and obesity has been dramatic, doubling in women and tripling in men. This increase accelerated in the past decade. While in 2005, the numbers of overweight and obese adults were 937 million and 396 million, respectively, the number of overweight individuals had reached 2.1 billion in 2013, of which 671 million were obese (Kelly et al., 2008; Ng et al., 2014). The proportion of overweight men rose from 28.8% in 1980 to 36.9% in 2013, and the proportion of overweight women climbed from 29.8% to 38%. Among children, the number of overweight increased +54% between 1990 and 2011, from an estimated 28 million to an estimated 43 million children (Black et al., 2013). Overweight and obesity rose rapidly in all areas of the world and in developing countries in particular. In 2013, half of the world’s obese population is found in ten countries: the United States, China, Russia, India, Brazil, Mexico, Egypt, Germany, Pakistan, and Indonesia. Some 62% of obese people in the world live in developing countries (Ng et al., 2014). Around 15% of the world’s obese population lives in India or China (where adult obesity prevalence is between 3.7% and 5%), while 13% lives in the United States (adult obesity prevalence of 33.8%). The trend of obesity prevalence in children, if maintained, would lead to an expected 9.9% prevalence level at the world level in 2025, or 64 million children (Black et al., 2013). If trends continue, by 2030, nearly 59% of the world population could either be obese or overweight (Kelly et al., 2008).
119
8. Dietary Changes
In relation to dietary changes, diet-related non-communicable diseases are dramatically growing each year worldwide, especially diabetes, cardiovascular diseases, osteoarthritis and certain cancers (Hawkes et al., 2009). Obesity is a major risk factor in the development of such diseases. While in Western countries cardiovascular diseases and cancers are the leading causes of mortality, and obesity and type 2 diabetes have now acquired the status of epidemics, these diet-related non-communicable diseases are now expanding at a fast pace in developing countries, while undernutrition also persists.
Unhealthy diet is one of the four behavioural risk factors for non-communicable diseases (NCD) among tobacco, physical inactivity and alcohol. In 2012, NCD were responsible for 68% of the 56 million deaths that occurred globally (WHO, 2014), of which three-quarters occurred in developing countries. If current trends are maintained, NCD deaths are projected to increase from 38 million in 2012 to 52 million by 2030 (ibid.). As diets changed, diabetes rose strongly from 108 million in 1980 to 422 million adults in 2014 (WHO, 2016). Two-thirds of all diabetes cases occurred in developing countries. In China, for example, where dietary changes are major, type 2 diabetes increased from a prevalence of less than 1% in 1980 to 10% in 2008 (Hu, 2011). In Asia, rapid economic development, urbanization and strong dietary change led to an explosion in the prevalence of diabetes.
The nutrition transition and its drivers
❚❚ A global nutrition transition? From developed countries to developing countries
Nutrition transition was first seen in industrialised countries, such as the United Kingdom, mainland Europe and the United States, from the early years of the 19th century, with Japan undergoing a similar change from 1910 to 1989. In these countries there was a shift to diets which were higher in calories, followed by a replacement of plant-based calories with animal-based ones and a reduction in the consumption of cereals and vegetables. Such a transition in diet is intertwined with an epidemiological transition as decreased undernutrition leads to longer life expectancy and, more broadly, fewer communicable diseases (Omran, 2005).
Since 1990, Drewnowski and Popkin (1997) have studied the nature and pace of nutritional transition and its relationship with economic, social and demographic factors. The current nutrition transition describes the global dietary changes and how diets are changing in low- and medium-income countries to converge towards what is often termed the ’Western diet’. Since the 1970s, diets have begun to shift “towards increased reliance upon processed foods, increased away-from-home food intake, and increased use of edible oils and sugar-sweetened beverages” (Popkin et al., 2012). Urbanization and increasing incomes are major drivers of dietary changes through eating style (out-of-home consumption and snacking) and food environment (supermarket, mass media and free trade agreements). In parallel, a reduction in physical activity occurred linked to urbanization processes and
120
LAND USE AND FOOD SECURITY IN 2050
changes in economic activities. The health outcomes of this dietary change are a strong rise in obesity and diet-related non-communicable diseases.
With the global diffusion of these diets and physical inactivity, obesity and chronic diseases have shifted from the high-income to low-income populations, from urban to rural areas, and from developed countries to developing countries (ibid.; Drewnowski, 2009). Studies in Brazil have shown a shift of the obesity problem towards individuals with lower socioeconomic status (Monteiro et al., 2007). Hawkes (2006) found that as national economies grew and gross domestic product (GDP) increased the obesity problem that initially affected the highest socioeconomic categories in both developed and developing countries became a problem for low-income populations as well.
❚❚ The four characteristics of the nutrition transition in terms of agricultural products
This dietary change, which takes place at different speeds, can be defined by increased intakes of refined carbohydrates, added sugars, fats especially vegetable oil and animal-source foods (Popkin et al., 2012). In term of agricultural products, four characteristics of the nutrition transition have been widely recognised: a revolution in edible plant oil, increasing consumption of animal products, increasing consumption of sugars and sweeteners, and declining consumption of legumes, wholegrain cereals and vegetables.
The first characteristic is the huge surge in the consumption of edible plant oil, which represents 8.5% of the calories consumed worldwide (Drewnowski, 2000). Drewnowski and Popkin (1997) stressed that, while the notion of the Westernization of diets continues to be associated with the consumption of animal products, nutrition transition in developing countries has seen strong increases in the share of edible plant oil in diets. Indeed, in developing countries, one-quarter of the calorie increase in daily intake in the period 1970 to 2006 was attributable to edible plant oils (Alexandratos and Bruinsma, 2012). This increased consumption strongly relates to food processing and to changes in national and international agricultural policy (Maire et al., 2002). Increased meat and dairy production requires increased production of feed protein for cattle in the form of oilcakes. Edible plant oil surpluses were produced and then sold on world markets at low prices due to government support in the form of subsidies, credits and food aid, and thanks to liberal trade policies, which opened up national and international food markets.
Growth has come from three major oilseed crops: soyabean, palm, and rapeseed (Hawkes, 2006). Together, these accounted for 69% of global edible plant oil production in 2005, up from 39% in the 1970s (Alexandratos and Bruinsma, 2012) and not only do these three oils dominate the market but they have helped structure the sector, which has seen production increases concentrated in a small number of countries (Brazil and Argentina for soyabean, Malaysia and Indonesia for palm oil and the European Union, China, Canada and India for rapeseed) (ibid.).
The second shift in diets concerns the increased intake of animal products. This current shift towards increased consumption of meat, eggs and dairy products is reminiscent of the first
121
8. Dietary Changes
dietary transition experienced in developed countries, although the ’livestock revolution’ in animal production has occurred only partially in developing countries (Delgado et al., 1999). Between 1970 and 2006, meat consumption in developing countries increased by an average of +5.1% per year and milk and dairy product consumption by an average of +3.6% per year. This rate of growth has slowed down and though meat consumption increased by +6.1% between 1987 and 1997, it increased by only +2.9% between 1997 and 2007 (Alexandratos and Bruinsma, 2012). In developing countries, the availability of meat tripled between 1963 and 2003 (Vranken et al., 2014), mostly in China, where per person consumption increased four-fold in 30 years, and in Brazil, where per person consumption doubled over the same period.
However, there are major differences among developing countries and it has been suggested that increases in meat consumption have been overestimated. In a study of meat consumption in 98 developing countries in 2007, Alexandratos and Bruinsma (2012) found that consumption was less than 10 kg/person/year in 23 countries and between 10 and 20 kg/person/year in 24 countries. In 17 of these 98 countries, including India and many African countries, there had been no increase in animal protein availability since the 1970s. They infer that the global phenomenon of increased meat consumption is much less widespread than suggested by globally aggregated data and is swayed by the heavy weighting of China and Brazil. Moreover, in Western countries, meat consumption appears to have stabilized, particularly in the United Kingdom, where it has actually decreased over the past 30 years (Kearney, 2010; Vranken et al., 2014).
The only effective ’revolution’ in meat consumption is in poultry (Alexandratos and Bruinsma, 2012). The share of poultry in total meat production increased from 15% in 1970 to 32% in 2006 and per person consumption of poultry tripled. In developed countries, per person consumption of poultry increased by +7.5% per year. Over the same period, there was no increase in beef consumption (Kearney, 2010) and, although pork consumption increased in China, it remained stable elsewhere.
The overall increase in the consumption of dairy products occurred at a slower pace and primarily affected developing countries (+3.6% per year between 1971 and 2007). In developed countries, dairy consumption was stagnant (+0.1% per year). Increased dairy consumption occurred mainly in China, South Asia and East Africa, and to a lesser extent in sub-Saharan Africa and North Africa (Alexandratos and Bruinsma, 2012).
Most nutritionists agree that these developments have led to an overall diversification in diets, which a priori has led to decreased overall undernutrition (though there are exceptions). However, this nutritional transition has also caused overnutrition and a dramatic increase in obesity and diet-related diseases.
Diets today contain much more sugar and sweetener than they ever did in the past, particularly with the advent of high-fructose corn syrup. Though data is scarce, changing sugar and sweetener consumption patterns in the United States reveal that per person consumption (for ages two and up) of added sugars is 375 kcal/day. Intake levels of added sugar from food have been relatively stable for the past 30 years, but sugar intake from

122
LAND USE AND FOOD SECURITY IN 2050
drinks (soft drinks and fruit juices) has increased sharply. In 1977–1978, two-thirds of added dietary sugar came from food; in 2003-2004 half came from sugar-sweetened beverages (Popkin et al., 2012). Energy intake from drinks increased by +217 kcal/day over the past 30 years in the USA, with drinks now representing 21% of daily energy intake (Barquera et al., 2008). Similar patterns can be seen in Mexico, where consumption of soft drinks increased by +40% between 1984 and 1998 (Rivera et al., 2004). Sugar consumption has increased significantly in East Asia and India and, to a lesser extent, in Latin American and Africa (Kearney, 2010). There are, however, considerable disparities among countries and, in many cases, no data available. As for edible plant oil, increased intakes of sugars and sweeteners are major drivers of unhealthy diets which are responsible for cardiovascular diseases, diabetes, and overweight and obesity.
Globally, consumption of coarse grains and pulses – which are characteristic of traditional diets in most developing countries – has declined. Though few studies focus on these categories, FAO data, from Asia and Latin America in particular, point to a downturn in their availability. These changes in diet reduce the diversity of nutrients and fibre intake.
❚❚ The pattern of the nutrition transition in terms of food products: the diffusion of processed and ultra-processed products
Dietary changes now happen at a much faster pace – and on a much larger scale – in developing countries than during the first nutrition transition observed in developed countries (Popkin et al., 2012). Dietary changes are primarily observed in urban areas, but now increasingly occur in rural areas as well. The current nutrition transition in developing countries is based on the rapid growth in fat from edible plant oils and the increase in animal product consumption has slowed at different rates across regions (while growth in meat and dairy consumption and decrease in vegetable fat consumption were the major characteristics of the previous nutrition transition; Drewnowski and Popkin, 1997). Another difference of the current nutrition transition is the diffusion of new processed foods and sodas (Rivera et al., 2004) which have changed the structure of diets and its patterns (with, for example, increased consumption of added sugars and vegetable oils). New agri-food products are introduced through advertising campaigns that often incorporate local viewpoints or traditions in an attempt to shift the cultural norms and rules that define what, where, when and how much people eat. Lang (1999) notes that nutrition transition is also a cultural transition, whereby a cultural consumption model is imposed through advertising and marketing.
To understand the obesity epidemic, a group of nutritionists at the World Public Health Nutrition Association analyzed the changes in the types of food products available in the global food system (Monteiro et al., 2010). They identified a strong correlation between the diffusion of ultra-processed products in the food system and the increase in obesity. Ultra-processed products include ready-to-eat meals that are high in calories, fat, sugars and salt, and are formulated to be tasty, or even addictive (Ifland et al., 2009). They are composed of ingredients derived from processed or refined foods, including hydrogenated

123
8. Dietary Changes
and other oils, flours and starches, various sweeteners and animal by-products. These products are widespread due to food distribution systems and are aggressively marketed by transnational companies (Moodie et al., 2013). The consumption of ultra-processed foods destabilizes traditional diets, leads to increased intake of obesogenic nutrients and to changes in dietary behaviour. The spread of ultra-processed foods first began in developed countries, where they were increasingly consumed from the 1980s and were accompanied by a rise in child and adult obesity rates. With the development of transnational food companies, these foods have recently become common in low- and medium-income developing countries where consumption has risen sharply (Moodie et al., 2013). In Brazil, for example, the share of ultra-processed products (e.g., ready meals, sausages, soft drinks, cookies and bread) in diets rose from 19% to 30% between 1987-88 and 2008-2009, while the share of culinary ingredients (e.g., oils, fats, flours and sugar) and minimally processed foods (e.g., rice, beans, meat and milk) dropped from 36% to 29%, and from 44% to 39% respectively (Martins et al., 2013). During this same period, the adult obesity rate rose from 12% to 17% (Martins et al., 2013). In Canada, the dietary contribution of ultra-processed products in total energy is more than 50% (Monteiro et al., 2013). Among low- and middle-income countries, ultra-processed foods now account for a quarter of daily energy intake in Mexico, Chile, Brazil (Martins et al., 2013), China (Monteiro et al., 2013) and in Asia in general (Baker and Friel, 2014).
The drivers of nutrition transition: urbanization and changes in food supply chains
Dietary changes have been driven mainly by rising incomes, urbanization and the globalization of food value chains. In this section, we focus on the impacts on dietary patterns of the urbanization processes, which to a certain extent are closely linked to economic development and the globalization of food value chains.
❚❚ Dietary changes driven by urbanization
The contemporary development of urbanization around the globe, proceeding at different rates in different regions, has modified the food environment and individual lifestyles, which in turn has caused dietary changes (Swinburn et al., 2011). Urbanization brings rural migrants to cities, where traditional rural diets rich in cereals, grains and fibres tend to be abandoned. As Dixon et al. (2007) emphasize, “the nutrition transition typically starts in cities because urbanization accompanies social and economic trends that promote transition” by modifying both food supply and food demand. City dwellers adapt their diets to their shifting lifestyles, which are marked by greater mobility, salaried employment and higher incomes. These factors lead to an increased frequency of meals eaten away from home, modifications to food preparation and changes in the types of foods consumed (more meat and dairy products). Urbanization also has a significant impact on the establishment

124
LAND USE AND FOOD SECURITY IN 2050
Source: Zhai et al. (2014), Table 2, p. 21.
Table 8.2. Food consumption changes per capita by age and urbanization in China (1991-2011).
1991 2000 2011 Three mega cities 2011
Age 2-18 19-59 60+ 2-18 19-59 60+ 2-18 19-59 60+ 2-18 19-59 60+
Edible oils – grams
17.6 23.4 22.7 19.8 29.4 30.1 20.9 29.9 30.6 17.0 23.0 22.0
Edible oils – % of total energy
7.8 7.8 9.0 9.7 11.2 13.3 12.0 13.0 14.7 10.0 12.0 12.0
Low urbanization 15.1 21.1 20.4 18.6 29.9 28.5 16.2 29.7 31.9
Middle urbanization
20.9 25.6 25.2 16.8 25.8 26.1 21.2 30.2 28.4
High urbanization 22.2 26.8 21.9 24.4 32 32.3 21.8 29.8 31.6
Total animal-sources foods – kcal/d
178.6 239.8 217.4 236.4 287.7 265.9 266.2 333.0 266.1 321.8 379.8 330.1
Low urbanization 131.3 168.9 141.5 1411.9 169.9 146.9 167.3 218.8 166.2
Middle urbanization
242.3 309.7 270.9 229.6 271.9 231.8 239.2 299.7 239.2
High urbanization 355.4 401.0 292.6 369.4 413.6 343.8 319.4 388.3 310.4
Coarse grains – kcal/d
87.6 114.0 87.0 41.8 56.6 56.8 25.4 39.0 48.0 10.0 17.0 25.0
Low urbanization 100.3 143.2 109.3 72.1 99.6 108.9 39.2 64.1 59.9
Middle urbanization
82.3 103.8 98.7 28.3 44.3 47.6 20.5 47.3 54.5
High urbanization 14.2 11.9 3.3 23.8 31.4 34.3 24.3 28.5 41.1
Legumes and products – kcal/d
59.5 77.5 78.9 59.5 78.4 74.3 46.1 73.6 73.0 33.0 52.0 66.0
Low urbanization 58.6 76.0 74.4 59.1 73.0 56.0 29.5 67.6 48.1
Middle urbanization
60.8 78.9 65.4 61.6 84.9 80.7 52.6 87.4 82.6
High urbanization 62.1 77.8 121.6 57.5 77.8 80.1 44.4 65.8 72.7

125
8. Dietary Changes
of large supermarket chains to supply urban populations, which determines access to products manufactured by transnational agri-food businesses. This is largely because urbanization helps to improve the transport systems that facilitate the exchange of products and improve access to imported products. Urbanization also goes hand in hand with access to mass media, which is coupled with the development of marketing and advertising for food products. In urban environments, low-cost processed products are typical food supplies, and food and beverage advertising is common. Urbanization leads to increased consumption of products sold by fast food restaurants, supermarkets and agri-food businesses, particularly soft drinks, ready-to-eat and processed foods. This combination of factors contributes to a globalized pattern of food consumption (Hawkes et al., 2009) characterized by similar trends in numerous regions throughout the world. Urbanization is also accompanied by a shift toward Western dietary practices, which is reflected in the high intake of energy-dense foods, oils and fats, and processed foods (Hawkes et al., 2009). Urbanization can improve undernutrition by increasing energy intakes and food diversity. However, dietary patterns and the lower physical activity levels of urbanites have major consequences on health. The appearance of diet-related chronic diseases is a direct result of the nutrition and food transition in urban areas. In countries where urbanization is increasing, diets are transforming rapidly and causing changes in epidemiological profiles. This dynamic is spreading to rural areas (Mendez and Popkin, 2004).
China reflects these changes (Zhai et al., 2014). Between 1990 and 2010, the urbanization level increased from 26.4% to 49.2% and the prevalence of overweight increased from 12% to 27%. In 2010, compared to less urbanized areas, the Chinese megacities (with more than 10 million of inhabitants) have the highest consumption level of animal-sourced foods (pork, poultry and dairy products) and lowest levels of consumption of coarse grains and legumes (Table 8.2). In comparison, the urbanization level in India in 1990 was similar to that of China but grew at a slower pace (25.5% to 30.9%) and the increase in the prevalence of overweight was also much more moderate, increasing from 13% to 18% (UN, 2014; Popkin et al., 2013). Urbanization levels remain low in East Africa (25%) and South Asia (34%), where the prevalence of overweight and obesity is less than 24% (Ng et al., 2014).
Nevertheless, changes do not seem to be wholly and exclusively linked to urbanization levels, especially in regions which are already highly urbanized. For instance, between 1990 and 2010, Latin America and North Africa saw modest growth in their urbanization levels (from 70.3% to 78.8% and 45.6% to 51.2%, respectively) while the prevalence of overweight increased sharply (from 34% to 51% and 58% to 71% respectively). Other factors appear to come into play, including access to and consumption of processed foods, based on the expansion of large food chains and lifestyle changes.
❚❚ Changes in food supply chains: impacts on nutrition and agriculture
Alongside the increasing urbanization described above, nutrition transition is also influenced by major changes in food supply chains. Food value chains are rapidly
126
LAND USE AND FOOD SECURITY IN 2050
changing in developing countries, especially specific segments of the supply chain such as wholesale, logistics, cold chain, processing and retail (Gomez and Ricketts, 2013). The role of transnational agri-food companies is central as they enter the food markets of developing countries to sell processed food at low prices, using marketing and advertising. The diffusion of highly processed food products is mainly linked to the development of large-scale retail and second-stage food processing, based on Foreign Direct Investment (FDI) (Reardon et al., 2012). But it is also linked to the small retailers and local stores that sell processed foods (Gomez and Ricketts, 2013). As Reardon et al. have shown in Asia, changes in these supply chains influence the transformation of both urban food markets and diet composition and farming (Reardon et al., 2012).
The massive development of the wholesale trade by private operators has been a significant element in the reconfiguration of food value chains (Reardon and Timmer, 2014). Large logistics companies provide wholesale services, warehouse management, integrated management systems, the development of a cold chain and packaging. The investment in logistics and storage helps prevent food losses and waste along the food system. At the global level, these changes are related to a decline in public wholesale markets (Guarin, 2013), the opening up of domestic markets and the development of Foreign Direct Investment (FDI), all of which are related to the liberalization of the distribution sector in the 1990s and 2000s (Reardon and Timmer, 2014). The development of wholesalers is removing intermediaries in the value chain; for example, there are fewer village intermediaries, collecting products from farmers, and direct purchase by wholesalers from farms is developing (ibid.).
The development of a private retail sector in the 1990s and 2000s has been called the ’supermarket revolution’. These trajectories were first observed in East and South Asia, then in Latin America and occasionally in West Africa (Reardon et al., 2012). In 2002, the share of supermarkets in the market for processed and packaged products was 33% in South-East Asia and 63% in East Asia; in the market for fresh products, the share of supermarkets was 15-20% in South-East Asia and 30% in East Asia (excluding China). China is experiencing rapid development in urban areas; the share of supermarkets in urban food markets was 48% in 2001, compared to 30% in 1999 (Pingali, 2007).
For consumers in developing countries, supermarkets offer access to dietary diversity by expanding the variety of products sold. However, the benefits of this diversity are limited to consumers with high incomes. Consumption surveys in Zambia and Kenya show that supermarket sales are primarily due to individuals in the wealthiest 20% and the diverse products offered are too expensive for most households (Dixon et al., 2007; Tschirley et al., 2010). Studies in Vietnam, Kenya, Zambia and Colombia have shown that low-income households purchase processed and packaged products in supermarkets rather than fresh products, dairy and meat, which are frequently more expensive in supermarkets than in traditional shops and markets (Cadilhon et al., 2006; Tschirley et al., 2010; Guarin, 2013). These factors limit supermarkets’ ability to provide a diet balanced in micronutrients for low-income consumers (Gomez and Ricketts, 2013).
127
8. Dietary Changes
Given that 85% of products sold by supermarkets are semi-processed or processed (Reardon and Timmer, 2014), the most significant effect of the transformation of retail trade has been on the processing sector. In Thailand, Mexico and China, between 50% and 80% of packaged and processed products are sold in supermarkets; in the same three countries, only 37%, 27% and 32% of fresh produce is sold in supermarkets (Gomez and Ricketts, 2013). The growth in sales of processed products in developing countries not only involves supermarkets but also uses traditional channels (allowing them to reach both urban and rural areas and using mass media and advertising to promote these products). For example, in India, small independent grocery stores located in both urban and rural areas accounted for 53% of sales of processed and packaged products in 2010 (ibid.). Poor consumers in developing countries are targeted and the diffusion of processed and packaged products is likely to have a significant impact on diets, disproportionately increasing the number of calories ingested per day by urban consumers and producing negative health effects. The spread of supermarkets may contribute to obesity and overweight by promoting access to cheap processed foods that are high in energy.
These changes in food value chains have had strong impacts on agriculture. In developing countries, domestic production has shifted to respond to local demand rather than causing increased imports, with the exceptions of wheat imports in South-East Asia, and rice and wheat imports in Africa (Reardon and Timmer, 2014). The domestic supply of non-cereal products has increased rapidly and has kept pace with dietary changes: diversifying production to meet demand; specializing production at the farm scale; developing commercial agriculture to supply urban markets near roadways and cities (diversification of products: fruit and vegetables, animal products etc.) (Pingali, 2007; McCullough et al., 2008). Worldwide, over the period 1961-2009, the crops with the strongest relative growth rates in national food supplies were those used to produce edible plant oils (see above) (Khoury et al., 2014). Changes in diets have reduced the diversity in global crop species, with the most rapid convergence occurring in East and South-East Asia and in sub-Saharan Africa. The reliance on a small number of crop species, mainly major cereals such as wheat, rice and maize, and oil crops, may pose problems for agricultural and genetic diversity, and biodiversity, and to the general resilience of the food system. Crops whose consumption has fallen, such as coarse grains and roots and tubers, are cultivated less extensively even though they are often better adapted to the particular agro-ecological situation as they are stress-tolerant varieties, could have important nutritional benefits and could be sources of additional fibre and nutrients (such as coarse grains), unlike the more common crops used to make energy-dense food.
Reducing malnutrition
The nutrition transition has enhanced food security by increasing calorie availability, but has also led to a dramatic increase in obesity and diet-related non-communicable diseases. By 2025, the World Health Organization (WHO) aims to halt the rise in obesity
128
LAND USE AND FOOD SECURITY IN 2050
and diabetes and reduce diet-related non-communicable diseases by 25% (Vandevijvere, 2014). Achieving this objective will be needed to improve food systems and diets. In this section we examine the different strategies to reach a healthy diet and the major actors responsible for it. Targeting a balanced diet through diet diversification appears to be a way of simultaneously addressing both overnutrition and undernutrition (Arimond and Ruel, 2004).
❚❚ The importance of protecting traditional diets at the regional level
On a global scale, the discussion regarding dietary changes puts more emphasis on the convergence of diets than on specific regional diets. But while food systems are evolving and hybridizing by integrating features of Western diets, they have maintained strong specificities based on culinary traditions and food culture as well as regional agriculture and crop species. For example, cereals account for more than 50% of daily calorie availability in North Africa and Asia (wheat and rice respectively) and for only 30% in developed countries (Figure 8.2). Secondary cereals are also important in sub-Saharan Africa, where millet and sorghum are widely consumed (Figure 8.2). Another example are roots and tubers, which represent more than 20% and 15% of daily calorie availability in sub-Saharan Africa and Melanesia respectively, while their share in other regions is less than 5% (Figure 8.2).
The traditional diets of low-income countries have interesting nutritional patterns, in particular because of the low share of unhealthy foods, although they are often energy-deficient diets with low consumption of animal products (Arimond and Ruel, 2004). Traditional diets tend to be high in protective food groups, such as vegetables, whole grains and fruit, and low in ’negative’ food groups, such as highly processed meats, salty and high-fat snacks and sweetened beverages (Delisle, 2010). A study on women in rural Tanzania has shown that ’traditional-inland’ diets, characterized by cereals, oils, fats and vegetables, are healthier than so-called ’purchase’ diets, which include breads, cakes and sugar and are associated with increased weight gain and obesity (Keding et al., 2011). However, the differences among regional diets and their transition modalities have so far been poorly studied (Tseng, 2005). A recent assessment of global dietary quality demonstrated that changes between 1990 and 2010 have tended to worsen overall diet quality, because the increase in unhealthy foods has been overtaken the benefit from the increase of healthy foods in dietary changes, especially in middle-income countries (Imamura et al., 2015). Thus, ’dietary Westernization’ in developing countries can usually lead to a deterioration of the nutritional quality of diets as a result of decreased fibre and increased sugar, fats, refined carbohydrate and salt (Uusitalo et al., 2005). The improvement of traditional diets through increased calorie intakes or their controlled hybridization with Western diets could substantially limit the development of diet-related non-communicable diseases. This approach would maintain the nutritional patterns of traditional systems and could limit the spread and impact of highly processed foods over

129
8. Dietary ChangesFi
gure
8.2
. Con
trib
uti
ons
of a
gric
ultu
ral p
rod
uct
s to
dai
ly e
ner
gy
avai
lab
ility
of
the
wor
ld r
egio
ns
in 2
010
(kc
al p
er c
ap p
er d
ay).
Sour
ce: G
lobA
gri-A
gT.

130
LAND USE AND FOOD SECURITY IN 2050
the long term. The main issue of such an approach is the regulation of the dynamics of dietary changes in the face of liberalized food markets and globalized value chains.
❚❚ The importance of supply chains for increasing access to healthy foods
The work of Tschirley et al. (2010) helped to relativize the role of supermarkets compared to traditional distribution networks, particularly in sub-Saharan Africa, and showed the importance of open markets for selling fresh produce. Traditional fresh produce supply channels (for fruit and vegetables and animal products) remain important in Africa and in developing countries in general (ibid.). Traditional channels account for the majority of fruit and vegetable produce sales, even in countries in which the retail sector is well established –63% in Thailand, 73% in Mexico and 68% in China. Wet markets have an important role in supplying fresh food to the poorest populations in countries such as Kenya, Zambia and Colombia, as do neighbourhood shops (Tschirley et al., 2010; Guarin, 2013). Most animal products in developing countries come through traditional channels, as shown by surveys in Ethiopia (beef), Kenya (milk and meat), Bangladesh (meat and dairy products) and Vietnam (pork). Low-income households in these regions have access to fresh animal products through nearby small outlets (Gomez and Ricketts, 2013). In sub-Saharan Africa, consumers access staple foods primarily through traditional supply chains (70% of staple foods on average in Zambia and Kenya). Similar shares exist in some Asian countries, such as India.
So, open air markets, informal vendors and traditional shops provide the poorest populations with access to fresh products, such as fruit and vegetables, dairy products, eggs and meat, at affordable prices. Access to these foods via these distribution channels can help to diversify the diets of low-income households and increase their intake of fibre and micronutrients (ibid.). Under certain conditions, including the improvement of food safety for animal products, promoting such channels can reduce undernutrition (Roesel and Grace, 2015).
❚❚ The role of rural-urban relationships in supply chains
Most supply chains go from rural to urban areas. Farmers diversify their production to include high value-added products or may specialize to meet urban demand (Pingali, 2007). Agricultural production systems tend to become more commercial as a result of the organization of the retail trade, wholesale trade specialization and better-structured supply systems. Actors in Asia have sought to strengthen the domestic supply chain between rural and urban areas by investing heavily in storage, packing, logistics and commercial services. For example, the rapid emergence of refrigerated storage facilities for potatoes in Uttar Pradesh ensures the potato supply in Delhi (where two-thirds of the potatoes now come from refrigerated warehouses located near production areas) (Reardon et al., 2012).
Intermediary cities can play a major role in the organization of food flows between rural areas and different categories of cities. Studies regarding the organization of supply chains

131
8. Dietary Changes
based on small mercantile production with a low level of capital emphasize the importance of synergy between the development of an urban network and the construction of supply chains to large cities. Several regions exemplify the importance of intermediary cities as vectors for shaping rural economies and reinforcing food security in response to urban food demand (Chaléard, 1996; Shen and Ma, 2005; Cadilhon et al., 2006).
Faced with the rise of global obesity, diet-related health problems and food crises, some cities or regions are addressing food security and nutritional concerns by re-regionalizing food systems (Donald et al., 2010). This approach is based on the notion “that the conventional agro-industrial food system has not effectively provided a nutritious, sustainable and equitable supply of food” (ibid.). It promotes the production and consumption of ’regional foods’ based on the emergence of regional food networks linking urban and rural areas (Kneafsey, 2010). Across the world numerous initiatives to promote sustainable access to fresh and healthy food for urbanites seek to forge new alliances between consumers and producers and between urban and rural areas (Sonnino, 2009; Marsden and Sonnino, 2012). The policy tools used include the development of public procurement strategies for food access, spatial planning in peri-urban areas to protect agricultural land and boost the capacity of urban agriculture to reduce malnutrition, the establishment of food policy councils to mobilize civil society to design urban food strategies and the creation of ’food hubs’, which promote new connections between urban and rural areas and ensure the supply of fresh products (Gomez and Ricketts, 2013).
❚❚ Food policies for healthier diets
Addressing unhealthy diets and the global convergence toward Western diets requires a multisectoral policy approach which includes the food supply and trade, and its implementation has proved to be challenging. For most authors, nutrition policies, using incentives rather than regulatory approaches, have failed to slow the growth of obesity (Kleinert and Horton, 2015) and have had only limited effects on diet-related non-communicable diseases (Popkin et al., 2012; Moodie et al., 2013; Swinburn et al., 2015). Based on public-private partnerships, these soft approaches include voluntary codes of conduct and product reformulation, the labelling of healthy food products and the promotion of physical activity. As stated by Vandedevijvere (2014), “voluntary initiatives by the food industry do not seem to work well without strong government leadership and the threat of legislation”. Drawing on the experiences of nutrition policies in Brazil, Monteiro and Cannon (2012) proposed binding regulations to limit the spread of ultra-processed products that destabilize diets and to protect traditional diets.
Public policies aimed at healthy diets target educational issues, trade, industrial processes, consumption and relationships between actors within the supply chain. The current literature advocates three types of measures (Hawkes, 2012; Popkin et al., 2012; Pinstrup-Andersen, 2013; Swinburn et al., 2015): taxes on unhealthy products; regulations that restrict the marketing and advertising of unhealthy products (including sodas) to children; and policies to foster the consumption of, and access to, healthy foods in schools and

132
LAND USE AND FOOD SECURITY IN 2050
public sector food services. The first two are intended to limit the consumption of unhealthy products, while the third aims to promote healthy foods which include fruit and vegetables. Though few nations have implemented these measures, Brazil has established a policy requiring that 70% of food served in schools be fresh or minimally processed and Mexico has implemented binding regulations on sodas and snacks (a 10% tax and a ban on sodas and snacks with high calorie content in schools) (Stern et al., 2014).
Complementarity between public policies and establishing comprehensive global regulations is essential. An increasing number of nutritionists (Chopra et al., 2002; Swinburn et al., 2011; Vandedevijvere, 2014) suggest a global initiative “to establish internationally binding instruments” or “international tools” for “regulating trade, investments, production and promotion of healthy and unhealthy products”. Chopra et al. (2002) suggest the definition of certain nutritional standards and guidelines in the Codex Alimentarius to frame nutrition issues for the food trade. A second proposal is to expand the sanitary concerns of the World Trade Organization (WTO) to encompass nutrition. WTO agreements might include financial instruments to limit international investment in products with a negative impact on public health (ibid.). However, movement towards the comprehensive treatment of nutrition issues is slow. In 2013, the WHO established the Global Action Plan for the Prevention and Control of Non-communicable Diseases 2013-2020. To promote healthier diets, this plan includes a targeted reduction of salt added to processed foods, of trans- and saturated fats in food products and their replacement by unsaturated fats, the limitation of added sugars in foods and beverages, the limitation of excess calorie intake linked to high energy density foods, and the increased availability and affordability of fruit and vegetables.
Since the 2000s, studies have emphasized the importance of the food environment and its transformation due to the globalization of supply chains and the penetration of developing countries by transnational food companies (Hawkes, 2006; Popkin et al., 2012; Swinburn et al., 2015). The challenge today is to implement nutrition policies that can act on different stages of the supply chain by, for example, encouraging food processors to implement processing which preserves the nutritional qualities of food and to reformulate unhealthy food products (Keding et al., 2013; Crino et al., 2015; Fardet et al., 2015), promoting the production of fruit and vegetables (Pinstrup-Andersen, 2013) and access through outdoor markets and local shops (Gomez and Ricketts, 2013; Keding et al., 2013).
Implementing nutrition policies which address both undernutrition and overnutrition is a complex issue. Indeed, studies have shown that programmes intended to reduce undernutrition by increasing calorie availability may increase the prevalence of overweight and obesity (Popkin et al., 2012). Focusing policy on diet diversification could be a means of simultaneously addressing both undernutrition and overnutrition (Vorster et al., 2011; Fanzo, 2014). Such policies would facilitate access to a variety of products. Moreover, with respect to overnutrition, dietary diversification could limit the impact of ultra-processed products. Such diversity could also enhance traditional diets, which often suffer from low food diversity (Keding et al., 2011).

133
8. Dietary Changes
Future global diets in 2050
Based on the trends described previously as well as on potential disruptions, four narratives for global diets in 2050 have been produced. They result from the combination of contrasted assumptions on changes until 2050 in the key drivers of the global diet system. As indicated in Table 8.3, four key drivers have been considered: (i) food transition patterns, in terms of the types of products consumed (cereals, fats, meat, processed foods, soft drinks, fruit and vegetables); (ii) the food supply chain; (iii) government food policies; (iv) health outcomes relating to overnutrition and undernutrition. One may notice that agricultural production is not included as a key driver of the global diet system. Nevertheless, we consider, as part of the four global diet pathways, their impacts on agriculture.
The first two narratives describe pathways based on current nutrition transition trends. The first one emphasizes a transition to diets based on ultra-processed products, while the second considers a transition to diets based on animal products.
The other two describe disruption pathways relative to current trends. The first assumes major food policies towards healthy diets based on diversified foods, and the other describes regional pathways of food supply chains coherent with traditional diets.
The quantification of these four narratives are presented in Chapter 14.
❚❚ Hypothesis 1: Transition to diets based on ultra-processed products. A global dietary convergence based on transnational value chains
Looking backwards from 2050, a strong nutrition transition in developing countries has led to a convergence of diets worldwide and a significant increase in energy consumption (Table 8.3). This transition has been driven by the large-scale deployment of transnational value chains in developing countries. The growth of retail outlets, logistics, agribusiness multinationals, marketing and advertising has reshaped the food supply in urban and rural areas. These changes in developing countries have globally resulted in increased consumption of vegetable oil, refined cereals, processed meat, added sugars and salt and reduced consumption of fresh products, pulses and coarse grains. All over the world, a strong convergence of diets has occurred as they now include a large proportion of processed and highly processed products that are often energy-dense and micronutrient-poor foods. In 2050, these low-quality diets have greatly increased the prevalence of overweight and obesity, and diet-related non-communicable diseases such as diabetes, cardiovascular disease and some forms of cancer. Furthermore, in 2050 declining dietary diversity for the poor has increased micronutrient deficiencies, despite better access to inexpensive calories than in 2010.
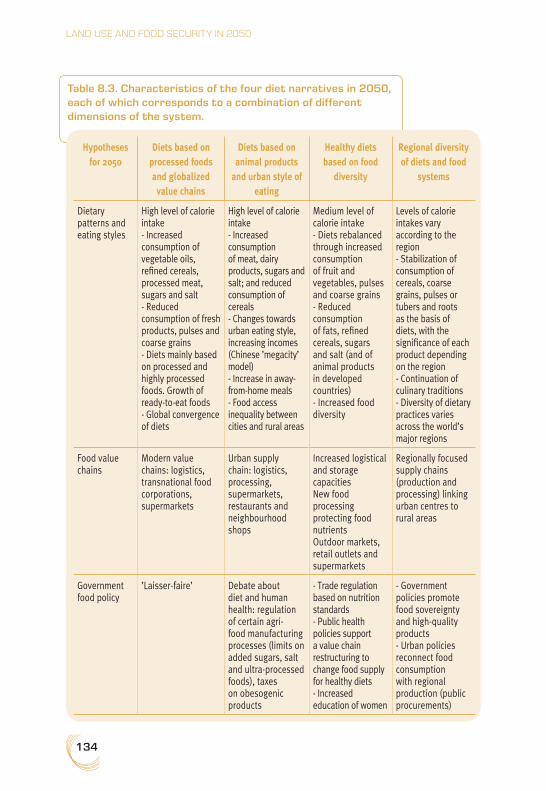
134
LAND USE AND FOOD SECURITY IN 2050
Table 8.3. Characteristics of the four diet narratives in 2050, each of which corresponds to a combination of different dimensions of the system.
Hypotheses for 2050
Diets based on processed foods and globalized
value chains
Diets based on animal products
and urban style of eating
Healthy diets based on food
diversity
Regional diversity of diets and food
systems
Dietary patterns and eating styles
High level of calorie intake - Increased consumption of vegetable oils, refined cereals, processed meat, sugars and salt - Reduced consumption of fresh products, pulses and coarse grains - Diets mainly based on processed and highly processed foods. Growth of ready-to-eat foods - Global convergence of diets
High level of calorie intake - Increased consumption of meat, dairy products, sugars and salt; and reduced consumption of cereals - Changes towards urban eating style, increasing incomes (Chinese ’megacity’ model) - Increase in away-from-home meals - Food access inequality between cities and rural areas
Medium level of calorie intake - Diets rebalanced through increased consumption of fruit and vegetables, pulses and coarse grains - Reduced consumption of fats, refined cereals, sugars and salt (and of animal products in developed countries) - Increased food diversity
Levels of calorie intakes vary according to the region - Stabilization of consumption of cereals, coarse grains, pulses or tubers and roots as the basis of diets, with the significance of each product depending on the region - Continuation of culinary traditions - Diversity of dietary practices varies across the world’s major regions
Food value chains
Modern value chains: logistics, transnational food corporations, supermarkets
Urban supply chain: logistics, processing, supermarkets, restaurants and neighbourhood shops
Increased logistical and storage capacities New food processing protecting food nutrients Outdoor markets, retail outlets and supermarkets
Regionally focused supply chains (production and processing) linking urban centres to rural areas
Government food policy
’Laisser-faire’ Debate about diet and human health: regulation of certain agri-food manufacturing processes (limits on added sugars, salt and ultra-processed foods), taxes on obesogenic products
- Trade regulation based on nutrition standards - Public health policies support a value chain restructuring to change food supply for healthy diets - Increased education of women
- Government policies promote food sovereignty and high-quality products - Urban policies reconnect food consumption with regional production (public procurements)
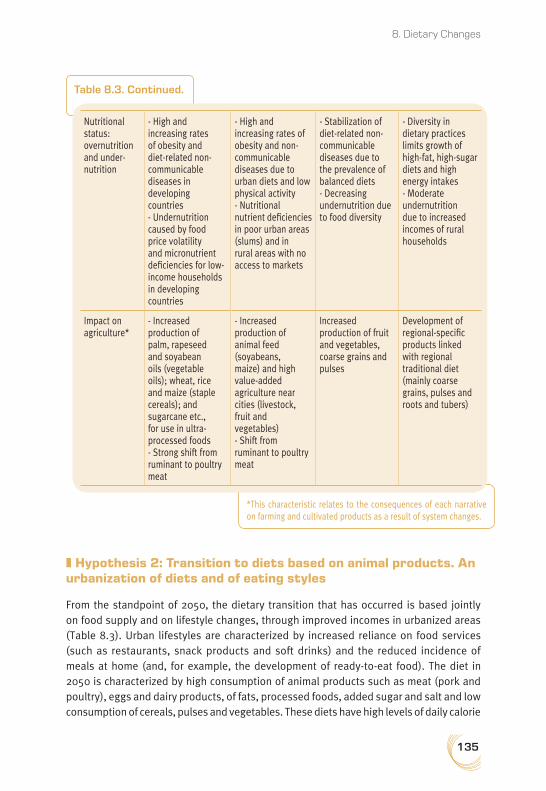
135
8. Dietary Changes
❚❚ Hypothesis 2: Transition to diets based on animal products. An urbanization of diets and of eating styles
From the standpoint of 2050, the dietary transition that has occurred is based jointly on food supply and on lifestyle changes, through improved incomes in urbanized areas (Table 8.3). Urban lifestyles are characterized by increased reliance on food services (such as restaurants, snack products and soft drinks) and the reduced incidence of meals at home (and, for example, the development of ready-to-eat food). The diet in 2050 is characterized by high consumption of animal products such as meat (pork and poultry), eggs and dairy products, of fats, processed foods, added sugar and salt and low consumption of cereals, pulses and vegetables. These diets have high levels of daily calorie
*This characteristic relates to the consequences of each narrative on farming and cultivated products as a result of system changes.
Table 8.3. Continued.
Nutritional status: overnutrition and under- nutrition
- High and increasing rates of obesity and diet-related non-communicable diseases in developing countries - Undernutrition caused by food price volatility and micronutrient deficiencies for low-income households in developing countries
- High and increasing rates of obesity and non-communicable diseases due to urban diets and low physical activity - Nutritional nutrient deficiencies in poor urban areas (slums) and in rural areas with no access to markets
- Stabilization of diet-related non-communicable diseases due to the prevalence of balanced diets - Decreasing undernutrition due to food diversity
- Diversity in dietary practices limits growth of high-fat, high-sugar diets and high energy intakes - Moderate undernutrition due to increased incomes of rural households
Impact on agriculture*
- Increased production of palm, rapeseed and soyabean oils (vegetable oils); wheat, rice and maize (staple cereals); and sugarcane etc., for use in ultra-processed foods - Strong shift from ruminant to poultry meat
- Increased production of animal feed (soyabeans, maize) and high value-added agriculture near cities (livestock, fruit and vegetables) - Shift from ruminant to poultry meat
Increased production of fruit and vegetables, coarse grains and pulses
Development of regional-specific products linked with regional traditional diet (mainly coarse grains, pulses and roots and tubers)
136
LAND USE AND FOOD SECURITY IN 2050
consumption and, combined with low levels of physical activity in urban environments, have led to an increase of obesity and diet-related non-communicable diseases. From 2010 to 2050, food inequality has increased as affluent urban populations gain access to a more diversified diet while disadvantaged urban populations living in slums are vulnerable to price variability. Certain rural areas lacking access to food markets (i.e., food deserts) have experienced increased undernutrition.
❚❚ Hypothesis 3: Healthy diets based on food diversity. Dietary practices promoted by nutrition policies
In the context of 2050, given the increasing costs of treating the consequences of overnutrition and malnutrition, public health policies have been implemented at both the global and national levels to reorient consumption towards healthier and more diversified diets and to address the persistent issue of malnutrition (Table 8.3). On a global scale, measures have been taken to limit trade in energy-dense ultra-processed products with low nutritional values. Measures implemented at the national level include health education and the reconfiguration of food systems to target key players and products (e.g., subsidized prices for fruit and vegetables; reduction of losses and waste; assistance to open-air markets; support for school food programmes; taxation of unhealthy foods). Diets have become more balanced and diversified through the inclusion of more fruit and vegetables, pulses, coarse grains and a moderate intake of animal products in developed countries. Improving access to a variety of foods and increasing daily caloric intake in developing countries has helped to address the challenges of undernutrition, particularly those associated with stunted growth in children.
❚❚ Hypothesis 4: Regional diversity of diets and food systems. A synergy between a re-regionalisation of supply chains and maintaining regional diets
Seen from the year 2050, regional supply chains have been reshaped reconnecting diets to regional food crops (Table 8.3). In contrast to the hypothesis of a global dietary convergence, since 2010 diets have been through diverse and heterogeneous pathways that have reinforced their regional specificity. Since 2010, the consumption of cereals, coarse grains, or tubers and roots as the basis of diets has stabilized, the significance of each product depending on the world region in question. Traditional value chains, which are now more or less hybridized with supermarkets or agribusiness, keep pace with contemporary developments, yet value culinary culture. Regional agriculture participates in value chains, through urban policies of major cities connecting urban food consumption to regional agricultural production and product quality certification systems. The prevalence of obesity and non-communicable diet-related diseases has remained stable since 2010 and, furthermore, undernutrition has reduced due to the impact of supply chain developments on the incomes of rural households.

137
8. Dietary Changes
Conclusion
This foresight analysis underlines the importance of pluralizing the scenarios for global diets in 2050. It suggests, on the one hand, putting forward for discussion the vision of a convergence in global diets and, on the other, putting aside dogmatic notions about the classic healthy diet (such as Mediterranean or vegetarian diets), in favour of an approach which takes into account multiple pathways of dietary change based on current diets and which mobilizes the nutritional qualities of traditional and regional diets. This chapter (see the quantification of future diets in Chapter 14) offers a set of four global diet scenarios that can be used for global and regional assessments of the impacts of dietary change.
138
9. Urbanization, Rural Transformation and Future Urban-Rural LinkagesOlivier Mora, Frédéric Lançon and Francis Aubert40
Introduction
Urban-rural relationships and urbanization processes play a significant role in food value chains, food security and nutrition, and, indeed, in land-use changes, though this is still overlooked in spite of some studies (Tacoli, 1998; Marsden and Sonnino, 2012). Since the 2008 food crisis, debates on food security and agricultural issues have emphasized the significance of the spatial organization of food systems and the location of agriculture. In this chapter, we focus on socio-spatial relationships between urban and rural areas taking into account urbanization processes and the structural transformation of rural spaces. Urbanization processes are transforming social, economic and ecosystem interactions between urban and rural areas and play a central role in re-configuring food supply chains. Rapid land-use change results from the intensified connections of cities and rural hinterlands, of sites of production and consumption, at various scales (Friis and Nielsen, 2017). For example, evidence of the increasing distance between places where demand for food is found and those where it is produced can be seen in the growth of food miles (Paxton, 1994) and the international food trade (Kastner et al., 2014). However, agriculture remains the primary activity in rural areas in developing countries, where it constitutes the main form of employment and rural areas continue to face specific issues with regard to poverty, food insecurity and undernutrition.
Rather than an overly dichotomous analysis, for example restricting urban dwellers to the role of consumers and rural populations to the role of food producers, the aim of this chapter is to explore the complex and intricate issues of urban-rural interactions based on a method combining two approaches. The first, summarized in Section 2, is a
40. The authors thank all the participants of the two sessions of the workshop on rural-urban relationships (Box 9.1). They also thank the contributors to the four regional case studies that helped us to finalize our rural-urban relationship hypotheses for 2050: Jonathan Rigg and Alberto Salamanca for their study on North Thailand, Ophélie Robineau for a study on Bobo-Dioulasso (Burkina Faso), Daniela Toccaceli for a study on Tuscany (Italy) and Bayuni Shantiko for a study on Java and Sumatra (Indonesia). For a presentation of those case studies, see the report of the workshop in Mora et al. (2014).
139
9. Urban-Rural Linkages
comprehensive scientific review scanning separately the current trends in urbanization and rural transformation processes. The second, presented in Section 3, is the result of a foresight workshop based on a specific expert group (Box 9.1). Based on the underpinning empirical observations, possible disruptions, weak signals and scientific controversies, the workshop resulted in the building of hypotheses about urban-rural relationships in 2050. Through these hypotheses, we underline the diverse significance of urban-rural assemblages for land use and food and nutrition security.
Significance and changes in urban-rural relationships
❚❚ The process of urbanization
The pace, nature and drivers of urbanization are discussed in the scientific literature. The shift from a mainly rural to a mainly urban population, through the increase in permanent rural-to-urban migration and natural growth in the urban population, underpins the global rise of an ’urban era’. However, the analytical dichotomy between urban and rural areas, and also the mechanisms at play, are increasingly subject to debate (Brenner and Schmid, 2013). It seems that the more urbanization increases, the more the ways of describing urban forms and urbanization processes are called into question; the apparent uniqueness of the urbanization phenomenon conceals a diversity of processes and relationships with rural areas.
Urbanization trends
Measuring the urban phenomenon remains a challenge, as there is no unified definition of what constitutes urban. An ’urban area’ is a vague concept, and the designation of urban or rural settlements is often linked to administrative functions. Depending on the country, the minimum size for an urban area ranges from a threshold of more than 2,000 inhabitants (as in France, Kenya and Gabon) to a threshold of 5,000 (Madagascar, Ghana and Mali), 10,000 (Greece and Ivory Coast) and even 20,000 inhabitants in the case of Nigeria (Moriconi-Ebrard et al., 2010). This criterion is frequently combined with other criteria concerning activities, with a strong presence of agricultural activities being discriminatory for the definition of ’urban’. The definition of an urban population has consequences on the definition of the rural population, since the most regular feature of ’rural’ is characterized by that which is not ’city’.
The most common indicator used for measuring urbanization is the urbanization level, which is “the increasing share of a nation’s population living in urban areas” (Satterthwaite et al., 2010). An increase in urbanization level results from several outcomes: net migration from rural to urban areas, high fertility rates and high natural urban growth in urban areas (Jedwab et al., 2015), expansion of urban boundaries or the formation of new urban centres based on in situ growth of rural villages (McGranahan and Satterthwaite, 2014).
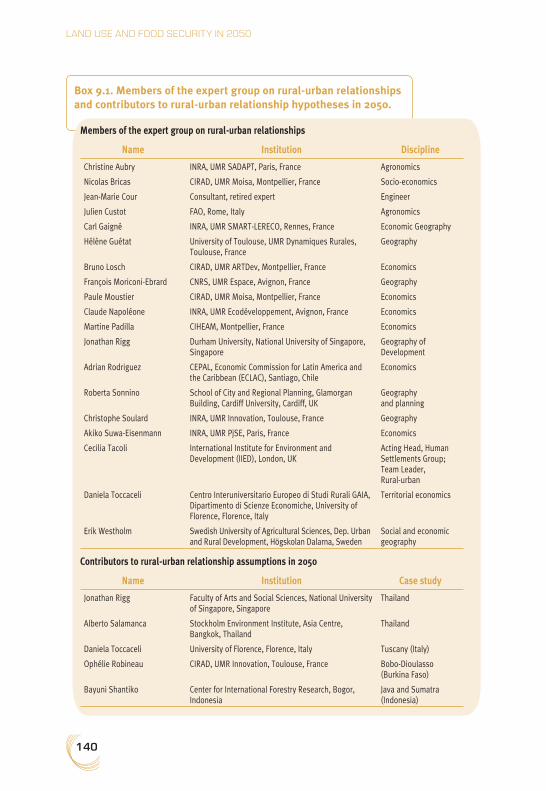
140
LAND USE AND FOOD SECURITY IN 2050
Box 9.1. Members of the expert group on rural-urban relationships and contributors to rural-urban relationship hypotheses in 2050.
Members of the expert group on rural-urban relationships
Name Institution Discipline
Christine Aubry INRA, UMR SADAPT, Paris, France Agronomics
Nicolas Bricas CIRAD, UMR Moisa, Montpellier, France Socio-economics
Jean-Marie Cour Consultant, retired expert Engineer
Julien Custot FAO, Rome, Italy Agronomics
Carl Gaigné INRA, UMR SMART-LERECO, Rennes, France Economic Geography
Hélène Guétat University of Toulouse, UMR Dynamiques Rurales, Toulouse, France
Geography
Bruno Losch CIRAD, UMR ARTDev, Montpellier, France Economics
François Moriconi-Ebrard CNRS, UMR Espace, Avignon, France Geography
Paule Moustier CIRAD, UMR Moisa, Montpellier, France Economics
Claude Napoléone INRA, UMR Ecodéveloppement, Avignon, France Economics
Martine Padilla CIHEAM, Montpellier, France Economics
Jonathan Rigg Durham University, National University of Singapore, Singapore
Geography of Development
Adrian Rodriguez CEPAL, Economic Commission for Latin America and the Caribbean (ECLAC), Santiago, Chile
Economics
Roberta Sonnino School of City and Regional Planning, Glamorgan Building, Cardiff University, Cardiff, UK
Geography and planning
Christophe Soulard INRA, UMR Innovation, Toulouse, France Geography
Akiko Suwa-Eisenmann INRA, UMR PjSE, Paris, France Economics
Cecilia Tacoli International Institute for Environment and Development (IIED), London, UK
Acting Head, Human Settlements Group; Team Leader, Rural-urban
Daniela Toccaceli Centro Interuniversitario Europeo di Studi Rurali GAIA, Dipartimento di Scienze Economiche, University of Florence, Florence, Italy
Territorial economics
Erik Westholm Swedish University of Agricultural Sciences, Dep. Urban and Rural Development, Högskolan Dalarna, Sweden
Social and economic geography
Contributors to rural-urban relationship assumptions in 2050
Name Institution Case study
Jonathan Rigg Faculty of Arts and Social Sciences, National University of Singapore, Singapore
Thailand
Alberto Salamanca Stockholm Environment Institute, Asia Centre, Bangkok, Thailand
Thailand
Daniela Toccaceli University of Florence, Florence, Italy Tuscany (Italy)
Ophélie Robineau CIRAD, UMR Innovation, Toulouse, France Bobo-Dioulasso (Burkina Faso)
Bayuni Shantiko Center for International Forestry Research, Bogor, Indonesia
Java and Sumatra (Indonesia)
141
9. Urban-Rural Linkages
The difficulty of identifying what is urban or rural is demonstrated by the case of India. In India, the urbanization level, as defined by the Census of India, remains at 28%, one of the lowest in the world, arguing for a high potential for urban growth in the future. However, in 2001, the number of ’villages’ having more than 10,000 inhabitants in India surpassed the number of official ’towns’ and ’urban areas’ with more than 10,000 inhabitants. In other countries, these ’villages’ would be considered small towns and included in the ’urban’ category. The authors conclude that the urbanization level is underestimated in India and that the “statistical approach of the urbanization does not allow to take in account the dramatic increase of thousands of small-sized urban localities” (Denis and Marius-Gnanou, 2011).
An urban transition
Based on the thresholds used in each country, the United Nations has estimated that over the past 60 years, the process of urbanization has been very rapid with the global urbanization level evolving from 30% in 1950 (meaning that 70% of the global population lived in rural areas) to 50% in 2007. This date underlines a shift in the world’s population, which has become mainly urban. In the latest urbanization prospects, published by the United Nations Population Division for 2014, the global urbanization level (the share of urbanites in the total population) was 54% (UN, 2015). The urbanization level was low in Asia and Africa, as these regions remain mainly rural with only 48% and 40% of their population living in urban areas. The highest levels of urbanization were in Latin America and the Caribbean (80%), North America (81%) and Europe (73%). In 2014, 78% of the inhabitants of more developed regions lived in urban areas, while this figure was only 48% for less developed regions. Since 1950, the rate of urbanization has been high in Asia and Africa, with a 1.5% and 1.1% annual increase in the proportion of urban population respectively. This indicates a rapid pace of urbanization compared to the slow pace seen in regions with high levels of urbanization, where the rate is generally less than 0.4% annually.
According to UN projections, the world’s urban population is expected to rise from 3.9 billion in 2014 to 4.9 billion in 2030 and to 6.3 billion in 2050, which corresponds to 66% of the world’s population being urban (UN, 2015). From 2014 to 2050, 90% of the increase in the world’s urban population will take place in Asia and Africa. The 50% threshold in urbanization would be crossed in 2030 in Asia and in 2050 for Africa, these regions reaching urban populations of 64% and 56% respectively in 2050. In sub-Saharan Africa, the urban population will quadruple, reaching 1.1 billion people, while that of Asia will increase by +61%, with India’s rural population doubling to reach 0.9 billion people in 2050. In contrast, in a few developed countries the urban population is expected to decline by 2050, with falls of –7 million in the Former Soviet Union and –12 million in Japan. The regional hypothesis of an eventual fall in the urban population should also not be excluded, as this has been observed in certain regions in the Northern hemisphere, particularly in some historical cities in regions experiencing economic decline or demographic changes, labelled “shrinking cities” (Pallagst et al., 2009).
142
LAND USE AND FOOD SECURITY IN 2050
According to UN projections, the world’s rural population will remain stable between 2014 and 2050. From 3.4 billion people currently, it will reach a peak in 2020 and decline slowly after this date to a rural population of 3.2 billion people in 2050. However, rural trends will be diverse between regions and will even evolve in contrasting ways. The rural population is expected to increase in one-third of the countries in the world, while remaining stagnant or decreasing in the other two-thirds. In sub-Saharan Africa, the rural population is expected to almost double, reaching 0.9 billion people in 2050. In Oceania, the rural population is expected to rise from a quarter (reaching 11 million people in 2050). With the exception of China, the rural population is expected to remain stable in Asia. In China, a major rural decline is expected to reduce the rural population by half, falling to 355 million people in rural areas in 2050.
The growth of urban populations associated with urbanization most often results in a reduction of the rural population.41 However, this relationship is neither general nor automatic. In developed countries, urban growth has long been based on rural migration fostered by high rural birth rates. The singular position of the African continent should be taken into account when analyzing the urban-rural interactions that are important to food security. That a high-growth rural population is maintained over the course of the urbanization process seems to support the thesis of the existence of urbanization processes without industrialization, or even without growth (Fay and Opal, 2000), in what Bezemer and Headey call the “urban bias” (2008). In this case, urbanization is not able to accelerate the transformation of rural structures (decline in the number of rural active workers and the modernization of agriculture) as was observed in industrialized countries. In addition, it should be pointed out that the UN’s methods for estimating trends tend to overestimate the rate of urbanization by 20 to 30% depending on the world region in development. Taking into account other hypotheses for changes in birth rates in urban areas also calls for the downward revision of hypotheses for urban growth (Bocquier, 2004; Montgomery, 2008; Potts, 2009).
Urban settlement size: the emergence of megacities and the development of medium-sized cities
Urban systems may simultaneously be defined by the distribution of the urban population between differently sized cities (urban hierarchy), the configuration of urban networks (polarized, polycentric or mono-centric) and by the morphology of the urban space (linear, star-shaped, compact, spread out etc.). All of these factors result from the history of interactions between cities, and each city’s interactions with the natural and other resources of its surrounding area and the wider spaces beyond (the city’s interface with the rest of the world).
The settlement size induced by urbanization processes is also important for urban-rural linkages. Recurring discourse in the media associates urbanization dynamics with the
41. In the early 20th century there were seven rural inhabitants for one urban inhabitant, today the ratio is one for one.

143
9. Urban-Rural Linkages
multiplication of large metropolises on a global scale, ’megacities’, emphasizing their strong demographic growth and their spatial expansion (’sprawl’). Indeed, one of the features of 20th century urbanization was that it led to the appearance of these large cities. In 50 years, the average size of the 100 most populated cities climbed from 2 million inhabitants in 1950 to 6.3 million inhabitants in 2000. There were just two ’megacities’ (i.e. cities with more than 10 million inhabitants) in 1950, 10 in 1990 accounting for 6.7% of the world’s urban population, and 28 in 2014. Between 1990 and 2014, the number of large cities of 5 to 10 million inhabitants more than doubled. In 2014, most of the large cities and megacities are already located in developing regions (Asia, Latin America and Africa). Contrary to the generally accepted idea, these large cities only host a small proportion of the global population. In 2014, megacities accounted for 12% of the world’s urban population, while small urban settlements with less than 500,000 inhabitants currently host half of the world’s urban population.
Moreover, medium-sized cities (1 to 5 million inhabitants) have been growing at a much faster pace than megacities. The population living in medium-sized cities doubled between 1990 and 2014, with 20% of the urban population living in these cities.
There is a scientific debate about the future of urban settlement trends. Some argue that historical trends, which tend to slowly shrink the share of urban population in small settlements in favour of megacities, will continue (UN, 2015). Others argue that the growth of large cities is decelerating and that the urban population is relocating in small and medium-size cities organized in networks (Satterthwaite et al., 2010; Moriconi-Ebrad et al., 2008). Despite past predictions of strong urban growth, megacity growth has slowed over recent decades (Jakarta), to reach a state of virtually no growth (Bangkok and Seoul) (Montgomery, 2008), or are increasing only through their natural demographic growth (for example, in India).
In 2025, the urban population in large cities with over 5 million inhabitants is expected to rise to 22% and to 24% for cities with 1 to 5 million inhabitants (UN, 2012). In 2030, the emergence of larger cities is expected, located in developing regions. One more megacity and six more large cities are expected to appear in China, seven more megacities in India, three more megacities and nine more larger cities in Africa and two more megacities in Latin America (UN, 2015). This trend to higher urbanite concentration in large cities is greater in developing countries than in developed countries, where the proportion of cities with less than 500,000 inhabitants is expected to fall from 50% to 41% in 2025, compared to only 53% to 46% in developing countries. However, according to Montgomery (2008), in the future these smaller towns (with fewer than 500,000 inhabitants) will continue to absorb close to half of the growth in the urban population, whereas megacities will not absorb a large share of this growth (about 10%).
The emergence of metropolitan regions
With the rise of megacities, the forms of urbanization in Asia and particularly in South-East Asia have been described as the emergence of large metropolitan regions within which

144
LAND USE AND FOOD SECURITY IN 2050
urban-rural distinctions tend to disappear (McGee, 2009). Many terms have been used in the analysis of this specific urbanization processes, such as ’Desakota’, ’City-Regions’, ’Mega-Urban Regions’ and ’Extended Metropolitan Regions’. The first metropolitan regions identified were Jakarta-Bandung, Hong Kong and the Pearl River delta region, and Bangkok.
This process of metropolization is characterized by the transformation of large cities in a fragmented peri-urban space and multi-polarized urban settlements. As described by other authors studying other world regions, the process of metropolization does not appear as a monocentric settlement pattern with a concentric spatial increase around one centre (as in Moscow) but as the emergence of a metropolitan network of cities with a poly-centric agglomeration pattern (as in Brussels/Anvers, Milan/Verona and Porto) (Moriconi-Ebrad, 2014).
In Asia, the emergence of metropolitan regions is also characterized by a high degree of mobility of people between workplace and residential areas (commuting), mobility of goods and by the close articulation of farming and non-farming activities (McGee, 2009). Studies carried out in Asia have characterized these dynamics in Manila, Jakarta, Bangkok, Kuala Lumpur, Ho Chi Minh City and Hanoi (McGee, 2009). To refer to the emergence of these new metropolitan spaces hybridizing rural and urban characteristics, in his study of Jakarta McGee uses the term desakota, combining the Indonesian words desa (village) and kota (city). It stresses the interpenetration of urban activities (industries and infrastructure) and rural areas, and at the same time a certain urbanization of rural lifestyles (forms of mobility and non-farming activities). The term desakota also conveys an urbanization process that does not fit the classical theory of rural migrations fuelling the growth and expansion of cities while rural regions decline (McGee, 1991). It differs from Western visions of peri-urbanization, mainly fuelled by households’ migration from towns towards their peripheries. The term desakota describes an urbanization that takes place in situ in rural areas with a high population density and which, through the growth of rural populations close to large metropolises, gives rise to extended metropolitan regions where farming and non-farming activities are closely intertwined, where urban buildings border fields and where transport and communication conditions have improved. This in situ urbanization is particularly strong in China, where rural migration towards cities is regulated by the Hukou system and where the influence of coastal metropolises is giving rise to vast metropolitan regions, as in the case of the Quanzhou ’city-region’ (Zhu et al., 2009) and the Shenyang-Dalian region (Wang, 1997).
The governance of metropolitan regions combines several land-use systems, one based on rural or ’agrarian’ regulation and the other urban, based on titled land ownership. Traditional land regulations often break down with the urban activities that characterize these spaces and so they escape urban planning tools, making these spaces ’grey areas’ for metropolitan governments. In addition, low-income households are often excluded from cultivated land since the competition for land usage intensifies with urban expansion (Tacoli, 2003; Shantiko, 2014). A major problem with these areas concerns the environmental tensions surrounding farmland, due to the pressure on land for urbanization

145
9. Urban-Rural Linkages
and the environmental deterioration due to highly intensive use, particularly of water, and air pollution (McGee, 2009).
Urbanization has concentrated consumers in large urban centres, physically distancing them from agricultural production spaces, and so the feeding of urbanites relies on complex and sometimes extremely long supply chains that mix the local, regional and international scales. As Allen (2009) highlights, as global trade expands, large cities becomes “less reliant upon their hinterland for sustenance and are increasingly importing not only their consumer goods, but also food, energy, water and building materials from distant sources.”
The role of intermediate cities
The importance of small towns in urbanization dynamics and in the distribution of the urban population has also been highlighted by different authors (Moriconi-Ebrard et al., 2010; Denis and Marius-Gnanou, 2011; Cohen, 2006; Montgomery, 2008; UN, 2012). The Africapolis study identified three contexts propitious for the growth of small cities: (i) in the densest rural regions, (ii) in the peripheries of large cities, and (iii) along major transport arteries, emphasizing the need to deepen knowledge on this last context. In sub-Saharan Africa, the emergence and multiplication of small towns results from in situ growth of villages and rural towns, essentially through natural growth without migration. Moriconi-Ebrard et al. (2008) stress the singularity of the urbanization dynamics at play, contrary to the classical perception of urban growth due to rural migration: it is “the lack of rural exodus [that] explain[s] urbanization, which in this case materializes through the proliferation of small and medium-sized towns” (Africapolis, 2008). These trends are driving the appearance of an ever-denser fabric of small towns, which can form vast nebulae or networks, such as the loose urban fabric that entirely covers the Kerala region in India (Denis and Marius-Gnanou, 2011).
Small urban centres provide access to employment in economic activities and to basic services such as health and education, both to urban people and to rural people from surrounding areas (Satterthwaite et al., 2010). As highlighted by Cohen (2006), policies in favour of small cities remain weak and in view of future changes in small cities, they need to improve their basic services in order to be able to manage their rapidly growing populations.
Small towns are also major places of intermediation with rural surrounding areas and agriculture (Chaléard, 1996). They simultaneously concentrate markets for agricultural products, transport activities, food processing and spaces of intermediation with external urban markets. They are central places for regional economies generating incomes for residents and migrants, and consuming and processing food from surrounding agriculture (Satterthwaite and Tacoli, 2003; Albaladejo, 2012; Robineau, 2014 and 2015). For example, in Bobo-Dioulasso, agriculture was previously based on the production of a main cash crop (cotton) and part of globalized networks. Today, Bobo-Dioulasso is a city in a strong relationship with its rural areas, which host diversified agricultural production: “the city acts as a relay for agricultural products, both for their processing and marketing, and
146
LAND USE AND FOOD SECURITY IN 2050
maintains close links with the agricultural activities in the region” (Robineau, 2014). Several contexts highlight the importance of these intermediary cities as vectors for shaping rural economies in response to urban demand, including China (Shen and Mab, 2005) and Europe (Toccaceli, 2014).
The hypotheses of reverse dynamics of urbanization
Along with Southern Asia, sub-Saharan Africa is a region with one of the world’s lowest urbanization levels (37%) but is undergoing urban growth, the intensity, nature and forms of which are debated. Urbanization in Africa is often characterized as the migration of poverty, driven by permanent rural migration towards urban areas (UN-HABITAT, 2008). However, as Fay and Opal (2000) noted, these cities are not in a position to create sufficient employment to absorb the influx of rural migrants. Based on the analysis of recent data collected by the UN-HABITAT Programme, Potts (2013) sheds light on unexpected variation rates in the urban population in sub-Saharan Africa.42 In a general trend reversal compared to the previous period, which saw a general rise in the levels of urbanization, a counter-urbanization trend (i.e., a drop in the share of the urban population) can be observed in 10 countries, while four others have a low rate of urbanization and only three countries are still experiencing a rise (ibid.).
The analysis of migratory dynamics sheds light on complex trends in urban-rural relationships. Even though migration towards cities continues to exist, at a statistical level, over the past 10 years, it has been counterbalanced by out-migration due to the lack of economic opportunities and security in the cities. As Andersson Djurfeldt and Jirström (2013) put it, the fall in rural migration as the main source of urbanization reflects changes in migratory behaviours. In part, permanent rural to urban migrations are being replaced with circular or seasonal migrations. These forms of mobility are resources that allow individuals and households to face up to the uncertainties encountered in urban settings (Andersson Djurfeldt, 2002; Simon et al., 2004). Temporary migrations have been studied in Zimbabwe (Anderson, 2002), Ghana (Simon et al., 2004), Zambia (Potts, 2005), West Africa (Beauchemin and Bocquier, 2004) and sub-Saharan Africa in general (Potts, 2013). These migration strategies in the face of precariousness translate into the development of a ’culture of mobility’ between urban and rural habitats, sometimes on a transnational scale.
❚❚ Rural transformations
At the global level, agriculture is still the main sector of employment. In 1990, 31% of the active population in middle-income countries worked in farming and 69% in low-income countries. The agricultural sector accounted for only 5% of the active population in high-
42. “By contrast urbanization in most countries in Asia has really been rapid: in the past two decades a much larger proportional shift out of rural areas has occurred than has recently been typical in Africa” (Potts, 2013).
147
9. Urban-Rural Linkages
income countries. These figures illustrate the wide variety of rural economies found around the world, but also the predominance of farming activities. In developing countries, most regional and rural household income depends essentially on small farms. Worldwide, it is estimated that 450 million farmers cultivate holdings of less than 2 ha, most of them living in Asia, supporting a population of around 2 billion (Rigg et al., 2016). Rural areas and agricultural activities continue to face specific issues concerning poverty, food insecurity and undernutrition; more than half of the people in the world facing food insecurity are small farmers.
In the coming years, rural areas of certain developing countries where the rural population is still growing will face strong rural transformations. For example, in sub-Saharan Africa, between now and 2025, economies will have to incorporate 330 million youths, 195 million in rural areas and 135 million in cities; 60% of the new workers entering the labour market will be rural (Losch et al., 2012). Currently, 65% of sub-Saharan Africa’s population still lives in rural areas and 65% of the labour force is engaged in agriculture. Given the challenges sub-Saharan Africa will face over the short and medium term (a 15-year period), it is difficult to imagine the creation of hundreds of thousands jobs a year in urban areas. This means that rural activities, which refers to both agriculture and the rural non-farm economy, will account for the “major part of the equation of youth employment” (Losch et al., 2012).
Rural non-farming employment and the ’deagrarianization’ hypothesis
Many studies have shown the growing role of non-farm activities in the development of rural economies and its importance for household income in developing countries. Over the past 30 years, non-farm activities (excluding secondary and seasonal activities) have developed and make up 30% of full-time rural employment in Asia and Latin America, 20% in West Asia and North Africa, and 10% in Africa (Haggblade et al., 2010). The household surveys examined by Reardon et al. (2007) have measured rural income by including seasonal and part-time activities. The resulting findings show that income from non-farming activities accounts for close to 35% of rural income in Africa and close to 50% in Asia and Latin America. The role of remittances (included in non-farm incomes) in this income varies between 11% of rural income in Asia and 6% in Africa and Latin America. This non-farming employment involves not only industry, which accounts for close to 20-25% of rural non-farming employment, but trade, transport, construction and other local services, which account for 75-80% (Haggblade et al., 2010). The composition of these activities varies hugely: small businesses offering farming services and food processing activities in rural areas, seasonal employment in farming and food processing etc. In some countries, public employment contributes to rural non-farming income, for example, in Egypt and Pakistan (45% and 25% of rural non-farming income respectively), and in India, where it makes up approximately 20% of rural non-farming employment (ibid.).
The increase in rural non-farming employment has been particularly strong over the past 20 years and many authors have argued that there is a ’deagrarianization’ of the rural economy (Bryceson, 2002). Deagrarianization is seen as a long-term process with peasants
148
LAND USE AND FOOD SECURITY IN 2050
veering away from the traditional production of export crops and staple crops, and finding income diversification in non-agricultural activities (ibid.). However, deagrarianization in sub-Saharan Africa has been much debated. Some authors emphasize the need to develop a livelihood approach to understand these changes. It is not just a change in the development model from agrarian to non-agrarian modes of production, but in terms of livelihood strategies for the adaptation and diversification of activities, bearing in mind the reversibility of such strategies used by households (Yaro, 2006).
There is a particularly large share of part-time activities and income diversification in rural non-farming employment. Studying Bangladesh, Nepal and Pakistan, Davis et al. (2010) showed that most households (52%, 53% and 36% respectively) have diversified sources of income (no activity exceeds 75% of total income). So in India (Lanjouw and Murgai, 2009), the share of rural non-farming employment rose from 22% to 31% between 1983 and 2004. Over the same period, the share of full-time farmers dropped from 38.8% to 31.9% and that of farming employees from 24.3% to 21.8%. According to Reardon and Timmer (2014), the current growth of rural income in Asia is mainly due to the growth in non-farming employment.
Multi-local households and new urban-rural mobilities
Mobility is complex and affects urban-rural relationships in multiple ways: long-distance migration, permanent migration, commuting between peri-urban areas and urban centres, circular or temporary migration, not to mention the leisure-related mobility that is particularly significant in developed countries. As Rigg and Salamanca (2014) underlined, “drawing a distinction between rural and urban and farming and non-farming, whether we do that in terms of production or labour, prevents us from seeing the inter-leaving of these activities and spaces”. Several researchers have pointed out that rural–urban migrations in developing countries are increasingly temporary or circular, through multi-local households that remain engaged in farming and develop non-farm activities in rural or urban areas (Tacoli, 2002; Rigg, 2006). Studies in Asia, Latin America and sub-Saharan Africa underline the relationships between temporary mobility and the diversification of rural activities. These studies highlight multiple locations and rural change in Malaysia (Preston and Ngah, 2012), livelihood diversification in rural Laos (Martin and Lorenzen, 2016) and rural Thailand (Rigg et al, 2012), rural livelihood diversification in sub-Saharan Africa (Ellis, 1998; Bryceson, 2002), multi-local livelihood and food security in rural Africa (Andersson Djurfeldt, 2015b), complex livelihood and circular migration for farmers in Mozambique (Mercandalli, 2013), pluri-activity and temporal mobility in rural and farming households in Bolivia and Central America (Vassas Toral, 2011; Prunier, 2013); multi-sited households in Amazonia (Pinedo-Vasquez and Padoch, 2009).
With the aim of diversifying the incomes of rural households, farming ones in particular, temporary migrations connect a rather rural location, where part of the household is located and engaged in farming activities, to another location, urban or rural, where other members of the household are engaged in income-earning activities in industry, services
149
9. Urban-Rural Linkages
or agriculture. Temporary or circular migrations that rely on extended family networks are becoming the norm in some developing countries in Asia and Latin America. They support diversified incomes for households, contributing to food security at this level.
Rigg (2006) stressed the fact that, far from just being poverty management strategies, circular and temporary migrations allow villagers to escape the employment constraints linked to farm work and to work throughout the year, thereby securing more regular income and diversifying the income stream. As Rigg and Salamanca (2014) show in their study of two villages in rural Thailand, households are often multi-sited between a village and Bangkok. These changes are linked to transformations in both rural and urban areas. Improving infrastructure, personal mobility and services in rural areas has permitted villagers to be multi-local, while the development of factories in peri-urban and rural areas brings work to mobile members of rural households. Furthermore, the resilience of farming in a household’s activities is closely linked to the vulnerabilities associated with non-farm work (ibid.). In this process, households “as a unit of production, emotional attachment and social relations” have not been dissolved, but have been re-spatialized (ibid.). In rural Asia, a large proportion of rural households have now diversified their activities in both urban and rural areas with income streams coming from both farm and non-farm activities and can be characterized as multi-local (Rigg et al., 2012).
As the current urbanization processes lead to a growth in small towns and increase the connectivity between urban and rural areas, the improved accessibility of towns or rural markets through transport infrastructure drives the development of rural non-farming activities. As Andersson Djurfeldt (2015a) shows in sub-Saharan Africa, smallholders in rural areas close to small towns are more likely to benefit from these changes in rural employment than those in remote rural areas that are poorly connected to urban centres.
Multi-local livelihoods depend on family networks and comprise temporary migration, remittances from urban to rural areas and food transfers from rural to urban areas (Rigg and Salamanca, 2014; Andersson Djurfeldt, 2015a). Cash transfers from remittances can contribute to the development of agriculture and can reduce rural poverty, thereby improving food security (Rigg, 2006; Satterthwaite et al., 2010; Deshingkar, 2012). However, the consequences of circular migration on agricultural development are ambiguous. On the one hand, remittances “sustain livelihoods, permit investment in education and farming, and bring development and substantial material gains to the village” (Rigg and Salamanca, 2014). Remittances can stimulate agricultural development and food security through higher urban incomes and new commercial opportunities (Andersson Djurfeldt, 2015a). As observed in Africa and Asia, these outside incomes allow investments to be made in farm production, through the purchase of agricultural inputs in particular, but they also help farmers to assure the financial security in their households that is necessary for experimentation with new agricultural practices, particularly crop intensification (Deshingkar, 2012). On the other hand, the departure of workers from the farm, and young people in particular, can lead to an accelerated ageing of the farming population (for example, China and Thailand), a feminization of agricultural work, or a deintensification
150
LAND USE AND FOOD SECURITY IN 2050
process (Rigg and Salamanca, 2014). Moreover, for the poorest households, food transfers from rural to urban areas can have a negative effect on food security for rural household members (Andersson Djurfeldt, 2015a).
Diverse rural transformations
A diversity of rural dynamics has been identified. First, non-agricultural activities develop in rural areas alongside agricultural ones (Haggblade et al., 2010; Losch et al., 2012). Non-farm activities provide additional income streams for rural households, drive permanent and temporary migration towards urban centres (with money and knowledge flowing back towards the countryside) and have led to the phenomenon of multi-local households (Rigg, 2006). In particular, household strategies prompt a reconsideration of the urban–rural dichotomy in favour of diverse possibilities ranging from urban to rural, which provide both opportunities and present challenges for households.
Second, from a spatial perspective, some rural areas develop into peri-urban areas because of urbanization pressures, with a specific mix of agricultural and urban activities (McGee, 1991; Moustier and Fall, 2004; Lerner and Eakin, 2011). Third, synergies arise between rural areas and small towns as they are simultaneously a market for products, a place for food processing and spaces of intermediation with other urban markets. Fourth, agriculture remains the primary activity in rural areas in developing countries. In regions where urbanization processes are weak, some reagrarianization could occur because of possible political and social crises.
Future urban-rural linkages in 2050
Analyzing changes in the relationships between urban and rural areas and their implications for land use and food security needs to take into account both the processes of urbanization and the transformation of rural areas. Rather than an overly dichotomous analysis, for example restricting urban dwellers to the role of consumers and rural dwellers to the role of food producers, we offer inter-relational assumptions for urban and rural areas.
Based on urban and rural trends, weak signals and possible disruptions, hypotheses for change in 2050 were constructed by the expert group. Three hypotheses for urbanization processes in 2050 have been developed: a concentration in large cities; the emergence of a network of cities; and a reverse trend towards the stagnation of large cities. In addition, four hypotheses for rural transformation based on rural trend processes have been constructed: the marginalization of the rural economy; the relative disappearance of the agricultural economy (deagrarianization); rural-urban synergies; and the diversification of the rural economy. Crossing hypotheses about urbanization processes and rural dynamics in 2050, we produce a matrix describing possible urban-rural linkages in 2050 (Figure 9.1). The aim of this double-entry table is to define the extent of what is possible and to explore the widest possible latitude of rural-urban interactions. These alternative visions of rural-urban relationships in 2050 range from the separation and complete control of one type

151
9. Urban-Rural Linkages
Figure 9.1. Alternative hypotheses for urban-rural linkages in 2050, combining urbanization processes and rural transformations.
152
LAND USE AND FOOD SECURITY IN 2050
of dynamics over another through to the implementation of integrated linkages, with a number of possible intermediate situations.
Our hypotheses to 2050 focus on four main future configurations in rural-urban relationships: megacities and spatial rupture with rural hinterlands; the role of intermediate urban centres in agri-food networks; household mobility and multi-activities between urban and rural areas; urban fragmentation, counter-urbanization and reagrarianization. These four assumptions can help to understand how distinct issues might be articulated and to better differentiate what is at stake for food security in these specific rural-urban linkages. In order to test and to enrich the plausibility of these hypotheses about rural–urban linkages, experts such as Jonathan Rigg and Albert Salamanca (Thailand), Ophélie Robineau (Bobo-Dioulasso), Bayuni Shantiko (Java and Sumatra) and Daniela Toccaceli (Tuscany) were asked to compare them to specific regional configurations and in particular to specify their food security and land use implications, from across Africa, Asia and Europe (Box 9.1 and Mora et al., 2014).
❚❚ Hypothesis 1: Large metropolitan region with a spatial rupture to rural hinterlands
In 2050, massive rural migration concentrated the population in large urban centres, particularly in coastal areas. This agglomeration was a response to a global dynamic of metropolization where exchanges (not only financial flows, but also flows of information, products and people) are concentrated in a limited number of well-connected cities, creating an archipelago economy at the world level. At the individual level, this generated a standardization of lifestyles, where consumerism is dominant and where regional or family solidarity is weakened. Spatially, these large metropolitan areas experienced an interweaving of urban activities (housing, transport infrastructure and industry) and rural activities, of which agriculture is part. Large cities are connected via international trade to some rural areas that may be far away, taking advantage of low transport costs. In addition, some agricultural activities develop close to large cities (urban agriculture and high added-value products) and in specialized places linked to large cities through international trade. However, farmers living in remote, marginal or disconnected rural locations have no, or difficult, access to food value chains and to urban consumers. Globally, the decline in agricultural employment is mainly due to rural migration to large urban areas. The food strategies of urban and rural households rely mainly on the purchase of food items available through national or international markets.
❚❚ Hypothesis 2: Multi-local and pluriactive households in a rural-urban archipelago
In 2050, temporary migration to cities developed according to employment and income opportunities in urban and rural areas. Farming remained a core activity within rural households, but it now took place within multiple activities. The share of non-agricultural
153
9. Urban-Rural Linkages
work in the incomes of rural households increased and mobility intensified, thanks to functional transport infrastructure. Circular and temporary migration rose due to uncertain urban growth. Incomes in rural households diversified and led to individual specialisation of activities within households. The organisation of this mobility between rural areas and urban areas is based on a network of cities, where migrants can find employment either in secondary cities in which industry or services are located, or other rural areas where cash crops create a demand for a seasonal workforce, or in large growing cities. Food strategies of multi-local households combine self-consumption, supplies from regional or international markets and supplies through family networks.
❚❚ Hypothesis 3: Rural areas integrated within urban networks through value chains
In 2050, urban organization is multipolar, powered by endogenous population growth and rural migrations. The development of cities and their relationships transforms the existing urban network. This urbanization process generates specific relationships between the network of cities and rural areas. The development of secondary urban centres in relation with larger cities leads to a reconfiguration of rural areas where synergies develop between agriculture, food processing and local food markets. Rural households have diversified activities including, in particular, processing operations or the marketing of agricultural products. Household food strategies rely on diversified foods, with traditional products consumed in the region retaining an important place. These are supplied through the markets in secondary urban centres.
❚❚ Hypothesis 4: Urban fragmentation and counter-urbanization
This scenario describes a set of de-concentration and fragmentation processes in the urban population through a block or an end to the growth of large agglomerations and by a carry-over effect on the growth of small urban settlements and medium-size cities. The new urban map resulting from this differential growth is favourable for historical locations and, where appropriate, to counter-urbanization. The end of rural migration to the cities is linked to increasing congestion problems, unemployment, pollution and lack of access to housing and basic services. It results in a redeployment of population growth to small towns, medium-sized cities and urban fragmentation (urban sprawl). In some regions of the developing world, an increase in rural populations even leads to reagrarianization and a decline in farm size due to pressure on land. ’Food deserts’ develop and food supply is now provided mainly by the informal sector, which relies on community and family networks.
154
LAND USE AND FOOD SECURITY IN 2050
Conclusion
Within this framework based on rural and urban current trends, we have explored a number of issues working on assumptions of urban-rural linkages in 2050. Through the assumptions, three main issues appear that could determine food security and nutrition issues in different ways: the role of metropolization in concentrating food value chains, the importance of the intertwining of urban and rural spaces for rural employment and agricultural activities, and household strategies. Modern food value chains, led by transnational food companies, and linked with urbanization, are complexifying the interactions between urban and rural places, convoluting scales, resulting in nutrition transition and changes in the location of agricultural production. Despite the homogeneous global discourse on world urbanization, looking at the plurality and diversity of urban dynamics helps us to reconsider the diverse impacts of urban-rural relationships on food and agricultural issues. In addition, the dominant narratives of urbanization and rural transformation are thrown into question by the development of non-farm employment, deagrarianization and household strategies based on synergies between rural and urban spaces. Regarding food security and nutrition, our hypotheses underline the role of urban agriculture and land planning for metropolitan areas, the importance of food chains in connecting small rural farmers to urban food markets, the role of intermediate cities in collecting, processing and retailing food products, and the importance of mobility between urban and rural spaces as a strategy securing access to food at the household level.
155
10. Farm Structures: Current Shaping Forces and Future FarmsCatherine Donnars, Marie de Lattre-Gasquet, Jacques Marzin and Laurent Piet43
Introduction
Why look at farms and farmers in a foresight process on land use and food security? The answer lies in the fact that, in concrete terms, it is farmers who manage most of world’s land used to feed humans and animals. Their production choices govern farmland use. At the frontiers of farmlands they contribute, on the one hand, to deforestation and the draining of wetlands in order to replace them with fields and grasslands and, on the other hand, they have to abandon degraded lands or are pushed off their land through social exclusion, poverty, war or urban development.
With regards to food security, although farmers are food producers, most of the poor and hungry people in the world live in rural areas and are, paradoxically, small farmers (HLPE, 2013). International reports (World Bank, 2007; Hazell et al., 2007; IAASTD, 2009; HLPE, 2013; Riesgo et al., 2016) converge on the assertion that supporting small farms can be considered a ’win-win’ proposition for hunger and poverty reduction. At the same time, massive land acquisitions and development of large-scale landholdings are taking place, putting the spotlight on the increasing role of finance in the agricultural sector. Farming models split opinion on the best way to improve food production and rural livelihoods. Two radical visions are in opposition: those who praise mechanized farming integrated into mass markets and those who recommend smaller farms practicing agroecology focused on local food systems (e.g., Altieri et al., 2012). There are many different options in between these positions. Another dispute concerns farmers’ relations to upstream and/or downstream agro-industrial corporations: is it an indicator of economic development or a path to dependence? (McMichael, 2009).
43. The authors thank M. Barzman for his review.

156
LAND USE AND FOOD SECURITY IN 2050
This chapter is based on the learning points of a workshop held in 2013 with international experts and stakeholders (Box 10.1).44 We first examined the drivers of change in farms and management practices, and their trends all over the world. Then we identified seven
44. The authors thank all the participants of the two sessions listed in box 10.1.
Box 10.1. Members of the expert group on farms structures.
Name Institution
Expert present in workshops in Paris (06/19 and 11/07 2013)
Agnes Andersson Djurfeldt
Department of Human Geography, Lund University, Sweden
Lubica Bartova Faculty of Economics and Management, Slovak University of Agriculture, Nitra, Slovakia
Martine François GRET, France
Pierre Gasselin INRA, UMR Innovation, Montpellier, France
Philipp Heinrigs Club du Sahel, OECD, Paris
Frédéric Landy University Paris-Ouest Nanterre, Nanterre, France
Eric Lambin University of Louvain, Louvain, Belgium
Bruno Losch CIRAD, UMR ARTDev, Montpellier, France
William Masters Friedman School of Nutrition Science and Policy at Tufts University, Boston, USA
Michel Merlet AGter, Nogent sur Marne, France
François Purseigle ENSAT, Toulouse, France
Miroslava Rajcaniova Faculty of Economics and Management, Slovak University of Agriculture, Nitra, Slovakia
Adrian Rodriguez CEPAL, Economic Commission for Latin America and the Caribbean (ECLAC), Santiago, Chile
Dimitri Skuras Department of Economics, University of Patras, Patras, Greece
Jan Douwe van der Ploeg
Department of Rural Sociology, Wageningen University, Wageningen, The Netherlands
Other experts interviewed
Perrine Burnod CIRAD, UMR Tetis, Antanarivo, Madagascar
Marie-Hélène Schwoob IDDRI, Sciences Po, Paris, France
Harris Selod World Bank, Washington, USA and INRA, PjSE, Paris, France
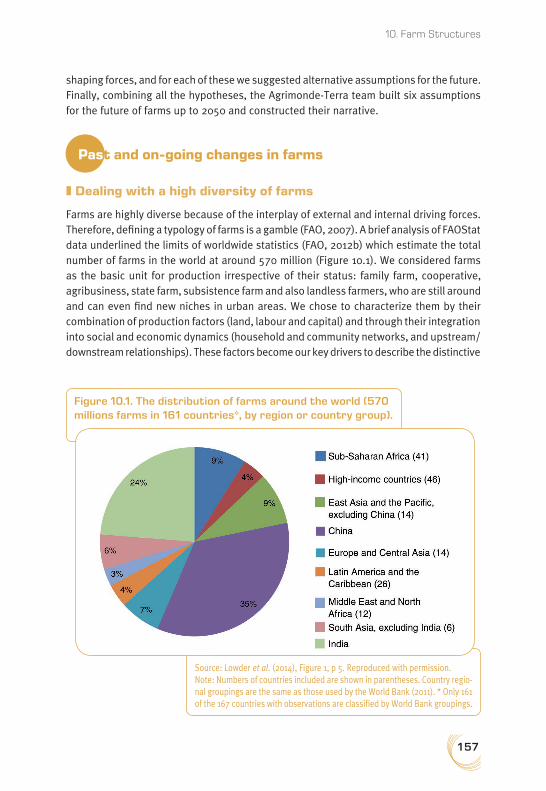
157
10. Farm Structures
shaping forces, and for each of these we suggested alternative assumptions for the future. Finally, combining all the hypotheses, the Agrimonde-Terra team built six assumptions for the future of farms up to 2050 and constructed their narrative.
Past and on-going changes in farms
❚❚ Dealing with a high diversity of farms
Farms are highly diverse because of the interplay of external and internal driving forces. Therefore, defining a typology of farms is a gamble (FAO, 2007). A brief analysis of FAOStat data underlined the limits of worldwide statistics (FAO, 2012b) which estimate the total number of farms in the world at around 570 million (Figure 10.1). We considered farms as the basic unit for production irrespective of their status: family farm, cooperative, agribusiness, state farm, subsistence farm and also landless farmers, who are still around and can even find new niches in urban areas. We chose to characterize them by their combination of production factors (land, labour and capital) and through their integration into social and economic dynamics (household and community networks, and upstream/downstream relationships). These factors become our key drivers to describe the distinctive
Figure 10.1. The distribution of farms around the world (570 millions farms in 161 countries*, by region or country group).
Source: Lowder et al. (2014), Figure 1, p 5. Reproduced with permission.Note: Numbers of countries included are shown in parentheses. Country regio-nal groupings are the same as those used by the World Bank (2011). * Only 161 of the 167 countries with observations are classified by World Bank groupings.
158
LAND USE AND FOOD SECURITY IN 2050
farming patterns. There are, of course, many other ways to distinguish the different “farming styles” (van der Ploeg et al., 2009). Some other potential drivers are examined in detail in other chapters: the global context (Chapter 6), rural-urban relationships (Chapter 9), changes in diet, food chains and food demand (Chapter 8), cropping systems (Chapter 11) and livestock systems (Chapter 12), for instance. We decided to consider them as background elements here. Some of their consequences, when important for shaping farm structures, are nevertheless pointed out. In the following, we describe the trends in our drivers observed over past decades. Farming patterns are also changing in space. The coexistence of different types of farms within a region is dependent on input and output market options, public policies, trade rules and power relationships. This balance is in constant flux.
Agricultural policies generally reflect roles that agriculture plays in the economy. In general terms, they seek to develop competitive and efficient farms as well as ensuring a fair standard of living and a stable income for farmers. Though they are usually generic in the sense that they apply to all farms together, agricultural policy measures sometimes target specific farming styles: smallholders (the main issue in developing countries according to international institutions), commercial farms, state farms, cooperatives etc.
❚❚ Farmland: size and access
Increasing number of farms of less than 2 hectares
One common way to define a farm is its size, as measured by the amount of land used (Eastwood et al., 2009; Hazell et al., 2007), though some database systems may instead consider the number of livestock or gross sales as criteria. However, depending on the type of production or the agro-ecological zone, farm size in hectares provides only an approximate measure of production potential. The World Bank – like other international organizations – uses 2 hectares as the threshold to define ’small-scale farming’ (World Bank, 2003). While this may be an appropriate limit in many countries, it is not the case worldwide. A Chinese farmer with 2 hectares is considered the head of a large farm, whereas a Brazilian farmer with 50 hectares would be considered to have a small farm in Central Brazil. The farm area criterion is also unsuitable for land held by several families or groups, as in the case of common land farming (Schwoob, 2012).
The extreme disparity of farmland distribution between farmers is a striking feature of world farming. Bélières et al. (2013) estimate that about 70% of farms use less than 1 ha which just about represents 10% of the total agricultural area. In contrast, 0.1% of farms represent one-third of the global farmland area (Figure 10.2). These results are consistent with others studies on farm area distribution (Lowder et al., 2016; HLPE, 2013). However, the situation varies greatly according to the region. Farms of more than 100 hectares represent more than 35% of all farms in Oceania, more than 25% in North and Central America, and more than 15% in South America. Farms of less than 1 hectare represent more than 90% of farms in China, around 60% of farms in India,

159
10. Farm Structures
other Asian countries and Africa, and about 28% of farms in North America and Europe (Bélières et al., 2013).
Because of the demographic weight of Asia and sub-Saharan Africa, the average area of farms in the world has been falling since 1950 (FAO, 2013; Masters, 2013; Lowder et al., 2014) (Figure 10.2). But it also fell in regions such as Latin America and the Caribbean where the average size shrunk from about 80 ha per farm in 1960 to 54 ha in 2000 (Lowder et al., 2016). The decrease in the average farm area in South Asia and Africa is primarily due to rapid population growth, with the young generation exerting strong pressure on farmland (Losch, 2012; Djürfeldt and Jirstöm, 2013).
The issue of whether an optimal farm size exists has a long tradition in the debate on “agriculture for development” (the title of the World Bank’s 2008 report). In particular, the role of smallholders is frequently discussed. According to one narrative, smallholders will never be ’competitive’ and the main policy focus should be the provision of social safety nets and education to help the youth find employment beyond agriculture. For the other narrative, smallholders represent efficient and resilient family ’peasants’ who are seeking autonomy and territorial insertion (Via Campesina, 2010; van der Ploeg, 2014). There are no clear answers to the relationship between increases or decreases in farm size and general growth in the economy (Eastwood et al., 2009). According to empirical studies, there is an inverse relationship between farm size as measured by area and farmland productivity in Africa and Asia, even though labour productivity of small farms is low (Larson et al., 2013; Ali and Deininger, 2014). Several recent works update this question by highlighting and quantifying the contribution of smallholders to production and food security (HLPE, 2013;
Figure 10.2. Number of farms according to their farm area in world regions.
Source: Bélières et al. (2013), Figure 4, p 37.

160
LAND USE AND FOOD SECURITY IN 2050
Wiggins and Keats, 2013; Herrero et al., 2014; Samberg et al., 2016). For example, Samberg et al. (2016) conclude that smallholders produce more than half of the food calories produced globally. Herrero et al. (2017) show that farms smaller than 2 ha produce more than half of all food nutrients in China and are of key importance in South Asia, sub-Saharan Africa and East-Asia Pacific. And if we consider farms under 20 ha, then their contribution to most food commodities grows to up to 75% in sub-Saharan countries, South-East Asia, South Asia and China. These authors add that both production and nutrient diversity diminish with increasing farm area and that the greater the diversity of farm sizes in a region, the greater the diversity of the nutrients produced.
Insecure access to land is still widely the case
It is generally recognized that there is a dynamic relationship between land rights and food security (Maxwell and Wiebe, 1999; ECA, 2004; Miggiano et al., 2010; Kepe and Tessaro, 2014). Many households that experience land insecurity also face food insecurity. Women are particularly affected by land insecurity because land regimes are often detrimental for them (Agarwal, 1994). Land rights are secure when there is a high degree of confidence that land users will not be arbitrarily deprived of land use and when an individual’s rights are accepted. Land rights are supported by land tenure systems, i.e. the sets of formal or informal rules and institutions which reflect relationships between people in their dealings with land.
Land tenure systems play a very important role (de Lattre-Gasquet et al., 2014). Many configurations exist such as verbal contracts, long or short-term leases, tenancy, sharecropping, public or community commons and illegal occupation. Depending on the arrangement, land can be owned by the farmer, belong to someone else or be a common good. For landless farmers, common lands often constitute a safeguard against social exclusion. Numerous local innovations underline the vigour of customary land laws, especially for irrigation networks or in pastoralist regions. Contrary to widespread opinion, titling is far from being generalized nor socially validated around the world. Nevertheless, it has been the object of significant effort in the 20th century and considered a necessary condition for securing access and investments in agriculture by many international donors (Binswanger and Feder, 1995). Nonetheless, the advantage of the land market over informal local arrangements is not obvious because it is not always transparent or fair, and public institutions sometimes fail in recording rights and adjudicating disputes (Binswanger and Feder, 1995). Furthermore, property rights and land use rights often overlap. A farmer can use plots having a different status: individual, collective, sharecropping etc. In many cases, large farmers are often absentee landlords. Therefore, some authors have suggested that land tenure systems should be evaluated as ’bundles of rights’ (Lavigne Delville, 2010). Finally, securing access to land seems to be more important than the formal status of the land (Macours et al., 2010).
There are situations which deserve specific mention. Some countries have opted for generalized state ownership of land, while in other countries unregistered land and land presumed vacant or without an owner constitutes ’a partial state monopoly on land’ (Chouquer, 2011). Land then can become a source of state revenue via the allocation of
161
10. Farm Structures
concessions or sales. Moreover, protected areas, parks and reserves prohibit access to crops and livestock. On the one hand, this contributes to conserving biological systems that would otherwise be degraded or destroyed, but on the other, people are displaced or denied access to resources (Brockington and Wilkie, 2015). Finally, land reforms are on the agenda in a few countries thanks to government programmes (Brazil, Namibia, the Philippines, Guatemala, Cuba etc.). But, with the exception of Zimbabwe, the proportion of concerned farmers rarely exceeds 1% of the national total.
Climate change has a large impact on land-use change. Climatic phenomena and environmental hazards such as floods, cyclones, droughts and wildfires increase insecurity of land tenure (Reale and Handmer, 2011). In particular, global warming exacerbates conflicts between nomadic cattle herders and crop farmers due to the scarcity of water and fodder.
Another striking phenomenon concerns large land acquisitions by foreign investors, mostly for agriculture and mining (Woodhouse, 2010; Anseeuw et al., 2012a). It is a subject of concern for NGOs and multilateral organizations (Grain, 2008; World Bank, 2010; Geary, 2012). Large acquisitions affect all continents and are no longer restricted to developing countries as recent debates in France show (Levesque, 2016). Such acquisitions result from the combination of increasing demand for food and biomass for energy and growing opportunities for financial gains from raw materials (Grataloup, 2007). According to ’Land Matrix’, between 2000 and 2016, 26.7 million hectares of farmland have been handed over to foreign investors who own about 2% of the global farmland. The average area in these transactions was 35,756 hectares and the median size 8,650 hectares (Nolte et al., 2016), which means that some transactions involved very large areas. Purchases concern primarily land with high agronomic potential, densely populated and accessible. However, many of these investment projects cause a media outcry and do not reach a conclusion. Lack of transparency and respect for local users’ rights, as well as competition with local elite powers, explain the high failure rates of land grabbing projects and undermine business viability (Burnod and Tonneau, 2013). International institutions are trying to promote ’good practices’ (World Bank, 2007; FAO, 2012a) but some studies highlight that the balance of power usually works against small farmers, who are sometimes excluded or dispossessed (Anseeuw et al., 2012a; Deininger and Byerlee, 2012; Oya, 2013). Moreover, the agribusiness plans of large companies to develop rural services and infrastructure seldom come to fruition (Dayang Norwana et al., 2011). There are, for example, too many cases where the authorities displace local people on the grounds that the agricultural project will serve the general interest, even though the venture is of a commercial nature. Such exclusion is also observed in Eastern Europe (Bazin and Bourdeau-Lepage, 2011; European Parliament, 2015).
❚❚ Farm labour force
The agricultural population is decreasing at the global level, growing in SSA and located mainly in Asia
The FAO defines the agricultural population as “all people depending on agriculture, forestry, fishing and hunting for their livelihoods. It comprises all the people economically

162
LAND USE AND FOOD SECURITY IN 2050
active in agriculture and their non-working dependents, but the agricultural population does not necessarily live exclusively in rural areas” (FAO 2013, p 4).
Until 2000, agriculture was the mainstay of employment around the world. Although the share of employment in agriculture declined, the number of people working in agriculture still reached about 1.3 billion in 2011. This corresponds to 40% of the global workforce (FAO, 2012b) but the share of agriculture in national labour forces varies considerably.
Over the past 40 years, the share of the agricultural sector in the active world population has been decreasing (Figure 10.3) especially in industrialized countries, but also in East Asia, Latin America and the Caribbean regions since the 2000s (FAO, 2012b). However, the total of people making a living from agriculture expanded in many regions: it almost doubled in Asia and multiplied by 2.5 in sub-Saharan Africa between 1961 and 2006, and is expected to increase until 2050 (Dorin, 2014). As a result, 91% of the world’s agricultural population are now concentrated in these two regions (77% in 1961) where they still represent 60% of the total workforce (80% in 1961). Hence, there are almost 500 million people working in agriculture in China and more than 200 million in India and in sub-Saharan Africa (Bélières et al., 2013).
Women and the elderly are important labour forces on farms. At the global level, women are more active in agriculture than men (FAO, 2012b). They produce more than 50% of foodstuffs (FAO, 2011a), this percentage rising to 60% in Asia and 80% in sub-Saharan Africa (ILO, 2005a). According to the FAO, 90% of the labour force involved in rice production
Figure 10.3. Active agricultural population in the overall active population: past situation and projections for 2020.
Source: Bélières et al. (2013), Figure 1, page 68 , based on data from FAOStat.
163
10. Farm Structures
is female. Ageing in agriculture is significant in Latin America, China, Northern Asia and Western Europe. Young rural generations tend to prefer urban or industrial jobs, which are better paid (Leavy and Smith, 2010; Proctor and Lucchesi, 2012). But they also give up farming because of the cost. Based on very substantial investments, doubts have been raised about the viability and capacity to self-reproduce of many modern farms (Hervieu and Purseigle, 2009). On the contrary, young people still represent 65% of the farm workforce in sub-Saharan Africa (Losch et al., 2011).
People working in agriculture have very diverse statuses
World statistics do not provide information on the status of workers in agriculture. These may be independent farmers, contractors, permanent employees, daily-paid workers or even forced into slavery-type conditions. The labour force on a farm often includes a variety of people who provide formal and informal contributions, thereby often making it difficult to determine the relative shares of family, unpaid and paid labour. However, the order of magnitude highlights the overwhelming majority of family labour. Despite the growing farm size, persisting high shares of family farmers in North America show that family farms remain even in modern agriculture due to labour-displacing capital accumulation and mechanization (Eastwood, 2009).
Waged employment in agriculture not only concerns large industrialized farms but also smaller-scale plantations as well as family farms. The rate of paid workers in agriculture is highly variable across the world and the figures are also controversial. According to FAO-ILO-IUF (2007), it concerns 450 million people. The share of waged work is generally low but can grow when farm size increases. It represents around half of the farm labour force, notably in three large countries: India (100 million paid workers of which many also have their own plot of land and hire their own workforce to complete the household income, World Bank, 2008), Brazil (4 million, OECD, 2015) and United States (1.4 million, OECD, 2015).
Farm labour is usually poorly paid. The gap between a farmer’s income and the national average income is often in the order of 1 to 10 in OECD countries and maybe up to 1 to 150 in the poorest countries (McMillan and Rodrik, 2011). There is also a lack of equity among farm workers as women and young people often contribute with unpaid work. Since the Millennium Summit, the International Labour Organization has supported national agricultural programmes on ’decent work’ (ILO, 2005b).
All around the world, farm households are increasingly pluri-active in order to diversify their income. In 2010, off-farm income had reached 40% or more of total farm household income in many Asian and African countries and 70% of total farm household income in China (Riesgo et al., 2016). Diversification may be imposed by unfavourable economic conditions or chosen as a strategy to spread risk (Ellis, 2000). The household configuration determines the level of multiple jobs and the activities on the farm. One or several members can contribute to income from an off-farm job and undertake non-agricultural activity on the farm (Losch et al., 2011; Anderson Djürfeldt and Jirström, 2013).
164
LAND USE AND FOOD SECURITY IN 2050
To complement this global snapshot, some recent studies have highlighted new forms of labour governance in agriculture. They partly appeared due to economic fluctuations and crises, which affect farms everywhere but are particularly detrimental to farms with few resources to cope with risk. Contract farming is one possible response (Cotula and Berger, 2014). The Ugandan sugar sector and the Mozambican biofuel plant sector, for example, seem to prefer contracting with family farms rather than recruiting employees. New jobs such as ’local development brokers’ have emerged. These function as intermediaries between investors, local authorities, technical advisers and those who implement production (Bierschenk et al., 2000). In some countries, large farms and landholdings tend to outsource farm work through service providers and machinery syndicates. Where there is complete delegation, the land owner no longer works on the farm (Hervieu and Purseigle, 2009). For example, in Argentina, the ’pooles de siembra’ (sowing pools) are the result of contracts between a club of investors, landowners who expect an annuity, and agricultural machinery enterprises hiring out labour and equipment from sowing to harvesting (Albaladejo et al., 2012).
❚❚ Capital: access to credit and technical improvement
International statistical indicators on capital are especially inappropriate with regards to the large number of farms which are not directed towards markets (Vatn, 2002; Losch, 2012). The more farms substitute labour with capital, the more they need financial instruments to manage their investments and working capital.
Difficult access to finance for poor farmers
Agricultural investments are generally considered high-risk because of production’s susceptibility to climatic hazards. Loans take the form of seasonal credits paid to farmers for a period of up to a year, but also finance investments land purchase, irrigation, machinery, post-harvest and processing equipment that are only amortized over several years. These term investments are often beyond the self-financing capacity of farmers (FAO, 2017b). Hence, a great number of agricultural households are in debt. High indebtedness is a big issue for farm transfer and farmers’ social well-being. Within vertical integration processes, food-processing firms may invest directly in farms which benefit from this external capital (inputs, buildings and equipment) but, in turn, farmers lose part of their decision-making autonomy.
Poor farmers, who have reduced access to savings, also have a low investment capacity (World Bank, 2007). This is especially true for women (Fletschner and Kenney, 2014) and those who live in remote areas where retail banking is limited and production risks are high (Kloeppinger-Todd and Sharma, 2010). In middle- and low-income countries, national budgets and development aid dedicated to agriculture remain limited (Figure 10.4). Nevertheless, widespread Internet coverage benefits remote rural populations by improving access to banks and telecommunication companies now increasingly offer financial services via mobile phones.

165
10. Farm Structures
Recent trends
Two radically different scales for outsourcing agricultural capital have recently arisen: macro-actors at the world level and local communities. During the 1980s and 1990s, financial liberalization led to a downward trend in agricultural finance. But since the 2000s, growth in food and biomass demands has attracted investors who include agricultural raw materials in their portfolios (Ouma, 2014). The promoters of agricultural ’financialization’ are macro-actors such as banking corporations, investment funds, pension funds, private equity firms and wealthy individuals often coming from outside agriculture. Their investments usually concern agro-holdings and farms involved in cash crops and biofuels. At a much smaller scale, social initiatives in credit have been re-emerging since the 2000s. For example, the NGO ’Terres de Liens’ in France and ’Viva Sol’ in Lithuania collect funds from the local community to provide land and equipment to farmers.45 An increasing number of local or regional authorities now operate in the same way (Bahner, 2011). Such initiatives are usually based on local solidarity in which the producer-to-consumer link is favoured (Fraticelli, 2011). These operations allow new farms to be established without inter-generational transfer and make it possible to overcome situations where farmers face unmanageable levels of debt.
45. https://terredeliens.org/ and http://www.accesstoland.eu/Viva-sol-Lithuania (accessed 12 April 2018).
Figure 10.4. Investment in agriculture in low- and middle-income countries by source in 2005-2007 (annual average). The number of countries covered is shown in parentheses.
Source: FAO (2017b), citing FAO (2012b), Figure 5, p. 14. Reproduced with permission.

166
LAND USE AND FOOD SECURITY IN 2050
Mechanization remains a key driver
Manual equipment and limited capital still characterize large parts of agriculture in the world, especially in pioneering zones where land may be cleared with very low capital input using slash and burn systems (Mazoyer and Roudart, 1997). In general, technical change is closely dependent on access to credit, information and output markets. This means mechanization is still unevenly spread across the continents (Figure 10.5). It is more common among wealthy and larger farms, which have easier access to finance. But several options can help small farmers who cannot afford to purchase equipment: rentals, recourse to machinery syndicates or the sharing of machinery within farmer communities or cooperatives.
Substituting labour with mechanization has been associated with the industrial revolution and, more recently, with the Green Revolution (Timmer, 2009). Techniques and equipment made it possible to intensify production and to irrigate crops. In Asia, the Green Revolution model was that of double-cropping, improved genetics, high input use and low mechanization. Land productivity increased considerably, generating surpluses to feed the growing urban populations. However, labour productivity remained low, which is the main reason for the high level of rural poverty observed. In the Soviet world, agricultural intensification was based on large collective production units relying on mechanization and intensive input use. In OECD countries, the Green Revolution model
Figure 10.5. Tractor use by region.
Source: FAO (2016b), FAOStat (2008). Reproduced with permission.

167
10. Farm Structures
oscillated between extensive mechanized agriculture in the United States and Australia, and intensification in Europe, leading to a major rural exodus that spanned two generations. The Green Revolution is now criticized because of its role in soil degradation and loss of biodiversity, which made many agricultural regions more vulnerable than they were prior to the Green Revolution (Ostrom et al., 1999).
Recently, information technology has brought innovations that claim to offer smarter resource use and better monitoring of livestock and agricultural production thanks to email and chat applications, remote sensing, spatial mapping technologies and robots (Torero, 2014). The impact of this ’digital revolution’ on agricultural sustainability is controversial. But it is supposed to become important due to the need for higher precision in the use of chemicals and in animal care, and due to demands for food documentation. Agro-ecology, that is agriculture based on biodiversity and natural processes, is another source of innovation and an alternative to capital-intensive, high-technology approaches.
❚❚ Integration into markets and food systems
Food systems are prominent forces shaping output markets and farm management. The growing urban consumer class is a worldwide trend; it has led to a standardization of food products through mass-market retailing and to globalized flows of agricultural commodities (Rastoin and Ghersi, 2010). The spatial distribution of production and farms is impacted by urban concentration and food supply industrialization as global markets give priority to regional specialization (Gaigné et al., 2011). On the one hand, international corporate concentration in the food sector strengthens the asymmetry between farms and upstream and downstream stakeholders (Woodhouse, 2010). Recent observations suggest a greater vertical integration due to the weight of supply-side drivers. This trend tends to transform independent farmers into ’service providers’ for big companies which oversee the process from input supply to harvest sale, processing and retailing. It has many implications for farm trajectories and regulations. Anseeuw and Ducastel (2013) describe, for example, South Africa’s new agricultural model based on foreign investments and a ’corporatization’ of the agricultural sector. On the other hand, a product consumed in one country is often produced in another and exchanged via international trade. Thus, local consumption is increasingly met by global supply chains involving tele-connections between different countries (Liu et al., 2013). Some studies underline the high rate of land use displacement currently needed to satisfy local food consumption (Yu et al., 2013). Farmers’ production choices are then increasingly driven by changing factors in distant markets (Lambin and Meyfroidt, 2011; Meyfroidt et al., 2013; Weinzettel et al., 2013; Kastner et al. 2014). Policymakers have to face this new challenge and are called upon to design policies which include risk management tools so that any adverse shock in another part of the world is unlikely to jeopardise both national food production and food security.
Besides global commodity markets, regional ’terroirs’ are promoted on all continents and there is a growing demand for products with specific attributes such as local, organic, fair trade, geographical indication or cultural heritage. The development of certified products leads to a large range of private and public regulations, including labels and private standards.
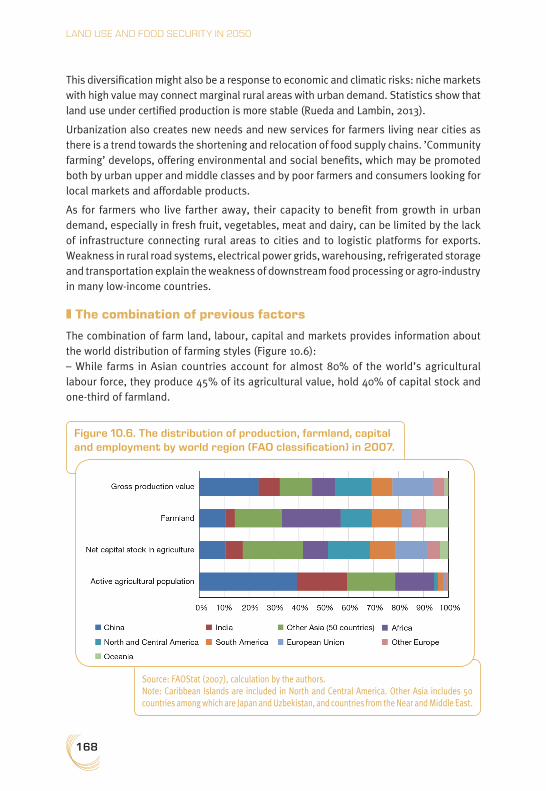
168
LAND USE AND FOOD SECURITY IN 2050
This diversification might also be a response to economic and climatic risks: niche markets with high value may connect marginal rural areas with urban demand. Statistics show that land use under certified production is more stable (Rueda and Lambin, 2013).
Urbanization also creates new needs and new services for farmers living near cities as there is a trend towards the shortening and relocation of food supply chains. ’Community farming’ develops, offering environmental and social benefits, which may be promoted both by urban upper and middle classes and by poor farmers and consumers looking for local markets and affordable products.
As for farmers who live farther away, their capacity to benefit from growth in urban demand, especially in fresh fruit, vegetables, meat and dairy, can be limited by the lack of infrastructure connecting rural areas to cities and to logistic platforms for exports. Weakness in rural road systems, electrical power grids, warehousing, refrigerated storage and transportation explain the weakness of downstream food processing or agro-industry in many low-income countries.
❚❚ The combination of previous factors
The combination of farm land, labour, capital and markets provides information about the world distribution of farming styles (Figure 10.6):
– While farms in Asian countries account for almost 80% of the world’s agricultural labour force, they produce 45% of its agricultural value, hold 40% of capital stock and one-third of farmland.
Figure 10.6. The distribution of production, farmland, capital and employment by world region (FAO classification) in 2007.
Source: FAOStat (2007), calculation by the authors.Note: Caribbean Islands are included in North and Central America. Other Asia includes 50 countries among which are Japan and Uzbekistan, and countries from the Near and Middle East.

169
10. Farm Structures
– Abundant land and labour are available for African farms, but their capital stock and output are low compared to other regions.
– Farms in North and Central America, Caribbean, Europe and Oceania concentrate almost half of the capital on 40% of the world’s farmland. However, they utilize only 5% of the global agricultural labour force.
Looking at the forces reshaping farms
Thanks to the expert group discussions, we identified seven forces acting on farm redesign: farm governance, mobility of production factors, labour organization, land use rights, the diversification of sources of income, distance to consumers and the rationale underlying land use. For each force, assumptions have been formulated for 2050.
❚❚ Governance distribution
Governance determines who makes decisions about production factor and output combinations, and how other stakeholders make their voice heard. Rapid and major changes redistributing farming governance are currently occurring in agriculture across the world. Farm expectations, performance criteria and strategic horizons vary according to this governance. Decision makers may prioritize family income, return on investments, employment, market outputs, environmental quality etc. Five assumptions for future farm governance have been identified:
– Governance by financial investors, e.g. banks, pension funds, investors’ clubs etc. The management of farm production is delegated from outside the farm by brokers.
– Governance by agro-industrial firms (public or private) as in the case of vertical integra-tion. Downstream operators in the agri-food systems or States are investing in farms in order to secure their supply of agricultural raw materials or to ensure a return on invest-ments and develop commercial networks. Farm management depends on the aggrega-tors’ strategy.
– Shared governance by farmers and non-farmers (e.g., consumers and local communi-ties), with reciprocal exchanges and recognition of the multi-purpose nature of farm acti-vities. Farm management results from local agreements.
– Collective governance by a group of farmers who jointly manage their land, share equipment, negotiate with buyers in order to improve their economic, social and politi-cal recognition (HLPE, 2013). Farmers’ groups can also develop sanitary or environmen-tal standards and quality certifications that would not be possible individually because of the excessive costs involved. Farmers may organize themselves in cooperatives or through other formal or informal collective agreements.
– Family governance. This is the most traditional mode of governance and largely the case in subsistence farming. Farmers and their extended families make decisions. They own or rent the farmland and can buy their inputs from whom they choose and sell to whom they want.
170
LAND USE AND FOOD SECURITY IN 2050
❚❚ Segmentation of production factors
Traditionally, production factors in agriculture are rooted at the farm level. However, the internationalization of markets, growing farm size in some regions and various dimensions of farming systems complicate resource needs and farm management. We have witnessed a rapid development of new forms of production that separate capital, land and labour managements, especially in Eastern Europe and Latin America (Cochet et al., 2011). While segmented, production factors are also more mobile. Farms may share or delegate part of these production factors. Five assumptions have been formulated for the future:
– High degree of segmentation and mobility of all production factors, i.e. land is rented, capital and labour are outsourced. Farm is run by one or several foremen who do not carry out the practical work but manage rented land and paid labour and rely on exter-nal sources of capital including that from the non-banking financial sector.
– High capital mobility. Farms rely on capital coming from investors with a wide range of profiles: industrial companies, urban investors’ clubs, international traders etc. High capi-tal mobility leads to the ’financialization of agriculture’. Investors seek rapid profitability.
– High labour mobility. Farmers or members of their households can migrate, either on a daily or seasonal basis. The quantity of labour on farms varies depending on the eco-nomic context and family needs.
– Local rooting of production factors. Farmers use their own labour force, have the full use of their farmland and investment relies on the family’s self-financing capacity and access to banking.
– Difficult access to land and capital. Labour is the main production factor and may be partly hired.
❚❚ Labour organization
Most farms are held by families whose members constitute the labour force. Substitution of family labour is related to mechanization. This evolution has been facilitated by the capacity of urban areas and developments in the industrial and service sectors to absorb labour from agriculture. However, situations and issues are diverse. In countries with large agricultural populations and few opportunities for leaving the farming sector, the maintenance of more people working in agriculture is crucial. In countries with an ageing farming population, the issues at stake include ensuring the renewal of the farming population, but also attracting workers for seasonal employment when the farm labour force is insufficient. Four assumptions were formulated:
– Family labour remains crucial. This is the case when there are few employment opportu-nities outside agriculture or low capital availability on the farm, but also for the production of high-value goods requiring manual work (hand-harvesting, for example), or even when there are biological or technical constraints (e.g., pollination by hand or additional wee-ding). In many situations, agricultural households have to perform off-farm jobs to com-plement their income and maintain their farm. Family off-farm jobs come from other farms or activities such as food processing, tourism, community services, industry and mining.

171
10. Farm Structures
– Collaborative work. Farmers become organized collectively within cooperatives, mutual support or even other collaborative networks involving alternative sectors (tourism, natu-ral space maintenance, food processing etc.). These alternatives often include the non-monetary exchange of skills.
– The labour force is substituted by mechanization and there is little family labour. – The labour force is outsourced to service providers or machinery enterprises.
❚❚ Land use rights
This dimension relates to the capacity of farms to exercise their right to use land. Securing land rights is an evolving process which does not exclusively depend on property titles. Customary or informal rights are secured when local rules are clear and when land rights are the subject of a social consensus. Various forms of contract exist that set out the modes of direct or indirect enforcement and make land available from seasonal to long-term leases. Land use insecurity arises from short-term tenancies, weak State regulatory capacity, social conflicts, corruption and non-compliance with local norms. The expansion of agricultural frontiers (Brazil, Indonesia, Malaysia, Congo etc.), the development of food and energy cash crops (e.g., in Western Africa) and also urban expansion are increasing pressure on land use rights. Three assumptions have been formulated:
– Insecure land rights. This pathway is on-going in regions with social and economic conflicts or wars. At the local level, land insecurity concerns corruption, power imba-lances between genders and social groups, and land grabbing.
– Partial move towards land use rights, with an unstable balance between farmers’ control and pressure on farmland. This process occurs with urban expansion or the implementa-tion of large agricultural projects.
– Land rights secure land access and use.
❚❚ Income source diversification
This process involves household strategies for diversifying income sources either through off-farm employment or on-farm through the increased added-value of outputs by integrating downstream activities or exploiting the multifunctional nature of agriculture. Diversification can be imposed by low prices or be a strategy to reduce production risks. Environmental subsidies or payments for ecosystem services can provide a significant part of farm incomes in regions with strong environmental issues. Four assumptions have been formulated:
– Diversification of income by off-farm jobs. Household pluri-activity provides a safety net for farming income.
– Diversification of income by diversification of activities on farms. Rural policies can encourage such income diversification.
– Income comes exclusively from the farm, potentially including subsidies related to far-ming activities.
– Few options for additional income
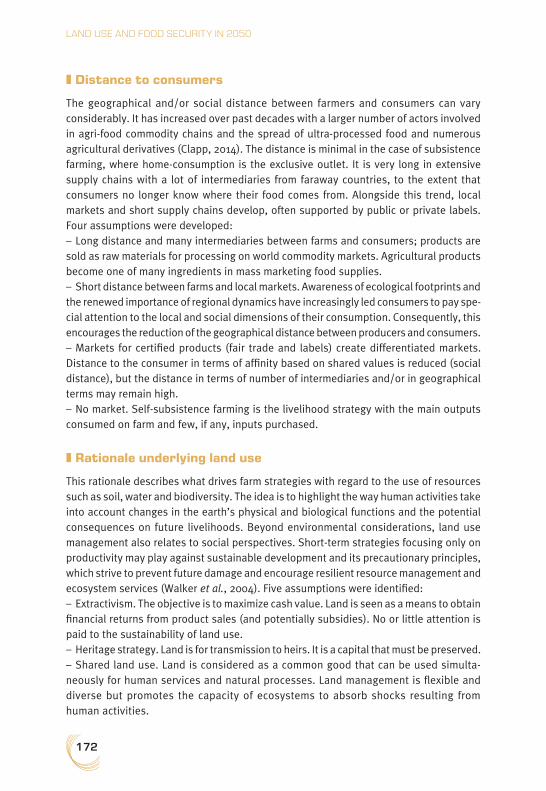
172
LAND USE AND FOOD SECURITY IN 2050
❚❚ Distance to consumers
The geographical and/or social distance between farmers and consumers can vary considerably. It has increased over past decades with a larger number of actors involved in agri-food commodity chains and the spread of ultra-processed food and numerous agricultural derivatives (Clapp, 2014). The distance is minimal in the case of subsistence farming, where home-consumption is the exclusive outlet. It is very long in extensive supply chains with a lot of intermediaries from faraway countries, to the extent that consumers no longer know where their food comes from. Alongside this trend, local markets and short supply chains develop, often supported by public or private labels. Four assumptions were developed:
– Long distance and many intermediaries between farms and consumers; products are sold as raw materials for processing on world commodity markets. Agricultural products become one of many ingredients in mass marketing food supplies.
– Short distance between farms and local markets. Awareness of ecological footprints and the renewed importance of regional dynamics have increasingly led consumers to pay spe-cial attention to the local and social dimensions of their consumption. Consequently, this encourages the reduction of the geographical distance between producers and consumers.
– Markets for certified products (fair trade and labels) create differentiated markets. Distance to the consumer in terms of affinity based on shared values is reduced (social distance), but the distance in terms of number of intermediaries and/or in geographical terms may remain high.
– No market. Self-subsistence farming is the livelihood strategy with the main outputs consumed on farm and few, if any, inputs purchased.
❚❚ Rationale underlying land use
This rationale describes what drives farm strategies with regard to the use of resources such as soil, water and biodiversity. The idea is to highlight the way human activities take into account changes in the earth’s physical and biological functions and the potential consequences on future livelihoods. Beyond environmental considerations, land use management also relates to social perspectives. Short-term strategies focusing only on productivity may play against sustainable development and its precautionary principles, which strive to prevent future damage and encourage resilient resource management and ecosystem services (Walker et al., 2004). Five assumptions were identified:
– Extractivism. The objective is to maximize cash value. Land is seen as a means to obtain financial returns from product sales (and potentially subsidies). No or little attention is paid to the sustainability of land use.
– Heritage strategy. Land is for transmission to heirs. It is a capital that must be preserved. – Shared land use. Land is considered as a common good that can be used simulta-
neously for human services and natural processes. Land management is flexible and diverse but promotes the capacity of ecosystems to absorb shocks resulting from human activities.
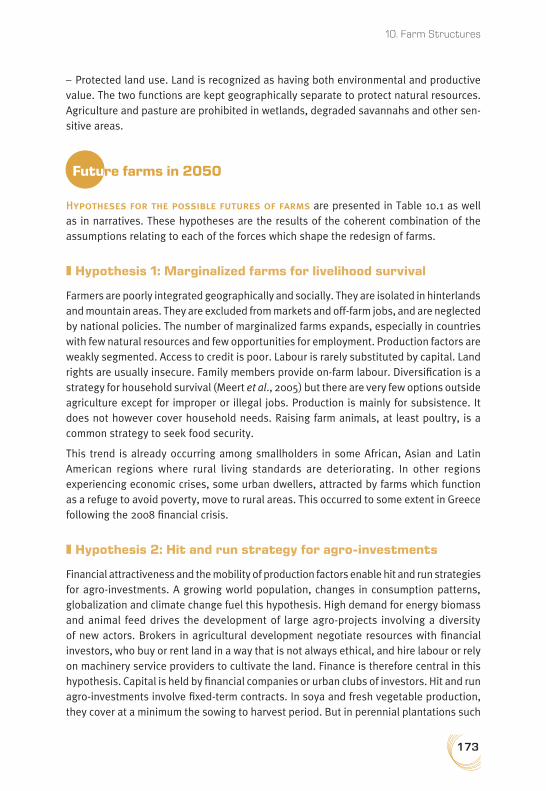
173
10. Farm Structures
– Protected land use. Land is recognized as having both environmental and productive value. The two functions are kept geographically separate to protect natural resources. Agriculture and pasture are prohibited in wetlands, degraded savannahs and other sen-sitive areas.
Future farms in 2050
Hypotheses for the possible futures of farms are presented in Table 10.1 as well as in narratives. These hypotheses are the results of the coherent combination of the assumptions relating to each of the forces which shape the redesign of farms.
❚❚ Hypothesis 1: Marginalized farms for livelihood survival
Farmers are poorly integrated geographically and socially. They are isolated in hinterlands and mountain areas. They are excluded from markets and off-farm jobs, and are neglected by national policies. The number of marginalized farms expands, especially in countries with few natural resources and few opportunities for employment. Production factors are weakly segmented. Access to credit is poor. Labour is rarely substituted by capital. Land rights are usually insecure. Family members provide on-farm labour. Diversification is a strategy for household survival (Meert et al., 2005) but there are very few options outside agriculture except for improper or illegal jobs. Production is mainly for subsistence. It does not however cover household needs. Raising farm animals, at least poultry, is a common strategy to seek food security.
This trend is already occurring among smallholders in some African, Asian and Latin American regions where rural living standards are deteriorating. In other regions experiencing economic crises, some urban dwellers, attracted by farms which function as a refuge to avoid poverty, move to rural areas. This occurred to some extent in Greece following the 2008 financial crisis.
❚❚ Hypothesis 2: Hit and run strategy for agro-investments
Financial attractiveness and the mobility of production factors enable hit and run strategies for agro-investments. A growing world population, changes in consumption patterns, globalization and climate change fuel this hypothesis. High demand for energy biomass and animal feed drives the development of large agro-projects involving a diversity of new actors. Brokers in agricultural development negotiate resources with financial investors, who buy or rent land in a way that is not always ethical, and hire labour or rely on machinery service providers to cultivate the land. Finance is therefore central in this hypothesis. Capital is held by financial companies or urban clubs of investors. Hit and run agro-investments involve fixed-term contracts. In soya and fresh vegetable production, they cover at a minimum the sowing to harvest period. But in perennial plantations such
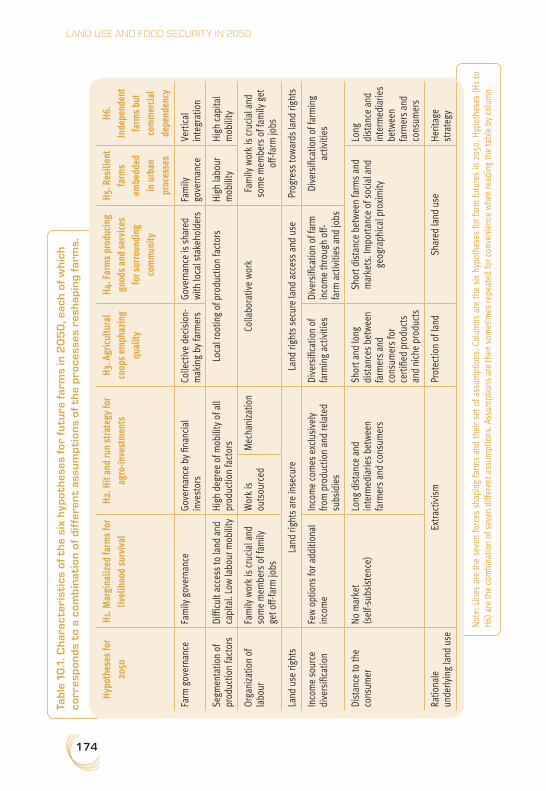
174
LAND USE AND FOOD SECURITY IN 2050
Note
: Lin
es a
re th
e se
ven
forc
es s
hapi
ng fa
rms
and
thei
r set
of a
ssum
ptio
ns. C
olum
ns a
re th
e si
x hy
poth
eses
for f
arm
futu
res
in 2
050.
Hyp
othe
ses
(H1
to
H6) a
re th
e co
mbi
natio
n of
sev
en d
iffer
ent a
ssum
ptio
ns. A
ssum
ptio
ns a
re th
en s
omet
imes
repe
ated
for c
onve
nien
ce w
hen
read
ing
the
tabl
e by
col
umn.
Tab
le 1
0.1
. Ch
arac
teri
stic
s of
th
e si
x h
ypo
thes
es f
or f
utu
re f
arm
s in
20
50
, eac
h of
wh
ich
corr
esp
onds
to
a co
mb
inat
ion
of d
iffe
ren
t as
sum
pti
ons
of t
he
pro
cess
es r
esh
apin
g fa
rms.
Hypo
thes
es fo
r 20
50H1
. Mar
gina
lized
farm
s fo
r liv
elih
ood
surv
ival
H2. H
it an
d ru
n st
rate
gy fo
r ag
ro-in
vest
men
tsH3
. Agr
icul
tura
l co
ops
emph
azin
g qu
ality
H4. F
arm
s pr
oduc
ing
good
s an
d se
rvic
es
for s
urro
undi
ng
com
mun
ity
H5. R
esili
ent
farm
s em
bedd
ed
in u
rban
pr
oces
ses
H6.
Inde
pend
ent
farm
s bu
t co
mm
erci
al
depe
nden
cy
Farm
gov
erna
nce
Fam
ily g
over
nanc
eGo
vern
ance
by
finan
cial
in
vest
ors
Colle
ctiv
e de
cisi
on-
mak
ing
by fa
rmer
sGo
vern
ance
is s
hare
d w
ith lo
cal s
take
hold
ers
Fam
ily
gove
rnan
ce
Verti
cal
inte
grat
ion
Segm
enta
tion
of
prod
uctio
n fa
ctor
sDi
fficu
lt ac
cess
to la
nd a
nd
capi
tal.
Low
labo
ur m
obili
tyHi
gh d
egre
e of
mob
ility
of a
ll pr
oduc
tion
fact
ors
Loca
l roo
ting
of p
rodu
ctio
n fa
ctor
sHi
gh la
bour
m
obili
tyHi
gh c
apita
l m
obili
ty
Org
aniz
atio
n of
la
bour
Fam
ily w
ork
is c
ruci
al a
nd
som
e m
embe
rs o
f fam
ily
get o
ff-fa
rm jo
bs
Wor
k is
ou
tsou
rced
Mec
hani
zatio
nCo
llabo
rativ
e w
ork
Fam
ily w
ork
is c
ruci
al a
nd
som
e m
embe
rs o
f fam
ily g
et
off-f
arm
jobs
Land
use
righ
tsLa
nd ri
ghts
are
inse
cure
Land
righ
ts s
ecur
e la
nd a
cces
s an
d us
ePr
ogre
ss to
war
ds la
nd ri
ghts
Inco
me
sour
ce
dive
rsifi
catio
nFe
w o
ptio
ns fo
r add
ition
al
inco
me
Inco
me
com
es e
xclu
sive
ly
from
pro
duct
ion
and
rela
ted
subs
idie
s
Dive
rsifi
catio
n of
fa
rmin
g ac
tiviti
esDi
vers
ifica
tion
of fa
rm
inco
me
thro
ugh
off-
farm
act
iviti
es a
nd jo
bs
Dive
rsifi
catio
n of
farm
ing
activ
ities
Dist
ance
to th
e co
nsum
erNo
mar
ket
(sel
f-sub
sist
ence
)Lo
ng d
ista
nce
and
inte
rmed
iarie
s be
twee
n fa
rmer
s an
d co
nsum
ers
Shor
t and
long
di
stan
ces
betw
een
farm
ers
and
cons
umer
s fo
r ce
rtifie
d pr
oduc
ts
and
nich
e pr
oduc
ts
Shor
t dis
tanc
e be
twee
n fa
rms
and
mar
kets
. Im
porta
nce
of s
ocia
l and
ge
ogra
phic
al p
roxi
mity
Long
di
stan
ce a
nd
inte
rmed
iarie
s be
twee
n fa
rmer
s an
d co
nsum
ers
Ratio
nale
un
derly
ing
land
use
Extra
ctiv
ism
Prot
ectio
n of
land
Shar
ed la
nd u
seHe
ritag
e st
rate
gy
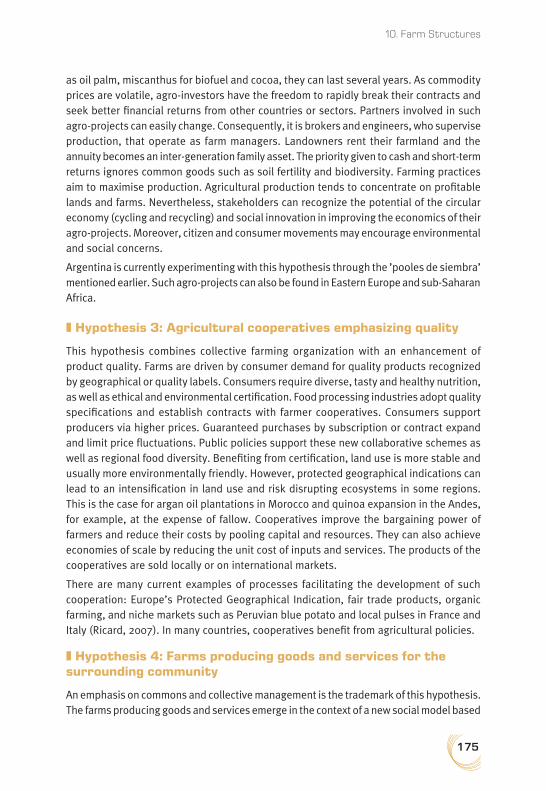
175
10. Farm Structures
as oil palm, miscanthus for biofuel and cocoa, they can last several years. As commodity prices are volatile, agro-investors have the freedom to rapidly break their contracts and seek better financial returns from other countries or sectors. Partners involved in such agro-projects can easily change. Consequently, it is brokers and engineers, who supervise production, that operate as farm managers. Landowners rent their farmland and the annuity becomes an inter-generation family asset. The priority given to cash and short-term returns ignores common goods such as soil fertility and biodiversity. Farming practices aim to maximise production. Agricultural production tends to concentrate on profitable lands and farms. Nevertheless, stakeholders can recognize the potential of the circular economy (cycling and recycling) and social innovation in improving the economics of their agro-projects. Moreover, citizen and consumer movements may encourage environmental and social concerns.
Argentina is currently experimenting with this hypothesis through the ’pooles de siembra’ mentioned earlier. Such agro-projects can also be found in Eastern Europe and sub-Saharan Africa.
❚❚ Hypothesis 3: Agricultural cooperatives emphasizing quality
This hypothesis combines collective farming organization with an enhancement of product quality. Farms are driven by consumer demand for quality products recognized by geographical or quality labels. Consumers require diverse, tasty and healthy nutrition, as well as ethical and environmental certification. Food processing industries adopt quality specifications and establish contracts with farmer cooperatives. Consumers support producers via higher prices. Guaranteed purchases by subscription or contract expand and limit price fluctuations. Public policies support these new collaborative schemes as well as regional food diversity. Benefiting from certification, land use is more stable and usually more environmentally friendly. However, protected geographical indications can lead to an intensification in land use and risk disrupting ecosystems in some regions. This is the case for argan oil plantations in Morocco and quinoa expansion in the Andes, for example, at the expense of fallow. Cooperatives improve the bargaining power of farmers and reduce their costs by pooling capital and resources. They can also achieve economies of scale by reducing the unit cost of inputs and services. The products of the cooperatives are sold locally or on international markets.
There are many current examples of processes facilitating the development of such cooperation: Europe’s Protected Geographical Indication, fair trade products, organic farming, and niche markets such as Peruvian blue potato and local pulses in France and Italy (Ricard, 2007). In many countries, cooperatives benefit from agricultural policies.
❚❚ Hypothesis 4: Farms producing goods and services for the surrounding community
An emphasis on commons and collective management is the trademark of this hypothesis. The farms producing goods and services emerge in the context of a new social model based

176
LAND USE AND FOOD SECURITY IN 2050
on environmental stewardship. This hypothesis implies new types of agricultural policies. The rationale underlying land use is leading this change. Environmental managers and others local actors agree on and share the use of land and natural resources. Agroforestry and agroecological practices are favoured in this logic. Policies can also fix critical charges that ecosystems may ’accept’ in terms of pollution and disturbance, such as limits in animal densities and the quantities of chemical fertilizers and pesticides applied etc. In this hypothesis, local agriculture is diversified in order to respond to a wide range of baskets of goods and services comprising a large variety of food products and renewable biomaterials, ecosystemic and cultural services. Property rights may continue to operate but use rights override the logic of appropriation. The business model moves from an economy of ownership and consumption to one of functionality and service management. The recycling of resources and re-use are therefore widely promoted. The idea is that of a circular economy where resource inputs and waste, emissions and energy losses are minimized by slowing, closing and narrowing material and energy loops. Governance is shared and requires strong political or community regulations on planning and cooperation through contracts or informal arrangements. The main challenge concerns the management of demand for agricultural services.
Various current initiatives illustrate the diverse trajectories this hypothesis can take. We can, for example, mention the development of renewable and sustainable biomaterials, the Redd++ initiative for forest carbon sequestration, arrangements between livestock farmers, crop growers and foresters to recycle nutrients and maintain open landscapes and even community agreements between local authorities and landless herders whose cattle graze urban green spaces.
❚❚ Hypothesis 5: Resilient farms embedded in urban processes
Holding multiple jobs and diversifying sources of income at the household or farm level drive this hypothesis. Farms become more resilient by embedding themselves within urban networks. Farm labour is constantly fine-tuned depending on the rise and fall of urban job opportunities. If off-farm jobs are available, household employment is split between on-farm and urban jobs. The strong links with cities make it possible to diversify and add value to farm activities. In the absence of off-farm jobs, farming guarantees a minimum income and access to staple foods. Which members – young or adult, women or men – of the household leave varies according to the needs of the labour market. Elderly parents may stay on the farm and produce staple foods for relatives living in urban areas and for the neighbourhood. This high level of adaptability in family labour creates resilience. Such flexibility also implies an acceptance of low farm incomes. When there is a surplus of income, households have more capacity to invest in processing or other cottage manufacturing. Households can also support the emigration of younger family members. With such mobility, on-farm skills are not stabilized. On the positive side, migration generates benefits through the transfer of knowledge, skills and technology (de Brauw and Harigaya, 2007). Land use is rather stable and farm size tends to decrease.
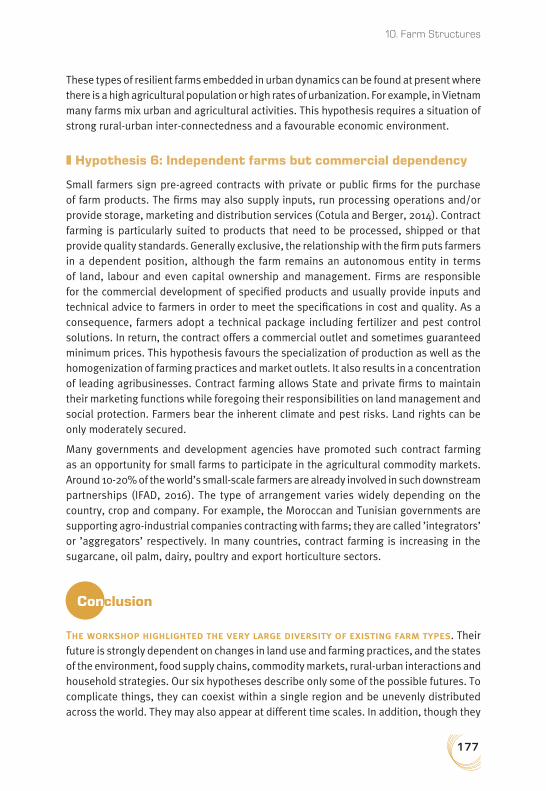
177
10. Farm Structures
These types of resilient farms embedded in urban dynamics can be found at present where there is a high agricultural population or high rates of urbanization. For example, in Vietnam many farms mix urban and agricultural activities. This hypothesis requires a situation of strong rural-urban inter-connectedness and a favourable economic environment.
❚❚ Hypothesis 6: Independent farms but commercial dependency
Small farmers sign pre-agreed contracts with private or public firms for the purchase of farm products. The firms may also supply inputs, run processing operations and/or provide storage, marketing and distribution services (Cotula and Berger, 2014). Contract farming is particularly suited to products that need to be processed, shipped or that provide quality standards. Generally exclusive, the relationship with the firm puts farmers in a dependent position, although the farm remains an autonomous entity in terms of land, labour and even capital ownership and management. Firms are responsible for the commercial development of specified products and usually provide inputs and technical advice to farmers in order to meet the specifications in cost and quality. As a consequence, farmers adopt a technical package including fertilizer and pest control solutions. In return, the contract offers a commercial outlet and sometimes guaranteed minimum prices. This hypothesis favours the specialization of production as well as the homogenization of farming practices and market outlets. It also results in a concentration of leading agribusinesses. Contract farming allows State and private firms to maintain their marketing functions while foregoing their responsibilities on land management and social protection. Farmers bear the inherent climate and pest risks. Land rights can be only moderately secured.
Many governments and development agencies have promoted such contract farming as an opportunity for small farms to participate in the agricultural commodity markets. Around 10-20% of the world’s small-scale farmers are already involved in such downstream partnerships (IFAD, 2016). The type of arrangement varies widely depending on the country, crop and company. For example, the Moroccan and Tunisian governments are supporting agro-industrial companies contracting with farms; they are called ’integrators’ or ’aggregators’ respectively. In many countries, contract farming is increasing in the sugarcane, oil palm, dairy, poultry and export horticulture sectors.
Conclusion
The workshop highlighted the very large diversity of existing farm types. Their future is strongly dependent on changes in land use and farming practices, and the states of the environment, food supply chains, commodity markets, rural-urban interactions and household strategies. Our six hypotheses describe only some of the possible futures. To complicate things, they can coexist within a single region and be unevenly distributed across the world. They may also appear at different time scales. In addition, though they
178
LAND USE AND FOOD SECURITY IN 2050
constitute a result they can also be considered as a new starting point, from which we can imagine further consequences on land use and food security.
Concerning land use, hypotheses 3 and 4 can be considered to yield the most stable situations. In H4, negotiations among a wide diversity of stakeholders ensure lasting agreements on the way land should be used. In H3, the strong focus on quality associated with terroirs confers a high cultural and economic value to natural resources and landscapes that is likely to be sustainable. In spite of their different nature, H1 and H2 appear unstable because they could lead to over-exploitation of natural resources, soils in particular. The source of instability stems from poverty in the case of H1, and from strategies based on short-term profit gains in H2. Land use changes in H5 depend on urban dynamics. Land in H6 is likely to be stable in terms of tenure and maintenance of fertility because family farmers and smallholders under contracts strive to secure income and farmland – which has high heritage value – for future generations. On the other hand, land use depends on market demand and could therefore fluctuate in terms of types of production.
Concerning global food security, the consequences stemming from our six hypotheses are only one contributing element and are difficult to assess. Clearly, the living standards of farmers are key to improving food security among rural populations. Regarding food availability for both rural and urban populations, farmers’ access to land, equipment and credit as well as the integration of farms into supply chains are essential. When looking at food security, however, we have to take into account all the interactions with the dimensions addressed in the other chapters. Nevertheless, even without referring to the other dimensions, we can still make a few observations. H1 jeopardizes food availability. H3 holds the potential to generate food diversity and quality. In H2 and H6, food production is dependent on commodity markets and downstream organization. H4 and H5 are rooted in urban or territorial dynamics and are therefore associated with shorter supply chains and local or regional food systems.
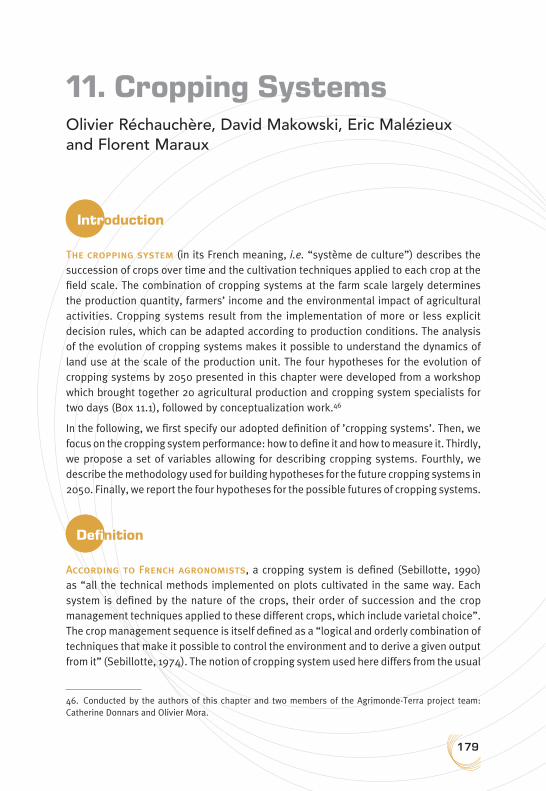
179
11. Cropping SystemsOlivier Réchauchère, David Makowski, Eric Malézieux and Florent Maraux
Introduction
The cropping system (in its French meaning, i.e. “système de culture”) describes the succession of crops over time and the cultivation techniques applied to each crop at the field scale. The combination of cropping systems at the farm scale largely determines the production quantity, farmers’ income and the environmental impact of agricultural activities. Cropping systems result from the implementation of more or less explicit decision rules, which can be adapted according to production conditions. The analysis of the evolution of cropping systems makes it possible to understand the dynamics of land use at the scale of the production unit. The four hypotheses for the evolution of cropping systems by 2050 presented in this chapter were developed from a workshop which brought together 20 agricultural production and cropping system specialists for two days (Box 11.1), followed by conceptualization work.46
In the following, we first specify our adopted definition of ’cropping systems’. Then, we focus on the cropping system performance: how to define it and how to measure it. Thirdly, we propose a set of variables allowing for describing cropping systems. Fourthly, we describe the methodology used for building hypotheses for the future cropping systems in 2050. Finally, we report the four hypotheses for the possible futures of cropping systems.
Definition
According to French agronomists, a cropping system is defined (Sebillotte, 1990) as “all the technical methods implemented on plots cultivated in the same way. Each system is defined by the nature of the crops, their order of succession and the crop management techniques applied to these different crops, which include varietal choice”. The crop management sequence is itself defined as a “logical and orderly combination of techniques that make it possible to control the environment and to derive a given output from it” (Sebillotte, 1974). The notion of cropping system used here differs from the usual
46. Conducted by the authors of this chapter and two members of the Agrimonde-Terra project team: Catherine Donnars and Olivier Mora.
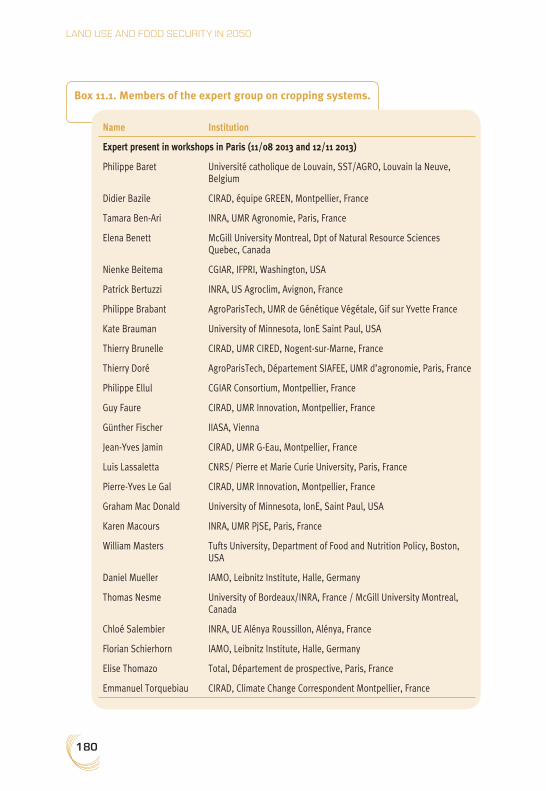
180
LAND USE AND FOOD SECURITY IN 2050
Box 11.1. Members of the expert group on cropping systems.
Name Institution
Expert present in workshops in Paris (11/08 2013 and 12/11 2013)
Philippe Baret Université catholique de Louvain, SST/AGRO, Louvain la Neuve, Belgium
Didier Bazile CIRAD, équipe GREEN, Montpellier, France
Tamara Ben-Ari INRA, UMR Agronomie, Paris, France
Elena Benett McGill University Montreal, Dpt of Natural Resource Sciences Quebec, Canada
Nienke Beitema CGIAR, IFPRI, Washington, USA
Patrick Bertuzzi INRA, US Agroclim, Avignon, France
Philippe Brabant AgroParisTech, UMR de Génétique Végétale, Gif sur Yvette France
Kate Brauman University of Minnesota, IonE Saint Paul, USA
Thierry Brunelle CIRAD, UMR CIRED, Nogent-sur-Marne, France
Thierry Doré AgroParisTech, Département SIAFEE, UMR d’agronomie, Paris, France
Philippe Ellul CGIAR Consortium, Montpellier, France
Guy Faure CIRAD, UMR Innovation, Montpellier, France
Günther Fischer IIASA, Vienna
Jean-Yves Jamin CIRAD, UMR G-Eau, Montpellier, France
Luis Lassaletta CNRS/ Pierre et Marie Curie University, Paris, France
Pierre-Yves Le Gal CIRAD, UMR Innovation, Montpellier, France
Graham Mac Donald University of Minnesota, IonE, Saint Paul, USA
Karen Macours INRA, UMR PjSE, Paris, France
William Masters Tufts University, Department of Food and Nutrition Policy, Boston, USA
Daniel Mueller IAMO, Leibnitz Institute, Halle, Germany
Thomas Nesme University of Bordeaux/INRA, France / McGill University Montreal, Canada
Chloé Salembier INRA, UE Alénya Roussillon, Alénya, France
Florian Schierhorn IAMO, Leibnitz Institute, Halle, Germany
Elise Thomazo Total, Département de prospective, Paris, France
Emmanuel Torquebiau CIRAD, Climate Change Correspondent Montpellier, France
181
11. Cropping Systems
Anglo-Saxon ’cropping system’, which is considered to be all activities related to crops at the scale of the farm (Zandstra et al., 1981), while the concept of cropping system used here applies to the scale of a cultivated area. It also differs from the concept of ’cropping pattern’ which is very close to that of crop management sequence.
Cropping system performance
A cropping system is the result of the implementation on a given surface area of the technical, human and financial means available to the farmer to achieve a goal.
❚❚ Socio-economic performance
The socio-economic performance of the system can therefore be measured by comparing the output obtained to the level of use of the various production factors (land, capital and labour) (Alston et al., 2010). Partial indexes, factor by factor, can be calculated: the yield is thereby the index of partial productivity of the land factor. Each of these indexes does not take into account changes in other production factors, the role of which may be decisive. In theory, total factor productivity (TFP) provides a measure of the overall efficiency of the production process. But it is not always easy to calculate (Petit, 2011), in particular because of the lack of data on the cost of inputs, especially when they are not traded, as may be the case for land or labour (Fuglie, 2008).
Nevertheless, analysis of the productivity of individual factors is useful for analysing farmers’ rationales. These will tend to maximise the productivity of the production factor which is most lacking. So, producers with a very small acreage and little technical or financial capital will tend to maximise production per unit area at the cost of a high investment in labour, under the hypothesis that they do not have a better option to draw value from their workforce. This is especially true in situations where farmers produce for their own subsistence. Those with few workers (in situations where little labour is available) but with larger land and capital resources will tend to maximise net output per unit of work (van der Eng, 2004), without necessarily trying to maximise the yield per hectare, but rather the margin per hectare. Finally, investors from outside the agricultural sector (e.g., the Argentinean ’pool de siembra’ model, Chapter 10) will tend to mobilise the combination of land, technical capital and labour to maximise the return on their financial capital in comparison to what they could achieve in other sectors (Cochet, 2011).
❚❚ Agro-environmental performance
A cropping system’s agro-environmental performance depends on the cropping techniques used, particularly the use of natural resources (such as water) and synthetic inputs, which can lead to impacts on the ecosystem. These impacts can be negative: pollution and soil degradation, the extraction and pollution of water resources, damage to wild biodiversity, air pollution and greenhouse gas emissions, to which we can add the consumption of

182
LAND USE AND FOOD SECURITY IN 2050
fossil fuel resources. Conversely, agricultural practices can strengthen ecological processes for the benefit of the farmer or society in general. Here we are talking about ecosystem services (MEA, 2005a; Deytieux et al., 2012; Tibi and Théron, 2017): soil enrichment through organic matter has a beneficial effect on the chemical fertility of soils, on their resistance to erosion and mitigates climate change (by increasing soil carbon stocks), degradation of pesticide pollutants through soil microbiological activity, recycling of excess nitrates through nitrate catch crops, maintenance or enrichment of wild biodiversity etc. Over longer time periods, an important component of crop system performance is resilience to hazards, especially those related to climate change (IPCC, 2006; Morton, 2007).
❚❚ Measuring cropping system performance
From an agronomic point of view, the margin for increasing production in a cropping system can be measured by the difference between its current level (usually measured in yield per hectare) and the potential production according to local agro-climatic conditions (Doré et al., 2008; Lobell et al., 2009). When this output gap (’yield gap’ in the scientific literature, Mueller et al., 2012) is large, even a modest improvement in crop management sequence makes it possible for part of the gap to be filled: theoretically, in fact, merely improving the availability or efficiency of the most limiting factor, nitrogen for example, is enough to achieve a significant increase in yields. Conversely, the closer the current production level is to the potential level, the more difficult it is to improve by adding production factors (Licker et al., 2010; Grassini and Cassman, 2012). This law, known as decreasing marginal returns, explains why the efficiency of nitrogen fertilizer use tends to be low when it is used in large quantities in intensive systems, which results in significant leaching into the environment. Often, the most intensive systems, which rely on high levels of synthetic inputs (fertilizers and pesticides), are also the least efficient regarding environmental performance (FAO, 2009a). From an agronomic point of view, the challenge is therefore to develop cropping systems that have both good economic performance and little impact on the environment, for example through substituting synthetic inputs with biological regulation (Jackson et al., 2005; Doré et al., 2011).
The overall performance of cropping systems can be evaluated using multi-criteria analyses, long-term experimentation, modelling or by monitoring farmers’ practices, either directly or through indicators.
A set of variables for describing cropping systems
To conduct a retrospective analysis or to draw up hypotheses for future changes in cropping systems, it is necessary to adopt a method for characterising systems. This method should take into account both the constitutive elements of cropping systems and their socio-economic and agro-environmental performance, in order to be able to evaluate the different dimensions of their sustainability.
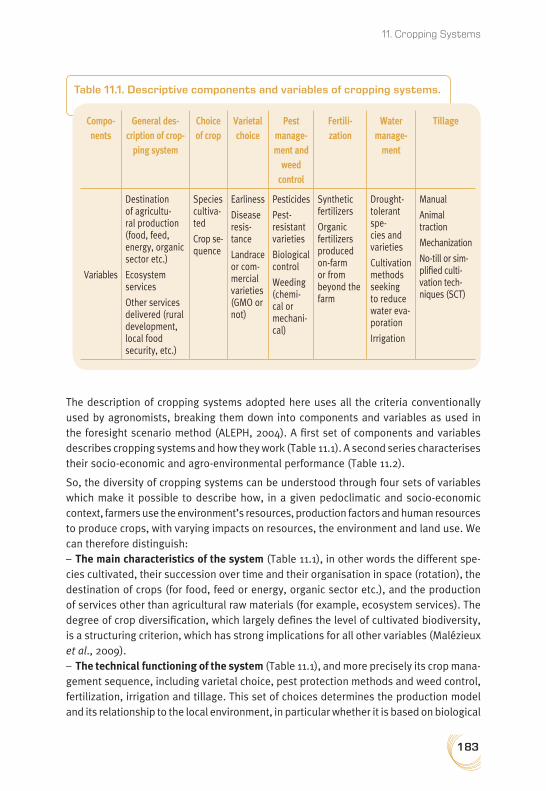
183
11. Cropping Systems
The description of cropping systems adopted here uses all the criteria conventionally used by agronomists, breaking them down into components and variables as used in the foresight scenario method (ALEPH, 2004). A first set of components and variables describes cropping systems and how they work (Table 11.1). A second series characterises their socio-economic and agro-environmental performance (Table 11.2).
So, the diversity of cropping systems can be understood through four sets of variables which make it possible to describe how, in a given pedoclimatic and socio-economic context, farmers use the environment’s resources, production factors and human resources to produce crops, with varying impacts on resources, the environment and land use. We can therefore distinguish:
– The main characteristics of the system (Table 11.1), in other words the different spe-cies cultivated, their succession over time and their organisation in space (rotation), the destination of crops (for food, feed or energy, organic sector etc.), and the production of services other than agricultural raw materials (for example, ecosystem services). The degree of crop diversification, which largely defines the level of cultivated biodiversity, is a structuring criterion, which has strong implications for all other variables (Malézieux et al., 2009).
– The technical functioning of the system (Table 11.1), and more precisely its crop mana-gement sequence, including varietal choice, pest protection methods and weed control, fertilization, irrigation and tillage. This set of choices determines the production model and its relationship to the local environment, in particular whether it is based on biological
Table 11.1. Descriptive components and variables of cropping systems.
Compo- nents
General des-cription of crop-
ping system
Choice of crop
Varietal choice
Pest manage- ment and
weed control
Fertili- zation
Water manage-
ment
Tillage
Variables
Destination of agricultu-ral production (food, feed, energy, organic sector etc.)
Ecosystem services
Other services delivered (rural development, local food security, etc.)
Species cultiva-ted
Crop se - quence
Earliness
Disease resis-tance
Landrace or com-mercial varieties (GMO or not)
Pesticides
Pest-resistant varieties
Biological control
Weeding (chemi-cal or mechani-cal)
Synthetic fertilizers
Organic fertilizers produced on-farm or from beyond the farm
Drought-tolerant spe-cies and varieties
Cultivation methods seeking to reduce water eva-poration
Irrigation
Manual
Animal traction
Mechani zation
No-till or sim-plified culti-vation tech-niques (SCT)

184
LAND USE AND FOOD SECURITY IN 2050
and geochemical regulations (nitrogen fixation, recycling of mineral elements and biologi-cal control) or the use of exogenous inputs for the cultivated ecosystem (synthetic fertili-zers and pesticides). It is at this scale that very important characteristics are defined, such as the level of intensification47 and the option taken in terms of cultivation (till or no-till).
– The choice of energy sources used (Table 11.2), and in particular the relative propor-tion between human, animal and fossil energy. The combination of these three sources of energy is expressed in the form of two indicators. First, the degree of production’s dependence on a non-renewable resource (fossil energy) whose accessibility and price are key factors regarding the economic sustainability of production. Second, the level of agricultural employment, which is an essential criterion both in situations where labour is scarce and in those where it is abundant and agriculture is one of the key employment sectors for local people (Losch et al., 2011). One could even imagine in a multi-criteria analysis that the ability of a cropping system to allow sustainable substitution of non-renewable energy with human labour is a performance to be sought.
– Agronomic and environmental performance of the cropping system (Table 11.2). Yields are essential for estimating the availability of agricultural raw materials, but they are not very good for describing the level and type of intensification in production. Indeed, the volume obtained per hectare is not sufficient to characterise the production process: in a complementary fashion, the efficiency of the inputs, that is to say the level of produc-tion compared to the quantity used of each input, makes it possible to estimate whether
47. In this chapter, intensification is understood in the most general way as the implementation of practices leading to increased production in the cropping system, which may cover various strategies: increased yields through the greater use of chemical or organic inputs, or by improving their efficiency; irrigation; increased efficiency of interception of light energy through crop combinations, catch crops and agroforestry; use of varieties better adapted to the environment; disease and pest control using chemical or biological products etc.
Table 11.2. Socio-economic and agro-environmental performance indicators for cropping systems.
Compo- nents
Energy sources used: human labour versus other sources
Production level (quantity and quality)
Environmental impacts
Variables
Measuring use of workforce
Degree of mechanization of production: Cultivation techniques Irrigation Harvesting techniques Use of fossil or animal energy
Yield
Yield gap
Production quality
Water quality (N, P, pesticides)
Pressure on water resources
Emissions of green-house gases (GHG)
Biodiversity
Soil erosion
Air pollution
185
11. Cropping Systems
these inputs are used efficiently or, conversely, to detect overconsumption and waste. The yield gap, in other words the difference between the production potential determi-ned by pedoclimatic conditions and actual production, allows us to measure the system’s potential for improvement. Environmental impacts affect the sustainability of systems both because these impacts can directly compromise production (including degradation of agricultural soils) but also because society can challenge systems that have an impact beyond the perimeter of the agricultural system itself (including excessive extraction or pollution of water, air pollution and greenhouse gas emissions).
Methodology for building the hypotheses for the cropping systems in 2050
The usual approach is to conduct a retrospective analysis of changes in different components of the system over past decades and then construct hypotheses for future evolutions for the system as a whole. However, in the case of cropping systems, it is very difficult, even impossible, to analyze past changes component-by-component and, based on these past trends, to imagine the future evolution of a cropping system. Hence, we thought more judicious to work from specific and localised cropping systems, for which we have analyzed the dynamics of past changes by trying to identify the determinants of their trajectory.
❚❚ Selecting specific and localised current cropping systems
On the basis of several criteria, 12 cropping systems were selected (Table 11.3): – Agro-pedoclimatic conditions: situations in the temperate zone versus situations in
the tropics. – A diversity of production structures and logics: small, medium and large family farms,
and profit-driven farms (agribusinesses). – A focus on a group of rice-based farms, because of the importance of this crop for
food systems.
Following a small group brainstorming exercise, several evolution scenarios were drawn up for each case. These were based on retrospective information on the changes over the past 50 years. Some 44 scenarios were developed and then cross-analyzed to group them according to three typologies:
– A typology of agronomic evolution, close to the description of cropping systems, based essentially on the phenomena of specialization versus diversification, on issues of effi-ciency and level of input use.
– A typology based on modes of intensification, each type mobilizing different resources and logics. This typology was chosen for guiding the construction of hypotheses for the future evo-lution of cropping systems. Indeed, it is most relevant for discussing the question of land use.
– A typology of socio-technical transition modes, describing the degree of difficulty repre-sented by the implementation of the proposed changes.

186
LAND USE AND FOOD SECURITY IN 2050
❚❚ Lessons from retrospective analysis
For the sake of simplification, two types of evolution were considered:
– Trajectories of great stability in the past, linked to highly resilient systems mainly focused on self-consumption or systems in stagnation due to an inability to invest and integrate into markets.
– Trajectories of an intensification of production to varying degrees, which result in an increase in yields. This trajectory is dominant among the cases studied.
From an agronomic point of view, production per hectare (species cultivated and yield per species) remains interesting for describing the evolution of cropping systems, especially when it increases: it is then possible to analyze which technical and human means have made this increase possible. The analysis of the cropping systems offered by the experts in the working group therefore made it possible to verify that, almost everywhere that it was possible and in very diverse socio-economic contexts, the retrospective increase in yields results mainly from a process of substitution of physicochemical and biological factors from the ecosystem with synthetic inputs (Miflin, 2000) and classical genetic progress (Takeda and Matsuoka, 2008). This evolution in production techniques has been accompanied by a simplification of cropping systems, itself linked to an increased separation of livestock and cereal production (Meynard et al., 2013). This move to simplified rotations and regional specialization was made possible by the use of synthetic inputs,
Table 11.3. Principal characteristics of 12 cropping systems used for the construction of evolutionary hypotheses.
Rice-based food systems constrained by water and other factors availability
Food systems constrained by integration into
market
Agroforestry systems in humid tropical
zones
Arable systems in temperate zones
Rice-based system, small farm (F), Vietnam, limited water
Sorghum-based system, small farm, Sahel, access to inputs and to market
Cacao agroforestry, small farm, Cameroon, opening of market, capital/labour
Maize monoculture, medium farm, France (Landes), impact on water and biodiversity
Rice-based system, small farm, Thailand, water and workforce (WF) limited
Cotton-food system, small farm, Burkina Faso, access to inputs, WF problem
Oil palm, small farm, Africa, land sparing/sharing, link with agro-industry
Wheat-based system, large farm, Russia, context of climate change
Rice-based system, small farm/agri-business, Vietnam, limited water
Quinoa system, small farm, Bolivia, intensification, environmental impact
Maize-soya system, large farm, USA (Iowa), environmental impact
Profit-driven soya system, Argentina, environmental impasses

187
11. Cropping Systems
which came to replace the recycling of livestock effluent as a source of fertilizer for crops. The retrospective analysis has also sought to take into account the environmental consequences of this movement of simplification and increased artificiality of cropping systems, characterised by soil degradation, a decrease in wild and cultivated genetic diversity, consumption of fossil resources and pollution of different compartments of the ecosystem (water, air and soils). Under the banner of the ’green revolution’, this intensification of agriculture took place in various parts of the world from the 1950s and 1960s. It relied on the dissemination of high-yielding varieties from agronomic research centres and the use of synthetic fertilizers and possibly pesticides, and irrigation in certain regions. Motorization has practically concerned only European and North American agriculture. This technological package has been driven by agricultural policies based on input subsidies and output price support in the context of the cold war (Griffon, 2006).
Future cropping systems in 2050
We have chosen to classify the potential evolutions of the 12 cropping systems according to four evolution hypotheses defined on the basis of the sets of variables described above, and whose combination produces different modes of production intensification: conventional intensification, sustainable intensification and agroecology, to which we have added a production impasse or collapse hypothesis.
However, we are aware that this classification is only one of many. Recently, based on types of production systems, characterized by the nature of their inputs and the types of socio-economic context in which they are based, Thérond et al. (2017) proposed a dynamic framework for analyzing diversity in the forms of agriculture, in which six sets were finally selected. The IntensAfrica project suggested a typology of ’pathways’ from which we were partly inspired.48
In fact, the nature (and relevance) of these classifications is important in these times of debate between proponents of one model versus another, even if we know that we should rather move towards a co-existence between several systems.
Since this is a foresight study, the specificity of our four evolution hypotheses is to focus on the temporal dynamics of the systems. This means the type of intensification is not enough to characterise the dynamics of the evolution in cropping systems. The greater or lesser difficulty in implementing changes in systems aiming for greater sustainability is an essential complementary criterion. The description of these dynamics according to the ESR (Efficiency, Substitution, Redesign) socio-technical transition typology (Hill and Mac Rae, 1995) is suggested here. In organisational terms, this entails a growing degree of difficulty in transition: simple improvement of the efficiency of the system which remains in its current state (Efficiency), substitution of one element of the system (species cultivated or technical) with another
48. http://www.intensafrica.org/fr/diverses-voies-conduisent-a-une-intensification-durable-de-lagriculture/

188
LAND USE AND FOOD SECURITY IN 2050
(Substitution), or complete redesign of the system (Redesign). These socio-technical transition regimes are one of the criteria that led to the construction of the four evolution hypotheses.
❚❚ Hypothesis 1: Productive impasse in crop production
The productive impasse hypothesis (Collapse) corresponds to a series of potential dead-ends in agronomic (climatic disruption or biotechnical impasses) and socio-economic terms (land insecurity, access to inputs, markets or credit, production profitability conditions, lack of labour etc.). These impasses may be the consequence of the weaknesses identified in ’Conventional intensification’ (see hypothesis 2) or a sudden change in the environmental or economic context.
❚❚ Hypothesis 2: Conventional intensification of agriculture
This hypothesis (Conventional Intensification of Agriculture, CIA) is based on specialization in production (Rastoin and Ghersi, 2010). This can produce high yields, but is highly sensitive to climate variability (except where irrigation is used) and biological hazards, generally related to the system’s ecological uniformity. The system has a high degree of dependence on agro-industrial inputs and fossil energy, generating negative impacts on the environment. As a result, the socio-economic and agro-environmental sustainability of the cropping system is fragile. This is the reference scenario of the ’green revolution’ of the post-war period, already identified in the retrospective approach, and constitutes an extension of this trend (Sinclair and Rufty, 2012). Depending on the degree of mechanization, the labour requirement in these systems is highly variable. This trajectory can bifurcate towards greater sustainability by improving input efficiency (without questioning its fundamental organisation) or by diversifying production (which means a complete reorganisation) or, if there is no adaptation, a productive impasse.
❚❚ Hypothesis 3: Sustainable intensification of agriculture
The Sustainable Intensification of Agriculture (SIA) hypothesis is an option which seeks to combine an intensification of production with a reduction of the cropping system’s environmental impact through maximizing the efficiency of the inputs used (Griffon, 2006, 2010). In addition to the very frequent use of mechanized direct seeding, with the possible planting of mixed species or undersowing crops, this hypothesis is based on the use of technologies designed by or in association with agribusiness: genetic technologies (including GMOs), biocontrol technologies (for the control of pests and diseases), precision agriculture and information technologies. Its yields are high. Its agro-environmental resilience is improved compared to conventional intensification, but it does not reach the levels of agroecology (see below). From a socio-economic point of view, the sustainable intensification hypothesis is based on the widespread use of technological inputs and therefore does not have the same degree of autonomy with regards to agricultural suppliers as the agroecology hypothesis.

189
11. Cropping Systems
❚❚ Hypothesis 4: Agroecology
The Agroecology hypothesis (AE) is essentially based on the diversification of crops (including agroforestry) (Malézieux et al., 2009) and/or the coupling of crops and livestock, which most often requires a complete redesign of the production system. Principally, under this hypothesis the cropping system uses biological regulations produced by the ecosystem itself, in a sustainable manner (Altieri, 2002; Malézieux, 2012). This hypothesis is characterized by the system’s great autonomy and resilience, from both an agro-environmental and socio-economic point of view (Boyce, 2004; Kumar and Nair, 2004), with a very low dependence on industrial inputs (fertilizers, pesticides and seeds) and fossil fuels. However, it requires large amounts of labour or appropriate mechanization. Yield levels will depend on the characteristics of these systems, which are highly diverse. These cropping systems generally fit into production and food systems aimed at ensuring food security throughout the territory, where they are often the only possible way to improve production because of their autonomy from exogenous resources.
The principal characteristics of the four evolution hypotheses of the selected cropping systems are summarized in Table 11.4.
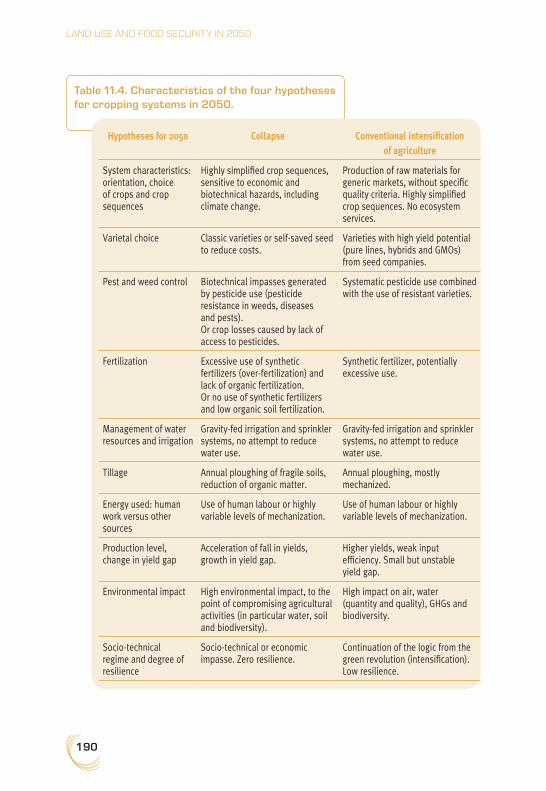
190
LAND USE AND FOOD SECURITY IN 2050
Table 11.4. Characteristics of the four hypotheses for cropping systems in 2050.
Hypotheses for 2050 Collapse Conventional intensification of agriculture
System characteristics: orientation, choice of crops and crop sequences
Highly simplified crop sequences, sensitive to economic and biotechnical hazards, including climate change.
Production of raw materials for generic markets, without specific quality criteria. Highly simplified crop sequences. No ecosystem services.
Varietal choice Classic varieties or self-saved seed to reduce costs.
Varieties with high yield potential (pure lines, hybrids and GMOs) from seed companies.
Pest and weed control Biotechnical impasses generated by pesticide use (pesticide resistance in weeds, diseases and pests). Or crop losses caused by lack of access to pesticides.
Systematic pesticide use combined with the use of resistant varieties.
Fertilization Excessive use of synthetic fertilizers (over-fertilization) and lack of organic fertilization. Or no use of synthetic fertilizers and low organic soil fertilization.
Synthetic fertilizer, potentially excessive use.
Management of water resources and irrigation
Gravity-fed irrigation and sprinkler systems, no attempt to reduce water use.
Gravity-fed irrigation and sprinkler systems, no attempt to reduce water use.
Tillage Annual ploughing of fragile soils, reduction of organic matter.
Annual ploughing, mostly mechanized.
Energy used: human work versus other sources
Use of human labour or highly variable levels of mechanization.
Use of human labour or highly variable levels of mechanization.
Production level, change in yield gap
Acceleration of fall in yields, growth in yield gap.
Higher yields, weak input efficiency. Small but unstable yield gap.
Environmental impact High environmental impact, to the point of compromising agricultural activities (in particular water, soil and biodiversity).
High impact on air, water (quantity and quality), GHGs and biodiversity.
Socio-technical regime and degree of resilience
Socio-technical or economic impasse. Zero resilience.
Continuation of the logic from the green revolution (intensification). Low resilience.

191
11. Cropping Systems
Table 11.4. Continued.
Hypotheses for 2050
Sustainable intensification of agriculture
Agroecology
System characteristics: orientation, choice of crops and crop sequences
Production of raw materials for generic or specialized markets. Quite diverse crop sequences but not systematic. Ecosystem services support production.
Production designed to satisfy local food needs. Great diversity of crops, agroforestry, link with livestock. Production of a wide range of ecosytem services, production of rich and diversified landscapes.
Varietal choice Varieties with high yield potential, disease resistance and maybe tolerance to herbicides (pure lines, hybrids and GMOs).
’Population’ varieties or lines bred locally. Good adaptation to local climatic conditions and disease resistance. No use of GMOs.
Pest and weed control
Non-systematic use of pesticides. Occasional use of biological control. Varieties resistant to pests and diseases and, where appropriate, tolerant to herbicides (no tillage).
Pesticides are used only exceptionally or not at all. Biological control for pests and weeds through the choice of crop succession and maintenance of biodiversity areas (hedges and groves) for beneficials. Mechanical weeding. Resistant variety populations.
Fertilization Judicious use of synthetic fertilizers, precision agriculture. Possible use of legume crops.
Fertilization based essentially on the cultivation of legume crops and organic fertilizer from livestock. Very low or no use of mineral nitrogen.
Management of water resources and irrigation
Varieties tolerant to water stress. Precision irrigation to maximize water efficiency.
Reduction of water needs through the choice of species and varieties. Techniques for preserving rainwater. Parsimonious irrigation possible.
Tillage Growing use of no-till direct sowing techniques.
Frequently tillage is manual or uses animal traction. Ploughing maintained for weed control. Possible use of no-till techniques.
Energy used: human work versus other sources
Highly mechanized: direct sowing and precision agriculture techniques, robotisation.
High intensity of labour and low mechanization (very small farms). Or use of mechanization (large farms).
Production level, change in yield gap
Higher yields, strong input efficiency. Slight reduction of yield gap where it is already small (most common) and sharp reduction in yield gap where it was high (less common).
Yields difficult to assess because of the complexity of rotations. Reduced yield gap, reduced more strongly in situations with low prior yield levels (the majority of cases).
Environmental impact
Low impact on air and GHGs, and variable impact on biodiversity. Preservation of water resources, soil improved (no tillage).
Very little or no impact on water and air quality and GHGs. Preservation or improvement of water resources, soils and biodiversity.
Socio-technical regime and degree of resilience
Transition based mainly on a strategy of efficiency (E) or substitution (S). Average resilience.
Transition based mainly on a strategy of substitution (S) or redesign (R). High resilience.

192
LAND USE AND FOOD SECURITY IN 2050
Discussion and conclusion: Differentiated effects of different evolution hypotheses on land use and production volumes
Expert discussions during the cropping systems workshop showed that there is a great deal of uncertainty about the comparative changes in yields induced by the different hypotheses made. However, the expert group managed to agree on certain expected effects specific to each evolution hypothesis under consideration, in particular taking into account that they are likely to be adopted in a differentiated way, some of them being more suited to certain contexts and types of agricultural structures. These effects are summarized below.
In the short term, the conventional intensification hypothesis can lead to an increase in production through the use of synthetic inputs and irrigation, even in the absence of mechanization: it is an extension of the historical ’green revolution’ model. However, because of its weak agro-environmental and socio-economic sustainability, this hypothesis does not appear to constitute a long-term solution. In its agronomic version, the hypothesis of a production impasse is often the failure of a conventional intensification trajectory which has exceeded a threshold of sustainability. For example, the low levels of additional organic matter in soils lead to a decline in their water storage capacity and therefore greater sensitivity to the effects of climate change. Decreasing soil carbon levels can lead to irreversible degradation and release CO2 into the atmosphere. In addition, the excessive use of nitrogen fertilizer is common in these conventional systems and contributes to increasing greenhouse gas emissions (N2O released during spreading, CO2 from the fertilizer manufacturing process).
The sustainable intensification hypothesis assumes access to the advanced technologies available on the market and is therefore applicable mainly to larger farms with significant investment capacity and a level of conventional intensification which is already high. In this case, its implementation will lead to little change in yields, so little increase in production, but an improvement in product quality and a reduction in environmental impacts thanks to the more targeted use (and therefore lower use) of synthetic products. Its environmental sustainability is therefore greatly improved compared to conventional intensification. More marginally, this hypothesis can concern farms which are initially of lower intensity and have lower economic size but for which strong public support policies are established to provide farms with access to advanced technologies, mechanization and synthetic inputs. In this case, the increase in yields is significant, but the effect on the overall increase in production is low because few areas are affected.
The hypothesis of an evolution towards agroecology assumes the mobilisation of the biological regulations of ecosystems. Although it can affect all types of agricultural structure, it is particularly well suited to small farms, of lesser economic importance (land

193
11. Cropping Systems
and access to productive capital). Indeed, based on the diversification of production and biological regulations from the ecosystem, agroecological farming systems are not very demanding in terms of capital, and have a strong agro-environmental and socio-economic sustainability. In terms of implementation costs, it is essential to quantify the direct savings generated by the introduction of biological regulation to replace synthetic fertilizers and pesticides, and to put them in relation to the mobilisation or remobilisation of agricultural employment. Indeed, for the most part this hypothesis is likely to apply to smaller farming situations, where the means to invest in the conventional or sustainable intensification models are not available and for all types of pedoclimatic conditions, including those where mechanization is difficult or impossible. For all those farms facing a production impasse, or close to it, this hypothesis leads to a sharp increase in production and diversity, even if it only partially closes the potential yield gap. This hypothesis can also be applied to medium or large conventionally intensive farms. There is little change in yields, but an improvement in product quality through the reduction in the use of synthetic inputs. In the context of mechanized agriculture in developed countries, the shift to agroecology is an alternative to sustainable intensification, involving more radical changes in cropping systems because it is based on a greater diversification in production. Such analyses can feed the future advocacy which is essential to the formulation of public policies, in both the Northern and Southern hemispheres. In all cases, the transformation of systems and support for this change requires strong public support policies to produce or share the necessary knowledge, and to train farmers.
194
12. Livestock SystemsStéphane Manceron, Patrice Dumas, Clémence Moreau, Alexandre Ickowicz, Philippe Lecomte and Philippe Lescoat49
Introduction
The livestock sector is important for land use because the areas used for feed and grazing occupy large amounts of land, some of which could be used for the production of food crops. Animal products are also important for food security and overall provide more than one-third of available proteins. Livestock plays other roles too, in particular in developing countries, such as draught power and a form of savings. Livestock production tends to increase over time, following the rise of animal product consumption, partly resulting from increases in population and income. These changes, though, are not necessarily homogeneous or generalized. Over the past 30 years, poultry production and consumption have increased significantly, in particular in Brazil and pork production and consumption have increased in China, but animal product consumption stagnated or decreased in developed countries. The evolution in livestock systems has also been diverse. In developed countries and most of Latin America, for instance, smallholders are often excluded from livestock production, and livestock production’s reliance on feed and inputs from beyond the farm have increased. In India, however, dairy production is mainly based on smallholder integrated livestock-crop systems. The evolution in livestock demand and livestock production will be decisive for land-use change. Future livestock systems could be diverse, with differentiations in terms of the importance of policies, types of intensification and level of competition for land.
This chapter first presents the evolution in livestock production and demand and some elements on the relevance of policies for the livestock sector. We then present the importance of livestock for food security, followed by the description of the role of livestock in land-use change. Hypotheses for the future, based on the link with land use and the types of intensification, are finally described.
The five hypotheses for the evolution of livestock systems by 2050 presented in this chapter were developed from a workshop which brought together around 20 livestock production and livestock system specialists for one day, followed by conceptualization work and two meetings with 4-5 experts, including additional experts not present in the workshop (Box 12.1).
49. The authors thank Chantal Le Mouël and Marie de Lattre-Gasquet for their comments on this chapter.
195
12. Livestock Systems
Evolution of livestock production and demand for animal products
Over the years, at a global level, the production of all animal products in terms of available food energy equivalent has increased significantly (Figure 12.1.a). Production has increased for all animal products but to various extents (Figure 12.1.b). The most spectacular increase is the multiplication by 10 of poultry meat production over the course of 50 years. Milk and total meat have increased faster in absolute terms than other animal products. Milk available energy production was higher than meat available energy production in the early sixties, but the production of meat available calories is now greater.
Since 1961, at the global level, the share of total meat plus milk (in total animal product production) was relatively stable, remaining around 70%. The share of eggs almost doubled in this period (Figure 12.2). A major trend is the increase of the share of total meat production (in calories) to the detriment of milk. The decrease of the share of dairy products is visible for both milk and butter. Since the early 2000s, the share of both total meat and dairy have stabilized.
The increase of the share of meat corresponds mainly to poultry meat and, to a lesser extent, pork meat. Milk and ruminant meat shares have decreased since 1970. The share of the remaining categories is more stable.
Several factors may lead to growth in the individual demand for animal products (Chapter 8 for more information on changes in diets). Firstly, the growth of per capita income and the relatively high elasticity of demand to income (Thornton, 2010). Secondly, the growing share of the urbanized population and the link to factors such as changes in food habits, wealth etc. (Rae and Nayga, 2010). More precisely, the increase in wealth leads to growth in the consumption of animal products, generally considered as healthy for child development and growth. The increase in animal product consumption is faster in countries with low GDP per capita, since developing countries display higher income growth and higher elasticity. Cultural factors have a huge influence on consumer habits: less meat in South Asia, India in particular; no pork in Muslim communities; more pork in South-East Asia; a shift toward lower fat meats and milk in OECD countries (Rae and Nayga, 2010).These factors can orient and modify changes in demand for livestock products. They explain the great dispersion of consumption profiles between countries of similar wealth: for instance, with an income of $10,000/cap, demand in meat varies from 20 kg to 80 kg/yr, and with an income of $45,000/cap, from 65 kg/yr to 120 kg/yr.
The evolution in some countries shows that this increase has varying limits. Some countries have already traversed the peak – European Union, Japan, Australia and New Zealand – and probably the USA where consumption seems stable but has not fallen. Latin America markets, too, may be close to saturation. In India and Africa, however, animal product consumption is still lower than in the rest of the world. The uncertainties are significant, with a potentially huge multiplicative effect of changes in diet per capita given the current population levels: will the traditionally vegetarian population of South Asia, in particular India, adopt Western consumption patterns (Rae and Nayga, 2010)?
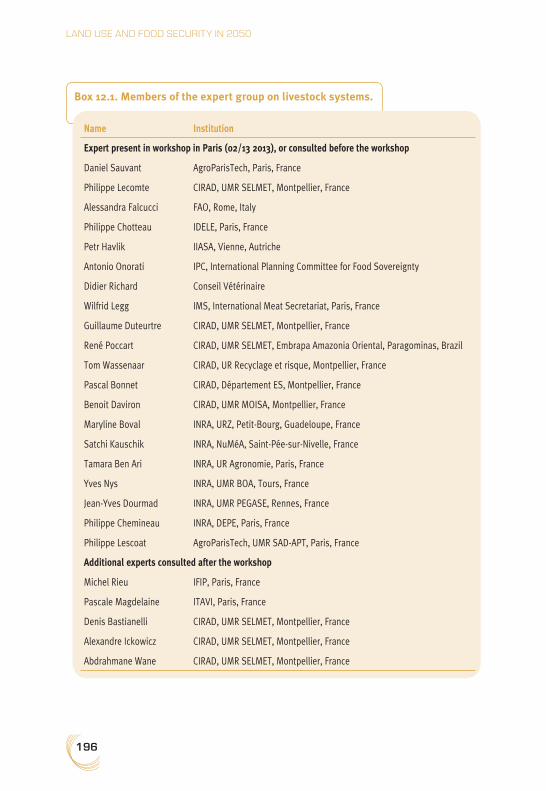
196
LAND USE AND FOOD SECURITY IN 2050
Box 12.1. Members of the expert group on livestock systems.
Name Institution
Expert present in workshop in Paris (02/13 2013), or consulted before the workshop
Daniel Sauvant AgroParisTech, Paris, France
Philippe Lecomte CIRAD, UMR SELMET, Montpellier, France
Alessandra Falcucci FAO, Rome, Italy
Philippe Chotteau IDELE, Paris, France
Petr Havlik IIASA, Vienne, Autriche
Antonio Onorati IPC, International Planning Committee for Food Sovereignty
Didier Richard Conseil Vétérinaire
Wilfrid Legg IMS, International Meat Secretariat, Paris, France
Guillaume Duteurtre CIRAD, UMR SELMET, Montpellier, France
René Poccart CIRAD, UMR SELMET, Embrapa Amazonia Oriental, Paragominas, Brazil
Tom Wassenaar CIRAD, UR Recyclage et risque, Montpellier, France
Pascal Bonnet CIRAD, Département ES, Montpellier, France
Benoit Daviron CIRAD, UMR MOISA, Montpellier, France
Maryline Boval INRA, URZ, Petit-Bourg, Guadeloupe, France
Satchi Kauschik INRA, NuMéA, Saint-Pée-sur-Nivelle, France
Tamara Ben Ari INRA, UR Agronomie, Paris, France
Yves Nys INRA, UMR BOA, Tours, France
Jean-Yves Dourmad INRA, UMR PEGASE, Rennes, France
Philippe Chemineau INRA, DEPE, Paris, France
Philippe Lescoat AgroParisTech, UMR SAD-APT, Paris, France
Additional experts consulted after the workshop
Michel Rieu IFIP, Paris, France
Pascale Magdelaine ITAVI, Paris, France
Denis Bastianelli CIRAD, UMR SELMET, Montpellier, France
Alexandre Ickowicz CIRAD, UMR SELMET, Montpellier, France
Abdrahmane Wane CIRAD, UMR SELMET, Montpellier, France

197
12. Livestock Systems
A review of several world situations shows that policies have often neglected or been ineffective in guiding the livestock sector, particularly in addressing the negative consequences of changes in the sector. Specifically, environmental issues are often neglected and policies have failed to improve efficiency in the smallholder livestock sector (Gerber et al., 2010). The development of the sector, in particular in developing countries, has often been ahead of public interventions. But social, sanitary and environmental issues could lead to more public interventions in favour of
Figure 12.1. Evolution in the world production of animal products in energy (Tera calories).
Source: Authors’ calculation from FAOStat data.
a. Total production
b. Production of the various animal products
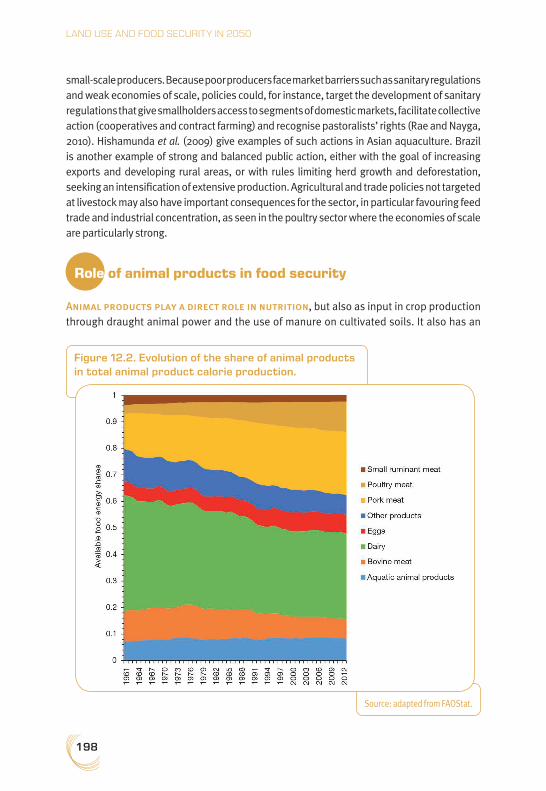
198
LAND USE AND FOOD SECURITY IN 2050
small-scale producers. Because poor producers face market barriers such as sanitary regulations and weak economies of scale, policies could, for instance, target the development of sanitary regulations that give smallholders access to segments of domestic markets, facilitate collective action (cooperatives and contract farming) and recognise pastoralists’ rights (Rae and Nayga, 2010). Hishamunda et al. (2009) give examples of such actions in Asian aquaculture. Brazil is another example of strong and balanced public action, either with the goal of increasing exports and developing rural areas, or with rules limiting herd growth and deforestation, seeking an intensification of extensive production. Agricultural and trade policies not targeted at livestock may also have important consequences for the sector, in particular favouring feed trade and industrial concentration, as seen in the poultry sector where the economies of scale are particularly strong.
Role of animal products in food security
Animal products play a direct role in nutrition, but also as input in crop production through draught animal power and the use of manure on cultivated soils. It also has an
Figure 12.2. Evolution of the share of animal products in total animal product calorie production.
Source: adapted from FAOStat.
199
12. Livestock Systems
important function as a socio-economic activity, crucial for poor people, with consequences for food security. Livestock farming is particularly important as a socio-economic activity in marginal and dryland areas where other agricultural activities are almost impossible. As an example, transcontinental observations show the key role of cattle in every mountainous area, helping the agricultural sector to stay resilient.
❚❚ Importance of animal products in food consumption
The share of animal products in available protein has increased from about 33% to 38% since 1960. This average increase hides a diversity of situations, with some regions being stable or decreasing since 1980, in particular developed countries and sub-Saharan Africa, while in China and Brazil/Argentina the share of animal products in available proteins increased rapidly (Figure 12.3, see also Chapter 8).
On average, animal products account for one-fifth of the energy and more than one-third of the proteins available for human food consumption. Though a substitution between plant-based and animal products is possible, livestock remains an important source of high quality proteins and micronutrients, which is crucial in developing countries: essential amino acids, microminerals and fatty acids in meat, calcium and vitamins in dairy products and eggs, highly bioavailable iron in red meat, omega 3 in fish etc. Besides these advantages, it is difficult to define nutritional recommendations in terms of the share of animal products because healthy diets with a moderate amount of meat or with very low levels of meat and animal products seem possible, though caution needs to be exercised with regards to growing children and elderly people, and under the condition that a diversity of plant protein sources is available (Mariotti, 2017).
Animal products may still have a role in the fight against malnutrition but they are also linked with widespread overnutrition and its associated diseases. The effect of animal products cannot, however, be easily dissociated from the effects of other products consumed together when revenues increase, in particular sugar and fat.
❚❚ Input in crop production
Almost half of the food crops on family farms in developing countries depend on animal draught power. Use of animal draught power is important in Africa and decreasing in Asia and South America (McLeod, 2011).
In many poor countries where mineral fertilizers are not common, manure from livestock is a major output of animal production for fertility transfers. Pasture and livestock may also play an important role in regulating pests and, when present in rotations, provide greater resilience against climate risks, working in the same way no matter which country is concerned. However, due to agricultural specialization, local knowledge should be mobilized or reinvented to allow the appropriate use of the positive interactions between livestock and crop production.

200
LAND USE AND FOOD SECURITY IN 2050
❚❚ Role of livestock for the poor
The role of livestock in food security is complex. Although it was often considered as a means of accumulation for rich farmers, livestock may also be a way to escape from poverty, in particular in sub-Saharan Africa and South-East Asia (Thornton et al., 2002). Some 987 million poor people depend on livestock for their living (De Haan et al., 2010) and this dependency could reach 70% for the very poor (McLeod, 2011). In general, this concerns small species, but it is not always the case, since 60% of cattle in India are raised by small producers (<1.7 ha).
In particular, livestock may be used as a safety net in the case of unexpected bad conditions, when they can be sold (McLeod, 2011). Livestock often plays the role of a bank as a source of liquidity or savings. Moreover, livestock may be at the heart of the regulation systems of space and social relationships. In some societies, livestock is a protective element for the most fragile people in a society (Alary et al., 2011).
However, when demand increases and industrial systems take over livestock production, smallholders and poor people in particular may be excluded from the livestock market. On the condition that some diversification of activities is possible, this evolution may not be problematic for food security, but it is not clear that this is always the case (FAO, 2009c; McLeod, 2011).
Figure 12.3. Share of animal products in the total available proteins in food consumption in various regions of the world.
Source: Authors’ calculation from FAOStat data.

201
12. Livestock Systems
Livestock land use
Livestock plays an important role for land use. Indeed, direct consumption of plant protein is always more efficient than feeding livestock, although part of the land used to produce feed may not be suitable to produce human edible food (Bouwman et al., 2005; Wirsenius et al., 2010). Grazed grassland has expanded by a factor of six since 1800 (De Haan et al., 2010); 40 % of the land available in developing countries is not arable but used as natural or cultivated pasture.
The use of land for feed crops reported in FAOStat has most likely decreased since the 1980s, the share of areas used for feed decreasing from 44-48% to 36-40% (Manceron et al., 2014). The overall change in arable land used for feed is uncertain owing to the limited reliable data at the world scale on some feedstuffs, in particular forage such as alfalfa or maize silage. Pastureland increased by +9% over the past four decades, but not as much as livestock production. Several factors may contribute to this observed trend. First of all, the increase in crop and pasture productivity (cf. Chapter 5) has contributed to globally decrease the land area required per unit of feed. Secondly, changes in feed baskets and improved efficiency of feed rations have contributed to globally decreasing the feed quantity required (thus the associated land) per unit of aggregate livestock output. Thirdly, a significant part of the evolution corresponds to a notable shift of livestock systems from ruminants to monogastrics and towards more intensive production systems (De Haan et al., 2010; Le Cotty and Dorin, 2012; Herrero et al., 2013; Mottet et al., 2017). This leads to an increased use of concentrate feed in place of grass and roughage, accompanied by an increase in livestock efficiency (in calories, proteins or land), since the conversion efficiency of these systems is higher than that of ruminant and extensive systems (Bouwman et al., 2005; Wirsenius et al., 2010). Increased efficiency is also achieved by increasing animal size and carcass yields, or by decreasing age at slaughter and the use of animals for draught energy (Bouwman et al., 2005).
As far as pastureland is concerned, this global picture hides major regional differences. There are, in fact, three main types of observed trends for the evolution in pasture areas. First, world regions where permanent pasture areas increased significantly between 1961 and 2010 (i.e., China +65%, Brazil/Argentina +27%, Near and Middle East +40%, North Africa +5.5%, and Former Soviet Union +19%). In contrast, pasture areas decreased in other regions (i.e., India –26%, Oceania –16%, Canada/ USA –6%, Asia excluding India and China –14% and EU27 –13%). Finally, pasture areas remained rather constant in Latin America, excluding Brazil/Argentina, and sub-Saharan Africa. Even where the pasture area has increased, the rate of increase of ruminant production is not comparable with that of the area: China +2,923%, Brazil/Argentina +230%, Near and Middle East +104% and North Africa +292%. FSU stands out as an exception, as the increase in pasture area is associated with a decrease in ruminant production in this region (+19% versus –9%, according to FAOStat).

202
LAND USE AND FOOD SECURITY IN 2050
Pasture-based ruminant systems are associated with deforestation in Latin America (it should be noted that this relationship is less clear in other tropical forests in central Africa or tropical Asia). In Brazil, 70-80% of total deforestation is estimated to have resulted from the development of extensive livestock systems (Tourrand et al., 2004). Productivity increases on existing pasture could allow for an increase in livestock production without further expansion into natural habitats (Strassburg, 2012). It is important to keep in mind, though, that deforestation is also an indirect response to the extension of soya production on pastureland and may be temporary, before conversion to cropland (Bowman et al., 2012).
Future livestock systems in 2050
The hypotheses for livestock systems in 2050 have been built along two axes: (a) the link between livestock and land use; (b) the type of intensification. Coherently combining various alternative options along these two axes lead to five hypotheses about livestock systems in 2050. The main characteristics of these hypotheses are presented in Table 12.1. Below are very brief narratives for each hypothesis.
❚❚ Hypothesis 1: Livestock minimizing competition with cropland
Livestock in uncompetitive areas involves the husbandry of small and large ruminants in extensive or pastoral systems. It is based on grazing herds on land with medium to low agronomic potential, a diet that is almost exclusively grazed and with low stocking densities. These livestock systems develop in uncompetitive areas. Variability in forage resources both over time and in terms of quantity and quality requires specially adapted livestock management (production schedule, birth rates and livestock density). Pastoral farming is distinguished by extensive herd mobility in order to optimize access to resources over time and space. Pastoral farming requires particular modes for securing access to land. An increase in pastoral system production can lead to degradation of marginal lands, but some organisational approaches and adapted practices may avoid soil degradation and even restore land. Production of ruminant meat may be limited in this scenario, because of the low resource use potential of land used for production. Poultry and pork production could increase to fill the demand gap.
Various factors may cause the development of such systems: an expansion of livestock areas through land clearance, water access management or climate change, and environmental or health crises originating from intensive cattle farming.
❚❚ Hypothesis 2: Agroecological livestock on land in competition with agriculture or urbanization
Agroecological livestock production seeks to produce food as well as other services while strengthening the links with local resources, limiting the use of industrial inputs and the

203
12. Livestock Systems
production of negative externalities, and securing farmers’ incomes. It is based on strong autonomy in terms of feed and input use and the search for positive synergies between livestock systems, cropping systems and the environment.
The principles for animal management are, for example, the management of robust breeds and the development of their adaptive capacity regarding feed, reducing the use of antibiotics and medicines, seeking feed and protein autonomy in a context of climatic variations, mixed livestock, combinations of livestock and crops, and the use of positive-energy buildings (Dumont et al., 2013). Agroecological livestock farming requires new forms of organization and exchanges between livestock producers, and between livestock producers and other farmers, and there is integration at different territorial levels to optimize the flows of materials and ecological regulations.
These systems may develop because of the desire of farmers to change their production methods, through local or national public policies, through appropriate advice, because of consumer demand, or following a health or economic crisis.
❚❚ Hypothesis 3: Conventional intensive livestock with imported resources
Conventional intensive livestock systems are based on the almost unlimited availability of key production factors (land and water, capital, variable inputs and labour). This approach involves a concentration of animals and a specialization of activities. These systems evolve through the genetic improvement of livestock, the development of antibiotics and medications, and the use of nutritious feed (forage, concentrates and by-products).
In this hypothesis, factors and inputs (especially feed) used by conventional intensive livestock systems come from all over the world through international trade. In this case, livestock production may be highly dependent on foreign land (virtual land).
❚❚ Hypothesis 4: Conventional intensive livestock with local resources
This hypothesis is also based on conventional intensification.
In this hypothesis, for various reasons (Chapter 13), the factors and inputs used in livestock production (especially feed) are sourced within a specific geographic area (called ’local’) that can range from the neighbourhood of the farm to a supranational union. Therefore, in countries where land availability is restricted, such livestock systems compete for land with crop production.
❚❚ Hypothesis 5: Backyard livestock
Backyard livestock is built around a logic of opportunism, in terms of space, feed and other inputs. It plays a vital role in households’ food security. Backyard livestock production shares some characteristics with agroecological farming: the search for synergies between

204
LAND USE AND FOOD SECURITY IN 2050
Tab
le 1
2.1
. Ch
arac
teri
stic
s of
th
e fiv
e h
ypo
thes
es f
or li
vest
ock
syst
ems
in 2
05
0
Hypo
thes
es
for 2
050
Live
stoc
k m
inim
izin
g co
mpe
titio
n w
ith cr
opla
ndAg
roec
olog
ical l
ives
tock
Conv
entio
nal i
nten
sive
liv
esto
ck w
ith im
porte
d re
sour
ces
Conv
entio
nal i
nten
sive
liv
esto
ck w
ith lo
cal r
esou
rces
Back
yard
live
stoc
k
Land
-use
fo
otpr
int
Inte
nsiv
e fo
r mon
ogas
trics
an
d ex
tens
ive
for
rum
inan
ts
Inte
nsiv
e fo
r mon
ogas
trics
and
ex
tens
ive
or in
tens
ive
in m
ixed
syst
ems f
or ru
min
ants
Inte
nsiv
e fo
r mon
ogas
trics
an
d ru
min
ants
Inte
nsiv
e fo
r mon
ogas
trics
and
ru
min
ants
Back
yard
for
mon
ogas
trics
and
ex
tens
ive
for r
umin
ants
Feed
Loca
lly p
rodu
ced
feed
on
past
ure
and
gras
sland
for
rum
inan
ts
Impo
rted
feed
for
mon
ogas
trics
Loca
lly p
rodu
ced
feed
, leg
umes
and
fo
rage
on
rain
fed
land
, pas
ture
and
gr
assla
nd fo
r rum
inan
ts
Feed
pro
duce
d lo
cally
, pre
fera
bly
usin
g co
-pro
duct
s and
was
te fo
r m
onog
astri
cs
Loca
lly p
rodu
ced
feed
, le
gum
es a
nd fo
rage
on
rain
fed
and
irrig
ated
land
for
rum
inan
ts
Impo
rted
feed
for
mon
ogas
trics
and
rum
inan
ts
Loca
lly p
rodu
ced
feed
, leg
umes
an
d fo
rage
on
rain
fed
and
irrig
ated
land
, pas
ture
and
gr
assla
nd fo
r rum
inan
ts
Feed
pro
duce
d lo
cally
for
mon
ogas
trics
Use
of co
-pro
duct
s and
w
aste
Bree
ds
and
anim
al
mixi
ng
Loca
l and
har
dy b
reed
s for
ru
min
ants
M
ix of
loca
l and
impo
rted
bree
ds fo
r mon
ogas
trics
Loca
l and
har
dy b
reed
s M
ixed
smal
l and
larg
e ru
min
ants
in
fiel
ds
Impo
rted
bree
dsM
ix of
loca
l and
impo
rted
bree
dsM
ix of
loca
l and
im
porte
d br
eeds
M
ixed
smal
l and
larg
e ru
min
ants
in fi
elds
Anim
al
heal
thCh
emica
l vac
cines
an
d m
edici
nes f
or
mon
ogas
trics
Le
ss a
cces
s to
med
icine
s fo
r rum
inan
ts
Prev
entiv
e us
e of
bio
-bas
ed
med
icine
(e.g
., ta
nnin
pla
nts)
. Bio
-so
urce
d m
edici
ne a
nd p
ract
ices t
o pr
even
t pat
holo
gies
Chem
ical v
accin
es a
nd
med
icine
sCh
emica
l vac
cines
and
m
edici
nes
No e
asy
acce
ss to
m
edici
nes
Syne
rgy
with
fa
rmin
g fo
r ef
fluen
t
Rum
inan
t man
ure
not
used
on
culti
vate
d fie
lds.
M
onog
astri
c man
ure
sold
Syne
rgic
re-u
se o
f effl
uent
s (bi
ogas
, sp
read
ing,
no
treat
men
t in
past
oral
zo
nes)
Non-
syne
rget
ic re
-use
of
man
ure
(bio
gas a
nd sa
les)
Non-
syne
rget
ic re
-use
of
man
ure
(bio
gas +
sale
s)M
anur
e on
ly u
sed
loca
lly
Prod
uctio
n ob
ject
ives
Spec
ializ
ed b
y an
imal
and
by
pro
duct
(dai
ry o
r mea
t, eg
gs o
r pou
ltry
mea
t)
Mixe
d (m
eat,
dairy
, pou
ltry
mea
t, eg
gs)
Spec
ializ
ed b
y an
imal
and
by
prod
uct (
dairy
or m
eat,
eggs
or
mea
t)
Spec
ializ
ed b
y an
imal
and
by
prod
uct (
dairy
or m
eat,
eggs
or
mea
t)
Anim
al tr
actio
n an
d/or
ferti
lisat
ion,
use
as
capi
tal
Live
stoc
k po
licie
sIn
tens
ifica
tion
polic
ies f
or
loca
l dem
and
Supp
ort t
o ru
ral w
orld
. Inc
entiv
es fo
r re
cycli
ngCo
ntra
ctin
g of
rura
l de
velo
pmen
t to
priv
ate
firm
sIn
tens
ifica
tion
polic
ies f
or lo
cal
dem
and
No p
olicy
205
12. Livestock Systems
production and the environment, low dependence on industrial inputs and feeds, and relatively high labour requirements. However, backyard livestock production involves a lower level of technical development and results in lower production efficiency per head.
The share of backyard livestock systems in total livestock production may increase in different contexts: it varies along with the ruralization of the population; it depends on policies supporting backyard production to fight poverty; it may rise following important innovations improving the efficiency of backyard systems.
Conclusion
The livestock sector is very important for land use. It also very diverse in terms of role, efficiency and type of system all over the world. The future of livestock depends importantly on the evolution of demands, although policies could also play a more important role than in the past. The hypotheses on the livestock sector evolution were based on the link with land use, because of its importance, and, in order to capture part of the heterogeneity in production systems, on the type of intensification.
206
13. Scenarios of Land Use and Food Security in 2050Olivier Mora
With contributions from: Marie de Lattre-Gasquet, Catherine Donnars, Olivier Réchauchère, Chantal Le Mouël, Patrice Dumas, Clémence Moreau, Thierry Brunelle, Marco Barzman and Pauline Marty
Introduction: Building land use and food security scenarios
This chapter presents the scenarios of land use and food security in 2050. A scenario planning approach based on morphological analysis was used for building five scenarios. This method was chosen to highlight systemic relations and complex interactions, and to explore alternative futures for land use and food security in 2050 (Chapter 2). By identifying a range of variables influencing each driver of the ’land use and food security’ system and their possible changes, hypotheses on how each driver might evolve in 2050 were drawn up (as described in Chapters 6 to 12). On this basis, scenarios were designed with the project team in close interaction with an international expert group, called the scenario advisory committee. Each scenario combines one or several hypotheses per driver, respecting causal relationships, seeking consistency of the hypotheses and plausibility of the scenario. Five contrasting scenarios of land use and food security by 2050 were developed. They are based on the summary table presented below (Figure 13.1), with each line devoted to a driver and its various hypotheses.
The scenarios are based on major trends, weak signals and potential breaks affecting the drivers of the system, and explain the situations of land use and food and nutrition security in 2050. Quantitative impacts of the scenarios in terms of land use, agricultural production and trade in 14 world regions and at the world level have been assessed through simulations carried out using the biomass balance model GlobAgri-AgT (Chapter 3).
The first three scenarios are based on current trends identified in most regions of the world. The first, ’Land use driven by metropolization’, links the development of megacities at a global level with a nutrition transition led by global agri-food companies selling ultra-processed foods and animal products. These changes happen in a global context of development through market forces and rapid climate change, leading to the marginalizing of small farmers in areas disconnected from urban development. The second, ’Land use for regional food systems’, relates the increase of medium-size cities and their networking with

207
13. Scenarios of Land Use and Food Security
Figure 13.1. Drivers of land use and food security and alternative hypotheses for 2050.
Graphic design: Elodie Carl.
rural areas to the emergence of regional food systems based on traditional foods, family farming and a set of regional agreements. The third scenario, ’Land use for multi-active and mobile households’, links strong individual mobility between rural and urban areas and a development of non-farm employment to the emergence of a global governance based on networks where family farms and interest groups are major actors in food systems.
The last two scenarios involve potential breaks that could change the entire system. The fourth scenario, ’Land use for food quality and healthy nutrition’, assumes that due to the increasing cost of malnutrition, a radical move towards healthy diets occurs, fuelled by global cooperation and public policies and in a context of climate change stabilization. These changes involve a re-configuration of agricultural systems backed by new alliances between stakeholders across the food supply chain. The fifth scenario ’Land as commons for rural communities in a fragmented world’, assumes that in a context of recurring and

208
LAND USE AND FOOD SECURITY IN 2050
multiple crises, development based on small towns and rural communities occurs, focusing on managing common resources and the transition to agroecology in agriculture in order to ensure local food security.
The five world scenarios of land use and food security in 2050 are fully described below through some keywords, a figure describing the combination of hypotheses, a narrative of direct and external drivers of the system and their interactions, the five dimensions of land use, and the dimensions of food and nutrition security (availability, access, utilization, stability and nutrition).
Some quantitative information issued from the quantitative analysis is part of each scenario narrative, and describes some aspects of world regions’ situation in 2050. However, the quantitative translation of hypotheses and quantitative impacts of scenarios are fully reported in Chapter 14.
Land use driven by metropolization
Figure 13.2 indicates the combination of hypotheses per driver constituting the scenario ’Land use driven by metropolization’. Furthermore, the following keywords summarize this scenario: metropolization, megacities, international trade, modern value chains, agri-food companies, spatial divide, animal-based and ultra-processed foods, diet-related non-communicable diseases, double burden, dual agriculture.
❚❚ Main drivers of the Metropolization scenario
By 2050, the world’s population is concentrated in major urban centres, mainly located in developing countries. Two-thirds of the world’s population now lives in cities, with more than 15% of the urban population residing in megacities housing over 10 million inhabitants (UN, 2015). These megacities and their associated regions (McGee, 2009) have become highly attractive to rural and international migrants in search of employment. Metropolization processes around the world have buoyed a strong global economic growth that is based on international trade, agglomeration of activities, knowledge, finance and innovation. This world economy is built upon a network of global cities and follows a conventional development pattern based on fossil fuels. These urbanization processes have given rise to highly uneven spatial development and marked spatial divides, with many rural areas and hinterlands left out of development processes. While the emphasis has been on conventional development, environmental concerns have taken a back seat and climate change has caused significant effects, especially in agriculture.
Although they are often cut off from the rural areas within their own national space, megacities are sometimes connected by international trade to very remote rural areas, taking advantage of low transportation costs. From a global perspective, agricultural activities are located in specialized areas, although some farms producing value-added

209
13. Scenarios of Land Use and Food Security
foods for city-dwellers still remain within the large urban regions. The general decline in agricultural employment in rural areas is mainly linked to migration from these areas towards the large urban areas, and to the increase in labour productivity in agricultural areas. The food strategies of urban and rural households are based on the purchase of foodstuffs via national or international markets.
Globalization of food value chains, the urbanization of lifestyles and improved incomes linked to urban development have driven a diet transition. Processing, retailing and wholesaling transnational corporations now control the greater part of food markets in urban and rural areas, even in developing countries. The agri-food, logistics and retail multinational companies have played a key role in the diet transition fuelled by foreign direct investment, marketing and advertising, and supported by investments in logistics and storage facilities, distribution networks and digital platforms. By adapting their strategy to the economic context of developing countries, these food companies have reshaped the food environment, distributing low-priced, ultra-processed foods in place of traditional food (Monteiro et al., 2013). The global food supply of plant-based products is concentrated around a small set of agricultural products: rice, corn, wheat and soyabean. There has been a shift from ruminant to monogastric animals in meat production. These agricultural products are the first link within a value chain in which they undergo complex processing (’cracking’) and then re-assembling, or are incorporated into ready-made dishes, converted along the way into ultra-processed foods. The urbanization of lifestyles has led to the development of out-of-home catering (restaurants, snacking products and soft drinks) and a decline in meals taken at home where ready-to-eat meals dominate. The emergence of a middle class in megacities has driven rapid growth in consumption of animal-based foods. The modernization of supply chains combined with the raised technological level of agri-food activities has brought efficiency gains in the supply-side chain, as well as cutting losses and waste, thanks to an improved use of by-products and industrial waste.
As a result of these changes in food environment, lifestyles and incomes, we have seen a fast-moving convergence in dietary patterns around the world and a sharp rise in daily calorie intake. Two dietary patterns have changed simultaneously: one driven by the consumption of low-price ultra-processed foods and soft drinks related to the expansion of globalized value chains, and one supported by the major consumption of animal products, meat in particular, based on increasing demand from urban consumers. Compared to 2010, diet patterns in 2050 are higher in edible plant oils, refined cereals, salt, sugars and sweeteners and animal products (including processed meat), and lower in coarse grains and pulses. Changes in diet patterns combined with low levels of physical activity among city-dwellers significantly affect public health. The prevalence of overweight and obesity, type II diabetes, cardio-vascular diseases and cancers have increased sharply in particular in developing countries. Undernutrition and micro-nutrient deficiencies nevertheless persist due to the low nutrient qualities of highly processed foods, as well as the growth of inequalities within urban areas and between urban and rural areas.
210
LAND USE AND FOOD SECURITY IN 2050
Farming structures deal with a small number of major intermediation operators on agricultural markets. They are increasingly reliant on agri-food processing companies or go-betweens, through integration or contract farming. Concentration in the seed, chemical input and farm machinery sectors is very high. Agriculture is highly specialized within broad regions, drawing on high levels of inputs, and technical and genetic innovations. Intensive conventional agriculture is driven by private capital from investment funds, private companies and the wealthy urban population. Livestock systems are now dominated by intensive farming of monogastric animals, using animal feed and feed concentrates. The intensification of cropping systems has often brought high yields per hectare, thanks to the use of agri-industrial inputs, improved seed and increased mechanization. However, these specializations remain fragile on account of the considerable effects of climate change, and instability prevails on international markets (price volatility). Agricultural production addresses environmental impacts after-the-fact via end-of-pipe approaches. Severe soil degradation causing abandonment and relocation of agricultural land and high levels of greenhouse gas emissions are common. Alongside these integrated systems, small-scale farming nevertheless persists. In remote rural areas with poor access to transportation infrastructure, disconnected from large cities and isolated from markets, resource-poor farmers seek to carry on their farming practices in arduous economic and environmental conditions (degraded soil, unsecure access to land, poor access to water and to markets).
The dynamic of the global food system has led to an international specialization in production (Chapter 14). Brazil/Argentina and North America doubled or tripled their exports. The Former Soviet Union (FSU) and European Union (EU 27) increased their exports. The Rest of Asia increased both exports and imports. Other regions are now highly dependent on imports, with imports tripling in West Africa and East, Central and South Africa (ECS Africa), North Africa and Near and Middle East, and even larger increases in India. Both importing and exporting regions (except China) experience an increasing pressure on arable land and the most significant increase on pastureland arises in ECS Africa. Here, dietary patterns, in particular the rise in consumption of animal products, have been of major significance for land use change as they induce strong expansion of pastureland and much deforestation. Despite the increase in global trade and because of a sharp pressure on agricultural land, the dramatic impact of climate change on agricultural production has made the food supply system more vulnerable, triggering occasional food crises that affect especially low-income households.
❚❚ Land uses in the Metropolization scenario
Agronomic potential of land
As a consequence of significant climate change since 2010 (+2°C), the potential cultivable land area has increased by about 120 Mha for moderately suitable to very suitable lands
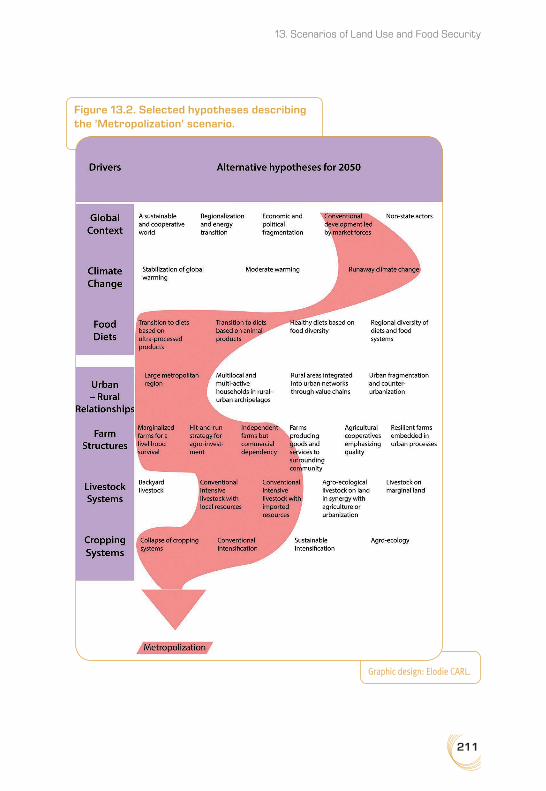
211
13. Scenarios of Land Use and Food Security
Figure 13.2. Selected hypotheses describing the ’Metropolization’ scenario.
Graphic design: Elodie CARL.
212
LAND USE AND FOOD SECURITY IN 2050
by 205050. This increase is unevenly distributed, however. It mainly concerns Northern regions, while arable land has shrunk in tropical areas. Most of the additional cultivable area is made up of non-competitive land that is marginally suitable. As a result of this, the average quality of the potentially cultivable land has significantly decreased. The combined effects of agricultural activities and climate change have accelerated degradation of farm land cultivated in 2015, both for arable land and pastures51. The intensification of conventional agriculture and, in some regions, the rising temperatures have increased the speed of carbon mineralization in soils. The conversion of wetlands into arable land and deforestation for the expansion of farmland has resulted in severe soil degradation, particularly in arid and semi-arid areas. By 2030, soil degradation of agricultural area had already affected 225 Mha, with Latin America and sub-Saharan Africa being particularly hit by land degradation.
Distribution of land between different uses
Land use changes have occurred from 2010 with an increase in farmland area whose magnitude depends on the significance of animal products in the diet. The development of livestock farming has led to massive conversion of pasture into arable land for food and feed and to considerable deforestation in favour of pasture for ruminant breeding in ECS Africa. Arable land areas have increased by two different pathways. First, in exporting regions such as Brazil/Argentina and Canada/USA an increase in production of oilseeds (for vegetable oil) and sugar as well as feed ingredients (maize and cake) and meat, in order to provide international markets and globalized food chains, has led to an increase in cropland area. Second, in some developing regions such as India, Rest of Asia, West Africa and ECS Africa, the rise in food consumption due to both a strong diet transition and a demographic increase has led to a sharp increase in cropland area.
Growth in energy biomass production has been weak with a total of 60EJ produced worldwide, of which half comes from farming residues and the other half from lignocellulose fuel crops.
In parallel, land use change for urbanization has concerned 121 Mha in 2030, mainly taking place on agricultural land (Seto at al., 2012). By 2050, urban growth has been mostly in developing countries, representing 90% of the global additional urbanized land area (FAO, 2011b). Half of this urban expansion has been in Asia, mainly in China and India, with the rest occurring in Africa (Nile Delta, Gulf of Guinea, Great Lakes and Ethiopia).
Access to land
In most regions, land tenure systems have evolved towards land markets which are more liquid and open to investment. A dual system has now taken shape with the coexistence of
50. Estimation based on Zabel et al. (2014).
51. It was estimated that between 5 and 12 million hectares of arable land were lost each year due to degradation in the last century (Scherr, 1999). 24% of the global land area had already suffered declines in quality and productivity between 1975 and 2000 as a result of unsustainable land use (UNEP, 2014).

213
13. Scenarios of Land Use and Food Security
large farm structures on good-quality soils related to international markets and small farm structures on non-competitive land engaged in subsistence agriculture. International and urban investors (businesses, finance and the urban bourgeoisie) buy and sell land in areas of high agricultural potential, moving from one region to another depending on the land’s potential for agriculture. These actors have a mining-type relationship with agricultural land resources and may engage in speculative investments. Within the urbanized mega-regions, however, urbanization creates great instability in farming land use.
Degree of intensity of land use
Under the effects of climate change, taking a world average and excluding the impacts on yields of changes in cropping systems that have occurred over the period, potential crop yields could have decreased since 2015, by –13% for wheat, –14% for maize, –16% for rice, –30% for soyabean and –21% for groundnuts (Müller and Robertson, 2014). Intensification and technical innovation processes have partly offset the fall that was once expected in yields, using inputs, enhanced seed, irrigation and precision technologies. Faced with the effects of climate change, a race has started to find new resources (new varieties, new molecules etc.) and develop cropping systems that are adapted to these changes. In some intensively cultivated regions, cropping systems have collapsed under the combined effects of climate change, causing some areas to be abandoned while others have been put into cultivation. For reasons of efficiency, it is mainly monogastric livestock systems (e.g., poultry) that have developed, using cereals and agricultural by-products (e.g., oil cake and spent grains) as animal feed, and improving the genetic of breeds. Ruminant farms are divided between highly intensive feedlots located near urban markets and extensive systems making use of non-arable grasslands, mostly located in sub-Saharan Africa. But more frequent extreme weather events (heat waves, flooding etc.) are causing strong variability in crop yields from one year to the next and climate change generates more frequent disease outbreaks in livestock.
However, these intensification processes have not concerned isolated rural areas without connections to international markets. Here, agricultural intensification remains weak in the absence of investment capital and due to difficult access to inputs.
Services provided by the land
All the regulating services are affected by the rise in agricultural production and the expansion of urban areas. The main consequences of changes in land use and land sealing include local climate change (heat islands, lower rainfall etc.), an increase in soil erosion and a reduction in soil water retention capacity, thus aggravating the effects of climate change. Increased arable land and grassland areas at the expense of natural areas and forests have caused considerable organic carbon losses and emissions, as does the conversion of pasture into arable land.
Provisioning and cultural services are particularly affected by climate change. Agricultural over-exploitation also causes soil depletion, while generating pollution that affects drinking

214
LAND USE AND FOOD SECURITY IN 2050
water resources. The specialization of agriculture has reduced the genetic diversity of agricultural resources. Natural and protected spaces are gradually shrinking, giving way to exploitation for agricultural or energy purposes. Ecosystem diversity and amenities are being reduced due to uniformization, over-exploitation and the impacts of climate change. Landscapes are simplified and specialized, with a pronounced spatial segregation of functions, thereby reducing ecosystem resilience. Finally, agricultural land use contributes little to rural development, due to the decline in agricultural employment since 2010.
❚❚ Food and nutrition security in the Metropolization scenario
Thanks to agricultural intensification and modern value chains, food availability has increased globally since 2010, in particular in developing countries.
However, in 2050, diet transition, which is marked by increased consumption of vegetable oil, refined grains, processed meat, added sugars and salt and reduced consumption of fresh produce and coarse grains, led to a rapid rise in the prevalence of overweight and obesity and non-communicable diet-related diseases. National health systems have struggled without success to cope with these diseases. All over the world, diets are now made up of 60% of processed and ultra-processed foods with high energy densities and low nutritional value (poor in micro-nutrients and fibre). Their diffusion has increased sharply the prevalence of obesity and diet-related (Crino et al., 2015) diseases such as type II diabetes, cardio-vascular diseases and some cancers, in particular in developing countries. In 2050, the sales per capita of ultra-processed foods in upper-middle-income countries (mainly in East Asia) reach similar high levels to those in high-income countries, while they have reached a plateau in high-income countries since 2010. In low-income countries (mainly South Asia and sub-Saharan Africa) where consumption of ultra-processed foods was low in 2010, sales of ultra-processed foods are now more than half of those in high-income countries (Baker and Friel, 2014). Since 2030, more than 60% of the world population is either obese or overweight, compared with 33% in 2005; and the obesity prevalence in sub-Saharan Africa is higher than 17.5%, double the situation in 2005 (Kelly et al., 2005). Since 2020, non-communicable diseases, most of which are significantly associated with diet, already represented two-thirds of the global morbidity burden (Chopra et al., 2002).
The improvement of access to food has been dependant on the ability of large cities to generate jobs and boost incomes. On this point, the megacities are not all on an equal footing, depending on a series of cultural, social and institutional factors (education levels, infrastructure quality, integration into the world market etc.). With the fast pace of urbanization, food inequalities are also widening within cities: wealthier urban populations have access to a more diversified diet and are therefore seeing an improvement in the nutritional quality of their diet, while the more disadvantaged urban populations, living in slums, consume cheap, energy-dense highly processed foods that have negative effects on health (Drewnowski, 2009). Furthermore, in 2050 declining dietary diversity for the poor has increased micronutrient deficiencies, despite better access to inexpensive calories than in 2010. In rural areas, the spatial divide with large

215
13. Scenarios of Land Use and Food Security
cities has had significant effects on undernutrition: access to food markets is difficult for rural consumers and small farmers are exposed to climate risks.
Against a backdrop of severe climate change, low-resilience agricultural systems with poor biodiversity, high technical content and a great reliance on international markets are generating high variability in output in the different regions. Due to the interdependency of the markets and the importance of world trade dominated by a small number of operators, there is high volatility in foodstuff prices, thereby making access to food unreliable for the most vulnerable populations.
❚❚ How did we get here?
Economic growth in emerging countries continued at a fast pace over the period 2015-2030. To achieve these results, an alliance was formed gradually between a number of multinational companies and investment funds on the one hand, and the UN, Bretton Woods institutions and WTO on the other. They lowered trade barriers in order to foster international trade, drew up global agreements on trade backed by the harmonization of product standards and favoured foreign investment in the agricultural, food, mining and industrial sectors of countries in the Southern hemisphere. They have fostered growth in consumption and global trade as a way of avoiding social tensions.
The world’s economies remain highly reliant on fossil fuels, while a low level of concern for environmental issues prevails. Internationally, the belief that technical progress could mitigate the impacts of global changes (GMO, geo-engineering etc.) has prevailed, but without fulfilling its promise. Fossil fuel availability remains high, thanks to the exploitation of oil shale, fossil fuel reserves in the Arctic and Antarctic and deep-sea drilling. The energy mix has therefore remained focused on oil, gas and coal. Emissions of CO2 and other gases have continued to grow. Economic competition between States has prevented the establishment of an effective carbon market. In order to avoid disrupting economic growth, no efforts were made on carbon sequestration until the mid-2030s. In 2050, per capita GDP is $24,000 and the resource-intensity of GDP is high. Total energy consumption stands at 879 Exajoules (against 546 EJ in 2010).52
In the face of the local and global environmental issues generated by human activity, confidence in the ability of science to overcome the problems was previously high. Research focused on industrial efficiency, on decoupling production and resources by enhanced efficiency, on recycling and reducing waste. Technological progress, meanwhile, made it possible to contain the increase in the cost of extracting fossil fuels. Convergence between various technologies did allow considerable progress, but at the price of a number of accidents with serious effects on health and the environment.
In the years just preceding 2050, however, there were increasing numbers of environmental, health, economic and social catastrophes. Energy prices rose sharply as conventional
52. These energy hypotheses come from the Jazz scenario of WEC (2013).
216
LAND USE AND FOOD SECURITY IN 2050
oil and then gas resources became increasingly scarce. Tensions rose over water with urbanization, the extension of industrial use and the increased frequency of extreme climate phenomena. Meanwhile, reserves of phosphate and rare metals with low extraction costs became depleted. Public health deteriorated sharply due to pollution and, most significantly, unhealthy diets.
Land use for regional food systems
Figure 13.3 indicates the combination of hypotheses per driver constituting the scenario ’Land use for regional food systems’. Furthermore, the following keywords summarize this scenario: regionalization, supranational regional blocs, traditional and hybrid diets, regional food systems, food sovereignty and subsidiarity, regional integration of production and consumption.
❚❚ Main drivers of the Regionalization scenario
By 2050, States have joined to form supranational regional blocs. Political and economic governance in regional blocs took shape to address several difficult challenges including financial crises, unemployment, pollution and the impact of diet transition on public health. Since 2010, urbanization took place mainly in medium-size and small cities (Montgomery, 2008). Supported by national and regional policies, regional development has generated tight relationships between rural areas and cities. Networks of urban and rural areas emerged, developing synergies between agriculture, food processing and regional markets. Rural development reconnected itself to urban food supply chains by promoting traditional regional diets and by building regional synergies between agriculture and food chains. At a supranational level, regionalisation in food systems relies on producing agricultural products suited to a region’s agro-climatic conditions, on regional cuisines rooted in traditional food practices and on key value-chain stakeholders. Rather than a global convergence of dietary practices, diverse pathways for regional food systems emerged around the world. In addition to food and farming, within the regional blocs, States also tackled the energy transition. They sought greater energy autonomy by increasing the production of renewable energy or by using regionally available fossil fuel resources.
Regional blocs have implemented a concept of ’food sovereignty and subsidiarity’, wherein as much food as possible is produced within the region and recourse to imported products is only made when regional production is not sufficient, as is the case in North Africa and the Near and Middle East. Regional policies were designed to protect domestic food markets from the influence of low-cost and highly processed foods. National policies promoted the production of food matching traditional regional diets. They emphasized food diversity rather than staple foods. Bilateral regional agreements were implemented in cases where regional food resources are not sufficient.
217
13. Scenarios of Land Use and Food Security
Food supply chains were reshaped by investing preferentially in traditional regional food and reconnecting the food industry to regional production through contract agreements. Logistics, agri-food and retail distribution companies came together in networks organised around rural production sites, with storage, slaughtering, processing and trade located in intermediate urban centres and diverse distribution systems at both urban and rural levels. Well-structured industries emerged, making use of transportation networks and storage facilities, and agricultural cooperatives made contract agreements with downstream partners. Small and medium-sized cities, where industrial and small-scale food processing is concentrated, now act as intermediaries between rural areas and urban centres. The growth of agri-food industries and small- scale food processing has had a positive knock-on effect for agriculture and for rural development in general, improving household food security through increased incomes. Food access for rural populations was improved with the development of regional food value chains.
By 2050, after several decades of promoting regional diets and supporting diverse food industries based on regional food cultures, each region benefits from a broad range of accessible foods. Certain regions have now specifically increased their production of tubers and roots (e.g., West Africa), while others focused on coarse grains or pulses (e.g., ECS Africa and India), and have developed the attendant supply chains for these products.
In a context of moderate climate change, renewed diversity in production has transformed cropping and livestock systems. Crop diversification led to increased production of legume crops, thereby making cropping systems more agroecological, and also strengthened ties between cropping and livestock systems. Depending on the region, cropping systems evolved towards sustainable intensification agriculture or agroecology. Animal feed is expressly sourced from regional crop production and trade in organic fertilizer between livestock and crop farms is organized at small and medium scales. Farmers select crop or animal species suited to their regional agri-climatic conditions. Accordingly, small ruminant production is well developed in semiarid areas where its consumption is traditional, using marginal or uncompetitive land for pasture.
Since 2010, in most of the world regions, arable and pastureland areas have been stable. Exporting regions such as North America, Brazil/Argentina, Oceania and the Former Soviet Union and importing regions such as the Rest of Asia or East, Central and South Africa (ECS) have either slightly increased or decreased their arable land. But exporting regions like Brazil/Argentina, where agriculture was previously export-oriented, have been through major changes in their agricultural production. However, four regions have experienced an increase in agricultural land: EU 27 and India, where arable land increased; West Africa, where both arable land and pastureland grew strongly; and ECS Africa, where pastureland expanded significantly. Globally, the regionalization of diets and food systems resulted in reduced international trade which, nevertheless, remains a major concern for traditional net importing regions such as the Near and Middle East, North Africa, where regional production is not sufficient to feed the regional population, but also for West Africa.
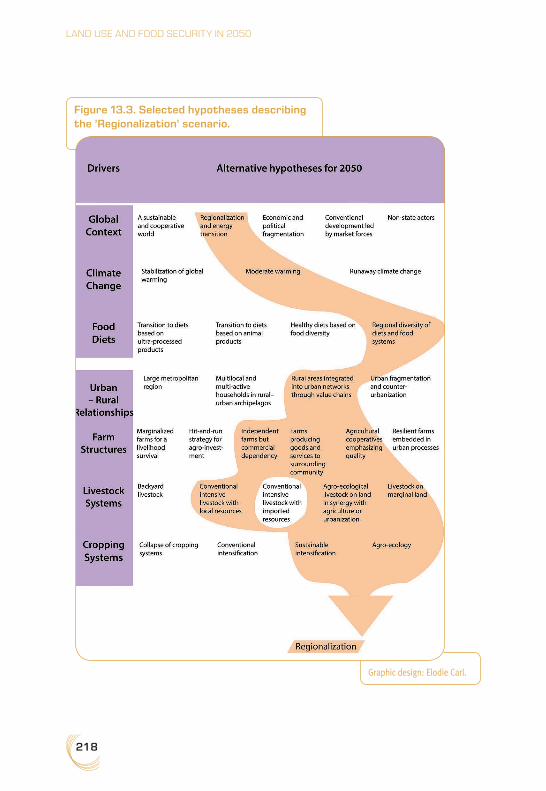
218
LAND USE AND FOOD SECURITY IN 2050
Figure 13.3. Selected hypotheses describing the ’Regionalization’ scenario.
Graphic design: Elodie Carl.

219
13. Scenarios of Land Use and Food Security
❚❚ Land use in the Regionalization scenario
Agronomic potential of land
As a consequence of moderate levels of climate change since 2010 (+1°C), the potential cultivable land area has slightly increased by about 60 Mha for moderately suitable to very suitable lands for agriculture by 2050. Land increases were distributed very unevenly, with suitable arable land increasing in higher latitudes but decreasing in tropical areas. In some regions, where the impact of climate change on suitability of cropland was substantial, soil conservation and soil quality remediation became important policy issues. In other areas, where the impact was not as strongly felt, regional policy focused on limiting soil degradation.
Distribution of land between different uses
Between 2015 and 2050, food, feed and livestock production gradually fell back into sync with regional eating habits. Cultivated varieties are once again grown in proximity to areas of consumption within the region.
The regional production of crops for export has declined sharply and has been replaced by the production of crops and animal products for consumption within the region. The production of vegetable oils, which had previously been a mainstay of global trade, declined worldwide, as did the amount of land used for their production. The production of animal feed crops also declined markedly from 2015. Livestock systems were restructured to make use of regionally available feed crops. Certain regions, such as the European Union, have replaced soyabean imports with the production of legume crops for animal feed. As a result, since 2010, cropland areas have decreased in exporting regions such as Brazil/Argentina and the Former Soviet Union, but they have increased in West Africa, India and the EU 27.
Because of the limited nutrition transition since 2010 and the global stability of animal product consumption per capita, pasturelands have remained stable in most regions of the world, even being reduced in Canada/USA, Rest of America, Oceania, Former Soviet Union and China. The increase of world pastureland since 2010 is mainly the result of the increase in the two sub-Saharan African regions. In ECS Africa and West Africa, pastureland expansion is partly linked to the major role of small ruminant meat in regional diets and to the low efficiency of the regional livestock systems.
In regions where there was contention between food crops and biofuels, priority was given to food crops over the production of biofuels. The regions with land constraints pursued other renewable energy sources, such as solar and wind. The growth of biofuels was particularly visible in regions that had few fossil fuel resources and some land availability, based either on dedicated crops, on crop residues or on forest use. Countries with available cropland produce biomass specifically for energy production. Countries with extensive forest area make maximal use of forestry and crop residues and improve their forestry management practices. In some regions, forests are planted while in others

220
LAND USE AND FOOD SECURITY IN 2050
there is deforestation to convert land to agricultural use. In all countries, the use of agroforestry practices is on the rise.
Access to land
Land use planning policies have progressively introduced regulations to manage the use of land. Regional and domestic policies have served to protect agricultural land from encroaching urbanization and have encouraged the relocation of production systems. Land tenure was strengthened, which increased stability for small family farms and improved land tenure rights for women and young people. Intermediaries who favour certain types of agriculture, regional products and organise market access, such as collective land holdings, agricultural cooperatives, producer associations, agri-business or municipalities, determine access to land.
Degree of intensity of land use
Under the effects of climate change, taking a world average and excluding the impacts on yields of changes in cropping systems that have occurred over the period, potential crop yields could have decreased since 2015, by –6% for wheat, –7% for maize, –8% for rice, –15% for soyabean and –10% for groundnuts. Falls in production were felt more sharply in tropical regions than in the Northern Hemisphere. The increasing frequency of extreme weather events such as droughts, floods and hurricanes also exacerbated year-to-year variability in production.
A variety of practices has been used for agricultural intensification, ranging from conventional intensification to intensive agroecology. The region’s access to energy resources has been a deciding factor in shaping its agricultural production systems. In regions with accessible fossil fuel resources, agricultural systems have continued to evolve conventionally towards intensification. Regions with few fossil fuel resources have developed agricultural systems centred around energy autonomy (biomass energy and anaerobic digestion) and low dependence on industrial inputs (mineral fertilisers, pesticides and seed). The most autonomous and resilient systems, which draw on biological regulations, have required specially adapted mechanization technology or high levels of human labour. A second factor affecting intensification has been the amount of available arable land in a region. This has been particularly the case in intertropical areas where climate change affected arable land in increasingly adverse ways. Agricultural intensification is strongest in areas with limited land resources. Here, agroforestry systems have been popular as they are able to meet food and energy needs at the same time.
It has been possible to limit yield losses through the use of species and varieties adapted to local soil and climate conditions and by reintroducing coarse grains, legumes, roots and tubers to diversify the range of crops produced.

221
13. Scenarios of Land Use and Food Security
Services provided by the land
Social services associated with land use, rural development in particular, are significant. Growing ties between farmers and food value chains created agricultural jobs and generated agricultural incomes in rural areas. In certain regions, land use has contributed to increasing environmental services. In regions where agricultural and food issues are crucial, fragile land is particularly protected against degradation. Cropping systems that protect against soil salinization, erosion and flooding are developed and expanded.
❚❚ Food and nutrition security in the Regionalization scenario
In 2050, food availability varies considerably from region to region. It has improved daily caloric intake in the regions where it was the lowest, such as India and ECS Africa.
In terms of food access, the development of regional food value chains improved physical access to food in both rural and urban areas. The regionalization of trade made it possible to protect farmers in developing countries against competition from areas with higher agricultural productivity. Since 2015, trade relationships between rural and urban areas have been strengthened, improving the incomes of farming households in rural areas and their access to food. Regional value chains are based on regional products and processing, and on the relationship between urban and rural areas. Traditional value chains more or less hybridized with supermarkets and regional agri-business, have kept pace with contemporary developments, yet have valued culinary culture, and agriculture has been organized around the production of products with high added value. Product quality certification systems have reinforced this dynamic, as have the urban policies of major cities reconnecting urban food consumption to regional production.
In 2050, the regional patterns of diets are very diverse as regional supply chains have been reshaped by reconnecting to regional food crops. Since 2010, the consumption per capita of cereals, coarse grains, or tubers and roots as the basis of diets has stabilized or increased, the significance of each product depending on the region, while regional consumption of animal products has increased slightly. In all regions, consumption per capita of vegetable oil has decreased sharply as has that of sugar and sweeteners in most regions, while stabilizing at low levels in other regions.
The quality of local diets, particularly in developing countries, did not fall. The limited development of ultra-processed products and the increase in consumption of traditional products have helped to maintain regional diets that are high in products of good nutritional quality. In developing countries, where in 2015 domestic food systems hadn’t yet been transformed by transnational food companies, safeguards have been put in place in order to limit the entry of unhealthy foods and public policy has supported regional supply chains, the marketing of traditional products and the promotion of regional culinary heritage (Gomez and Ricketts, 2013). In many cases, creating food systems aligned with traditional diets and based on diverse plant crops, has actually improved the nutritional quality of local diets (Smith, 2013). In India and ECS and West Africa, nutrition deficiencies
222
LAND USE AND FOOD SECURITY IN 2050
have been offset by an increase in the consumption of animal products, rebalancing diets that were traditionally low in calories and deficient in micronutrients (Arimond and Ruel, 2004; Roesel and Grace, 2015).
❚❚ How did we get here?
In the face of recurrent crises (price volatility, pandemics, local pollution, obesity and an increase in diet-related non-communicable diseases) caused by climate, social and economic change, States joined to form large, supranational regional blocs. Between 2020 and 2035, European countries were finally able to reach agreements and to implement structural reforms to restore economic growth, favour investment and employment, and institute comprehensive polices on climate change adaptation, energy, the environment, food and the fight against poverty. Between 2030 and 2050, the European Union, North Africa, and sub-Saharan Africa were able to develop economically, politically and socially, while each preserved their own unique cultural specificities. Regional integration in Asia is centred on Japan, ASEAN countries and Australia, with India close to this bloc, while China and Russia build closer ties with each other. In Latin America, the Latin American Integration Association (LAIA) contributes to regional integration through trade.
Small and medium-sized businesses, numerous civil society organisations and governments all understood that institutions needed to be strengthened, regional cooperation encouraged and intra-regional trade expanded. This was necessary to successfully manage the energy transition, strengthen the labour market, promote social cohesion, improve food diversity, with a particular focus on regional dietary patterns, sustainably manage natural resources and support democracy. These measures would also prevent political fragmentation and avoid international governance by market forces.
To reduce food dependency, regions introduced strategies to make the best use of regional agricultural resources to supply the population with their needs. These measures also address important health issues, namely obesity and non-communicable diet-related diseases. Accordingly, regions promote the production of certain food products associated with traditional regional diets. Food supply is now at the centre of a wide range of policy objectives and is the force driving many comprehensive policy measures that jointly address agriculture, food and energy. The resulting food supply chain resembles a tapestry of large regional companies and small businesses. Through their support for this network of food systems to meet urban food needs, regional organisations also address rural development and food and nutrition security concerns for rural households. National rural development policies are therefore in line with efforts to develop regional food value chains. Private land ownership is increasingly regulated across all regions as a way of safeguarding the land resources necessary for food production.
Investment in research varies according to region. Countries with more limited financial resources concentrate on social innovation and on modernising organisations. This allows them to remain competitive in a digital world. Within each region, countries work together

223
13. Scenarios of Land Use and Food Security
to improve education and investment in research in an effort to be more competitive in a world where the knowledge economy takes increasing precedence over resources.
In each region, holistic and integrated food and energy policy measures are gradually introduced. They promote efficiency and reduce losses and waste, which in turn cut carbon emissions. In Africa, substantial levels of investment are made in the production of local, renewable energy sources (solar and biomass) and in the electrification of urban and rural areas in order to limit fossil fuel imports and to encourage economic development based on local resources for regional markets. In 2050, per capita GDP is $20,000. The use of biomass energy has increased. Energy from biomass sources has reached 150 exajoules (EJ), but there is strong variation among regions, and particularly among countries, by virtue of their available mineral and land resources. Globally, 60 EJ comes from agricultural residues, 30 EJ from better managed forest resources and 60 EJ from energy crops (second-generation biofuels and bioelectricity from very short rotation coppice). Regional carbon trading schemes have developed in the absence of international agreements on climate change, which encourages regional energy autonomy. Prices are higher in regions without fossil fuel resources to hasten the transition to renewable energy.
Land use for multi-active and mobile households
Figure 13.4 indicates the combination of hypotheses per driver constituting the scenario ’Land use for multi-active and mobile households’. Furthermore, the following keywords summarize this scenario: non-State actors, socio-economic networks, mobility, household’s multi-activity, multi-local, non-farm jobs, transport, information technologies.
❚❚ Main drivers of the Households scenario
In a highly globalized, mobile and hybrid world, non-State actors including civil society groups, international NGOs, local authorities, multinational companies, academic institutions, foundations and cities drove social, economic and geopolitical transformations. They organized themselves to form ad hoc networks that gradually superseded sovereign governments and now play a key role in trade. Today, these networks fuel public debates. Interest groups structure both consumption and production through new forms of disintermediation of food value chains. Their strategies are jointly defined with citizens, consumers, residents and other relevant groups, who express their concerns regarding health, biodiversity, the environment or climate change. These networks have come to serve as governing bodies shaping agriculture. In a dynamic but unstable economic context, reversible, temporary, short- or long-distance types of mobility constitute a valuable strategy for rural households to diversify their incomes. Reversible, temporary, short- or long-distance mobility also drive social networks and economic strategies. In 2050, farming households are generally multi-active, engaging in farming and non-farming activities located both in rural and urban areas.

224
LAND USE AND FOOD SECURITY IN 2050
In 2050, rural migrations to cities are temporary. Mobility evolves according to employment and income opportunities in urban and rural areas. Circular migration between rural and urban areas, alongside seasonal or transnational mobility, has become a usual way to ensure access to employment. Circular migrants find employment either in cities or other rural areas, in sectors such as the food trade and processing, industry and services, or through seasonal work in cash crop agriculture. Farming remains a core activity within rural households, but the share of non-farm activities in the incomes of rural households increases as mobility intensifies (Rigg et al., 2012).
In 2050, supply chains are extremely diversified, ranging from highly centralized large-scale retail systems to systems based on direct relationships between producers and consumers, along with all possible intermediate variants. Many formal and informal networks have emerged. They are composed of non-State actors playing both economic and non-economic functions, including processing, product sales and finance through foundations, crowdfunding platforms and local investments. These networks operate at different scales and provide links between producers and consumers, and between rural and urban residents, on a regional or transnational scale. These value chains hold a prominent role in public debates on product properties taking place within an opinion-driven regime. Diverse demands draw public attention to farming practices and farmer groups. Non-profit ’interest groups’ that include citizens, consumers, residents and any group with demands in terms of health, biodiversity, the environment or the fight against climate change, operate in close connection with these new value chains. A second feature of the changes that have taken place in supply chains is disintermediation between producers and processors or distributors. Intermediaries have gradually disappeared as digital and logistics platforms have emerged. Farm structures within these food networks are diverse. They range from small farms with family labour to large, highly capitalized farms. Large farms are linked to international processing and mass retailing. Farming households promote organizational and technical innovations in food value chains, networking with other actors in the food chain via digital platforms that shorten traditional supply chains. Access to these platforms and their modes of regulation are now central to food governance in urban and rural areas. As a result of changes in supply chains and lifestyles, food diets are increasingly mixed, maintaining features of traditional local diets while including some features of global diets. Mobility between urban and rural areas brings with it cultural mixing and changes in diet between the two: certain rural food practices enter urban areas, while other practices related to modern value chains spread into rural areas.
Agricultural activities serve as a buffer in household strategies, depending on the context and access to urban or rural non-farming jobs (Haggblade et al., 2010). Agriculture is therefore a stable activity among a number of other, more transient, activities. Within farming structures, family labour adapts to on-farm and off-farm income opportunities, including seasonal labour. Younger workers leave for the city and then return, and older relatives work on the farm on a more permanent basis, while women operate either
225
13. Scenarios of Land Use and Food Security
as farm managers or search for employment in the city. Farming activities contribute to balancing the books of households. Household organization largely allows for a number of different activities, combining farming and non-farming in the food trading and processing sectors, in industry, in the building sector or in services. Each household member develops their activity depending on their location, the opportunities that arise and their ability to find their place in existing networks or to construct new ones. The organization of the activities of household members varies and adapts to the social and economic environment. The respective weight of agriculture within household income varies according to the ratio between farming income and income from activities in other sectors. This continuing diversity of activities is part of a household resilience strategy, with the aim being primarily to maintain overall income. These multi-activity systems contribute to ensuring household food and nutrition security, by diversifying income and guaranteeing direct access to foodstuffs.
More generally, the intensification of production systems in terms of increased output per hectare varies according to the availability of labour, the economic networks in which agriculture is embedded and the financial resources available. The organization of labour within the household has transformed cropping and livestock systems. Women and the elderly in particular take on a large part of the agricultural employment. Due to the mobility of active individuals, however, farming skills are not always reinforced. Labour-intensive systems are developing in places where labour supply is still plentiful and, when this is not the case, systems are intensified by increased use of technologies and the purchase of machinery and inputs. Within the household, monetary flows from non-farming activities to agriculture (e.g., remittances) have played an important role in intensification processes, as have investments or borrowing from the networks to which these farmers belong. Above all else, however, marketing and distribution networks determine the types of production and farming practices. The intensification of cropping and livestock systems varies from highly technical systems with low environmental impacts based on sustainable intensification agriculture through to agroecological systems making use of the labour and know-how of farmers. As a general rule, farming practices are negotiated with the interest groups concerned. For example, high value-added products such as fruit and vegetables or backyard livestock products are marketed in cities via ad hoc networks based on groups of urban consumers. Some food staples that are recognized for their quality (e.g., Thai rice) are marketed on a larger scale via hybrid networks combining local governments, private companies and consumer groups. Individual farmers now belong to specific networks of actors that determine the type of production and intensification, depending on the interests of those actors.
In general, multi-activity systems have contributed to ensuring food and nutrition security for rural and urban households by diversifying their income and guaranteeing direct access to foodstuffs. Pressure on land in this scenario is similar but lower than in the ’Regionalization’ scenario due to more active international markets that ease specific regional pressures on agricultural land.
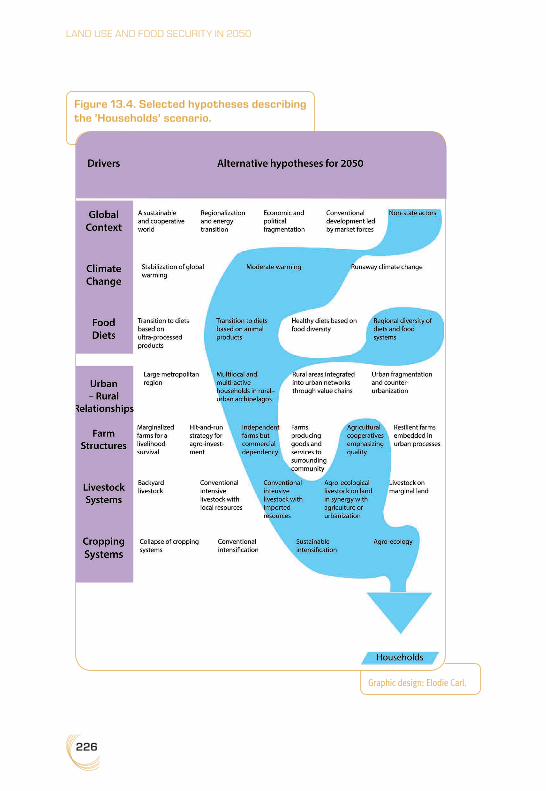
226
LAND USE AND FOOD SECURITY IN 2050
Figure 13.4. Selected hypotheses describing the ’Households’ scenario.
Graphic design: Elodie Carl.

227
13. Scenarios of Land Use and Food Security
❚❚ Land use in the Households scenarioAgronomic potential of land
Cultivated land areas are stable on account of the moderate level of urban growth (due to circular migration) and levelling out in demand for animal products. Private standards of land management emerging from public debate and socio-economic networks have limited over-exploitation of land by farming and soil degradation.
Distribution of land between different uses
The area of land cultivated for high value-added and certified products has increased since 2010. Due to intensification of livestock farming, there has been a limited increase in pastureland.
Access to land
In systems in which individuals are highly mobile, access to land has been secured, in particular for women in charge of farming structures. Household strategies aim for resilience in farming structures with the objective of maintaining productive capital for future generations of the family, notably thanks to the support of the multi-actor networks (consumers, foundations, local authorities and industry) that are involved in agriculture. Farming activity has therefore been adapted within households and has been maintained as a core activity.
Degree of intensity of land use
There has been considerable intensification of production systems (production per hectare), driven by significant innovations in such systems. These innovations have consisted either in making greater use of cutting-edge technologies (information technologies) or in turning to innovative techniques such as agroecological ones in response to public demand. The networks of public and private actors who organize marketing and sale of the products now define the goals of agricultural activities, giving priority either to cutting CO2 emissions, to reducing environmental impacts (agroecology), to improving nutrition or to addressing social issues such as rural poverty or inequalities in access to food. Due to the high public profile of farmers and farming, agricultural practices and forms of intensification are constantly being challenged and redefined in interaction with interest groups. Therefore, most farmers have evolved towards sustainable intensification agriculture or agroecology. Large farms enjoying access to capital thanks to their ties with multinational firms have turned to sustainable intensification by using new technologies and practices (significant mechanization and use of external inputs).
As far as small farms are concerned, monetary flows (from non-agricultural activities to agriculture) have favoured the intensification process. These flows are made up of remittances (non-farming income sent by household members), financing from foundations or NGOs or private investments of urban origin. In addition to this, the reversible mobility of household members has limited the breaking up of farms, by reducing growth in the farming population, in particular in those regions which were previously at risk of
228
LAND USE AND FOOD SECURITY IN 2050
experiencing a sharp increase in their rural population (such as sub-Saharan Africa, North Africa, Central Asia and Oceania).
Services provided by the land
Regarding social services, agriculture now contributes to the resilience of rural households and provides a fixed basic income as part of the overall revenue of farming households. In certain regions where interest groups are active, agriculture plays a role in the production of environmental services (water quality, biodiversity etc.).
❚❚ Food and nutrition security in the Households scenario
Food availability has remained stable since 2010, as small and medium-sized structures have maintained or intensified their production per hectare, alongside the growth of a highly capitalized agricultural sector.
Access to food has been buoyed by growth in the overall (farming and non-farming) incomes of households with an agricultural activity and by increased individual mobility.
Agricultural output contributes to the food and nutrition security of the extended household, either via local consumption (e.g., milpa in Latin America) or via formal and informal food trading networks between the village and people living in the city but who were born in the village.
There can be risks of instability in food supply availability when conflicts arise between interest groups, causing a sudden shift in stakeholder networks and alliances.
❚❚ How did we get here?
In an ultra-globalized hybrid world, non-State players dominate in social, economic and geopolitical change processes. International NGOs, local non-profit organizations, multinational firms, academic institutions, foundations and local authorities such as members of city governments, have formed ad hoc networks that are driving forces in devising responses to local and global challenges. These network groups have gradually superseded the power of national governments. These trends have emerged after the failure, in the 2020s and 2030s, of sovereign States to take up the challenges of climate change and poverty, while non-State actors were multiplying their initiatives. The weight of NGOs has therefore increased, in particular in public opinion, as a counterweight to the power of transnational corporations. World development has become an uneven patchwork in which membership of an individual or a collective to networks, or their ability to mobilize their forces to create new networks, determines success and the level of their wealth.
Rather than uniting around a national government, the public has tended to join groups of actors that share common interests, thereby creating powerful currents of opinion. Consensus within public opinion regarding the main challenges, fed by the affirmation and growth of the middle classes, has provided the foundation on which the power of

229
13. Scenarios of Land Use and Food Security
these non-State interest groups is based. Urbanization and the spread of information technologies have facilitated the development of these multiple, labile coalitions that are independent of national governments.
The issues they have addressed range from reducing poverty to the environment, climate change and the fight against corruption. Agricultural activity has been adapted to the interactions and negotiations between the various groups concerned by the services provided by farming activities, such as biodiversity, drinking water quality, landscape, health, climate change and even local identity linked to food products. The role of charities and philanthropic foundations has been gradually overtaking that of international aid. Solutions have been found to specific global problems through the coalitions of networks of international actors.
National governments did not disappear entirely. They have tended to perceive their role as being organizers and coordinators of ’hybrid’ coalitions of State and non-State actors that evolve according to the challenge concerned. Authoritarian governments struggle to maintain a foothold in this new context. In contrast, smaller, more ’agile’, decentralized governments allowing and facilitating the development of dynamic coalitions have been playing a central role in this system of governance by network and interest group. Emerging countries have benefited from these changes, in the absence of existing and established networks, by relying massively on new technologies. Sovereign governments are finding it difficult to develop public policies in this new context in which the importance of the State is declining. Transnational interest groups that no longer rely on just a single State now have the ability to bypass national governments seeking to regulate their activities. They challenge traditional jurisdictions and regulations. The power of these networks and ad hoc coalitions has raised security issues and generated geopolitical uncertainty, although such changes also bring greater global wealth.
Decentralized energy systems have been created, bringing together residents, renewable energy producers and various energy consumers (industry, services etc.) via smart networks. Faced with the erosion of national power, diseconomies of scale linked to new technologies, an increase in the cost of capital and of energy, and the decentralization of energy sources have given small and medium-scale farming with family labour a competitive edge.
Land use for food quality and healthy nutrition
Figure 13.5 indicates the combination of hypotheses per driver constituting the scenario ’Land use for food quality and healthy nutrition’. Furthermore, the following keywords summarize this scenario: healthy diet, malnutrition, GHG, integrated public policy on nutrition, food diversification, meat and ultra-processed food consumption, cropping system diversification, crop–livestock integration, soil organic carbon sequestration.
230
LAND USE AND FOOD SECURITY IN 2050
❚❚ Main drivers of the Healthy scenario
In the 2020s, healthcare systems were saddled with the considerable costs associated with diet-related non-communicable diseases – type II diabetes, cardiovascular diseases, cancers - and obesity. More generally, as the consequences of malnutrition - under- and overnutrition, nutrient deficiencies – on public heath were increasingly felt, most States were compelled to implement a raft of policy measures aimed at shifting consumption patterns towards healthier diets, limiting the consumption of unhealthy foods. These food and nutrition policies were designed to improve diet quality by targeting all the actors of the supply chain from agriculture and storage to food processing and retail. These policies were aligned with international measures to fight climate change. They focus on energy, transport, construction, food systems and carbon storage. In this context, synergies across multiple scales - national, regional and international - on food, nutrition, agriculture and climate policies were sought to generate widespread positive impacts on both diets and climate at the global scale. Global soil improvement policies led to the rehabilitation of degraded land for agricultural use and to sequestration of organic carbon in soils. National States and urban authorities shaped more inclusive development processes linking rural to metropolitan areas, improving transportation and communication infrastructures, implementing land planning and favouring efficient food value chains.
Strong food and agriculture policies and consumer mobilization against unhealthy foods (energy-dense, rich in vegetable oil, sugar and salt) triggered major changes in the food system. On the one hand, food policies were implemented to limit the development of highly processed foods and soft drinks by taxes and, on the other, to improve access to healthy foods (Hawkes et al., 2013). Fresh fruit and vegetables and certified agroecological products were subsidized during a transition period through a reallocation of State farm subsidies. A diversity of distribution channels, such as open-air markets that make fresh products more accessible, were supported in developing countries. Agri-food companies, aware of their role in mal- and overnutrition, committed to improving the nutritional quality of their food products and to reducing the impact of their industry on climate. Innovation in the agri-food companies shifted, as accountability policies (Swinburn et al., 2015) now require industrial processes to prove their positive nutritional and environmental impact. These changes affected innovation, with the goal of preserving dietary fibre and micronutrients and diversifying food products (Fardet and Rock, 2014). The development of minimal processing of pulses and coarse grains contributed to this goal. Today, agri-food companies, farmers and major retailers are fully involved in the production, processing and retailing of healthy products that meet nutrition standards and that are certified, and have a low impact on climate change. A wide range of food value chains are organized through close links between rural and urban areas, based on efficient transportation infrastructure and diverse supply chains. Organized in cooperatives, farmers are part of healthy food chains, producing quality foods based on standards and contracts with agri-food industries, or selling high-value fresh products to urbanites. They supply certified products to food processors, or directly to retailers and consumers, across a variety of both short and long

231
13. Scenarios of Land Use and Food Security
distribution chains. Retrospectively, diversification of food products has helped to improve nutrition at farm, rural and urban levels and allowed better adaptation of crops to local resources. Better organized food systems have also reduced food losses and waste, in particular by improving food storage and preservation capacities in developing countries.
Compared to 2010, diets in 2050 are on average higher in fruit and vegetables, coarse grains and pulses, and lower in meat, major cereals, vegetable oils, sugars and sweeteners, and salt, all of which were major components of ultra-processed foods. As a response to the continued incidence of undernutrition in some developing countries, the consumption of animal products in diets was enhanced through better access and sanitary security. The development of a diverse range of distribution networks such as outdoor markets, small retailers and large supermarkets greatly improved access to fresh food in urban and rural areas.
To meet the challenges posed by malnutrition and diet-related diseases, both crops and cropping systems diversified by incorporating agroecological techniques and re-associating livestock systems with crop production in order to improve mineral cycles. To diversify cropping systems, crop associations, mosaic crop planting to limit pest development and agroforestry have been developed. Trees, including fruit trees, provide shaded areas and habitat for pollinators in annual crop fields and pastures. Farming systems have improved both soil quality and the storage of organic carbon (Bindraban et al., 2012) through a range of measures, including reduced soil tillage, permanent soil cover with cover crops or mulch and more diversified, longer crop rotations. These changes improved soil structure, water availability for plants and the retention and effectiveness of soil nutrients. Intensified soil microbial activity, in turn, restores soil quality in degraded areas and increases soil fertility. Depending on the availability of capital and the situation in the agricultural labour force, cropping systems have evolved towards sustainable intensification or agroecology. The number of market gardens and fruit orchards is on the rise, and organic household waste is put to use in local, small-scale livestock farms. Livestock systems focus their efforts on limiting nitrogen cycle losses by improving the management of animal manure, and to avoid overgrazing by improving the management of pastures through the introduction of a diversity of grass and legume species. These changes contributed to both limiting agricultural greenhouse gas (GHG) emissions and increasing carbon storage in soil, raising per-hectare yields in instances where the yield potential was previously far from being reached.
Worldwide shifts in land use reflect this crop diversification, limiting globally the spatial expansion of agriculture. Most regions have seen a decrease or a stabilisation in their arable land area. But three regions, where in the past consumption levels of animal products were inadequate, have experienced an expansion of agricultural land. There has been an increase in arable land in West Africa and India, and a major increase in the pastureland area of East, Central and South Africa (ECS Africa).
Overall, as a result of the mixed cross-sectoral policies reshaping food markets and agriculture, global diet is much healthier than 40 years ago. The increase in unhealthy food consumption of the 2010s has been halted, and undernutrition has decreased due

232
LAND USE AND FOOD SECURITY IN 2050
Figure 13.5. Selected hypotheses describing the ’Healthy’ scenario.
Graphic design: Elodie Carl.
233
13. Scenarios of Land Use and Food Security
to food diversification and the better resilience of farms. The international trade of foods satisfying nutritional quality standards has remained significant and has strengthened in importing regions such as the Near and Middle East and North Africa, sub-Saharan Africa and the Rest of Asia, with products coming from exporting regions such as the Former Soviet Union, North America and China.
❚❚ Land use in the Healthy scenario
Agronomic potential of land
Owing to the range of measures adopted, global temperature change by 2050 was kept well below the +1°C threshold and changes in rainfall patterns were limited. Consequently, climate change did not have a substantial effect on the agricultural suitability of land at a global level.
At the same time, measures implemented by many countries to restore soil fertility and to increase organic matter in soils served to curtail soil degradation. Since 2010, farmland yield potential has increased while the yield potential for degraded land has been restored. Consequently, cropland area has remained constant and the agricultural output potential of soils rose. The increase in organic carbon storage in soils has also led to higher yield potentials since 2010, with impacts varying by region.
Distribution of land between different uses
In 2050, the share of land used for animal feed crops and pastures per capita shrunk, while the share of land devoted to crop production for direct consumption per capita increased. Crops on arable land are much more diversified than in 2010 and oriented towards direct human consumption, including more areas devoted to fruit and vegetable, pulse and coarse grain production.
Since 2010, a decrease or stability in arable land and pastureland has been seen in Brazil/Argentina, Rest of America, Canada/USA, EU 27, Oceania, Former Soviet Union (FSU) and China, with a total decrease of agricultural land in these regions of more than 500 Mha. Only two regions, West Africa and India, have seen an increase in their cropland. The global increase in pastureland has mainly been located in ECS Africa and West Africa, which have experienced a total increase of more than 500 Mha since 2010. The reason for this situation is linked to the change towards healthy diets between 2010 and 2050, which has involved a rise in the share of animal products and pulses in diets, in order to reach food and nutrition security in these two regions, and also in India.
Government land-use planning policies have limited the loss of farmland to urbanization. Since 2010, marginal land and heavily degraded land unsuited to agriculture has been reforested. Since 2010, some regions such as Canada/USA, FSU and China have expanded their forest area using the part available of their agricultural land. But ECS Africa has to struggle with deforestation in order to limit the extent of land use change towards pastureland and to reduce the impacts of deforestation on GHG emissions and biodiversity,
234
LAND USE AND FOOD SECURITY IN 2050
for example by developing agroforestry. Forests now represent an important source of biomass for energy production, accounting for one-third to half of the global biomass energy if we include forest plantations and coppice systems.
Access to land
The reorganization of food systems to favour nutritional quality led consumers to change their perception of agriculture, and it increased in esteem. Farmers are guaranteed access to land in rural and peri-urban areas as part of long-term investment strategies in favour of improving soil potential and carbon storage. While there are no measures to oppose large-scale production, there is support given to a large number and wide range of farms and farming organizations. Support is provided through a variety of land tenure systems that formalize customary land ownership and use via the creation of specialized institutions or the allocation of land titles. Whereas land-use and access issues were major sources of instability until 2020, regions that made the reconfiguration of food systems a priority were able to safeguard access to land. In 2050, land use planning policies promoted by local and urban authorities protect agricultural land from urbanization, particularly in peri-urban areas. Privileged access to land is granted to farmers in support of nutrition and food security, and carbon storage.
Degree of intensity of land use
Whereas production systems in the past were focused on specialized areas, systems now are based on planting different crops in succession, creating spatial diversity. Cropping systems now include more varied, longer crop rotations that incorporate diverse grain crops, protein crops and vegetable crops.
In 2050, the improvement in soil fertility has been based on various techniques including increasing organic carbon storage in the soil, reduced soil tillage, cover crops and more varied, longer crop rotation cycles. These soil-quality remediation measures may impose limits on the export of residues for energy generation or other uses depending on the type of soil, its initial soil carbon content, the local climate and soil management practices (Warren Raffa et al., 2015).
Agroforestry systems have also become more prominent, allowing for a wider distribution of crops across landscapes by incorporating both perennial and annual crops and combining energy and food crops within a single system.
In 2050, the re-association of crops and livestock has created agricultural systems that rely less on agro-industrial inputs and that are better at managing the nitrogen and phosphorus cycles. This reduces dependence on mineral resources and the need to buy mineral fertilizers. Instead, agroecological practices are used to increase per-hectare productivity (agroforestry and crop associations) and increase the diversity of products per hectare.
235
13. Scenarios of Land Use and Food Security
Services provided by the land
Stabilizing anthropogenic GHG emissions required massive efforts to sequester carbon in plants and in the soil as well in order to reduce actual emission levels. In agriculture, this happened through the use of mixed systems that were able to improve the range of services provided by soils by addressing the issues of food production, carbon storage and control of GHG emissions: storing carbon in the soil through the use of appropriate agricultural practices, as well as planting forests on marginal land; cutting GHG emissions by curtailing the use of mineral nitrogen fertilizers (less nitrous oxide associated with mineral fertilizers; less fossil fuel used for fertilizer production; substituting mineral fertilizers for organic ones).
❚❚ Food and nutrition security in the Healthy scenario
In the context of 2020, given the increasing costs of treating the health impacts of overnutrition and malnutrition, public health measures have been implemented at both the global and national levels to reorient consumption towards healthier and more diversified diets, and to address the persistent issue of malnutrition. On a global scale, measures have been taken to limit the trade and consumption of unhealthy foods such as soft drinks and ultra-processed products which are energy-dense but of low nutritional value. These food products were identified as the vector for the excessive consumption of calories, vegetable oil, meat, sugar and salt, and the reduced intake of nutrients and dietary fibre that were more prevalent in moderately processed or fresh foods. Led by emerging countries such as Brazil and Mexico, most governments have come together to regulate the nutritional quality of products in the food market. Trade regulations on non-healthy products introduced a regulation on food additives and a quality nutrition standard in the Codex Alimentarius and in the World Health Organization, as well as some conditional investment based on nutritional quality in the World Trade Organization. These policies have included the taxation of unhealthy foods, such as highly processed products and soft drinks, and the prohibition of advertising and marketing for unhealthy products.
In terms of food availability, since 2010, daily calorie intake decreases slightly in developed and emerging countries, in order to reduce overnutrition, and increases moderately in developing countries in order to address nutrient deficiencies and undernutrition.
Access to healthy foods has been reinforced by changing the food environment, improving physical and economic access to fresh produce. Measures implemented at the national level include health education and the reconfiguration of food systems to target key players and products: subsidized prices for fresh fruit and vegetables, and legumes; reduction of losses and waste related to collection and storage; investment in open-air market infrastructure for improving food access for low-income households; innovation in the food industry to support the use of whole grains, pulses and coarse grains; support for food procurement programmes, with the inclusion of fresh produce and local sourcing.
Dietary patterns have changed towards healthier diets with various trajectories according to the type of country. In developed and emerging countries, consumption of animal

236
LAND USE AND FOOD SECURITY IN 2050
products hits a plateau, then decreases slightly, reducing mostly the consumption of ruminant meat, which had had a negative impact on both climate and health. In developed, emerging and developing countries, since 2010, diets have become more balanced and diversified through the consumption of more fruit and vegetables, legumes and coarse grains, and a moderate intake of animal products (milk, eggs and meat). As a consequence, diet-related non-communicable diseases have decreased significantly since 2020.
Improving accessibility to a diversity of foods also addressed the challenges of undernutrition, particularly those associated with child stunting. For rural households, the diversification in cropping systems has increased food security at farm-household level.
❚❚ How did we get here?
Discussions during the 2015 United Nations Climate Change Conference (COP 21) on the financing of climate, energy, environmental and agricultural policies were an important step. The commitment to ambitious objectives with regards to change in worldwide temperatures sent a clear signal to business and industry, which then began to prepare for a shift to the green economy. In the 2020s, the increasing social cost of diet-related non-communicable diseases, obesity, nutrient deficiencies and undernutrition and pollution, and their impact on labour and productivity, led most governments to implement new, stringent food and environmental policy measures affecting agriculture, the agri-food industry and food retailers. Faced with these mounting needs, an ever-increasing set of stakeholders and policymakers publicly decried the decline of healthcare services and the rationale driving a medical system based solely on prescriptive cures rather than proactive approaches, and the privatization or liberalization of healthcare systems on State-funded life support. Healthcare system reform began in a number of large emerging countries, such as Brazil and Mexico, and then spread widely. The aim was to move the focus onto the prevention of diet-related diseases and obesity. In the 2020s, an international coalition and many governments introduced food policy measures to shift consumption patterns towards healthy eating habits and to limit unhealthy food consumption by generalizing taxes on ultra-processed products. The move began in the emerging countries most heavily affected by the increase in diet-related non-communicable diseases, then later spread to developed and developing countries.
Over the subsequent decades, energy, climate, logistics and food policies converged. These now support the reduction of GHG emissions, prioritize the use of biomass for food production, place limits on transport, improve carbon sequestration, advocate for consumer restraint and are more people-centred. The fight against poverty is now multifaceted; it includes efforts to redistribute capital and reduce inequality, to reduce energy insecurity through energy transition and to find new production methods that make farm-households and food systems more resilient.
Agri-food companies followed the example set by other industries that had to adapt following the introduction of limits on their GHG emissions. Also committed to improving the nutritional quality of their food products, agri-food companies spent a portion of

237
13. Scenarios of Land Use and Food Security
their profits on increased research, the results of which came to fruition some 10 years later. The diversification of food products better met consumer needs and allowed for the better adaptation of crops to local resources. Agri-food companies also reduced losses and waste, and improved consumer and environmental health.
Cooperation among States, businesses, civil society organisations and international institutions – carried out in a period of reducing inequality and moderate economic growth (in 2050, per capita GDP is $20,000) – was vital to this transformation of our economic and social models. Land reform was carried out by a number of States to provide vulnerable populations with access to land and to limit internal or international migration. Social and environmental regulations were set to control production. Gradually, land and water became collective property, managed through intergovernmental and national framework agreements. A climate of collaboration precipitated the development of technological, social and organisational innovations. From the start of the 2030s, developing countries were able to benefit from this new order. Businesses and cooperatives grew by using their local, natural and human resources to meet the needs of local markets. With the help of technology transfer, technical assistance and financial resources, developing countries were able to establish efficient energy production systems that generate little pollution and operate on small scales.
These changes naturally led to decreases in energy consumption and a shift in its sources, with less reliance on fossil fuels. In 2050, worldwide energy consumption is 696 EJ.53 Of that figure, 102 EJ is produced from biomass: 30 EJ from residues and waste, 30 EJ from dedicated biofuel plantations (Miscanthus and Eucalypts), 30 EJ from managed forests (residues, clearings etc.) and 12 EJ from microalgae. Crop residues are comprehensively managed, but do not usually contribute to biofuel as it is first used for soil regeneration. Third-generation biofuels (microalgae) came to prominence in 2035 as their per-hectare yield is higher than yields from land biomass. The use of fossil fuels, coal in particular, is sharply reduced through the promotion of low carbon technologies and efforts in greater moderation. Information and communication technologies including smart grids allow networks to maximise energy distribution. Carbon taxes or cap-and-trade systems are now widespread in liberal economies. Restrictive limits on CO2 emissions were put in place in countries whose economies are largely planned. Carbon has become the cornerstone of the energy market: implementation of policies to reduce GHG emissions associated with tropical deforestation and forest degradation; reforestation policies; nationally appropriate mitigation actions.
Land as commons for rural communities in a fragmented world
Figure 13.6 indicates the combination of hypotheses per driver constituting the scenario ’Land as commons for rural communities in a fragmented world’. Furthermore,
53. These energy hypotheses come from the Symphony scenario of the WEC (2013).
238
LAND USE AND FOOD SECURITY IN 2050
the following keywords summarize this scenario: world fragmentation, international crisis, international trade, communities, collective organization, commons, agroecology, collapse.
❚❚ Main drivers of the Communities scenario
Since 2010, simultaneous financial, energy, ecological and geopolitical crises have shaped a world situation that is fragmented not only politically, but also economically. States have reduced public expenditure to basic functions. Unemployment increased thereby impeding metropolitan growth, triggering a process of de-concentration of the urban population. Populations in large cities are no longer growing, unlike in secondary, medium-sized and small cities (Satterthwaite et al., 2010). The slowdown in migration from rural areas to large cities is a consequence of growing unemployment, pollution, congestion and poor access to housing and basic services (Potts, 2013). In some regions such as sub-Saharan Africa and Oceania where birth rates remain high, reduced rural migration towards large cities engendered an increase in rural populations. Food supply to cities is provided partly by the informal sector, via community or family networks linking urban to rural communities, and partly by the formal sector that provides staple products such as wheat, rice, corn, roots and tubers. Peri-urban agriculture provides incomes and food for poorer urban households, especially women active in markets. Faced with the absence of economic development in urban areas, two strategies prevailed in agriculture. In some places, (i) local communities have supported a transition to agroecological farms, while, in other places, (ii) small-scale conventional farming and subsistence farming has developed leading to an unsustainable situation.
(i) To cope with the multiple crises, farmers organized themselves within their community to develop agroecological farms. Cooperation and collective management served to co-construct and manage common land and ecosystems to provide the sustainable production of foodstuffs, energy and environmental services. Farmers have engaged at community level in collective actions designed to reinforce ecosystems and to build agroecological systems. These collectives have structured their territoire made up of small towns and rural areas to construct food systems based on the management of commons and on the recycling of material flows between these spaces. Each local community organizes its rules and standards for the use of resources (soils, water and biodiversity) through territoire forums which brings together local actors. Exchanges of labour, products and skills, as well as the recycling of organic waste, have been developed at a territoire scale. Collective organization provides a means of coordinating landscape-level management to preserve water resources, link livestock and crops, and strengthen ecological infrastructures such as hedgerows and woods. Farming structures are now based on powerful collective regulations depending on contracts and both formal and informal arrangements. Agroecological agriculture is regarded as both an agricultural system based on biological self-regulation and diversification of production, and a central element of the food system and of social organization. It ensures the food sovereignty of rural and urban communities. Synergies between livestock and cropping systems improve soil fertility management and ensure self-sufficiency in animal feed.
239
13. Scenarios of Land Use and Food Security
(ii) Where farmers failed to organize themselves, urgent demands pushed them towards an intensification of agriculture based on conventional techniques, associated with an inability to take long-term effects into account. The process of conventional intensification in cropping systems encountered two types of pitfalls, depending on the region and access to inputs: over-exploitation of the soil and over-intensification of small-scale farming generating strong adverse impacts on the environment. Subsistence farming has developed due to a decline in farm size driven by a growing rural population and to the lack of urban economic development. Farmers turned to more intense conventional cropping methods on small areas. In regions where access to inputs has become difficult due to their high prices, intensification has led to the overexploitation of soils, generating soil degradation by rapid exportation of nitrogen and other nutrients and by reducing soil organic matter. In regions (e.g., China and India) where access to inputs is facilitated by their low costs, over-intensification of small-scale farming generates significant environmental problems, including water pollution and erosion. These processes generated stagnation in cropping yields and in some situations led to a collapse. Cropping systems often come to a technical and environmental dead-end caused by declining fertility, soil erosion and drought. Unpredictable yields and costly inputs reduce the economic viability of small farms. As a result, certain areas with small farmers face recurrent food insecurity.
By 2050, changes in land use are highly diversified from one region to another, according to the different challenges they face (energy, climate, soils and water) and the collective ability of farmers to bring about a transition to agroecology in their community. These changes increase pressure on agricultural land, especially in regions where the collapse pathway prevailed. Assuming that all regions embark on the agroecology transition pathway, there is an expansion of cropland area in Canada/USA, India and West Africa while pastureland remains globally stable or decreases, except in ECS Africa where it increases. The levels of trade dependency in the regions have been maintained.
The consequences for food and nutrition security vary between regions. But undernutrition remains significant, especially in regions with low calorie availability such as India and ECS Africa. Through self-governing institutions and local food systems, local communities ensure a certain level of food and nutrition security and limit the expansion of agricultural land in an extremely negative global context by turning to agroecological practices. Conversely, due to the vulnerability of technical systems and the lack of a resource management strategy, regions with subsistence farming face repeated instances of food insecurity and contribute to deforestation.
❚❚ Land use in the Communities scenario
Agronomic potential of land
Since 2010, moderate climate change (+1°C by 2050) has had effects (median impact) on agriculture, in particular in tropical areas and the Northern hemisphere. The land areas potentially available for agricultural production have increased worldwide mainly on non-competitive land and in a highly unequal manner, by about 60 Mha for moderately
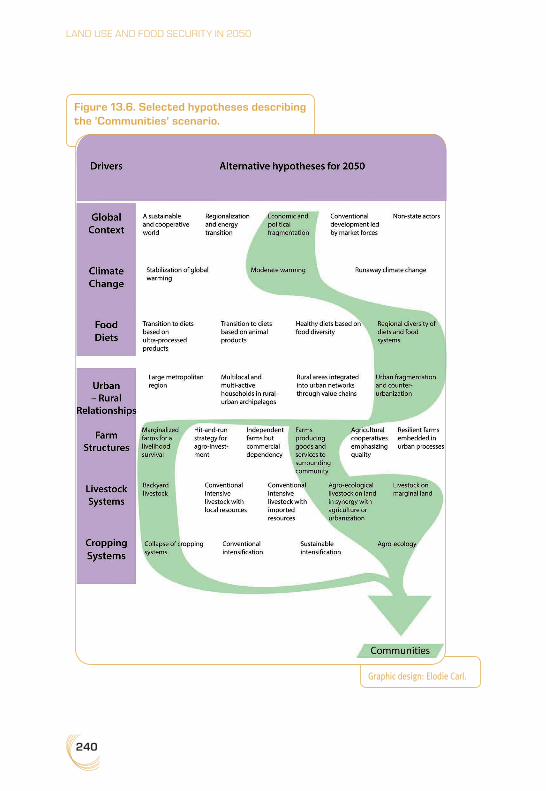
240
LAND USE AND FOOD SECURITY IN 2050
Figure 13.6. Selected hypotheses describing the ’Communities’ scenario.
Graphic design: Elodie Carl.

241
13. Scenarios of Land Use and Food Security
suitable to very suitable lands. Arable land areas have increased in higher latitudes, but have decreased in the tropics, reinforcing interdependency between world regions.
The various cropping systems have had widely varying impacts on the agronomic potential of the soils, causing accelerated soil degradation in certain regions driven by conventional intensification or overexploitation of the soil, and improvements in soil quality in others due to agroecological techniques.
Distribution of land between different uses
Between 2010 and 2050, production has been diversified in order to meet the demand for food supply for rural and urban populations. Agricultural activities have been relocated to supply food to nearby communities. As trade in plant products for animal feed has sharply decreased, livestock systems have been redefined in line with the locally available plant resources. Additionally, mixed cropping and livestock systems have been developed.
In areas where the management of commons was adopted, spatial planning is conducted at the landscape level. Preference is given to closely interwoven land uses to produce a diversity of products and services. Such planning is driven by the action of territoire forums and has shaped mosaic landscapes, while boosting the ecological infrastructure in the territory.
Since 2010, with the generalization of agroecology, the cropland area has increased at world level while the pastureland area has decreased. Major cropland increases have arisen in India, West Africa, Canada/USA and EU 27, while major pastureland decreases have occurred in Rest of America, Canada/USA, FSU, China and Rest of Asia. ECS is the only region where pastureland has increased. International trade has remained stable between importing and exporting regions since 2010, except for the Near and Middle East and North Africa, which have experienced a doubling of their import dependence.
Use of forest biomass for energy in the form of heat, electricity and biofuels, and materials, as well as the use of crop residues, has increased significantly in certain regions. By 2050, 150 EJ are produced from biomass, although only in countries that are without fossil fuel resources and are unable to develop solar or wind energy: 60 EJ from residues, 70 EJ from more effective exploitation of forests and 20 EJ from dedicated energy crops such as Miscanthus and Eucalyptus.
Generally, with the implementation of agroecology, agricultural expansion and deforestation have been limited. Some regions have reforested, like China, Former Soviet Union and Rest of America. But forest areas have experienced a slight decrease in most regions. Seen retrospectively from 2010, this could have been a very different picture if the transition to agroecology had not occurred; without an agroecological transition, the reduction of average agricultural yields could have induced a dramatic deforestation in all regions.
Access to land
Land access conditions vary greatly from one region to another, depending on whether they are governed by formal rules or by informal rules backed by community institutions. Land management is therefore either collective or private, and is rarely public.
242
LAND USE AND FOOD SECURITY IN 2050
In general, the idea of goods that are non-appropriable has been established, enabling access to land and natural resources to be renegotiated. While ownership continues to exist, collective rules restrict its scope. Ownership is thereby regulated with a view to covering the widest possible range of services. Recycling and reuse are encouraged. Access to land is governed in certain regions by an economy of functionality.
In regions where land availability is low and farming populations are increasing, farmers are in competition with each other for access to land. In a context in which it is difficult to find jobs outside agriculture, the question of access to land generates conflicts between different groups seeking control of land. These conflicts are amplified by soil degradation processes linked to intensification and overexploitation of the soil. In these areas, there is great instability surrounding land usage rights.
Degree of intensity of land use
Climate change worldwide has reduced potential wheat yields by –6%, maize by –7%, rice by –8%, soyabean by –15% and groundnuts by –10% (world average, excluding yield impacts of changes in cropping systems occurring over the period). These potential yield losses are greater in tropical regions than in the Northern hemisphere. The greater frequency of extreme weather events has increased annual variability in yields.
Between 2010 and 2050, land use intensity has varied greatly between regions, depending on their ability to implement effective collective action. Difficult access to mineral fertilizers and high input prices drove a territorial transition towards systems that were less reliant on the world market and based on ecosystem regulation.
The introduction of agroecology systems in local territories through collective organization has reduced the impact of extreme weather events in some regions in terms of damage to crops and yield variability. These systems make use of the biological regulation processes inherent to the ecosystem, seeking to close the nitrogen and phosphorus cycles, increasing the amount of agricultural labour and using appropriate mechanization. These changes have required the development of ecosystem-specific collective knowledge and local know-how, using, capitalizing on and furthering existing knowledge. In this way, cropping systems have limited their reliance on energy and other industrial inputs such as fertilizer, pesticides and seed. They have become autonomous and boosted their economic and ecological resilience. Perennial fruit trees and legumes have reached yields nearly equivalent to those of conventional agriculture, while cereals, vegetables and, to a lesser extent, oil crops have suffered significant yield reductions. However, they have tended to improve over the medium to long term thanks to improved soil fertility and farmers’ knowledge. Agroforestry, which simultaneously provides energy, building materials and foodstuffs has grown significantly and is often linked to livestock husbandry. Livestock systems now are associated with cropping systems, not only to enhance soil fertility via improved cycling of products and local waste, but also to ensure self-sufficiency in animal feed. Agroecological livestock farming is based on producing robust breeds and boosting their capacity to adapt, while reducing antibiotic and drug consumption. It has
243
13. Scenarios of Land Use and Food Security
ensured food and protein self-sufficiency and has been more resilient in a context of extreme climatic events.
However, on account of the absence of collective organizations, some of the world’s regions are subject to over-intensification in farming practices, resulting in the overexploitation of resources. This type of intensification generates soil degradation and, over the long term, a decrease in yields. Some of these systems have also collapsed due to drought or erosion.
Services provided by the land
Collective land management has made it possible to increase the services land provides. The focus has been placed on the multifunctional nature of the territory, with land contributing to the supply of residues and wood and agricultural biomass for energy, animal feed and materials, and foodstuffs. This multi-functionality is based on a reinforcement of the biodiversity in the territory. The regulating and cultural services of the ecosystem, which are of benefit to the whole of the community, have been enhanced (e.g., regulating water and protection against flooding). In certain regions, farmers receive payments for the non-production services they provide. These changes are linked to the rise of a functional economy where payments are made for the provision of services (rather than for the acquisition of goods).
When there is no collective management, intensive or over-exploitative agriculture has reduced the services provided by the ecosystem: soil degradation, reduced biodiversity, pollution and water shortages. Forests have also suffered from the intensive use of wood for energy.
Agriculture and agricultural employment have been central factors in rural development.
❚❚ Food and nutrition security in the Communities scenario
Between 2010 and 2050, the food resources available worldwide have fallen, in particular in those regions with land shortages.
Access to food is also very unevenly distributed. In urban areas, the weak rise in income and the decline in low-priced imported products have made access to food products more difficult. In some rural areas, population growth and decline in agricultural output per active person have made access to land more difficult. However, the food distribution networks that have emerged within informal family or support networks do facilitate access to food for some social groups. In areas where community organization does exist, the general increases in agricultural employment and in farming-related services have boosted farmer incomes and access to food. Backyard livestock systems have played an essential role in the food security of households, especially among low-income households.
The effects of this scenario on food diet quality are mixed. On the one hand, low incomes in urban areas have cut consumption of animal products and therefore have decreased the diversity of diets. On the other, the diversification of production in agroecology systems has driven an increase in the diversity of foods available for rural communities.
244
LAND USE AND FOOD SECURITY IN 2050
However, in those areas with conventional agriculture, nutritional quality is in decline, as production has tended to prioritize staple products.
Access to food is generally unstable. Food production is sensitive to weather events affecting agriculture, and all the more so as in this context external markets can only offset any such problems to a small extent.
❚❚ How did we get here?
In 2050, multiple economic, energy, geopolitical and ecological crises occurring at the same time and sometimes amplifying each other have led to the fragmentation of the political and economic situation around the world. The situation has become chaotic in the wake of monetary and financial crises, the difficulties of States in coping with their debt, unemployment and social instability, and the inability of international and regional institutions to roll out coherent policies to help governments out of their political and economic difficulties. This crisis situation has triggered severe geostrategic tensions, hitting international fossil energy markets particularly hard (volatile prices) and reducing access to energy in some regions. The economic crisis has slowed urbanization processes, especially in the largest metropolises where growth can no longer fully absorb migration from rural areas. The rural population has therefore grown, in particular in sub-Saharan Africa and Asia.
In and around the 2020s, Europe was hit by crisis in the form of sovereign debt and the departure of a number of countries from the eurozone. In North America, meanwhile, the shale gas industry failed to generate the expected economic growth, while crises in other regions around the world had serious repercussions for companies and government budgets. Crises in developed countries, meanwhile, triggered more crises in emerging nations, and the absence of external economic drivers slowed down Indian and Chinese growth durably, especially as widening inequalities in both countries prevented the emergence of stronger domestic markets. These difficulties were also compounded by the impacts of extreme climate events, such as flooding of densely populated urban areas, wildfires, drought and pollution, leading to food shortage and increased poverty in both rural and urban areas. Economic difficulties were also aggravated by political instability, leading to internal conflicts in some countries.
From the 2020s onwards, these crises caused companies to turn their focus on privatizing their resources or even seizing resources in other countries, particularly when States did not have the will and the legal means to prevent them from doing so. Many other companies have gone bankrupt, triggering unemployment and economic and social hardships. Trade is limited to those countries that are immediate neighbours, or to countries with which bilateral agreements have been signed. In many countries, the poor situation of public finances has resulted in budget cuts in education, healthcare and research, without that shortfall being filled by private funds. In 2050, per capita GDP stands at $18,000, but with larger differences between countries than in any of the other scenarios and a highly developed informal economy.

245
13. Scenarios of Land Use and Food Security
Social and economic upheaval and environmental degradation have reached such levels that in the 2030s to 2040s, local communities of farmers and users of spaces gradually started to organize themselves to share and manage resource use. These communities had come to consider social organization, collaboration and sharing as an effective strategy. Teaching has developed in an informal yet efficient way, through the exchange and sharing of experience, and healthcare is set to follow a similar trend. Groups of researchers and other interested stakeholders are organizing themselves to set up joint research and innovation projects supported by crowdfunding platforms and run by volunteer activists.
Due to the successive crises and the difficulties of access to energy, some regions where fossil fuel resources are scarce have been forced into energy transition, on the one hand making use of those fossil fuel resources that are available in their regions and, on the other, using renewable energies. 150 EJ are produced by biomass: 60 EJ from residues, 20 EJ from plants dedicated to bioenergy production (Miscanthus and Eucalyptus) and 70 EJ from managed forests (residues, thinning operations etc.). In those regions where energy has become costly, sparing use of energy has become an obligation for industry, transport and housing, although the scale of this forced reduction in energy consumption is not sufficient to halt the increase in CO2 emissions.
Conclusion
Agrimonde-Terra’s exploratory scenarios show a wide range of possible futures for the world’s agriculture and food systems. They result in a complex picture of futures, which offer stakeholders and policy makers a large set of possible pathways to reach food and nutrition security and sustainable land use. Considering the narratives presented in this chapter, three scenarios could be part of a sustainable trajectory for food and nutrition security and for land use: ’Healthy’, ’Regionalization’ and ’Households’. The ’Healthy’ narrative is based on strong international governance for climate and health, consistent policies across sectors and a shift toward healthier diets. The ’Regionalization’ narrative re-opens discussions about a macro-regional governance of food systems aligning production, processing, retailing and rural-urban linkages with a shift towards traditional diets. The ’Households’ narrative underlines the role of mobility and off-farm employment in the rural household economy and of NGO and disintermediation processes in the transformation of value chains. While these three narratives lead to a sustainable trajectory for food and nutrition security and for land use, two other narratives present highly negative impacts on nutrition and agriculture land expansion. The ’Metropolization’ narrative is a trend-based scenario with accelerated urbanization and a massive globalization of the food system, which will result in highly negative impacts on human health. And the ’Communities’ narrative shows little room for manoeuvre for agricultural systems in a specific context of multiple global crises. Furthermore, according to these narratives, a ’perfect storm’ is still possible: the strong impact of climate change, stagnation of crop yields, soil degradation, strong nutrition transition and a dramatic increase in
246
LAND USE AND FOOD SECURITY IN 2050
non-communicable diseases, all these factors contributing to a vicious circle of massive land-use change and deforestation, increased inequity, isolation of remote rural areas etc. These narratives suggest that there are several possible pathways for reaching food and nutrition security and sustainable land use at the world level, but that these pathways are narrow, with potential risks of agricultural land expansion and negative impacts on health.
247
14. Land-use Change Impacts of the Agrimonde-Terra Scenarios: An Assessment with the GlobAgri-AgT ModelChantal Le Mouël and Elodie Marajo-Petitzon
With contributions from: Patrice Dumas, Agneta Forslund, Stéphane Manceron, Thierry Brunelle, Olivier Mora and Olivier Réchauchère
Introduction
The land-use change impacts of the Agrimonde-Terra scenarios have been assessed with the GlobAgri-AgT model. In addition to the development of the GlobAgri-AgT tool (Chapter 3), this quantitative analysis has involved two steps. In the first step, and while the scenarios were built by combining hypotheses about the future of the external and direct drivers of the Agrimonde-Terra system, these qualitative hypotheses about of each driver in 2050 were translated into quantitative hypotheses readily processible by the GlobAgri-AgT model. This first stage was part of the ’scenario building work’ done with the Scenario Advisory Committee. In the second step, the Agrimonde-Terra scenarios were simulated with GlobAgri-AgT and their main results were analyzed.
The objective of this chapter is to report on this quantitative work. We first describe, for each driver of the system, the general rules that were adopted for translating its alternative development patterns into quantitative hypotheses, as well as the consequences of these general rules on the entry variables concerned in the GlobAgri-AgT model. Then, the simulation results of each scenario are reported and analyzed, starting with land-use change impacts, then some crucial production impacts are described and finally we describe the trade impacts.

248
LAND USE AND FOOD SECURITY IN 2050
Translating hypotheses about the future of each driver into quantitative hypotheses
Agrimonde-Terra’s ’land use and food security’ system encompasses three external drivers: global (political, economic and social) context, climate change and mitigation and food diets; and five direct drivers: urban-rural relationships, farm structures, cropping systems, livestock systems and forest systems. Hypotheses about the future of each driver up to 2050 were built. These are described in Chapters 6 to 12.54
In the following, for each driver successively, we first provide a reminder of the alternative pathways up to 2050 and specify the entry variables of the GlobAgri-AgT model (Table 3.3) which are directly or indirectly concerned. Then we describe the general rules adopted for translating these pathways into quantitative hypotheses. Finally, we report the quantitative hypotheses obtained for the related entry variables of the GlobAgri-AgT model.
❚❚ Global context
The five pathways for the global context are: Sustainable and cooperative world, Regionalization and energy transition; Economic and political fragmentation; Conventional development led by market forces and Non-State actors (Chapter 6).
Two entry variables of the GlobAgri-AgT model are directly concerned with the future pathways of the global context driver: i) food consumption, the level of which depends on changes in population and GDP per capita in the various regions; ii) world export market shares and import dependence coefficients of regions which depend on changes in the international trade context (such as trade agreements, for instance).
The global context also affects other entry variables of the model but indirectly through other drivers of the system: i) climate change and mitigation: the adopted development path is taken into account when building the quantitative hypotheses on climate change and mitigation; ii) food diets: GDP per capita growth is taken into account when building the quantitative hypotheses on daily calorie availability per capita and on diet composition; iii) cropping systems: the growth rate as an indicator of R&D expenses is taken into account when building the quantitative hypotheses on the future of cropping systems.
The general rules for building the quantitative hypotheses
The general rules for building the quantitative hypotheses on population change, on the one hand, and on trade coefficients, on the other, are the following:
54. As already mentioned, no hypotheses about the future of forest systems were built. Instead, on the quantitative analysis side only, deforestation-afforestation was evaluated ex-post as an outcome of quantitative simulations.

249
14. Impacts of the Scenarios
– Changes in total world and regional population are the same in all pathways. The median projection up to 2050 provided by the United Nations (2015 revision) is used.
– Import coefficients of regions are exogenously reduced in the ’Regionalization and energy transition’ future pathway in order to figure out the inter-regional trade impact of the development of supranational regional blocks as well as the implementation of the ’food sovereignty and subsidiarity’ principle. From 2010 to 2050, import coefficients for all products are equally reduced by –25% in all regions except the Near and Middle East and North Africa (both regions being constrained by their cultivable land). Additional reductions are implemented so as to decrease the net import dependence of net importing regions, provided their cultivable and total land constraints allow this.55 Regional import coefficients are exogenously unchanged in all the other four global context pathways.
– World export market share coefficients are not changed exogenously in any of the glo-bal context pathways.
The quantitative hypotheses
The world population reaches 9.7 billion people in 2050, with regional changes between 2010 and 2050 ranging from stability in the European Union (EU 27), Former Soviet Union (FSU) and China, to strong increases in West Africa, East, Central and South Africa (ECS Africa) (+192% and +155%, respectively), North Africa and the Near and Middle East (NME) (+72% and +70%, respectively), and to a lesser extent India (+45%).
Figure 14.1 below reports the net import dependence level of the 14 regions in the initial situation (2007/09, hereafter denoted 2010). While Brazil/Argentina, USA/Canada, Oceania and the Former Soviet Union (FSU) are significant net exporters, the Rest of America, the Near and Middle East and North Africa are significant net importers. On the other hand, India and the Rest of Asia are nearly self-sufficient while the EU 27, China, West Africa and ECS Africa are low net importing regions. In the ’Regionalization and energy transition’ future pathway, all import coefficients in all regions are exogenously reduced by –25%, decreasing the net import dependence level of net importing regions and reducing the net export position of net exporting regions. Import coefficients are further decreased in the Rest of America, the EU 27, China and ECS Africa, so that in 2050 these regions are nearly self-sufficient.
❚❚ Climate change and mitigation
Climate change patterns to 2050 are described through three pathways, inspired by the Representation Concentration Pathways (RCP) of the fifth assessment report of the IPCC
55. The net import dependence of a region is the share of total net imports (imports-exports) in total domestic use, in kilocalories. For net importing regions with remaining cultivable land, additional reductions in import coefficients were applied: in each region concerned, all import coefficients were equally reduced, with the reduction level calibrated so as the net import dependence of the region is as close as possible to zero. These additional reductions concerned: East, Central and South (ECS) Africa, the Rest of America, China and the European Union (EU 27).
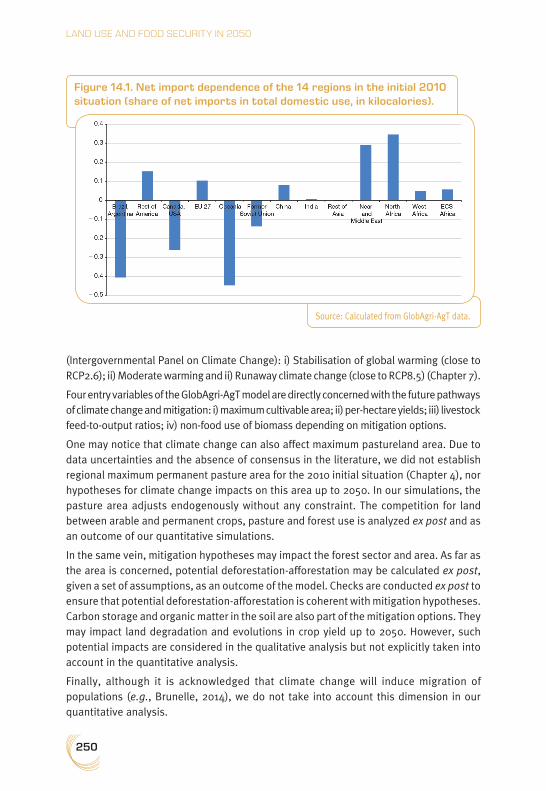
250
LAND USE AND FOOD SECURITY IN 2050
(Intergovernmental Panel on Climate Change): i) Stabilisation of global warming (close to RCP2.6); ii) Moderate warming and ii) Runaway climate change (close to RCP8.5) (Chapter 7).
Four entry variables of the GlobAgri-AgT model are directly concerned with the future pathways of climate change and mitigation: i) maximum cultivable area; ii) per-hectare yields; iii) livestock feed-to-output ratios; iv) non-food use of biomass depending on mitigation options.
One may notice that climate change can also affect maximum pastureland area. Due to data uncertainties and the absence of consensus in the literature, we did not establish regional maximum permanent pasture area for the 2010 initial situation (Chapter 4), nor hypotheses for climate change impacts on this area up to 2050. In our simulations, the pasture area adjusts endogenously without any constraint. The competition for land between arable and permanent crops, pasture and forest use is analyzed ex post and as an outcome of our quantitative simulations.
In the same vein, mitigation hypotheses may impact the forest sector and area. As far as the area is concerned, potential deforestation-afforestation may be calculated ex post, given a set of assumptions, as an outcome of the model. Checks are conducted ex post to ensure that potential deforestation-afforestation is coherent with mitigation hypotheses. Carbon storage and organic matter in the soil are also part of the mitigation options. They may impact land degradation and evolutions in crop yield up to 2050. However, such potential impacts are considered in the qualitative analysis but not explicitly taken into account in the quantitative analysis.
Finally, although it is acknowledged that climate change will induce migration of populations (e.g., Brunelle, 2014), we do not take into account this dimension in our quantitative analysis.
Figure 14.1. Net import dependence of the 14 regions in the initial 2010 situation (share of net imports in total domestic use, in kilocalories).
Source: Calculated from GlobAgri-AgT data.
251
14. Impacts of the Scenarios
The general rules for building the quantitative hypotheses
The general rules for building the quantitative hypotheses on the entry variables of the model are as follows:
– We assume that in the 2010 initial situation the maximum cultivable area (i.e., the maxi-mum area which can be devoted to arable and permanent crops) in each region equals the area under suitability indices 1 to 4 according to the Global Agro-Ecological Zones (GAEZ) approach. In the GAEZ approach, land is classified according to its quality or sui-tability for agricultural production. There are eight classes ranging from ’very suitable’ to ’not suitable’. GAEZ suitability indices 1 to 4 correspond to land categorized ’very sui-table’ to ’moderately suitable’ (Chapter 4).
– We assume that up to 2050 this maximum cultivable area is affected by climate change. To quantify the climate change effects we use Zabel et al. (2014) results56 and adopt the fol-lowing assumptions: i) no change in the ’Stabilization of global warming’ pathway (sometimes named Stabilization); ii) change according to Zabel et al.’s results (RCP8.5) in the ’Runaway climate change’ pathway (sometimes named Runaway); iii) half the change according to Zabel et al.’s results in the ’Moderate warming’ pathway (sometimes named Moderate).
– We assume that climate change is likely to affect the evolution of crop yields induced by changes in cropping systems up to 2050. For quantifying the climate change effects on crop yield evolution we use Müller and Robertson (2014) results and adopt the following hypotheses: i) no change in the ’Stabilization of global warming’ pathway; ii) change according to Müller and Robertson’s results (RCP8.5) in the ’Runaway climate change’ pathway; iii) half the change according to Müller and Robertson’s results in the ’Moderate warming’ pathway.
– Due to data uncertainties and the absence of consensus in the literature we did not esta-blish quantitative hypotheses on the impact of climate change and mitigation pathways on grass and forage yield changes, nor on changes in livestock productivity.
– Quantitative mitigation hypotheses (Table 14.1) have been established based on IPCC work (IPCC, 2014c). In the ’Stabilization of global warming’ pathway and in the ’Runaway climate change’ pathway, we assume that up to 2050, food, feed and energy crops are competing on the maximum cultivable area in each region: regional maximum areas available for food and feed crops equal regional maximum cultivable areas minus areas devoted to energy crops. In the ’Moderate warming’ pathway, we assume that energy crops do not directly compete for cultivable land with food and feed crops since they are grown on abandoned land or on forest land.
The quantitative hypotheses
Maximum cultivable area in 2010
As shown by Figure 14.2, in 2010, there are three regions where the observed arable and permanent crop area (cropland area) already exceeds the maximum cultivable area
56. More specifically we use updated results kindly provided by Florian Zabel, related to IPCC RCP2.6 and RCP8.5.

252
LAND USE AND FOOD SECURITY IN 2050
(GAEZ 1 to 4): China, the Near and Middle East and North Africa. For these three regions we consider that their 2010 observed arable and permanent crop area constitutes their maximum cultivable area. India and the EU 27 have a cropland area nearly reaching the maximum cultivable area in 2010. On the contrary, in the American continent, in the Former Soviet Union (FSU) and in East, Central and South (ECS) Africa, the observed areas devoted to arable and permanent crops are well below maximum cultivable areas. In these regions, the maximum cultivable areas are even greater than the sum of current cropland and pastureland (permanent pasture and meadow area). It is important to note that all of these regions are also those with the world’s largest forest areas. Hence, because of their large cultivable areas, agricultural land expansion is possible in these regions, but this expansion could imply further deforestation (depending on the evolution of the pastureland area and provided that the land currently reported under ’other use’ is not suitable for agriculture or is less suitable than the land currently used by forests).
Maximum cultivable area in 2050 under the three climate change and mitigation patterns
According to Zabel et al.’s results, in a ’Runaway climate change’ context, the world’s maximum cultivable area would experience a +120 million ha increase. But this increase would be unevenly distributed (Figure 14.3), with regions in Northern latitudes benefiting from increased cultivable land areas (+61 million ha in Canada/USA, +64 million ha in FSU and +14 million ha in China) and tropical regions seeing a reduction in their maximum cultivable land area (–21 million ha in South and Central America and –10 million ha in Oceania). The most notable change in maximum cultivable area would occur in North Africa, the region losing nearly half of its cultivable area due to climate change (–13 million ha and –48% compared with the 2010 cropland area).
According to our hypotheses, in 2050 the maximum cultivable areas in all regions are unchanged relative to their 2010 level under the ’Stabilisation of global warming’ pattern, and they experience half the change of the ’Runaway climate change’ context under the ’Moderate warming’ pattern.
Table 14.1. World production of energy from biomass (EJ) in 2050.
Energy crops (2G)
Forest Residues Other (algae)
Runaway climate change 30 0 30 0
Stabilization of global warming 30 30 30 12
Moderate warming
Forest variant 20 70 60 0
Energy crops variant 60 30 60 0

253
14. Impacts of the Scenarios
Figure 14.2. Land use and maximum cultivable area (GAEZ 1 to 4) en 2010 in the various regions (million hectares).
Source: Calculated from FAOStat and GAEZ data.
Figure 14.3. 2010 and 2050 maximum cultivable land area in the various climate change and mitigation pathways (1,000 ha).
Source: Calculated from Zabel et al. (2014) results.
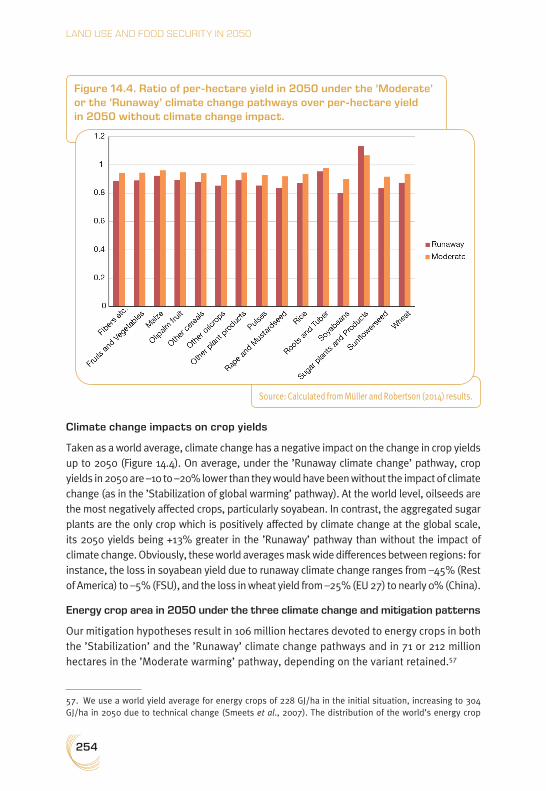
254
LAND USE AND FOOD SECURITY IN 2050
Climate change impacts on crop yields
Taken as a world average, climate change has a negative impact on the change in crop yields up to 2050 (Figure 14.4). On average, under the ’Runaway climate change’ pathway, crop yields in 2050 are –10 to –20% lower than they would have been without the impact of climate change (as in the ’Stabilization of global warming’ pathway). At the world level, oilseeds are the most negatively affected crops, particularly soyabean. In contrast, the aggregated sugar plants are the only crop which is positively affected by climate change at the global scale, its 2050 yields being +13% greater in the ’Runaway’ pathway than without the impact of climate change. Obviously, these world averages mask wide differences between regions: for instance, the loss in soyabean yield due to runaway climate change ranges from –45% (Rest of America) to –5% (FSU), and the loss in wheat yield from –25% (EU 27) to nearly 0% (China).
Energy crop area in 2050 under the three climate change and mitigation patterns
Our mitigation hypotheses result in 106 million hectares devoted to energy crops in both the ’Stabilization’ and the ’Runaway’ climate change pathways and in 71 or 212 million hectares in the ’Moderate warming’ pathway, depending on the variant retained.57
57. We use a world yield average for energy crops of 228 GJ/ha in the initial situation, increasing to 304 GJ/ha in 2050 due to technical change (Smeets et al., 2007). The distribution of the world’s energy crop
Figure 14.4. Ratio of per-hectare yield in 2050 under the ’Moderate’ or the ’Runaway’ climate change pathways over per-hectare yield in 2050 without climate change impact.
Source: Calculated from Müller and Robertson (2014) results.

255
14. Impacts of the Scenarios
❚❚ Food diets
Agrimonde-Terra built four hypotheses for the future of food diets up to 2050: i) Transition to diets based on ultra-processed products and transnational value chains (sometimes named ’Ultra-processed products’ or Ultrap); ii) Transition to diets based on animal products and urban style of life (sometimes named ’Animal products’ or Animp); iii) Regional diversity of diets and food systems (sometimes named ’Regional’) and iv) Food diversity for healthy dietary practices (sometimes named ’Healthy’) (Chapter 8).
The food consumption variable is the only entry variable of the GlobAgri-AgT model which is directly concerned with the hypotheses for the future of food diets up to 2050. In addition to population change, the consumption level of each product also depends on the changes in the main characteristics of the food diets, notably the daily calorie availability per capita and the composition of the diet.
The general rules for building the quantitative hypotheses
The general rules that we established for building our quantitative hypotheses relate to both the change in the daily calorie availability per capita and the share of the various groups of food in the diet. They are the following:
– Kilocalories available per capita and per day: in the ’Transition’ pathway, daily calorie availability is supposed to remain constant relative to the 2010 level in regions with high initial levels (developed regions and some emerging regions). It is assumed to converge towards the developed regions’ levels in regions with initial medium and low levels (deve-loping regions and some emerging regions). In the ’Regional’ pathway, the daily calorie availability is assumed to be constant over 2010-2050 for all regions, except India and ECS Africa, in which particularly low initial levels are increased. In the ’Healthy’ pathway, the daily calorie availability is supposed to converge towards medium levels, coherent with daily calorie needs in all regions (Table 14.2).
– Dietary patterns: shares of product groups (meat, dairy and eggs, aquatic animal pro-ducts, pulses, maize-rice-wheat, other cereals, fruit and vegetables, roots and tubers, sugar and sweeteners, vegetable oils and other products) in the diet are evolving accor-ding to different trends in the various food diet hypotheses for the future (Table 14.2). In the ’Transition’ pathway based on ultra-processed products, diets are mainly com-posed of ultra-processed foods, made of major cereals, meat, vegetable oil and fats, sugar and sweeteners and salt through processing and re-assemblage. In the ’Transition’
areas across regions differs according to climate change pathways: i) in ’Stabilization of global warming’, the distribution is based on regional production of biomass for energy of the SSP1/RCP2.6 marker scenario proposed by the IPCC; ii) in ’Runaway climate change’, this is the regional production of biomass for energy of SSP5/RCP8.5 marker scenario of the IPCC which is used; iii) in ’Moderate warming’, regions with no fossil energy are producing energy crops first. Then, if necessary, regions with fossil energy are starting to produce energy crops, regions having the lowest reserves of fossil energy starting first. In all regions, energy crops are first grown on abandoned land. Remaining required areas are then taken from forests, in regions with the largest forest land areas and the lowest fossil energy reserves.

256
LAND USE AND FOOD SECURITY IN 2050
pathway based on animal products, diets have an increased share of animal products, namely meat, dairy, eggs and aquatic products. In the ’Regional’ pathway, diets main-tain some regional patterns linked to regional food culture and to regional agriculture resources. In the ’Healthy’ pathway, dietary patterns contribute to the prevention of non-communicable food-related diseases such as obesity, type II diabetes, cardiovas-cular diseases and cancer, in coherence with guideline recommendations for healthy nutrition (WHO/FAO, 2003).
Table 14.2. General rules for the changes in food diets over 2010-2050 under the different pathways.
Ultrap Animp Regional Healthy
Diet energy (Daily calories per capita)
- Regions over 3,300 kcal/cap/day in 2010: unchanged up to 2050 - Regions between 3,000 and 3,300 kcal/cap/day in 2010: increase to 3,300 in 2050 - Regions under 3,000 kcal/cap/day in 2010: increase to 3,000 kcal/cap/day in 2050
- Unchanged relative to 2010 in all regions, except India and ECS Africa: increase up to 2500 kcal/cap/day in 2050 - When used with the ’Communities’ scenario: –10% reduction in all regions except India and ECS Africa
- Regions over 3,000 kcal/cap/day in 2010: decrease to 3,000 - Regions under 2,750 kcal/cap/day in 2010: increase to 2,750 - Regions between 2,750 and 3,000 kcal/cap/day in 2010: unchanged
Diet pattern
- Change according to 1998/2008 trends in Brazil in all regions except Canada/USA: no change relative to 2010 - 2 diet share minimum thresholds: 13.5% for vegetable oils; 10% for animal products
- In developed regions, unchanged relative to 2010 - In emerging regions, change according to 1998/2008 average trends in developed regions - In developing regions, change according to 1998/2008 average trends in emerging regions
- In each region, change according to the pattern observed in the region in 1970/72 - Diet share of animal products: 10% minimum threshold
- Diet share of animal products and pulses: 20% - Diet share of cereals: 50%, coarse grains accounting for ¼ to ⅓ - Diet share of fruit and vegetables: 15% - Diet share maximum thresholds: 10% for vegetable oils, 2.5% for sugar and sweeteners
Within the meat group: strong substitution from ruminant meat to poultry meat
Within the meat group: substitution from ruminant meat to poultry meat
Within the meat group: substitution from ruminant meat to poultry meat

257
14. Impacts of the Scenarios
The quantitative hypotheses
According to our hypotheses, the average world diet makes available more daily calories per capita in 2050 than in 2010 in all food diet pathways except the ’Regional’ one (Figure 14.5). In the latter, the daily calories available per capita decreases slightly between 2010 and 2050 despite our assumption of unchanged levels in all regions. The reason is that over the 2010-2050 period the population is increasing more in regions with initial low levels than in regions with initial high levels, pushing down the world average. The ’Transition’ pathway is the one involving the highest level of daily calorie availability per capita.
As a result of the ’Transition to diets based on ultra-processed products’ pathway, the world diet has become significantly richer in vegetable oils as well as in sugar and sweeteners in 2050 compared to 2010. Under the ’Transition to diets based on animal products’, the most significant change in the world dietary pattern between 2010 and 2050 is the increased share of meat and dairy and eggs (+50%). The ’Regional’ pathway makes the world average diet richer in pulses and, above all, in roots and tubers. With the ’Healthy’
Figure 14.5. Average world food diet in 2010 and 2050 under the various food diet pathways.
Source: Calculated from GlobAgri-AgT data.

258
LAND USE AND FOOD SECURITY IN 2050
pathway, the world diet involves far more fruit and vegetables, coarse grains and pulses and significantly less meat and sugar and sweeteners.
As shown in the Appendix 2 (Figure A2.1), our hypotheses induce very different changes in food diets from 2010 to 2050 across the regions. For developed regions, such as Canada/USA and EU 27, only the ’Healthy’ pathway leads to a significant change in food diets from 2010 to 2050. While all pathways imply moderate changes in food diets for emerging countries such as China and FSU. In contrast, our hypotheses induce significant changes in food diets, whatever the pathway, in developing countries such as North Africa and West Africa, the changes being dramatic in India and ECS Africa. In all these regions, the ’Transition with animal products’ pathway involves a marked rise in the share of animal products, particularly of meat. The ’Regional’ pathway is the one inducing the lowest changes.
Examining in more detail the food diet changes induced by the various pathways in India and ECS Africa, two points stand out:
– In both regions, all pathways involve an increase in the daily calorie availability per capita. As a sharp increase in population is also expected in both regions (especially in ECS Africa), this means that food consumption of products will increase significantly under all pathways in India and ECS Africa.
– In both regions, all pathways result in a rise in the share of animal products in diets (essentially meat in ’Transition with animal products’, meat and dairy and eggs in all other pathways). Once again, combined with the expected population increase, this rising share of animal products in diets will lead to a huge increase in the food consumption of meat, dairy and eggs under all food diet pathways in India and ECS Africa.
❚❚ Rural-Urban relationships
The hypotheses for the future of rural-urban relationships up to 2050 have not been translated into quantitative hypotheses. In addition to the food consumption variable through food diet change, there are two entry variables of the GlobAgri-AgT model which are potentially influenced by changes in rural-urban relationships: the maximum cultivable area and the maximum pastureland area. Indeed, both areas may expand or decrease according to changes in rural-urban relationships. Unfortunately, we did not find enough empirical evidence about the impact of rural-urban relationships on land available to agriculture and we were not able to establish sound quantitative hypotheses for this driver of our ’land use and food security’ system.
❚❚ Farm structures
The GlobAgri-AgT model has no entry variables allowing us to deal with farm structures. Hence the hypotheses about the future of farm structures up to 2050 have not been translated into quantitative hypotheses.
259
14. Impacts of the Scenarios
❚❚ Cropping systems
Four distinct pathways for the evolution of cropping systems are considered, including an impasse, each addressing current challenges in different ways: i) Conventional intensification; ii) Sustainable intensification; iii) Agroecology and iv) Collapse of cropping systems (Chapter 11).
Two entry variables of the GlobAgri-AgT model are directly concerned with the hypotheses for the future of cropping systems:
– Per-hectare yields. – Cropping intensity ratios (as measured by the harvested area over the cultivated area
in each region, Chapters 3 and 5).
The general rules for building the quantitative hypotheses
We adopted three general rules in order to translate the cropping system pathways into quantitative hypotheses for regional per-hectare yield changes:
– We calculated current yield gaps for Agrimonde-Terra’s crops and regions using poten-tial and observed per-hectare yields provided by the GAEZ database portal.58 We then assumed a level of yield gap reduction between 2010 and 2050, differentiated according to cropping pathways, and which we applied uniformly to groups of crops (cereals, pro-tein seeds and other crops) and grass and forage (Table 14.3).
– We hypothesized that there is induced technical change together with induced change in the distribution of crops across land fertility classes, which results in a greater rate of yield increase for those crops which are the most in demand at the world level. If we take a group of crops, cereals for example, the yield gap reduction described above applies to the average cereal yield. We then assume that within the cereal group, those cereal crops which are the most in demand will benefit from above-average yield gap reduc-tions, while cereal crops which are less in demand will experience below-average yield gap reductions. The indicator used for ’most demanded/less demanded’ crops is the change in the respective crop shares in the average world diet under the various food diet pathways (Table 14.3).
– Grass and forage crops benefit from the same yield gap reduction as other crop groups.
As far as cropping intensity ratios are concerned, we adopted the following general rules: – Based on existing literature and expert knowledge, it was not possible to differentiate
the impacts of the various cropping system pathways on cropping intensity ratios. Hence we consider that all pathways have the same impacts on these ratios.
– We used Ray and Foley (2013) results in order to get an initial assessment of potential changes in regional cropping intensity ratios up to 2050. However, as Ray and Foley’s
58. We used the data for the year 2000, the potential yields obtained with so-called ’high input’ cropping systems (potential yields are also available for ’intermediate input’ and ’low input’ cropping systems) and, for both actual and potential yields, a weighted average of rainfed and irrigated yields (the weights being the relative shares of rainfed and irrigated land areas).
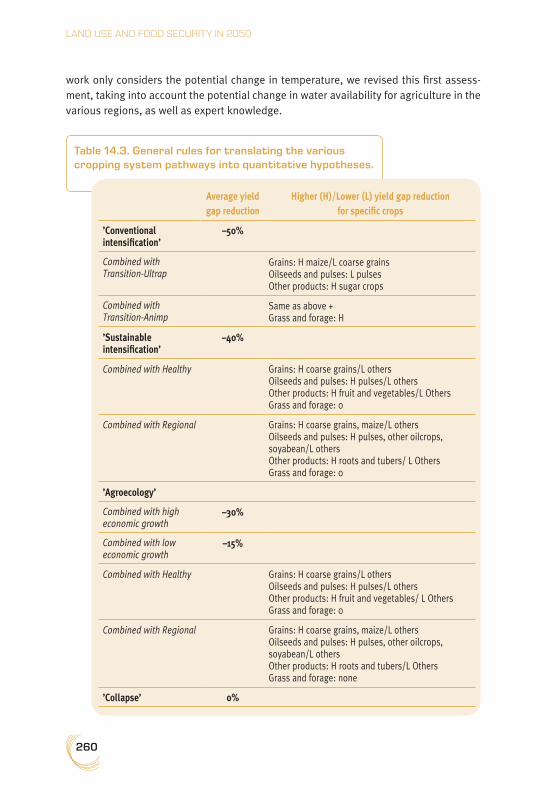
260
LAND USE AND FOOD SECURITY IN 2050
work only considers the potential change in temperature, we revised this first assess-ment, taking into account the potential change in water availability for agriculture in the various regions, as well as expert knowledge.
Table 14.3. General rules for translating the various cropping system pathways into quantitative hypotheses.
Average yield gap reduction
Higher (H)/Lower (L) yield gap reduction for specific crops
’Conventional intensification’
–50%
Combined with Transition-Ultrap
Grains: H maize/L coarse grains Oilseeds and pulses: L pulses Other products: H sugar crops
Combined with Transition-Animp
Same as above + Grass and forage: H
’Sustainable intensification’
–40%
Combined with Healthy Grains: H coarse grains/L others Oilseeds and pulses: H pulses/L others Other products: H fruit and vegetables/L Others Grass and forage: 0
Combined with Regional Grains: H coarse grains, maize/L others Oilseeds and pulses: H pulses, other oilcrops, soyabean/L others Other products: H roots and tubers/ L Others Grass and forage: 0
’Agroecology’
Combined with high economic growth
–30%
Combined with low economic growth
–15%
Combined with Healthy Grains: H coarse grains/L others Oilseeds and pulses: H pulses/L others Other products: H fruit and vegetables/ L Others Grass and forage: 0
Combined with Regional Grains: H coarse grains, maize/L others Oilseeds and pulses: H pulses, other oilcrops, soyabean/L others Other products: H roots and tubers/L Others Grass and forage: none
’Collapse’ 0%
261
14. Impacts of the Scenarios
Finally, we assumed that in a context of low economic growth, fewer budget resources are devoted to R&D so that the rate of technical change is lower. This is why when the ’Agroecology’ pathway is used in the ’Communities’ scenario (which involves sluggish economic growth), the applied yield gap reductions and changes in cropping intensity ratios are less favourable.
As shown in Table 14.3, in our quantitative analysis, we assumed that on average crop yield growth is greater in the ’Conventional intensification’ pathway than in both the ’Sustainable intensification’ and the ’Agroecology’ pathways. Indeed, we considered that intensifying cropping systems while reducing negative externalities, as involved in the ’Sustainable intensification’ pathway, put more constraints on yield growth, so that on average the per-hectare yield performance reached under ’Sustainable intensification’ is lower than the per-hectare yield performance reached under ’Conventional intensification’. In the same vein, we assumed that redesigning cropping systems towards higher autonomy regarding input use (i.e., ’Agroecology’) is even more of a constraint in terms of yield growth performance.59
These hypotheses, which are key factors with regards to the land-use change effects of the scenarios, are controversial and were extensively discussed with Agrimonde-Terra’s Scenario Advisory Committee. First of all, as conventional intensive systems are potentially more damaging for natural resources (including soil fertility), their potentially higher yield performance is not secure in a long-term perspective.60 In contrast, the long-term likely beneficial effects of systems based on agroecology, for instance on soil fertility (Kremen and Miles, 2012), could help balance the probable short to medium-term stronger constraints on yield performance of these systems. Secondly, high-yielding agroecological systems with multi-cropping have been described, especially in developing countries (Pretty et al., 2006; Altieri et al., 2011). However, these studies do not actually compare situations which differ only in the cropping system used. Such comparisons have been undertaken, but only between organic and conventional agriculture (de Ponti et al., 2012; Seufert et al., 2012), with differences in yield performances ranging from –40% to +10%, and an average gap in the –30% to –20% range, depending on the criteria used for comparison.
Although we acknowledge that agroecology differs from organic systems, we differentiated our quantitative hypotheses on average yield gap reduction between ’Conventional intensive’ and ’Agroecology’ pathways based on this existing literature.
59. At least when yield performances are considered crop by crop as is the case here, and not for the whole set of crops included in the crop rotation.
60. We should remember that in our scenarios the ’Conventional intensification’ pathway for cropping systems is used jointly with the ’Runaway global warming’ climate pathway. As this climate pathway involves higher negative impacts on per-hectare yield growth, we take into account, at least partly, the damaging impacts of the degradation of resources on the long-term yield performances of conventional intensive cropping systems.
262
LAND USE AND FOOD SECURITY IN 2050
The quantitative hypotheses
Per-hectare yields
The per-hectare yield of different crops in 2010 and in 2050 under the various cropping system pathways (combined with the different food diet pathways and the different economic growth contexts) are reported in Figure 14.6 (and in Figure A2.2 in the Appendix 2). We should remember that in Figure 14.6, yield changes between 2010 and 2050 result only from the changes in cropping systems: the climate change impact is not taken into account. Obviously, when simulating the complete scenarios, the 2050 yields are those including both the impacts of changes in cropping systems and the impacts of climate change. Five main points may be underlined:
– Following our general rules, per-hectare yields increase between 2010 and 2050 with all cropping systems except the ’Collapse’ one (where yields are unchanged), for all crops in all regions, except those exhibiting initial zero yield gaps (such as rice in Rest of Asia, for instance). For the latter, per-hectare yields are constant in 2050 compared to 2010. In all other situations, whatever the cropping system pathway, the higher the initial yield gap, the higher the yield increase over the period 2010-2050.
– Following our general rules, per-hectare yield increases between 2010 and 2050 are lower under both the ’Agroecology with low economic growth’ and the ’Collapse’ pathways than under the other pathways. For the main current cereals (maize, rice and wheat) and oilseeds (soyabean) and for sugar crops, in all regions, yield increases over the 2010-2050 period are highest with the ’Conventional intensification’ pathway, and are grea-ter with the ’Sustainable intensification’ pathway than with the ’Agroecology’ pathway.
– The situation is different for other crops such as other cereals, pulses, fruit and vege-tables and roots and tubers, whose consumption increases with the ’Healthy’ and ’Regional’ diets. For these crops, in all regions, due to our induced technical change hypothesis, yield increases between 2010 and 2050 are higher with both the ’Sustainable intensification’ and the ’Agroecology’ pathways than with the ’Conventional intensification pathway’.
– Whatever the crop and the region, yield increases over the 2010-2050 period are grea-ter under the ’Sustainable intensification’ pathway than under the ’Agroecology’ pathway.
– On average, whatever the cropping system pathway, developing regions experience greater crop yield increases than other regions.
Cropping intensity ratios
Changes in the cropping intensity ratios by region are shown in Figure 14.7. Our general rules imply that cropping intensity ratios in 2050 are equivalent under ’Conventional intensification’, ’Sustainable intensification’ and ’Agroecology with high economic growth’. They are lower under ’Collapse’ and when the economic context is unfavourable (’Agroecology with low economic growth’). Figure 14.7 suggests that from 2010 to 2050, following our hypotheses, cropping intensity is likely to increase in only a few regions: ECS Africa, Rest of Asia, South and Central America and, to a lesser extent, Oceania and FSU.
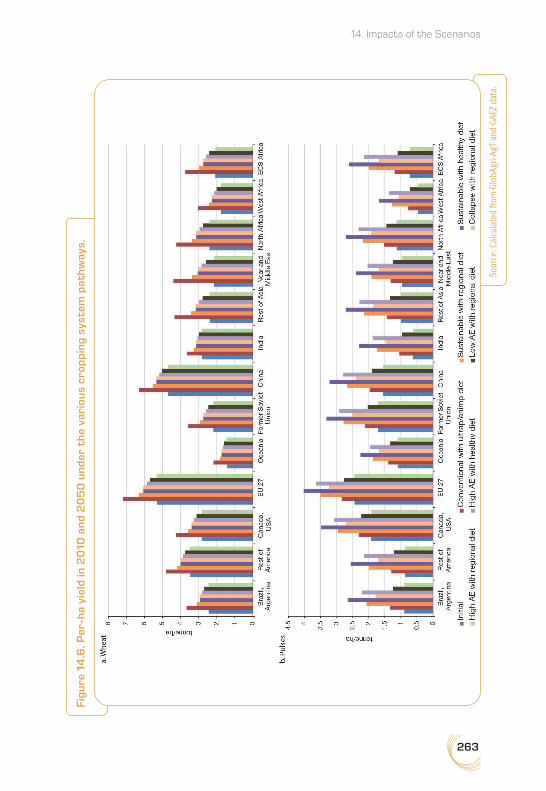
263
14. Impacts of the Scenarios
Figu
re 1
4.6
. Per
-ha
yiel
d in
20
10 a
nd
20
50
un
der
th
e va
riou
s cr
opp
ing
syst
em p
ath
way
s.
Sour
ce: C
alcu
late
d fro
m G
lobA
gri-A
gT a
nd G
AEZ
data
.
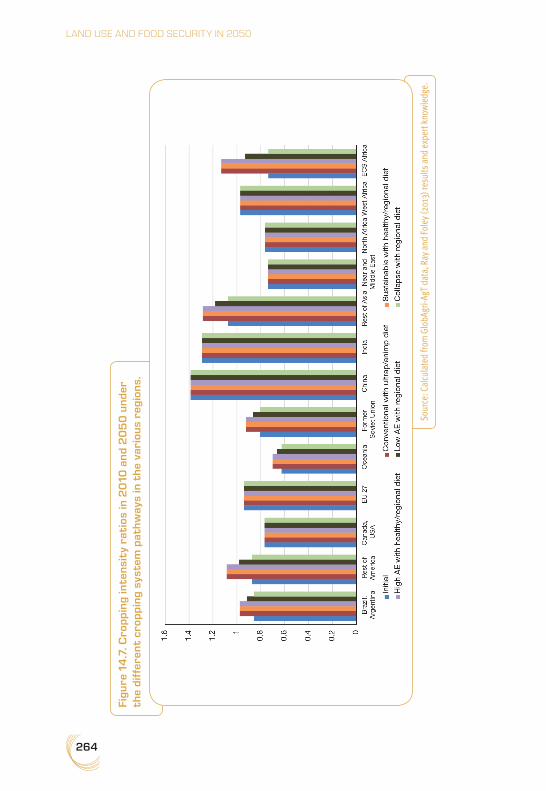
264
LAND USE AND FOOD SECURITY IN 2050
Figu
re 1
4.7
. Cro
pp
ing
inte
nsi
ty r
atio
s in
20
10 a
nd
20
50
un
der
th
e di
ffer
ent
crop
pin
g sy
stem
pat
hw
ays
in t
he
vari
ous
regi
ons.
Sour
ce: C
alcu
late
d fro
m G
lobA
gri-A
gT d
ata,
Ray
and
Fol
ey (2
013)
resu
lts a
nd e
xper
t kno
wle
dge.
265
14. Impacts of the Scenarios
❚❚ Livestock systems
Based on trends in animal feed, efficiency of animal systems, crop-livestock synergies and herd mobility, four hypotheses for the future of livestock systems were produced: i) Conventional intensive livestock with imported resources or with local resources (sometimes named ’Intensive’ and ’Intensive-Local’ respectively); ii) Agroecological livestock on land in synergy with agriculture or urbanization (sometimes named ’Agroecology’); iii) Livestock minimizing competition with cropland (sometimes named ’Livestock on marginal land’ or ’Rationalization’) and iv) Backyard livestock (sometimes named ’Backyard’) (Chapter 12).
In GlobAgri-AgT, regional livestock systems are quantitatively described and modelled based on data from Herrero et al. (2013).61 In each region, five livestock sectors are considered (dairy, beef, small ruminants, pork and poultry); they produce six animal products (milk and dairy, beef meat, small ruminant meat, pork meat, poultry meat and eggs). Each ruminant livestock sector comprises four production systems (Herrero et al.’s so-called ’mixed’, ’pastoral’, ’urban’ and ’other systems’). Each monogastric sector involves two production systems (Herrero et al.’s so-called ’urban’ and ’other systems’).
We faced some difficulties in quantifying the hypotheses for the future of livestock systems and were forced to adopt some restrictive assumptions. Our difficulties resulted from at least two main reasons. First, only two entry variables of the GlobAgri-AgT model were available to quantify the hypotheses for the future while the latter involved livestock pathways which are differentiated on a set of various dimensions. Secondly, as far as ruminant sectors are concerned, there was not a clear ranking of the different production systems, from the least to the most intensive, emerging from the initial data we used. Hence it was not easy to choose which production system(s) would expand more than the others in each hypothesis for the future (see below).
The two entry variables of the GlobAgri-AgT model concerned are: – regional feed-to-output ratios (measuring the quantity of dry matter feed by unit of out-
put produced) of each system in each sector; – regional shares of the different production systems in the total output production of
the considered sectors.
In other words, we assume that, in each region, the overall productivity of a livestock sector (as measured by its global feed-to-output ratio) may change between 2010 and 2050 through both the change in the feed-to-output ratios of the various systems in the sector (measuring the mixed effects of changes in the productivity per animal, in animal diseases and mortality and in the efficiency of feed rations) and the change in the relative shares in production of these various systems.
61. More specifically we use more detailed data kindly provided by Mario Herrero and Petr Havlik.

266
LAND USE AND FOOD SECURITY IN 2050
The general rules for building the quantitative hypotheses
The general rules adopted for quantifying the livestock system change pathways are the following and apply at the regional level:
– Each future pathway is associated with one or two specific production systems per sec-tor: the chosen systems are those where changes are occurring, other systems remain constant over the 2010-2050 period. For each livestock system pathway, the production systems concerned by changes are chosen as those providing the best fit with the dyna-mics involved in the pathway (Table 14.4).
– For production systems experiencing changes between 2010 and 2050, feed-to-output ratios are assumed to change according to projections to 2030 provided by Bouwman et al. (2005), extended to 2050. This rule applies to all regions except West Africa and ECS Africa. In these both regions, we assume that feed-to-output ratios change two times faster than expected in Bouwman et al.’s projections for the beef sector.62
– For all production systems, shares in the total production of the sectors concerned are increased or decreased, depending on the pathway of change (Table 14.4).
– In the ’Conventional intensive livestock with local resources’ pathway, the composition of feed rations of mixed systems in ruminant sectors and of urban systems in monogastric sectors are changed so that imported feedstuffs are replaced by locally produced feeds-tuffs. A locality indicator is first defined as to select the local feedstuffs, then within the energy-rich feed group and within the protein-rich feed group, local feedstuffs replace imported feedstuffs provided the energy content and the dry matter content of the ration remain unchanged. The balance of final rations in terms of protein is checked ex post.
The quantitative hypotheses
A detailed analysis of initial data is provided in the Appendix 2.
Following our general rules, the reductions on feed-to-output ratios applied (Table 14.5): – do not differ between ’Conventional intensive livestock’ with imported or local resources
and ’Agroecological livestock’ for ruminant sectors. Indeed, in contrast to our quantitative hypotheses regarding crop system pathways, we were not able to find evidence of any performance gaps (in terms of feed-to-output ratios) between conventional and agroe-cological systems. Hence the only difference in global performance changes in ruminant sectors lies in the diverging evolution of production shares between conventional and agroecological livestock pathways: in the first pathway, the production shares of mixed systems increase to the detriment of all systems, including pastoral, while in the second
62. As we show later on, initial feed-to-output ratios of the mixed system in the beef sector in West Africa and ECS Africa are very high compared to those exhibited by the other regions. There are consistent explanations for such a situation related to the specific role of livestock in both these regions: livestock provides nutrient-rich food but also draught power, organic manure and domestic fuel; livestock also serves as a source of income, as a means for capital accumulation and insurance against income shocks etc. Despite huge uncertainties, we assumed however, notably on the basis of the literature and experiences, that there is room for manoeuvre for improving livestock feed-to-output ratios in West and ECS Africa, and that Bouwman et al.’s projections (2005) are rather pessimistic in this regard.

267
14. Impacts of the Scenarios
pathway, the production shares of the mixed systems increase to the detriment of urban and other systems only, the shares of pastoral systems remaining constant (Table 14.4);
– do not differ between ’Conventional intensive’ with imported and local resources and ’Livestock on marginal land’ for monogastric sectors, while no change is applied in ’Agroecological livestock’. Based on expert knowledge, we considered that shifting to agroecological systems would not provide any gain in efficiency in monogastric sectors as far as feed-to-output ratios are concerned;
– are significantly greater in developing regions than in developed regions. For the latter, Bouwman et al.’s projections to 2030 suggest that almost no further improvement in efficiency (as measured by feed-to-output ratios) could be achieved in the dairy, pork and poultry sectors.
Finally, following our general rules and due to initial data, our quantitative hypotheses generally lead to:
1 For feed-to-output ratios: decrease means that 1 tonne of animal product requires less quantity of dry-matter feed, implying higher productivity of the production system.* According to Bouwman et al. (2005).
Table 14.4. General rules for translating the various livestock system pathways into quantitative hypotheses.
Conventional intensive livestock
Agroecological livestock
Livestock on marginal land
Backyard livestock
Change in feed-to-output ratios1
RuminantMixed Decrease* Decrease* Decrease* No changePastoral Decrease* Decrease* No change No changeUrban No change No change No change No changeOther No change No change No change No change
MonogastricUrban Decrease* No change Decrease* No changeOther No change No change No change No change
Change in production shares
RuminantMixed Increase Increase Decrease No changePastoral Decrease No change Increase No changeUrban Decrease Decrease Decrease No changeOther Decrease Decrease Decrease No change
MonogastricUrban Increase Decrease Increase No changeOther Decrease Increase Decrease No change
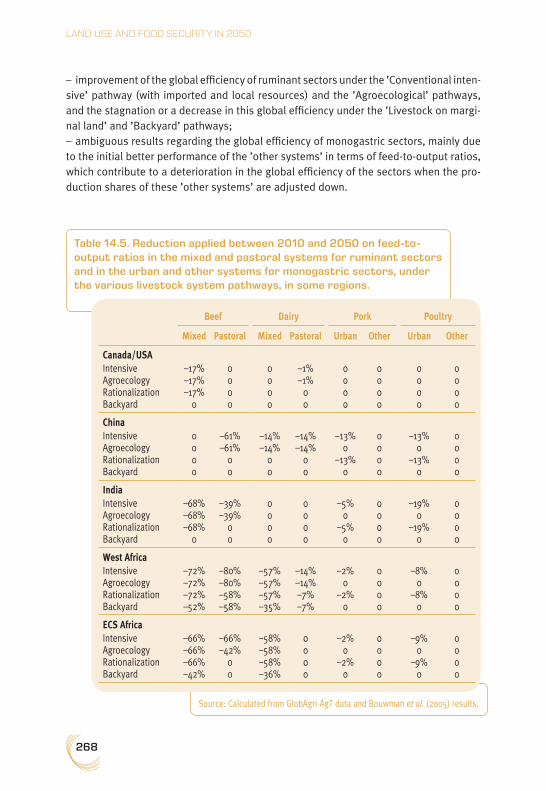
268
LAND USE AND FOOD SECURITY IN 2050
– improvement of the global efficiency of ruminant sectors under the ’Conventional inten-sive’ pathway (with imported and local resources) and the ’Agroecological’ pathways, and the stagnation or a decrease in this global efficiency under the ’Livestock on margi-nal land’ and ’Backyard’ pathways;
– ambiguous results regarding the global efficiency of monogastric sectors, mainly due to the initial better performance of the ’other systems’ in terms of feed-to-output ratios, which contribute to a deterioration in the global efficiency of the sectors when the pro-duction shares of these ’other systems’ are adjusted down.
Source: Calculated from GlobAgri-AgT data and Bouwman et al. (2005) results.
Table 14.5. Reduction applied between 2010 and 2050 on feed-to-output ratios in the mixed and pastoral systems for ruminant sectors and in the urban and other systems for monogastric sectors, under the various livestock system pathways, in some regions.
Beef Dairy Pork Poultry
Mixed Pastoral Mixed Pastoral Urban Other Urban Other
Canada/USAIntensive Agroecology Rationalization Backyard
–17% –17% –17%
0
0 0 0 0
0 0 0 0
–1% –1%
0 0
0 0 0 0
0 0 0 0
0 0 0 0
0 0 0 0
ChinaIntensive Agroecology Rationalization Backyard
0 0 0 0
–61% –61%
0 0
–14% –14%
0 0
–14% –14%
0 0
–13% 0
–13% 0
0 0 0 0
–13% 0
–13% 0
0 0 0 0
IndiaIntensive Agroecology Rationalization Backyard
–68% –68% –68%
0
–39% –39%
0 0
0 0 0 0
0 0 0 0
–5% 0
–5% 0
0 0 0 0
–19% 0
–19% 0
0 0 0 0
West AfricaIntensive Agroecology Rationalization Backyard
–72% –72% –72% –52%
–80% –80% –58% –58%
–57% –57% –57% –35%
–14% –14% –7% –7%
–2% 0
–2% 0
0 0 0 0
–8% 0
–8% 0
0 0 0 0
ECS AfricaIntensive Agroecology Rationalization Backyard
–66% –66% –66% –42%
–66% –42%
0 0
–58% –58% –58% –36%
0 0 0 0
–2% 0
–2% 0
0 0 0 0
–9% 0
–9% 0
0 0 0 0
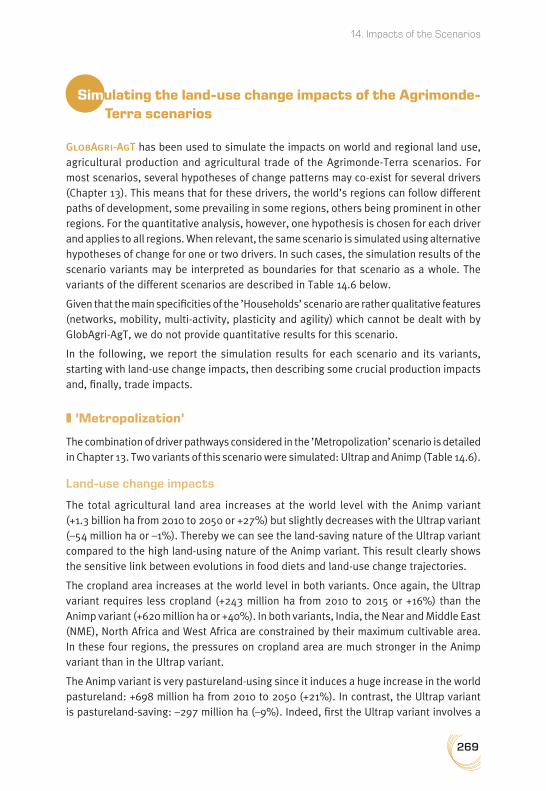
269
14. Impacts of the Scenarios
Simulating the land-use change impacts of the Agrimonde-Terra scenarios
GlobAgri-AgT has been used to simulate the impacts on world and regional land use, agricultural production and agricultural trade of the Agrimonde-Terra scenarios. For most scenarios, several hypotheses of change patterns may co-exist for several drivers (Chapter 13). This means that for these drivers, the world’s regions can follow different paths of development, some prevailing in some regions, others being prominent in other regions. For the quantitative analysis, however, one hypothesis is chosen for each driver and applies to all regions. When relevant, the same scenario is simulated using alternative hypotheses of change for one or two drivers. In such cases, the simulation results of the scenario variants may be interpreted as boundaries for that scenario as a whole. The variants of the different scenarios are described in Table 14.6 below.
Given that the main specificities of the ’Households’ scenario are rather qualitative features (networks, mobility, multi-activity, plasticity and agility) which cannot be dealt with by GlobAgri-AgT, we do not provide quantitative results for this scenario.
In the following, we report the simulation results for each scenario and its variants, starting with land-use change impacts, then describing some crucial production impacts and, finally, trade impacts.
❚❚ ’Metropolization’
The combination of driver pathways considered in the ’Metropolization’ scenario is detailed in Chapter 13. Two variants of this scenario were simulated: Ultrap and Animp (Table 14.6).
Land-use change impacts
The total agricultural land area increases at the world level with the Animp variant (+1.3 billion ha from 2010 to 2050 or +27%) but slightly decreases with the Ultrap variant (–54 million ha or –1%). Thereby we can see the land-saving nature of the Ultrap variant compared to the high land-using nature of the Animp variant. This result clearly shows the sensitive link between evolutions in food diets and land-use change trajectories.
The cropland area increases at the world level in both variants. Once again, the Ultrap variant requires less cropland (+243 million ha from 2010 to 2015 or +16%) than the Animp variant (+620 million ha or +40%). In both variants, India, the Near and Middle East (NME), North Africa and West Africa are constrained by their maximum cultivable area. In these four regions, the pressures on cropland area are much stronger in the Animp variant than in the Ultrap variant.
The Animp variant is very pastureland-using since it induces a huge increase in the world pastureland: +698 million ha from 2010 to 2050 (+21%). In contrast, the Ultrap variant is pastureland-saving: –297 million ha (–9%). Indeed, first the Ultrap variant involves a

270
LAND USE AND FOOD SECURITY IN 2050
Table 14.6. Simulated variants of the scenarios.
Scenario Variant (assumptions used) Running name
Metropolization With ultra-processed products: Transition to diets based on ultra-processed products
Metropolization_Ultrap
With animal products: Transition to diets based on animal products
Metropolization_Animp
Regionalization With agricultural technology A: Sustainable intensification for cropping systems + Conventional intensification with local resources for livestock systems
Regionalization_A
With agricultural technology B: Agroecology for cropping systems + Agroecological livestock
Regionalization_B
Healthy With agricultural technology C: Sustainable intensification for cropping systems +Agroecological livestock
Healthy_C
With agricultural technology D: Agroecology for cropping systems + Agroecological livestock
Healthy_D
Communities With agroecology: Agroecology for cropping systems + Agroecological livestock
Communities_AE
With collapse: Collapse of crop production + Backyard livestock
Communities_Collapse
significantly lower increase in food consumption of animal products than the Animp variant and, second, we assume a stronger substitution of poultry meat for ruminant meat in the Ultrap variant. Both movements work together to limit the pastureland required at the world level for the Ultrap variant relative to the Animp variant.
These results emphasize the high land-using nature of diets rich in animal products (especially meat), which is now common knowledge (Chapter 4). One may notice that the extent of the expansion in agricultural land induced by our Animp variant is particularly strong relative to most existing studies. One main reason lies in our hypothesis on the evolution of the share of animal products in the corresponding food diets, which implies a particularly strong increase in world meat consumption from 2010 to 2050. As shown by Figure 14.8, our Animp variant induces huge additional meat quantities consumed at the world level between 2010 and 2050; they are far higher than the ones involved in Alexandratos and Bruisma (2012) for instance (+83% in the FAO scenario vs. +136% in our Animp variant of the ’Metropolization’ scenario). Let’s note at this stage that in our Animp variant, the meat consumption levels reached in 2050 are always more than double the FAO scenario projections in all our developing regions, the increase being

271
14. Impacts of the Scenarios
particularly marked and dramatically higher than the FAO scenario projections in India, West Africa and ECS Africa.
In both variants, cropland area increases in Brazil/Argentina and Canada/USA, both world-leading regions in the production of oilseeds (vegetable oils) and sugar plants as well as feed ingredients (maize and cakes) and meat, and in developing regions such as India, Rest of Asia, West Africa and ECS Africa, all regions where changes in food diets combined with an increase in population induce a particularly strong rise in food consumption (Figure 14.9).
The pastureland area decreases in nearly all regions with the Ultrap variant, except in some developing regions such as Rest of Asia, ECS Africa and, to a lesser extent, West Africa, where even the diet based on ultra-processed food involves increased consumption of meat (Figure 14.10). Pastureland increases significantly with the Animp variant in regions where either this variant induces a huge increase in meat consumption or a significant rise in exports (such as Brazil/Argentina and Oceania, where a non-negligible share of ruminant meat is produced by pastoral systems, which is less the case in Canada/USA and the EU 27, for example).
According to our results, the Ultrap variant would allow the additional world food need up to 2050 to be met without an expansion in the agricultural land area. Hence this variant would probably allow forest cover to be maintained at the world level (+11 million ha).63
63. In each scenario, we estimate induced change in the forest land area assuming that all land coming into agriculture comes from forest land and all land going out from agriculture returns to forest use. This
Figure 14.8. World meat consumption in 2010 and in 2050 according to Alexandratos and Bruisma (2012) (FAO scenario) and the Agrimonde-Terra ’Metropolization’ scenario.
Source: GlobAgri-AgT and Alexandratos and Bruisma (2012).
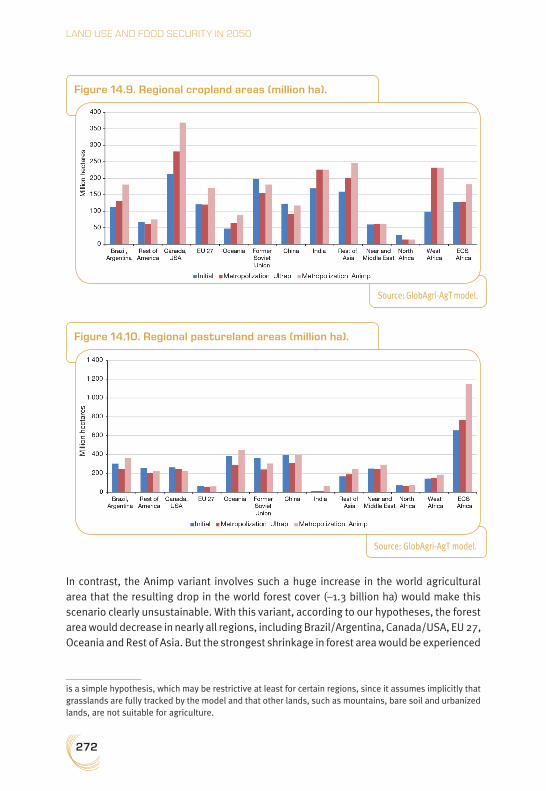
272
LAND USE AND FOOD SECURITY IN 2050
In contrast, the Animp variant involves such a huge increase in the world agricultural area that the resulting drop in the world forest cover (–1.3 billion ha) would make this scenario clearly unsustainable. With this variant, according to our hypotheses, the forest area would decrease in nearly all regions, including Brazil/Argentina, Canada/USA, EU 27, Oceania and Rest of Asia. But the strongest shrinkage in forest area would be experienced
is a simple hypothesis, which may be restrictive at least for certain regions, since it assumes implicitly that grasslands are fully tracked by the model and that other lands, such as mountains, bare soil and urbanized lands, are not suitable for agriculture.
Figure 14.9. Regional cropland areas (million ha).
Source: GlobAgri-AgT model.
Figure 14.10. Regional pastureland areas (million ha).
Source: GlobAgri-AgT model.
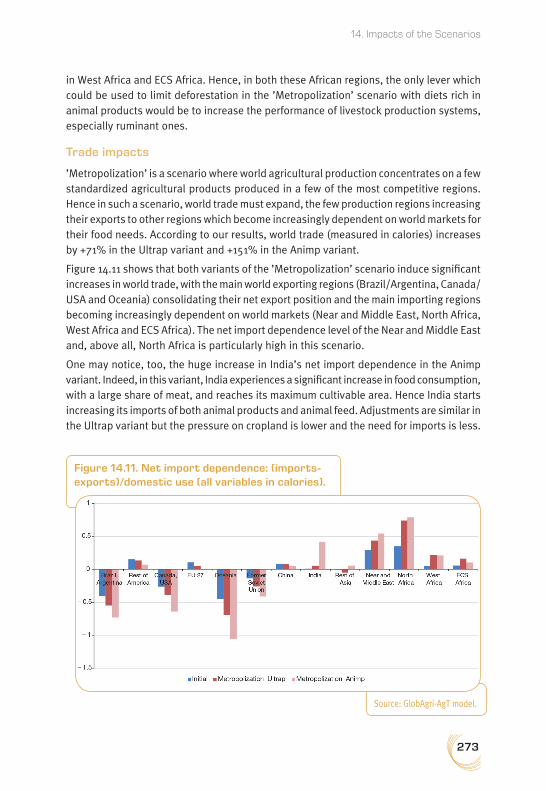
273
14. Impacts of the Scenarios
in West Africa and ECS Africa. Hence, in both these African regions, the only lever which could be used to limit deforestation in the ’Metropolization’ scenario with diets rich in animal products would be to increase the performance of livestock production systems, especially ruminant ones.
Trade impacts
’Metropolization’ is a scenario where world agricultural production concentrates on a few standardized agricultural products produced in a few of the most competitive regions. Hence in such a scenario, world trade must expand, the few production regions increasing their exports to other regions which become increasingly dependent on world markets for their food needs. According to our results, world trade (measured in calories) increases by +71% in the Ultrap variant and +151% in the Animp variant.
Figure 14.11 shows that both variants of the ’Metropolization’ scenario induce significant increases in world trade, with the main world exporting regions (Brazil/Argentina, Canada/USA and Oceania) consolidating their net export position and the main importing regions becoming increasingly dependent on world markets (Near and Middle East, North Africa, West Africa and ECS Africa). The net import dependence level of the Near and Middle East and, above all, North Africa is particularly high in this scenario.
One may notice, too, the huge increase in India’s net import dependence in the Animp variant. Indeed, in this variant, India experiences a significant increase in food consumption, with a large share of meat, and reaches its maximum cultivable area. Hence India starts increasing its imports of both animal products and animal feed. Adjustments are similar in the Ultrap variant but the pressure on cropland is lower and the need for imports is less.
Figure 14.11. Net import dependence: (imports-exports)/domestic use (all variables in calories).
Source: GlobAgri-AgT model.
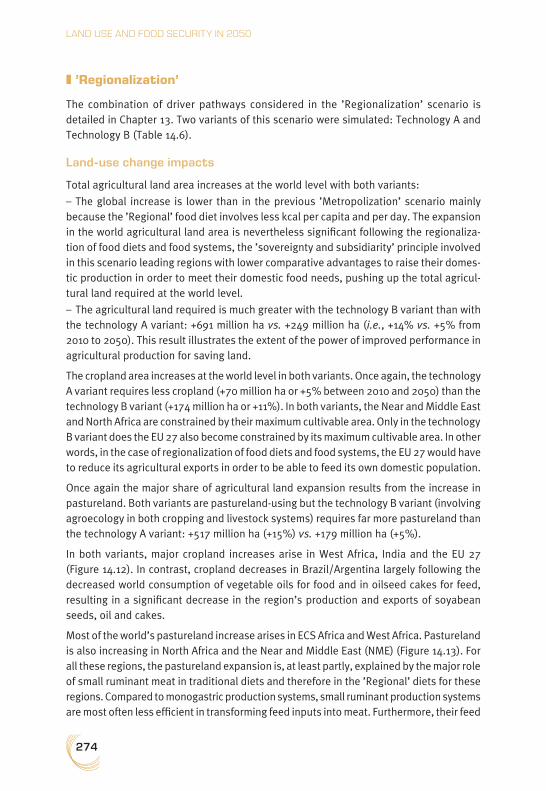
274
LAND USE AND FOOD SECURITY IN 2050
❚❚ ’Regionalization’
The combination of driver pathways considered in the ’Regionalization’ scenario is detailed in Chapter 13. Two variants of this scenario were simulated: Technology A and Technology B (Table 14.6).
Land-use change impacts
Total agricultural land area increases at the world level with both variants:
– The global increase is lower than in the previous ’Metropolization’ scenario mainly because the ’Regional’ food diet involves less kcal per capita and per day. The expansion in the world agricultural land area is nevertheless significant following the regionaliza-tion of food diets and food systems, the ’sovereignty and subsidiarity’ principle involved in this scenario leading regions with lower comparative advantages to raise their domes-tic production in order to meet their domestic food needs, pushing up the total agricul-tural land required at the world level.
– The agricultural land required is much greater with the technology B variant than with the technology A variant: +691 million ha vs. +249 million ha (i.e., +14% vs. +5% from 2010 to 2050). This result illustrates the extent of the power of improved performance in agricultural production for saving land.
The cropland area increases at the world level in both variants. Once again, the technology A variant requires less cropland (+70 million ha or +5% between 2010 and 2050) than the technology B variant (+174 million ha or +11%). In both variants, the Near and Middle East and North Africa are constrained by their maximum cultivable area. Only in the technology B variant does the EU 27 also become constrained by its maximum cultivable area. In other words, in the case of regionalization of food diets and food systems, the EU 27 would have to reduce its agricultural exports in order to be able to feed its own domestic population.
Once again the major share of agricultural land expansion results from the increase in pastureland. Both variants are pastureland-using but the technology B variant (involving agroecology in both cropping and livestock systems) requires far more pastureland than the technology A variant: +517 million ha (+15%) vs. +179 million ha (+5%).
In both variants, major cropland increases arise in West Africa, India and the EU 27 (Figure 14.12). In contrast, cropland decreases in Brazil/Argentina largely following the decreased world consumption of vegetable oils for food and in oilseed cakes for feed, resulting in a significant decrease in the region’s production and exports of soyabean seeds, oil and cakes.
Most of the world’s pastureland increase arises in ECS Africa and West Africa. Pastureland is also increasing in North Africa and the Near and Middle East (NME) (Figure 14.13). For all these regions, the pastureland expansion is, at least partly, explained by the major role of small ruminant meat in traditional diets and therefore in the ’Regional’ diets for these regions. Compared to monogastric production systems, small ruminant production systems are most often less efficient in transforming feed inputs into meat. Furthermore, their feed
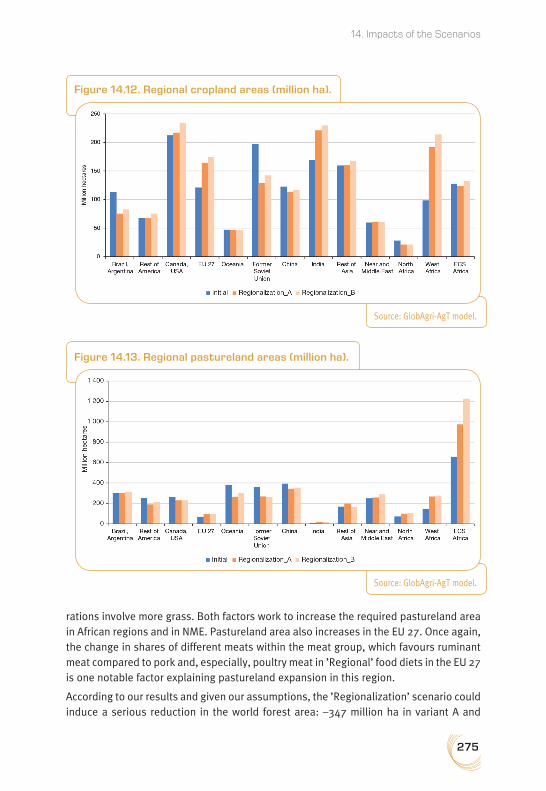
275
14. Impacts of the Scenarios
rations involve more grass. Both factors work to increase the required pastureland area in African regions and in NME. Pastureland area also increases in the EU 27. Once again, the change in shares of different meats within the meat group, which favours ruminant meat compared to pork and, especially, poultry meat in ’Regional’ food diets in the EU 27 is one notable factor explaining pastureland expansion in this region.
According to our results and given our assumptions, the ’Regionalization’ scenario could induce a serious reduction in the world forest area: –347 million ha in variant A and
Figure 14.12. Regional cropland areas (million ha).
Source: GlobAgri-AgT model.
Figure 14.13. Regional pastureland areas (million ha).
Source: GlobAgri-AgT model.

276
LAND USE AND FOOD SECURITY IN 2050
–768 million ha in variant B. Once again, this scenario appears unsustainable for ECS Africa and West Africa, both regions experiencing serious cuts in their forest area. This scenario would also raise difficulties for North Africa and India. Significant deforestation could arise in the EU 27 meaning that a regionalization of food diets and food systems in Europe would imply a drastic reduction in EU exports in order to limit the expansion of the agricultural land area.
Finally, our results show that the ’Regionalization’ scenario cannot be envisaged without a drastic improvement in the performance of cropping and, above all, livestock systems in ECS Africa and West Africa. The discrepancy between the extent of agricultural land expansion in ECS Africa under both agricultural technology variants A and B is particularly illuminating in this regard: +313 million ha with variant A vs. +573 million ha with variant B.
Trade impacts
’Regionalization’ is a scenario involving a decrease in inter-regional trade. Logically world agricultural trade therefore reduces in this scenario: –15% in both variants despite the increase in world population and the induced rise in world food consumption. However, international trade is far from disappearing and remains a key factor in the world food security equation.
Among the major world net exporting regions, Brazil/Argentina and Canada/USA experience a deterioration in their net export position, their trade partners reducing their import needs of both animal products and feed ingredients (Figure 14.14). Oceania and the FSU maintain their net export position in this scenario. For Oceania, one important reason is
Figure 14.14. Net import dependence: (imports-exports)/domestic use (all variables in calories).
Source: GlobAgri-AgT model.

277
14. Impacts of the Scenarios
the effect of small ruminant meat linked to ’Regional’ diets in some regions, while for the FSU a major factor is the increased exports of wheat.
The EU 27, China and the Rest of Asia all become nearly self-sufficient in the ’Regionalization’ scenario. In contrast to the previous ’Metropolization’ scenario, ’Regionalization’ allows West Africa and ECS Africa to stabilize or reduce their dependance on food imports, but at the cost of a significant expansion in agricultural land and the likely risk of further deforestation. As far as the NME and North Africa are concerned, the regionalization of food diets and food systems involved in the ’Regionalization’ scenario would lead to an increase of their dependency on food imports. However, the rise is lower than in the ’Metropolization’ scenario (whether it be the Ultrap or the Animp variant).
❚❚ ’Healthy’
The combination of driver pathways considered in the ’Healthy’ scenario is detailed in Chapter 13. Two variants of this scenario were simulated: Technology C and Technology D (Table 14.6).
We should note that technology D is similar to the previous technology B, while technology C differs from the previous technology A in the livestock system development pathway (’Agroecological livestock’ vs. ’Conventional intensive livestock with local resources’). Following our quantitative hypotheses, the performances of cropping systems, in terms of per-hectare yields, and of livestock systems, in terms of global feed-to-output ratios, are higher in the technology C variant than in the technology D variant. However, the gap between technologies C and D is lower than the gap between the previous technologies A and B since contrary to A and B, C and D use the same livestock system development pathway. Therefore, between C and D only the hypotheses for the future of cropping systems differ.
Land-use change impacts
Total agricultural land area increases at the world level with both variants: – The global increase is nevertheless sharply lower than in the previous ’Regionalization’
scenario, mainly because the ’Healthy’ scenario does not limit inter-regional trade. Compared to ’Regionalization’, ’Healthy’ also induces less kcal per capita and per day and less animal products in diets in developed and emerging regions, even if this is partly compensated by more kcal per capita and per day and slightly more animal products in diets in some developing regions (Figure 14.5 and Figure A2.1 in Appendix 2).
– The agricultural land required is much greater with the technology D variant than with the technology C variant: +269 million ha vs. +29 million ha (i.e., +5.5% vs. +0.6% from 2010 to 2050). The gap between the agricultural land required in each variant results only from the difference in the cropping systems pathway involved. The gap remains large partly because the ’Healthy’ diets involved in this scenario relies less on animal products (at least in developed and emerging regions) and more on diversified crops. Hence the performance of cropping systems in terms of per-hectare yields is essential with regards to the world agricultural land required by the ’Healthy’ scenario.

278
LAND USE AND FOOD SECURITY IN 2050
Finally, the above results suggest that faced with a significantly increasing world population, the ’Healthy’ scenario could be able to limit the expansion in world agricultural land.
The cropland area decreases at the world level with the C variant (–56 million ha or –4% from 2010 to 2050) but increases with the D variant (+50 million ha or +3%). In both variants, the NME and North Africa are constrained by their maximum cultivable land area. In both regions, tensions over cultivable land areas are stronger with technology D than with technology C.
Once again, and even if ’Healthy’ diets reduce the share of animal products in the average world diet between 2010 and 2050, a notable part of the agricultural land increase results from an increase in pastureland (+85 million ha or +2.5% with variant C and +219 million ha or +6.6% with variant D). Again, pastureland expansion arises in developing regions where the change towards healthier diets involves a rise in the share of animal products in diets from 2010 to 2050. This increase in the share of animal products compared to the initial situation is observed in West Africa, ECS Africa and India.
In both variants, major cropland increases are located in West Africa and India (Figure 14.15). In contrast, cropland decreases or is stable in all other regions. The case of Brazil/Argentina, which experiences a decrease in its cropland area, is interesting since a large share of the region’s agriculture has been shaped to fit the needs of the food and nutritional transition arising all over the world: increased food consumption with a rising share of animal products (particularly poultry meat) of vegetable oils and sugar and sweeteners. Following the ’Healthy’ scenario, world consumption of these products decreases significantly and Brazil/Argentina, as one of the world’s leading producers of animal feed, vegetable oils and sugar cane, must adapt its agriculture to the changing world food demand. Essentially, this
Figure 14.15. Regional cropland areas (million ha).
Source: GlobAgri-AgT model.

279
14. Impacts of the Scenarios
involves reducing its production of soyabean and replacing it with other crops which are in more demand at the world level in ’Healthy’ diets: mainly fruit and vegetables, pulses and other cereals. For instance, in the ’Healthy’ scenario, soyabean production in Brazil/Argentina decreases by –22% between 2010 and 2050, the quantity produced in 2050 being 60% less in the ’Healthy’ scenario than in the ’Metropolization_Animp’ scenario. In contrast, Brazil/Argentina experiences a +245% increase in its fruit and vegetable production, the quantity produced in 2050 being 179% higher in the ’Healthy’ scenario than in the ’Metropolization_Ultrap’ scenario.
Most of the world’s pastureland increase arises in ECS Africa and West Africa (Figure 14.16). This is not surprising since for both regions, as already mentioned, the ’Healthy’ diet involves an increasing share of animal products compared to 2010. This is not the case in most of the other regions.
As the ’Healthy’ scenario results in agricultural land expansion at the world level, even this scenario could induce some further deforestation. However, the extent of the expansion in agricultural land is significantly lower in this scenario than in both the previous ones, so the likely extent of deforestation is smaller (–63 million ha with the C variant and –279 million ha with the D variant, given our assumptions). Most of this deforestation would take place in ECS Africa. In contrast, Canada/USA, FSU and China could expand their forest area with the ’Healthy’ scenario.
Finally, our results show that the ’Healthy’ scenario uses the least agricultural land compared to Agrimonde-Terra’s other scenarios. It is the only scenario which makes it possible to feed in a healthy way the growing world population while limiting agricultural land expansion and deforestation at the world level. However, even this scenario seems
Figure 14.16. Regional pastureland areas (million ha).
Source: GlobAgri-AgT model.
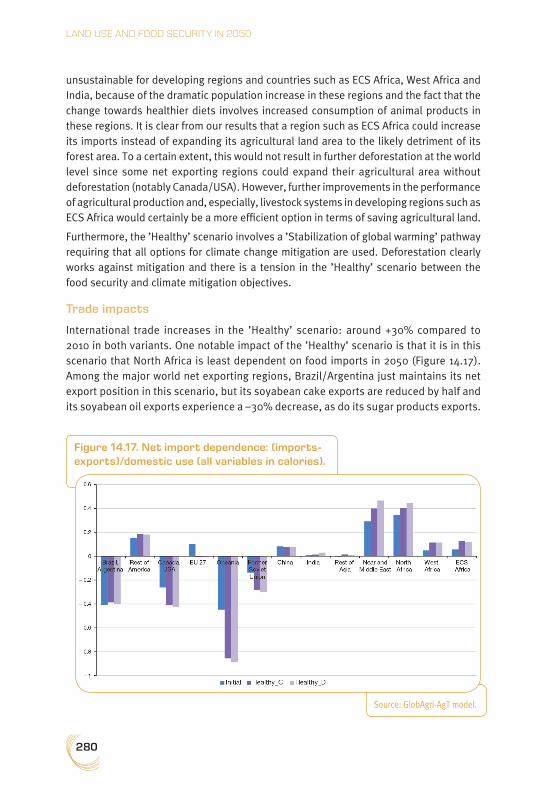
280
LAND USE AND FOOD SECURITY IN 2050
unsustainable for developing regions and countries such as ECS Africa, West Africa and India, because of the dramatic population increase in these regions and the fact that the change towards healthier diets involves increased consumption of animal products in these regions. It is clear from our results that a region such as ECS Africa could increase its imports instead of expanding its agricultural land area to the likely detriment of its forest area. To a certain extent, this would not result in further deforestation at the world level since some net exporting regions could expand their agricultural area without deforestation (notably Canada/USA). However, further improvements in the performance of agricultural production and, especially, livestock systems in developing regions such as ECS Africa would certainly be a more efficient option in terms of saving agricultural land.
Furthermore, the ’Healthy’ scenario involves a ’Stabilization of global warming’ pathway requiring that all options for climate change mitigation are used. Deforestation clearly works against mitigation and there is a tension in the ’Healthy’ scenario between the food security and climate mitigation objectives.
Trade impacts
International trade increases in the ’Healthy’ scenario: around +30% compared to 2010 in both variants. One notable impact of the ’Healthy’ scenario is that it is in this scenario that North Africa is least dependent on food imports in 2050 (Figure 14.17). Among the major world net exporting regions, Brazil/Argentina just maintains its net export position in this scenario, but its soyabean cake exports are reduced by half and its soyabean oil exports experience a –30% decrease, as do its sugar products exports.
Figure 14.17. Net import dependence: (imports-exports)/domestic use (all variables in calories).
Source: GlobAgri-AgT model.

281
14. Impacts of the Scenarios
On the other hand, Brazil/Argentina increases its exports of the products most in demand on the world markets: fruit and vegetables and other cereals. In contrast, the FSU consolidates its net export position in the ’Healthy’ scenario. The main reason is that this region has some comparative advantages for wheat and other cereals. As change towards healthier diets involves increasing the share of cereals in diets, especially in developed and emerging regions, and increasing the share of other cereals within the cereal group, the ’Healthy’ scenario makes the FSU region better positioned on world markets than other scenarios.
❚❚ ’Communities’
The combination of driver pathways considered in the ’Communities’ scenario is detailed in Chapter 13. Two variants of this scenario were simulated: Agroecology (AE) and Collapse.
We should note that the Agroecology variant is similar to the previous technology D. Following our quantitative hypotheses, the performances of cropping systems, in terms of per-hectare yields, and of livestock systems, in terms of global feed-to-output ratios, are higher in the AE variant than in the collapse variant. In the latter, per-hectare yields do not increase relative to 2010, but are affected by climate change (’Moderate warming’ pathway) while feed-to-output ratios do not decrease relative to 2010. In other words, ’Communities with collapse’ is the worst of our scenarios regarding the performance of agricultural production systems in 2050 all over the world.
Land-use change impacts
The total agricultural area increases in both variants: +142 million ha (or +3% between 2010 and 2050) in the AE variant and 2 billion ha (or +41%) in the collapse variant. So, the total agricultural area expands dramatically in the collapse variant and, once again, this result perfectly illustrates the extent of the power of increased performance of agricultural production to save agricultural land.
The ’Communities’ scenario involves the ’Regional’ diets but with a –10% decrease in daily calorie availability per capita in all regions except ECS Africa and India. Hence our results suggest that faced with a significantly increasing world population, the collapse variant would lead to dramatic consequences both in terms of food security and the expansion of agricultural land. The agricultural land expansion is much more limited in the AE variant, where the reduction in daily calorie availability and the shift to agroecology work together against the land-using impact of an increase in world population.
Overall, our results suggest that the growth in world population makes it necessary to improve the performance of agricultural production systems (as measured by per-hectare yields and feed-to-output ratios) at least in some regions, so as to ensure that the world’s food needs can be met without dramatically expanding the agricultural land area at the world level.
Cropland area increases at the world level in both variants: +277 million ha (or +18% between 2010 and 2050) in the AE variant and +555 million ha (or +36%) in the collapse
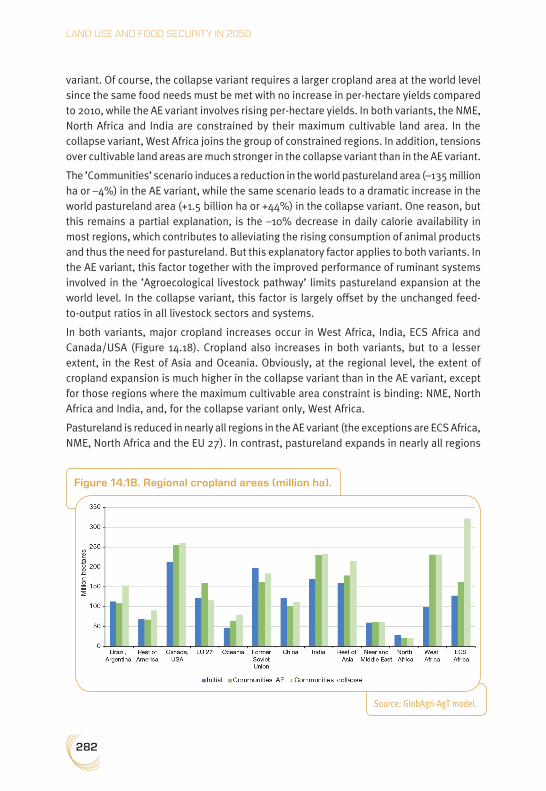
282
LAND USE AND FOOD SECURITY IN 2050
variant. Of course, the collapse variant requires a larger cropland area at the world level since the same food needs must be met with no increase in per-hectare yields compared to 2010, while the AE variant involves rising per-hectare yields. In both variants, the NME, North Africa and India are constrained by their maximum cultivable land area. In the collapse variant, West Africa joins the group of constrained regions. In addition, tensions over cultivable land areas are much stronger in the collapse variant than in the AE variant.
The ’Communities’ scenario induces a reduction in the world pastureland area (–135 million ha or –4%) in the AE variant, while the same scenario leads to a dramatic increase in the world pastureland area (+1.5 billion ha or +44%) in the collapse variant. One reason, but this remains a partial explanation, is the –10% decrease in daily calorie availability in most regions, which contributes to alleviating the rising consumption of animal products and thus the need for pastureland. But this explanatory factor applies to both variants. In the AE variant, this factor together with the improved performance of ruminant systems involved in the ’Agroecological livestock pathway’ limits pastureland expansion at the world level. In the collapse variant, this factor is largely offset by the unchanged feed-to-output ratios in all livestock sectors and systems.
In both variants, major cropland increases occur in West Africa, India, ECS Africa and Canada/USA (Figure 14.18). Cropland also increases in both variants, but to a lesser extent, in the Rest of Asia and Oceania. Obviously, at the regional level, the extent of cropland expansion is much higher in the collapse variant than in the AE variant, except for those regions where the maximum cultivable area constraint is binding: NME, North Africa and India, and, for the collapse variant only, West Africa.
Pastureland is reduced in nearly all regions in the AE variant (the exceptions are ECS Africa, NME, North Africa and the EU 27). In contrast, pastureland expands in nearly all regions
Figure 14.18. Regional cropland areas (million ha).
Source: GlobAgri-AgT model.
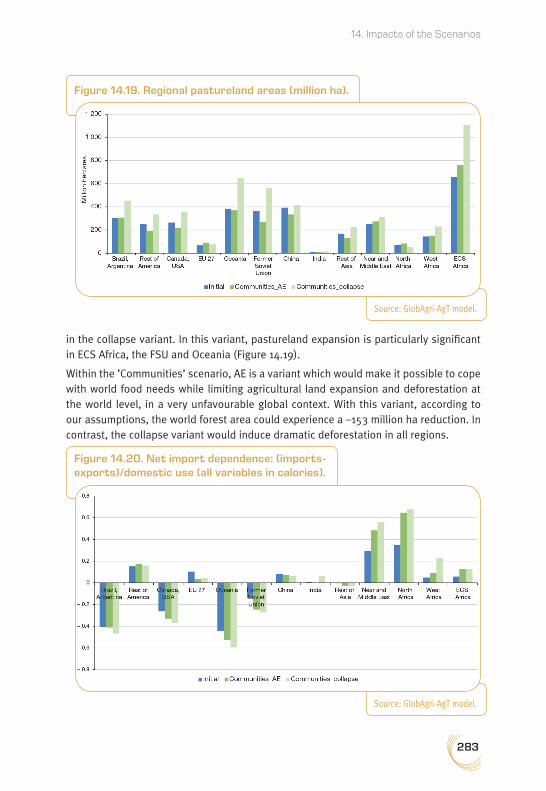
283
14. Impacts of the Scenarios
Figure 14.19. Regional pastureland areas (million ha).
Source: GlobAgri-AgT model.
in the collapse variant. In this variant, pastureland expansion is particularly significant in ECS Africa, the FSU and Oceania (Figure 14.19).
Within the ’Communities’ scenario, AE is a variant which would make it possible to cope with world food needs while limiting agricultural land expansion and deforestation at the world level, in a very unfavourable global context. With this variant, according to our assumptions, the world forest area could experience a –153 million ha reduction. In contrast, the collapse variant would induce dramatic deforestation in all regions.
Figure 14.20. Net import dependence: (imports-exports)/domestic use (all variables in calories).
Source: GlobAgri-AgT model.
284
LAND USE AND FOOD SECURITY IN 2050
Trade impacts
Despite the fragmented world involved in the global context of the ’Communities’ scenarios, our results suggest that international trade would increase in this scenario to meet regional food needs: +20% to +30% compared to 2010 according to both variants (Figure 14.20).
Conclusion: the main limits of both the model and the quantitative analysis
As the main insights that can be drawn from the quantitative anlaysis are the core of Chapter 16, we conclude here by reporting and discussing the main drawbacks of the model we use and the main limits of the quantitative analysis as a whole.
The GlobAgri-AgT model is a biomass balance model. As such it suffers from several limits:
– There is not a vector of prices, which in usual economic models act as signals to both consumers and producers on the extent of resource scarcity or abundance and give them incentives to change their plans accordingly. In such economic models, world agricultural land expansion would have probably been more limited than in our analysis since price increases, resulting from stronger tensions over the land resource, would have led, on the one hand, to consumers adjusting their consumption, changing their diets towards cheaper products and probably reducing their consumption of animal products, especially meat, and, on the other, to producers adjusting their production decisions, substituting more expensive inputs (e.g., land) with cheaper inputs (e.g., fertilizers) and in so doing increasing yields so as to limit the expansion in land area. Such mechanisms which alle-viate adjustments in quantities (such as the additional land area required, for instance) because of the price adjustments, are not in force in GlobAgri-AgT and the extent of the impacts of scenarios in terms of agricultural land expansion are most likely exacerbated.
– The structure of trade is very rigid: for each region, imports are a fixed proportion of domes-tic use and exports are a constant share of the world market. Unless one region reaches its maximum cultivable area, nothing changes. This rigidity of trade flows also induces higher agricultural land expansion impacts than the ones we would have obtained from an eco-nomic model, where trade flows adjust to the relative price changes. Let’s take the very simple case of ECS Africa, which in all our scenarios experiences a very significant expan-sion in its agricultural land area. In a model where trade flows react to price changes, ECS Africa would gain by increasing the imported share of its food needs and limiting the rise in domestic production because of the low productivity of its agriculture relative to other world regions. At the world level, this would result in a lower requirement for agricultural land since the additional food needs of ECS Africa would be produced in world regions exhi-biting the highest agricultural productivity. Such a mechanism arises in the GlobAgri-AgT model only in regions which are constrained in terms of cultivable land. In regions where cultivable land is abundant, such as ECS Africa for instance, this mechanism never arises and also exacerbates the extent of our agricultural land expansion impacts.
285
14. Impacts of the Scenarios
– There are other rigidities in our model, such as no substitution between products on the food demand side, but also within feed rations at the livestock production system level, and on the supply side. Even if the consequences of these rigidities on the extent of our agricultural land expansion impacts are less obvious, one could guess that they exacerbate adjustments in quantities since they impede part of the required adjustments to be made through prices.
Our quantitative results depend directly on how we translated quantitatively the hypotheses for the future up to 2050 of the various drivers of our system. Among all our assumptions, at least three are questionable and would need further work:
– Due to the lack of data on the maximum land area available to agriculture (involving both cropland and pastureland) in each region, we decided to put an upper limit on the cropland area only, letting the pastureland adjust freely. As a result, some Agrimonde-Terra scenarios lead to very large pastureland expansion at the world level and especially in some regions. In some cases, the pastureland expansion simulated is clearly unreaso-nable. Putting an upper limit on total agricultural land or putting upper limits on both cro-pland and pastureland would have avoided such situations. The question here is what kind of data we should use to estimate the upper limit for pastureland by region (Chapter 4).
– As far as hypotheses on the future of cropping systems are concerned, we assumed in our quantitative analysis that on average crop yield growth up to 2050 is greater in the ’Conventional intensification’ pathway than in both the ’Sustainable intensification’ and ’Agroecology’ pathways. These hypotheses are controversial and were extensively discussed with Agrimonde-Terra’s Scenario Advisory Committee. Our quantitative results indicate that our hypotheses are crucial regarding the land-use change impacts of the Agrimonde-Terra scenarios. The implications of our quantitative hypotheses regarding the future of cropping systems are obvious when comparing the results of both variants of the ’Healthy’ scenario, which differ only through their respective cropping system hypotheses (techno-logy C involving the ’Sustainable intensification’ pathway vs. technology D involving the ’Agroecology’ pathway): +29 million ha vs. +269 million ha expansion in agricultural land at the world level. Clearly further work is needed to add to our knowledge on the relative tech-nical, economic, social and environmental performance of the different cropping systems.
– Regarding the hypotheses on the future of livestock systems, we already mentioned that we faced some difficulties in translating our livestock system development pathways into quantitative hypotheses and we were forced to adopt somewhat restrictive assumptions. Specifically, as far as the feed-to-output coefficients are concerned, we used the projec-tions up to 2030 suggested by Bouwman et al. (2005) to calibrate the change in these coefficients up to 2050 under our various pathways. We believe that Bouwman et al.’s projections are rather conservative compared to the changes in technical performance of livestock system scenarios considered in other studies. Given the key importance of the projected changes in livestock system performance regarding land-use change and, more specifically, pastureland expansion, we clearly need further work on how to cali-brate the change in feed-to-output ratios up to 2050 in our different livestock system development pathways. More generally, further work is needed on the quantitative trans-lation of our livestock system development pathways.
286
15. Regional Dimension of the Agrimonde-Terra Scenarios: The Example of sub-Saharan AfricaMarie de Lattre-Gasquet, Clémence Moreau and John Okul64
Introduction
The Agrimonde-Terra team and Scenario Advisory Committee found it insightful to contextualize the five Agrimonde-Terra scenarios. Given the challenges in sub-Saharan Africa (SSA), it was decided to focus on this very large and diverse region. There are several ’Africas’ even if there is a tendency to look at sub-Saharan Africa as one entity because of its limited role in the global economy (Hugon, 2016). Over past decades as in recent years, the growth momentum in sub-Saharan Africa has been very fragile. However, every year the gross domestic product (GDP) of several African countries grows by more than 7% while others record a very bad performance (IMF, 2017). Growth spells are frequent, both among resource-intensive and non-resource-intensive countries, but they tend to be shorter than in other regions of the world and to be characterized by large swings in growth which have a detrimental impact on investment and living conditions (IMF, 2017). The contribution of agriculture to GDP also varies highly among countries, from nearly 60% to less than 5% (IMF, 2016), but on average agriculture still occupies more than 58% of the economically active population (FAO, 2011a). Population growth has been very rapid between 1960 (221 million inhabitants) and 2015 (969 million inhabitants) (United Nations, World Population Prospects, 201765), but there are vast differences in population numbers and densities between countries (Losch et al., 2013). A number of countries contain large rural populations clustered in very small areas, while eight countries have low population densities over very large areas of arable land (Jayne et al., 2014,
64. The authors thank Oluwabunmi Ajilore, Philippe Hugon and Véronique Lamblin for their comments.
65. https://esa.un.org/unpd/wpp/
287
15. Regional Dimension of the Agrimonde-Terra Scenarios
p.1).66 The prevalence of hunger in SSA has declined by –31% between 1990 and 2015, but one person in four is still undernourished and significant proportions of children are underweight, stunted or manifest various forms of undernutrition (FAO, 2015b). Western Africa has made significant progress towards the reduction of undernourished people, despite significant population growth and recurrent droughts in Sahel countries. Other sub-regions (especially Eastern and Central Africa with, respectively, 28% and 31% of the population suffering from food insecurity) experienced an increase in the absolute number of undernourished people, largely due to civil unrest, political instability, insufficient income and unfavourable climatic conditions (FAO, 2015b).
Past and on-going trends relative to the five dimensions of land use in SSA are presented in Chapter 5. In this chapter, we examine the trends in sub-Saharan Africa towards the different hypotheses for the future of external and direct drivers (Chapters 6 to 12), which have been used to build the five Agrimonde-Terra scenarios (Chapter 13). Then we look at the main on-going trends towards each scenario and we present how land use and food security would be in 2050 in SSA given the combination of assumptions. Sub-Saharan Africa is unique because on-going trends can be found towards all the scenarios identified by Agrimonde-Terra. In no other region of the world have the Agrimonde-Terra team and the Scenario Advisory Committee identified such a diversity of pathways. This diversity may represent an opportunity for the future of land use and food security in sub-Saharan Africa if local stakeholders and policymakers identify the trajectory(ies) that will lead to food security, especially local access to food (Bourgeois and Losch, 2017). They represent a threat, however, if no strategic choices are made as some pathways are contradictory. We conclude the chapter by suggesting some levers for action.
As a foresight process requires the participation of stakeholders with various competencies (Godet, 1994; Havas et al., 2010; Bingley, 2016) but is costly in terms of time and money, this preliminary analysis can provide a basis for further discussions for the construction of land use and food security scenarios in sub-regions and countries of SSA, as has been done in Tunisia (de Lattre-Gasquet et al., 2017a).
Trends in external drivers of change
We analyse here on-going trends and weak signals in SSA relative to the external drivers of change, i.e. the political, economic and social context, climate change and food diets, and use as a framework the hypotheses for the future presented in Chapters 6, 7 and 8. For ease of understanding, the names of these hypotheses are written in italics.
66. Democratic Republic of Congo, Angola, Congo, Zambia, Cameroon, Mozambique, Central African Republic and Gabon (source: Jayne et al., 2014, table 1).
288
LAND USE AND FOOD SECURITY IN 2050
❚❚ Trends relative to the political, economic and social context in SSA
In brief: there are concomitant on-going trends towards three hypotheses: ’Political and economic fragmentation’, ’Regionalization and energy transition’ and ’Conventional development led by market forces’, the latter two reinforcing fragmentation. Emerging trends are identified towards the hypotheses ’Non-state actors’ and ’Sustainable and cooperative world’, though the trends towards the latter assumption are weaker.
Population growth is a major marker of land use and food security at the SSA and household levels in 2050. Agrimonde-Terra has adopted the same demographic hypothesis for its five scenarios, based on UN World Population Prospects (2015 revision): from 2010 to 2050, population will increase by 192% in West Africa and by 155% in ECS Africa. By 2050, SSA’s population is expected to reach almost 2.2 billion people (compared to 969 million in 2015), representing 23% of the global population (UN Population Prospects, 2015 revision). Youth aged 15 to 24 will account for 30% of the world’s youth. The SSA youth will be both a great opportunity and a challenge for land use. On the one hand, the inactive population (youths under 18 years old) will decrease and the level of dependence on the productive and economically active population will be reduced. On the other hand, the rapid growth in the size of the workforce (around +789 million until 2050 according to ILO, 2017) will increase the pressure on labour markets which are already close to saturation, and influence structural changes and agricultural choices. However, this evolution should not hide the fact that SSA is also an ageing continent thanks to improvements in healthcare and sanitation. Also, SSA will be the only region of the world where the rural population and rural density will be growing well beyond 2050 (ILO, 2017). Therefore, in the five Agrimonde-Terra scenarios the total and rural population growth will increase tensions between uses and users of land and water (agriculture, livestock farming, urbanization and mining) (Losch et al., 2016).
There are strong on-going trends towards the hypothesis ’Political and economic fragmentation’. First, the region suffers from political instability which has caused the deaths and displacement of millions of people and has a negative impact on land use and food security. Some conflicts involve States, while others are more localized (Williams, 2011); people fight over natural resources, over religion, over political power, or ethnic groups do not get along. Second, many governments and institutions are weak and do not exercise their regulatory functions; their administrations are inefficient; some countries spend a high proportion of their budget on the army. Corruption is widespread (Kodila-Tedika and Bolito-Losembe, 2014), leading to clientelistic networks, illegal and informal trade and land grabbing. The informal economy is an important component of the economies of most countries contributing between 25 and 65% of GDP and between 30 and 90% of total non-agricultural employment (IMF, 2017). Oil exporting countries tend to have a larger share of informal economy than low-income and the middle-income countries (IMF, 2017). Third, the economic transition is incipient (Losch, 2016). SSA’s economy grew at an annual average rate of about 5% in the pre-global financial crisis

289
15. Regional Dimension of the Agrimonde-Terra Scenarios
period (1995-2008) and at 3.9% between 2011 and 2016 (World Bank, 2016), but some countries manage far better than others and, within a country, some groups improve their economic situation while others become poorer. The share of agricultural products in the total exports of African goods and services has considerably decreased over the past 15 years to the advantage of extractive products, and many African countries are therefore highly dependent on international market prices and vulnerable to unfair trade practices (FAO, 2017c). Agriculture still occupies 58.4% of the economically active population (FAO, 2011a), reaching 75% or more in certain Sahel and East African countries (ILO, 2017). It is a prominent occupation not only for the rural population, but also for people in urban and peri-urban areas. However, for small farmers, especially women, insecurity in access to land remains despite the fact that, in recent years, land tenure systems have evolved in a number of countries. The role of women in agricultural activities is growing; they represented 45% of the labour force in 1980 and 50% in 2010 (FAO, 2011a). There are, however, regional as well as national differences; the averages for women’s agricultural activities range from just over 40% in Southern Africa to just over 50% in Eastern Africa (FAO, 2011a). However, the performance of agriculture over the decades has been characterized by ups and downs (Losch et al., 2013). Shortage of electricity infrastructure undermines efforts to achieve social and economic development; half of the population lives without access to electricity and this figure is rising (IEA, 2014). Many households rely on solid biomass (fuelwood and charcoal) for cooking, with significant negative environmental and health impacts. Also, most national agricultural research systems are small, fragmented, lack human and financial resources, and still tend to focus on a large range of issues (Beintema and Stads, 2017). On average, in 2011, the per capita spending on agricultural research in poor countries was $1.51, compared to $17.73 in rich countries (Pardey et al., 2016) and population growth accentuates this gap. In SSA, while the number of agricultural researchers increased during the period 2000–2014, a very large share of senior and qualified researchers were approaching retirement (Beintema and Stads, 2017). Fourth, health problems are important obstacles to development. According to the International Finance Corporation, SSA has 11% of the world’s population but carries 24% of the global disease burden. Infrastructure is insufficient to provide even basic healthcare to the population. Human diseases (e.g., malaria, trypanosomiasis, diarrhoea and HIV/AIDS) significantly impact the productivity of the labour force and animal diseases (especially trypanosomosis) impede the development of livestock farming.
There are also strong on-going trends towards ’regionalization and energy transition’. More than 200 regional organizations and commercial agreements are responsible for the development of regionalization processes in SSA. This is the de jure regionalization process as opposed to de facto regionalization (Hugon, 2016) which is the result of commercial, financial, cultural and technological networks. The first form of regionalization has been reinforced with the creation of NEPAD (New Partnership for African Development) and is particularly active in Eastern and Southern Africa. The second form of regionalization is linked to intra-SSA mobility. Trust-based cross-border mobility involves grassroots non-state actors (Nshimbi, 2015); it leads to the mobility of people, animals, and goods and

290
LAND USE AND FOOD SECURITY IN 2050
contributes to regional integration. Sub-Saharan Africans move first within Africa (nearly 75% of movements) and to neighbouring countries (Mercandalli and Losch, 2017). West Africa, East Africa and, to a lesser extent, Southern Africa are the most dynamic regions in terms of sending and receiving countries, with Ivory Coast, South Africa, Nigeria, Kenya and Ethiopia being the top five receiving countries (Mercandalli and Nshimbi, 2016). African and non-African ethnic groups play a major role in intra-regional trade. The share of official intra-African trade in total trade has fallen from around 20% in the mid-1990s to 12% in 2015, which is low compared to other continents (UNCTAD statistics). This decline is due to the fact that African trade with the rest of the world has grown much faster than intra-African trade and that informal trade is not taken into account in official statistics. Adding informal trade to official trade figures would increase the share of intra-African trade in total trade to the levels observed in Latin America and the Caribbean (UNCTAD, 2013). The Southern African Development Community (SADC), for example, estimates that informal trade accounts for between 30 and 40% of intra-SADC trade (Koroma et al., 2017). SSA’s renewable energy resources (solar, hydro, wind and geothermal), although spread unevenly across the continent and at a different stage of development, are sufficient to meet current and foreseeable future needs (IEA, 2014).
There are also a number of trends towards the assumption ’conventional development led by market forces’ and globalization. First, economic growth and insertion in the global economy are developing. According to the World Bank (2016), “established growth performers” (Ethiopia, Mali, Mozambique, Rwanda and Tanzania) and “improved performers” (Benin, Cameroon, Ivory Coast, Democratic Republic of Congo, Kenya, Senegal and Togo) contribute to 21% of Africa’s output. A few have diversified economies with significant industrial development (e.g., South Africa), in other countries the mining industry financed by foreign investments plays a major role (e.g., Botswana, Nigeria, Angola, Congo, Equatorial Guinea and Gabon) (UNECA, 2011), while others rely mostly on exports of non-processed and processed agricultural products. Integration in global value chains is nevertheless limited due to lack of infrastructure, including large harbours. Lebanese, Indian and Chinese networks play an important role in this evolution (Hugon, 2016). Second, external funds are flowing to SSA. These are foreign aid and foreign investments; the latter have quadrupled since 2000 (OECD/FAO, 2016), mostly targeting the exploitation of natural resources with a rapid rate of return, and aimed at establishing markets. Malaysia, China and India were among the top five investors in Africa in 2013, together with France and the United States (UNCTAD, 2013). Third, a service-based economy (e.g., banking, telecommunications and retailing) is developing in cities. Agricultural research and innovation receive significant funding from a large number of bilateral and multilateral donors, development banks and private foundations (Beintema and Stads, 2017). Several countries, including Ivory Coast, Ghana and Tanzania, have established funding systems that mobilize private-sector resources. Agricultural input firms have established research and development facilities in some countries (e.g., Monsanto in Burkina Faso, Kenya, Malawi, South Africa and Zimbabwe). Fourth, international institutions have promoted land registration and titling and the transformation of existing land rights “into individualized,
291
15. Regional Dimension of the Agrimonde-Terra Scenarios
tradable assets that can circulate within a market economy” (Boone, 2017). A number of governments are also revising their land tenure legislation and reforming institutions for the administration of individual rights (Toulmin, 2009). This and other measures can create a favourable climate for foreign investments, including in agriculture.
There are strong trends towards the assumption ’Dominance of non-state actors’. First, there are many initiatives by non-state actors. Traditional institutions and leaders and family heads still play a significant role in land management in a number of localities and countries, and many African farmers still hold their land through forms of customary tenure. The weak state syndrome has permitted religious and non-governmental organizations (NGOs), philanthropic foundations, as well as non-African traders and corporations to exert a strong influence. Recently, young and creative Africans (called the “cheetah generation” by George Ayittey) and the African diaspora have started to influence politics and economy. Their actions supplement the weak national and local institutions, even if their impact can be constrained by the inefficiencies of these institutions. Second, there is an evolution towards the digitalization of relationships. Under the lead of Senegal and Kenya, SSA is going digital. For mobile telephones, the penetration level in 2015 was approaching 50%, and the growth rate in subscriptions is the highest globally (GSMA, 2016). Small entrepreneurs and large corporations are developing web activities and starting to impact activities such as financial services, education, retail and agriculture, health and government. Mobile money is also used by businesses, such as commodity shops and agricultural businesses. Connectivity is a major driver of rural livelihood transformations and local development and creates labour opportunities. Third, a number of non-state actors, i.e. heads of families, customary chiefs and local institutions play an important role in land allocation and management. Also a mix of individual farmers, farmer organizations, research, extension services, NGOs, private entrepreneurs and externally-funded projects are often involved in agricultural innovations (Triomphe et al., 2017).
Finally, there are weak signals towards the assumption ’a sustainable and cooperative world’. SSA’s voice in global governance is starting to be better heard. SSA is far more stable and better governed now than at any other time since independence (WEF, 2015). Over the past five years, a number of peaceful elections at the national level have taken place and civil society organizations have been instrumental in agitating for political pluralism, decentralization of resources and respect for human rights and the rule of law. As far as land is concerned, there are still customary practices favouring common property management, for example local agreements (conventions locales) for resource management in the West African Sahel, hillside enclosures in Ethiopia and community land registration in Mozambique (Toulmin, 2009). There have been significant increases in the coverage of mobile telephone services which create opportunities for social and economic inclusion (UNECA, 2017). Young Africans are increasingly returning home to pursue a career after an education abroad (ACET, 2014), thus contributing to the transformation of economic and social models. There has been a marked increase in foreign direct investment, which is a sign of confidence, and some countries are setting up rules for investments in agriculture and other sectors. Employment in the service sector (retail,

292
LAND USE AND FOOD SECURITY IN 2050
transport, distribution etc.) and the development of information and communication technologies are facilitating linkages between people (WEF, 2015). An increasing number of African governments are providing agricultural services, at least in the area of staple food production. As far as research and innovation are concerned, farmer participatory approaches and farming system research are critical components of agricultural research and have evolved over time (Norman and Atta-Krah, 2016), and there are trends towards multi-stakeholder processes in agricultural research (Hiwasaki et al., 2016).
❚❚ Trends relative to climate change67
In brief: SSA is suffering heavily from ’rapid climate change’. It is not a major contributor to climate change and it has the potential to contribute to the ’stabilization of global warming’.
There are many trends in SSA towards the assumption ’runaway climate change’. Observed temperatures within the African continent have shown a warming trend since the 1960s (IPCC, 2007). Agriculture is considered particularly vulnerable due to the extensive reliance on rainfed crop production (about 96% of all agricultural land according to Aquastat), high intra- and inter-seasonal climate variability, recurrent drought and floods that affect both crops and livestock and increase spoilage, and limited economic and institutional capacity to adapt to climate change.68,69 Deforestation and emissions taking place on the farm and in the first steps of the supply chain contribute to agricultural greenhouse gas emissions; this is exacerbated by inadequate infrastructure and market access in many areas, leading to high levels of waste on the farm and during post-harvest handling.70 Assessments of the impact of climate change on SSA are associated with wide confidence intervals due to the poor quantity and quality of historical agricultural data and a lack of reliable data on soil properties and management practices (Schlenker and Lobell, 2010; Lobell et al., 2011; Roudier et al., 2011). A median value for yield loss of around –11% (–15% for the most intense warming scenarios) with, however, a large dispersion of projections, ranging from a loss of –50% to a yield increase of +90% is projected (Roudier et al., 2011; Schlenker and Lobell, 2010). Results indicate median changes in aggregate production by –22%, –17%, –17%, –18% and –8% for maize, sorghum, millet, groundnut and cassava, respectively. Given the pivotal role of temperature changes, yield reductions are likely to occur in regions which are more sensitive to temperature changes, such as the Sudan region (southern Senegal, Mali, Burkina Faso, Northern Togo and Benin), than in regions which are more sensitive to rainfall changes, such as the Sahel region (Niger, Mali, Northern Senegal and Burkina Faso) (Sultan et al., 2013). Projections of local sea-level rises along sub-Saharan coastlines tend to be around 10% higher than the global average. The sea level is projected to rise between 0.4 metres and 1.15 metres in a 4°C world, with a median
67. This section has been mainly written by Thierry Brunelle (CIRAD).
68. http://www.fao.org/NR/WATER/AQUASTAT/tables/WorldData-Irrigation_fra.pdf
69. http://www.intensafrica.org/pathways/
70. https://ccafs.cgiar.org/fr/blog/big-facts-focus-sub-saharan-africa#.WQC2pk21uDY
293
15. Regional Dimension of the Agrimonde-Terra Scenarios
rise of 0.65 metres by the end of the century (Serdeczny et al., 2016). Furthermore, energy demand is growing with rapid population growth.
There are weak signals towards the assumption of ’stabilization of global warming’. SSA has untapped renewable energy resources: solar across the entire continent, hydro in many countries, and wind mainly in coastal areas and geothermal in the East African Rift Valley (IEA, 2014). Also, big trees in the Congo Basin, extensive rangelands in West and Southern Africa and agroforestry offer the potential for carbon capture. Cocoa and coffee production, which have contributed to deforestation in the past is increasingly managed under agroforestry systems, and thus contribute to the reduction of greenhouse gas (GHG) emissions by sequestering carbon in trees and soils and by reduced reliance on synthetic fertilizers (Vaast et al., 2016). All SSA countries have ratified the United Nations Framework Convention on Climate Change (UNFCCC), two-thirds have submitted their National Adaptation Programme of Action and 22 countries have submitted Nationally Appropriate Mitigation Actions to the UNFCCC (Nkonya et al., 2016).
❚❚ Trends relative to food diets
In brief: the ’regional diversity of diets and food systems’ remains strong, but a ’transition to ultra-processed foods and modern value chains’ is taking place. There are only weak signals towards ’healthy diets based on food diversity’, and no trends towards ’transition to diets based on animal products’. Figure 15.1 presents the average diets in SSA and ECS Africa in 2010’s initial situation and by 2050 under the various hypotheses for the future of food diets.
’Regional diversity of diets and food systems’ is still high. Diets consist mainly of cereal or root staple crops and very little in the way of animal source proteins (Fanzo, 2012). The self-sufficiency ratio for the five main cereals (maize, millet, rice, sorghum and wheat) was 0.82 for SSA as a whole in the 2010s (van Ittersum et al., 2016). In West and Central African cities, local starchy products (maize, cassava, sorghum and, to a lesser extent, yam and plantain) are still heavily consumed. Animal and sauce products (vegetables, legumes, oils, sugar and condiments), fruit and beverages are mainly locally sourced (Bricas et al., 2016). In the humid regions of East and Central Africa, green bananas and plantain are used as the base of the main dish which is eaten with a relish made from roots and tubers, with the addition of groundnut sauce or red palm oil (Oniang’o et al., 2003). Bush meat is common in the diets of rural and urban population in the Congo Basin and is estimated at around 3.2 million tonnes (and over 4.5 million tonnes are extracted) (Nasi et al., 2011). The traditional diet in Southern Africa is centred on maize or rice, served with a stew; chicken and beef are widely eaten. All over SSA, there are territorial value chains with collectors, wholesalers, artisan food processing and small retailers on the roads, in streets and local markets despite the entry of regional and international players into both the modern grocery and food service sectors. The activities that take place around markets are often undertaken by women. Family links or kinship, i.e. relational proximity, between farmers and traders,
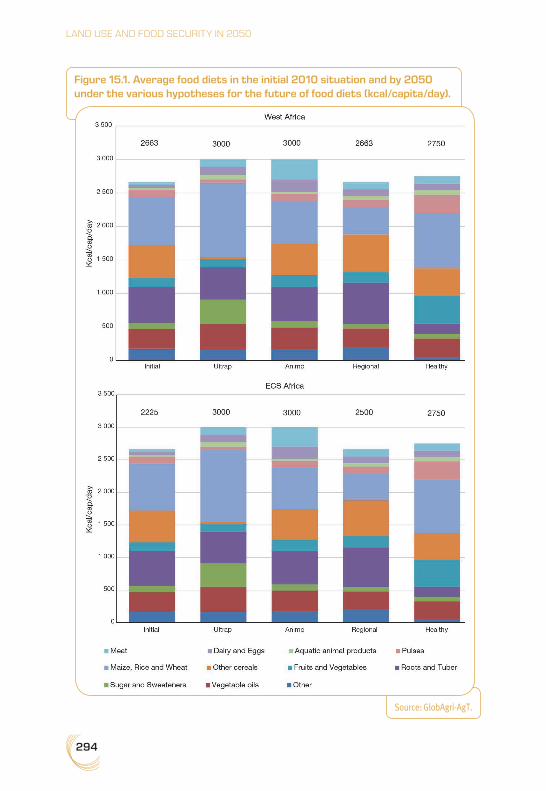
294
LAND USE AND FOOD SECURITY IN 2050
Figure 15.1. Average food diets in the initial 2010 situation and by 2050 under the various hypotheses for the future of food diets (kcal/capita/day).
Source: GlobAgri-AgT.
295
15. Regional Dimension of the Agrimonde-Terra Scenarios
and between traders in the chain of collectors-wholesalers-retailers, is observed in all types of food chains, short or long (Moustier, 2017). The number of retailers and their scope has expanded to meet the evolving demand. Urban congestion, weak public transport systems and erratic electricity service, which hinders the spread of refrigerators among consumers, help traditional retailers to maintain a substantial share of the consumer market compared to larger modern retailers.
A ’transition towards ultra-processed food and modern value chains’ is taking place. Diets are being transformed due to rising incomes and consumers look for foods that are convenient to buy, prepare and consume. In cities, imported wheat and rice are dominant in the starchy products consumed. Large supermarkets are developing rapidly all over SSA (Staatz and Hollinger, 2016). There is not a marked ’transition to animal-based food’. Chauvin et al. (2012) note that “calories supplied by meat consumption in SSA have been increasing by an average rate of more than one per cent per decade”. This increase is mostly associated with the higher income levels that allowed consumers to afford income elastic commodities such as meat. However, in countries such as Cote d’Ivoire, Democratic Republic of Congo (DRC), Ethiopia and Kenya, meat consumption has decreased sharply. This decrease is mostly associated to drought condition which decreased livestock weights and increase their mortality in countries such as Ethiopia and Northern Kenya and civil war in Cote d’Ivoire and DRC which affected local meat supply.” Milk products are the most commonly consumed animal product. The consumption of poultry, eggs and pork has increased while the consumption of beef is decreasing and the consumption of small ruminants is constant. Fish make up the lowest source of animal calories and are consumed in a few coastal countries, especially Ghana.
The regional diversity of diets and value chains is just about the only weak signal towards the assumption of ’healthy diets based on food diversity’. Indeed, the consumption of animal products (with the exception of Southern Africa) and of fruit and vegetables is still below recommended levels. This situation has negative impact on birth weight, growth and cognitive development. These foods are either not accessible because of their high cost, not locally available, unequally distributed within households or are not considered household priorities when incomes are not sufficient to meet the needs of a high quality diet (Fanzo, 2012).
Trends in direct drivers of changes
We examine here the on-going trends and weak signals in SSA towards the hypotheses relative to the direct drivers of land use change, i.e. urban-rural relationships (Chapter 9), farm structures (Chapter 10), cropping systems (Chapter 11) and livestock systems (Chapter 12).

296
LAND USE AND FOOD SECURITY IN 2050
❚❚ Trends relative to urban-rural relationships
In brief: urban-rural relationships in SSA are diverse and influenced by population density, history and geographical situation, and there are trends towards the four hypotheses of change proposed by Agrimonde-Terra.
There are a few cities of over three million inhabitants in SSA but these ’megacities’ are included in vast urban clusters (’large metropolitan regions’) (Figure 15.2). In West Africa, from the coast of the Gulf of Guinea to the Sahel, urban population density is high, with the major cities being Lagos, Onitsha, Abidjan, Accra, Kano, Dakar, Bamako and Ibadan. In the Ethiopian Highlands, around Addis Ababa, a dense urban network has developed. In the Great Lakes region, there is a conurbation in Western Kenya, close to linking Nairobi to Kampala. In the Northern part of South Africa and in the extreme South of Mozambique, an urban network starts around Johannesburg and stretches towards the interior of the country regions (Chatel et al., 2016). Also, “corridors of urbanization are emerging between Lake Chad and the Ethiopian Highlands”, between the borders of Cameroon and Nigeria and the Great Lakes, “as well as along the railway line and roads leading to the mining regions from Pointe-Noire in DRC, crossing Zambia and Zimbabwe and reaching Mozambique. … More isolated large cities such as Cape Town, Luanda and Khartoum result in polarization in their surrounding regions” (Chatel et al., 2016).
Despite the poor quality of the roads, the road system plays a key role in ’rural-urban archipelagos’ and facilitates ’multi-activity within households’. Temporary movement – whether daily, weekly or seasonally – characterizes the mobility pattern of households in search of employment, services, commercial goods and education as well as for social reasons (Steel and van Lindert, 2017). They take place, for example, between rural areas and middle-sized cities in West Africa. People take advantage of progress in electrification, low-cost public or individual transport, mobile phones and money transfer applications to move from one place to another and find non-farm jobs. Households receiving international remittances are able to buy land and build a house, to establish a business or to buy agricultural equipment, which helps them to become multi-active (Plaza and Ratha, 2011).
The ’integration of rural areas into urban networks’ is limited by the slow development of intermediate urbanization (Andersson Djurfeldt, 2015). Nevertheless, there is ’a new emerging rural world’ (Losch et al., 2013; Pesche and Diop, 2016) and value chains link rural and urban areas. As cities consume predominantly African products, urban food markets lead the development of local food chains which have both an informal and a formal component (Schaffnit-Chattrjee, 2014; Bricas et al., 2016; Staatz and Hollinger, 2016).
Finally, there are weak signals towards ’urban fragmentation and counter urbanization’. This trend is due to difficult living conditions in the large cities, especially the high cost of living, lack of infrastructure and employment opportunities, and violence. For example, in South Africa, middle class families are starting to migrate from urban to rural areas (AfDB, OECD and UNDP, 2016).

297
15. Regional Dimension of the Agrimonde-Terra Scenarios
❚❚ Trends relative to farm structures
In brief: there is a great diversity of farm structures (Bélières et al., 2015) and therefore there are on-going trends towards the six Agrimonde-Terra hypotheses relative to farm structures in 2050. Farms of two hectares or less contribute to around 30% of most food commodities and 25% of nutrients; farms of 20 hectares or less produce more than 75% of most food commodities and 80% of nutrients (Herrero et al., 2017).
’Marginalized farms for a livelihood survival’ are both an on-going and an emerging type of farm. Such farms have existed for many years because many farmers lacked access to capital; they also had limited access to markets, education, extension services, farmers’ associations, banking and financial services. It is an emerging trend because of the growing number of farmers and the unstable land tenure systems. For several or more decades, farm sizes should continue to shrink as well as a movement to marginal land. Between 1961 and 2003, the average land area available per active farmer has shrunk from 1.6 to 1 hectare (Bélières et al., 2015). About 60% of farms in sub-Saharan Africa cover less than
Figure 15.2. Map of Africa - urban centres with a 100 km radius
Source: Chatel et al. (2016), Figure M8, p 20
298
LAND USE AND FOOD SECURITY IN 2050
1 hectare and another 20% have between one and two hectares (Bélières et al., 2015). A number of these farms are fighting for their survival and are confronted with a number of impasses (climatic, biotechnical, lack of labour, insecure land access, difficult access to resources or credit, soil degradation, competition for water etc.). Many women have insecure access to land and are therefore marginalized farmers.
Small SSA farms with about 2 hectares of farmland and rudimentary equipment, generally manual, have been able to make a significant contribution to supplying cities both in basic food products (cereals and tubers) and in food diversification products, such as vegetables, milk, fruit and oilseeds (Bélières et al., 2015). Agrimonde-Terra identifies them as ’resilient farms embedded in urban processes’. The households of these farms are able to cope with disruption as some members of the family work on the farm while others have off-farm activities. The remittances of members of the family living abroad or in big cities play an important role in daily life and investments.
’Independent farms but commercially dependent’ can take different forms. In the cotton basin of West Africa, for example, farms are linked to local value chains (cotton, maize, cattle, small ruminants etc.). Suppliers of inputs, equipment, financial and advisory services, and processors, wholesalers and retailers are all active in the value chains (Ouedraogo and Vall, 2016). Also, a growing number of medium-scale farms (5 to 50 ha) are being developed by pluri-active and often urban-based Africans who seek a stable long-term return on their investment (Sitko and Jayne, 2014; Anseeuw et al., 2016). They secure their access to land through long-term leaseholds or title deeds, and often hire a relative as manager to look after their operations. Their activities lead to land concentration (Jayne et al., 2014). This phenomenon appears to be associated with the rise in global food prices, the development of markets for agricultural inputs and mechanization, policies favouring commercialized agriculture and democratic processes (Jayne et al., 2016).
’Hit and run strategies for agro-investments’ are emerging. These can take different forms (Cotula et al., 2009) and are developing with the support of a number of African governments (Smalley, 2013). The most common form is the result of investments by foreign companies which integrate Africa in their global projects to control production factors or to diversify their activities. They can rent large-scale areas, produce energy, control logistics, and sell fertilizers and pesticides as well as improved seeds and breeds. As far as large-scale acquisitions are concerned, the Land Matrix 2016 reports that SSA “accounts for 422 concluded agricultural deals (42% of all deals) and 10 million hectares (37%). It also has the highest number of intended deals (147 deals; 13.2 million hectares). Land acquisitions are concentrated along major rivers and in East Africa” (Nolte et al., 2016, p.vi). The five most targeted countries according to the size of concluded deals are Ethiopia, Ghana, South Sudan, DRC and Sierra Leone (Nolte et al., 2016).
There are emerging trends towards ’agricultural cooperatives emphasizing quality’, even if cooperatives have left a poor legacy in many African countries, national legislation is often inadequate for establishing and developing cooperatives, and states too often intervene in their management (Develtere et al., 2008). Nevertheless, there are examples

299
15. Regional Dimension of the Agrimonde-Terra Scenarios
of successful initiatives in incorporating small-scale farmers into value chains in East Africa (e.g., horticultural products marketed by Balimi farmers in Tanzania and potato growers in Uganda) (Louw et al., 2008) and in West Africa (Gning and Larue, 2014). Another trend towards cooperatives is the development of user-managed rural and village banks (Jessop et al., 2012).
Finally, there are ’farms producing goods and services to surrounding community’ as SSA farms have a history of stewardship of resources and know-how to manage the complexity of common systems. Pastoralists and smallholder farmers practicing agroforestry (Mbow et al., 2014) are examples of farms contributing to the enhancement of soil fertility, carbon sequestration and provision of fuel. Some provide these goods and services through the mediation of their local community, but rarely through the mediation of local governments.
❚❚ Trends relative to cropping systems
In brief: all four hypotheses for the future of cropping systems are found, even if these descriptions do not fully apply to SSA. There is significant room for improved performance due to generally weak performance in the past (Benoit-Cattin and Dorin, 2012; Fuglie and Rada, 2013).
’Conventional intensification’ has been promoted by agricultural policies and extension services over the course of several decades. For the period 1961-2012, total factor productivity (TFP) increased at an annual average growth rate of only 0.5% and labour productivity improved more slowly than land productivity (Benoit-Cattin and Dorin, 2012; Benin, 2016). The highest annual average productivity growth rates have been in Southern Africa for land and in West Africa for labour. Central and East Africa has had the lowest level of land and labour productivity. Intensification and specialization in production is mostly practiced in the highland perennial farming systems, and especially the maize mixed farming system of East and Southern Africa (Garrity et al., 2012; Leclerc et al., 2014; Sheahan and Barrett, 2017). It is also practiced in irrigated farming systems, for example in the delta of the Senegal River and in some areas in Sudan and South Africa (Siebert and Frenken, 2014), and in peri-urban areas (Temple et al., 2008) (Figure 3). It has been practiced in the cotton production zone of West Africa but changes in cropping systems are on-going (Toillier and de Lapeyre de Bellaire, 2017). It relies on the improvement of imported varieties and breeds, pesticides and mineral fertilizers. The incidence of irrigation and mechanization seems to have remained small (Sheahan and Barrett, 2017). The use of inorganic fertilizer and agrochemicals is relatively low as an aggregate but more widespread than is commonly recognized, and with considerable variation within countries and between countries (Morris et al., 2007; Sheehan and Barret, 2017). The use of fossil fuel-based inputs was promoted and subsidized in SSA from the 1950s to the 1990s for many crops, but structural adjustment programmes have stopped this practice. Since the mid-2000s, a number of countries have returned to fertilizer subsidies and stable fertilizer prices to promote the production of basic foods despite controversies (for example, Zambia in Neubert et al., 2011). As far as pesticides are concerned, South

300
LAND USE AND FOOD SECURITY IN 2050
Africa represents more than half of SSA’s consumption (Sheahan and Barrett, 2017); national regulations are either absent or not respected and tend to lead farmers to the purchase of older pesticides or poor quality and less expensive ones (UNEP, 2013). Also fallow practices for regenerating soils are disappearing (Binswanger-Mkhize and Savastano, 2017). Dugué et al. (2014) observe that in West Africa farmers tend to prefer the conventional intensification/Green Revolution model over agroecology. Several reasons explain this preference: mineral fertilization remains effective and profitable in these regions where the risk of drought during the cycle is lower than in the Sahelian zone; if farmers are able to buy them, mineral fertilizers are available in large quantities, which is not the case with organic manure whose availability is often reduced; farmers are abandoning fallows and cultivating continuously, which requires the growing use of fertilizers and herbicides; active ingredients in herbicides have fallen into the public domain and their costs have decreased; and consequences on the environment and health of fertilizer and pesticide use are largely unknown (Dugué et al., 2014).
’Sustainable intensification’ is increasingly promoted by donors and international research institutions (The Montpellier Panel, 2013; Öborn et al., 2017). It means a shift from on-going practices to practices which optimize outputs and maintain the farm in a healthy ecological and financial state, and contributes to increased production, income, nutrition and ecosystem services. Gautier et al. (2016) report that in West Africa, “the most frequently reported agricultural responses are changes in cropping systems and patterns, crop diversification or changes in crops and varieties, exchange and selection of seeds, changes in sowing dates or in the agricultural calendar, changes in the location of fields, the adoption of water saving and soil conservation techniques and finally agricultural intensification”. In Burkina Faso, Dabat et al. (2012) note that farmers have intensified cowpea production because of market opportunities and this production has positive impacts on nitrogen fixation and soil fertility, cereal production and the association of crops and livestock. The European Union-funded PROIntensafrica project identified different pathways leading to sustainable intensification through in situ case studies; they demonstrate the richness and variety of options that are open to farmers.71 Himmelstein et al. (2017) report that on average, in Africa, intercropping increases crop yields by 23%, but effects vary significantly depending on management practices and agro-ecological factors.
’Agroecology’, i.e. the diversification of crops (including agroforestry) and/or association of crops and livestock, and techniques to restore soil fertility is still practiced in some areas of SSA, and is promoted by some research and development projects as it contributes to agricultural resilience. When livestock and crops are associated, livestock provide many services to farmers, such as meat and milk, but also the recycling of nutrients and manure, energy and maintenance of the vegetation balance. Cropping systems are highly dependent on labour, with animals providing draught power and low levels of
71. http://www.intensafrica.org/pathways/
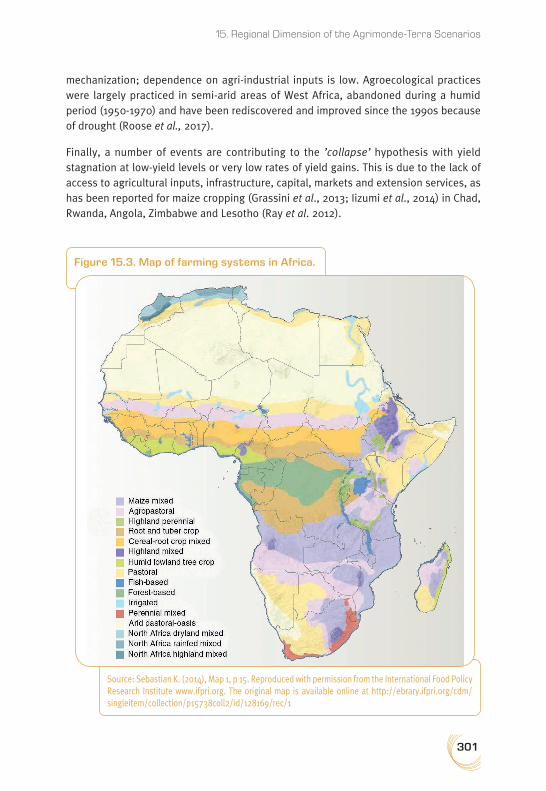
301
15. Regional Dimension of the Agrimonde-Terra Scenarios
mechanization; dependence on agri-industrial inputs is low. Agroecological practices were largely practiced in semi-arid areas of West Africa, abandoned during a humid period (1950-1970) and have been rediscovered and improved since the 1990s because of drought (Roose et al., 2017).
Finally, a number of events are contributing to the ’collapse’ hypothesis with yield stagnation at low-yield levels or very low rates of yield gains. This is due to the lack of access to agricultural inputs, infrastructure, capital, markets and extension services, as has been reported for maize cropping (Grassini et al., 2013; Iizumi et al., 2014) in Chad, Rwanda, Angola, Zimbabwe and Lesotho (Ray et al. 2012).
Figure 15.3. Map of farming systems in Africa.
Source: Sebastian K. (2014), Map 1, p 15. Reproduced with permission from the International Food Policy Research Institute www.ifpri.org. The original map is available online at http://ebrary.ifpri.org/cdm/singleitem/collection/p15738coll2/id/128169/rec/1
302
LAND USE AND FOOD SECURITY IN 2050
❚❚ Trends relative to livestock systems
In brief: most on-going trends relate to three of the five Agrimonde-Terra hypotheses: ’livestock on marginal land’, ’agroecological livestock on land in synergy with agriculture and urbanization’ and ’backyard livestock’. There are some weak signals towards ’conventional intensive livestock with local resources’ and even fewer trends towards ’conventional intensive livestock with imported resources’.
In the drylands of Africa, which occupy about 60% of the land, livestock are the main, and often only, land use option, and the livestock sector is the cornerstone of the national economy in many West and East sub-Saharan African countries which contain significant amounts of drylands. Direct outputs of livestock, such as meat and milk, contribute between 5% and 10% of total GDP and and accounts for 15–40 percent of the added value in agriculture. Indirect benefits are organic fertilizer and traction services. The livestock sector is also an important source of foreign exchange; millions of sheep are shipped every year from the Horn of Africa to countries in the Persian Gulf, and about one million head of cattle are trekked or trucked from the Sahel region to West African coastal countries. An estimated 25 to 41 million people have livestock which are their sole source of livelihood, and livestock provides a significant share of income for about 110-120 people, roughly 70% of the population of the rural drylands of West and East Africa (de Haan, 2016). Livestock ownership is highly unequal: 1% of livestock keepers own between 9 and 26% of all animals, and 90% of livestock keepers are below the minimum level needed to earn an income above the poverty line. On average, between 1980 and 2010, the herd/flock size per household and per pastoralist has gone up: the annual growth of livestock has been between 3.1 and 4.4%, whereas the human population has increased by 1 to 2.5% per year (de Haan, 2016). The increase in small ruminants has been particularly fast. Traditionally, pastoralists raise livestock on marginal land as their most important source of income and agro-pastoralists combine livestock with crop farming. However, over the past two decades, arable farmers have increasingly invested in livestock whereas pastoralists have been forced to take up cropping because their herd sizes fall below the minimum size need to sustain their households (de Haan et al., 2016). Competition over access to dry season grazing and water between farmers and herders is therefore growing.
’Livestock on marginal land’ is practiced in resource-scarce and climatically marginal regions which are sparsely populated and often have highly variable conditions. The agronomic potential of these areas is very low and they could not be cultivated. It is based on the grazing of natural vegetation, whose nutritional and spatio-temporal distribution depends on the variability and intensity of annual precipitation. It is practised by around 25 to 50 million herders (according to sources) over approximately 43% of the African territory (the Sahel zone, the Horn of Africa and parts of Southern Africa) and contributes significantly to income. Pastoralists and their herds of camels, cattle, sheep and goats use communal land resources and move from one area to another according to feed and water availability. Pastoralists have contributed to

303
15. Regional Dimension of the Agrimonde-Terra Scenarios
the stabilization of the societies living in the zones; they have spread important know-how within society and along transhumance routes and contributed to linkages between countries. Animal mobility contributes to the exploitation of natural areas unsuited to other activities, stimulation of pasture growth, provides manure and preserves biodiversity; animal products end up in urban areas for domestic markets and exports. The sparse distribution of livestock makes epidemic disease outbreaks quite infrequent and the main threats for animals are parasites, nutritional deficiencies, and the lack of feed and water. Livestock production on marginal land faces many risks. Conflict and insecurity are prevalent. Climatic events, especially drought, can be dramatic. Livestock diseases can emerge suddenly (e.g., Rift Valley Fever) with related sanitary bans (de Haan et al., 2016). Governments can have an ambivalent attitude towards mobility, and pastoralists face shortcomings in administrative and regulatory procedures which lead to illegal movements of livestock and violence, for example between Chad and the Central African Republic. Some countries are setting up pastoral and land codes to address the sharing of resources between pastoralists and farmers. Mobility to farmed areas is leading to conflicts with farmers and modifying both livestock and cropping systems. Finally, pastoralists face daily trade-offs between selling their milk, meat and eggs to increase income and consuming the same foods to improve nutrition.
Mixed crop-livestock sys tems, i.e. ’agro-ecological livestock on land in synergy with agriculture or urbanization’ are found throughout Western Africa, Eastern Africa and parts of Southern Africa. Rural people rely on livestock which is totally or seasonally mobile in different proportions, and on combinations of crops (mainly millet, cowpea, sorghum, cotton and groundnut). “Populations have adapted their farming systems and way of life to the spatial and temporal (seasonal and inter-annual) rainfall variability and its resulting uncertainties on production of crops, trees, and grazing resources” (Garrity et al., 2012, p. 24). Drought is a regular phenomenon. The primary concern in the mixed crop-livestock systems is to ensure the survival of animals, limit losses, maintain productive capacity and minimize the risk of failure to produce a means of subsistence. Tsetse flies and disease limit the presence of livestock in many areas of Africa.
Most families, in rural and even urban areas, have poultry and small ruminants in their backyard fed on waste and marginal land (’backyard livestock’).
There is the development of ’conventional intensive livestock production with local resources’, especially for pigs and poultry. Producers are a mix of family businesses and commercial operations, ranging from the small- to large-scale with varying degrees of modern technology. The main challenges for this development are the lack of large quantities of maize, soya, day-old chicks and broiler producers, the high price of feed materials, lack of training and credit and the slow development of the consumer market. There are still many risks associated with intensive production of ruminants and monogastric animals such as zoonoses and their impact on human health, the concentration of animal waste, breed specialization and lack of feed.
304
LAND USE AND FOOD SECURITY IN 2050
The Agrimonde-Terra scenarios in sub-Saharan Africa
In this section, we present the main on-going trends towards the five Agrimonde-Terra scenarios (Chapter 13) in SSA and examine what the land use and food security situation could be in SSA in 2050 with each scenario.
❚❚ On-going trends in SSA towards the five scenarios
There are on-going trends concerning both the external and direct drivers of land use change towards all five Agrimonde-Terra scenarios (Table 15.1). The ’Land as commons for rural communities in a fragmented world’ scenario has been dominant in the past and on-going trends towards this pathway could endure if the political and economic context remains fragmented. External drivers are providing strong impetus towards the ’Land use driven by metropolization’ scenario and the ’Land use for multi-active and mobile households’ scenario. Direct causes of change, especially the integration of rural areas into urban networks through value chains are driving towards the scenario “Land use for regional food systems’. And there are weak signals towards the ’Land use for food quality and healthy nutrition’ scenario. This situation could be an opportunity to improve land use and food security, or a threat if no choice is made. If key African stakeholders accept the complexity of the land use and food security system, and understand the linkages between drivers, there are opportunities for improvement. Transformational change will require systemic and systematic thinking and practice, as well as embarking “in a process of innovative design” instead of “changing procedures in the same pathway” (Hubert and Ison, 2017). It will require searching for both economic and humanitarian goals without opposing them. Rural and urban linkages, especially the growing integration of rural areas into urban networks through value chains, the dynamism of agriculture and smallholders’ innovativeness, the combination of local and external knowledge, mobility and multi-activity, the growing role of civil society organizations, the growing implication in SSA of the African diaspora and renewable sources of energy are all some of the positive trends towards the establishment of a positive future for land use and food security in SSA.
❚❚ Short narratives of the five scenarios in SSA
The Communities scenario in SSA
Global economic and energy crises affect SSA less than the rest of the world because of the generally low consumption level, but, nevertheless, crises in developed countries are shocks for African countries and increase their fragility. They lead to poor economic growth, major decreases in foreign aid, lack of investments in infrastructure, education, and research in SSA, and difficult access to knowledge and resources. Relational logic dominates African society. Political authorities are unable to create a favourable framework for economic growth. Land tenure systems are not revised and access to land remains
305
15. Regional Dimension of the Agrimonde-Terra Scenarios
insecure for smallholders. Some local communities of farmers, which have gone through social and economic upheavals and environmental degradation for decades, have managed their activities ’under the radar’, adopting agroforestry practices, diversifying their production, associating crops and livestock, adopting practices to manage soil fertility, developing backyard livestock and trading among themselves. Their income and access to food increase and they manage to help their relatives who have stayed in urban areas. There are other communities which had specialized their production, for example in maize or perennial crops. They suffer from difficult access to inputs, a decrease in production, high costs of imports and declining income, and therefore face difficult access to food, undernutrition and nutritional deficiencies. In mineral-rich countries, minerals are exported but the benefits are kept by a few groups; some manage to get access to food while others are unable to do so and migrate first within SSA and if necessary outside SSA. In cities, some people manage to get jobs, but not others. In the areas where communities have secure access to land, manage efficiently scarce resources, avoid high levels of population growth and adopt agroecological approaches, the agronomic potential stabilizes; there is a diversification of production and the impact of extreme weather events on crops and yield variability is reduced. In the areas where communities are unable to organize themselves, where there is too much corruption, ethnical fights, terrorism and instability, the agronomic potential reduces, and cropping and livestock systems collapse; the effects of climate change cannot be mitigated. The calorie availability per capita stays as in 2010 in West Africa (2,663 kcal/cap/day) and increases slightly in ECS Africa (rising from 2,225 kcal/cap/day to 2,500 kcal/cap/day).
The Metropolization scenario in SSA
The alliances between a number of African governments and institutions, United Nations institutions and multinational companies and investment funds contribute to lowering trade barriers in order to foster international investments in SSA, to facilitate secure access to land for foreign investors, to facilitate the export of mineral resources and the import of goods and ultra-processed foods, and a green revolution. The objective is economic development and the insertion of SSA into global value chains. Agri-industrial and commodity trading companies develop large farms, using improved varieties and breeds, inputs and large-scale mechanization, promising to feed the growing African population living in large cities. In the capital cities, coastal cities of West Africa and a small number of urban agglomerations, substantial investments in infrastructure (notably industry, energy, education and health) and services (in terms of skills improvements for effective business support and efficient banking systems) are made. The secondary cities and the rural areas do not benefit from these investments; they are forgotten. Over several decades, millions of African smallholders are displaced because of climate change or land grabbing. Some move to the slums of the large urban areas, others to marginal rural areas; youth tend to move to the urban clusters. During the first decade, there are informal and formal job opportunities for unskilled workers, but they decrease over time because of the evolution of technological development. In large urban areas,

Tab
le 1
5.1
. Mai
n on
-goi
ng
tren
ds in
SS
A t
owar
ds t
he
five
Agr
imon
de-
Terr
a sc
enar
ios.
Com
mun
ities
Met
ropo
lizat
ion
Hous
ehol
dsRe
gion
aliz
atio
nHe
alth
y
Exte
rnal
dr
iver
s of
ch
ange
– St
rong
pol
itica
l and
eco
nom
ic
fragm
enta
tion:
inst
abili
ty a
nd p
oor
gove
rnan
ce in
man
y co
untri
es;
corru
ptio
n; v
iole
nt c
onfli
cts
over
re
sour
ces
(e.g
. Lak
e Ch
ad).
Larg
e in
form
al e
cono
my.
Hum
an h
ealth
pr
oble
ms
(AID
S, m
alar
ia e
tc.).
– W
arm
ing
tem
pera
ture
s an
d ex
trem
e cl
imat
ic e
vent
s.–
Diet
s ba
sed
on c
erea
ls (W
est a
nd
Sout
hern
Afri
ca),
root
s, tu
bers
and
pl
anta
ins
(Cen
tral).
Loc
al p
rodu
ctio
n of
mea
t, fru
it an
d ve
geta
bles
. Loc
al
proc
essi
ng a
nd m
arke
ts. C
orrid
ors
for
trade
(e.g
. Oua
gado
ugou
-Acc
ra).
– So
me
coun
tries
inte
grat
ed in
glo
bal
agric
ultu
ral v
alue
chai
ns (e
.g. S
outh
Afri
ca,
Côte
d’Iv
oire
, Eth
iopi
a an
d Ke
nya)
. For
eign
in
vest
men
ts m
ultip
lied
by fo
ur si
nce
2000
. De
velo
pmen
t age
ncie
s pro
mot
e lib
eral
izatio
n an
d pr
ivat
izatio
n. S
tate
sove
reig
nty
at st
ake.
– W
arm
ing
tem
pera
ture
s and
ext
rem
e cli
mat
ic ev
ents
.–
Grow
ing
impo
rts o
f whe
at a
nd ri
ce.
Tran
sitio
n to
ultr
a-pr
oces
sed
food
. De
velo
pmen
t of s
uper
mar
kets
. Gro
win
g ov
er
and
mal
nut
ritio
n.
– Gr
owin
g nu
mbe
r of
dyna
mic
, mob
ile a
nd m
ulti-
activ
e Af
rican
s. D
evel
opm
ent
of d
ecen
traliz
atio
n an
d di
gita
lizat
ion.
Wea
k st
ate
synd
rom
e. In
form
al e
cono
my.
Al
lianc
es b
etw
een
varie
ties
of
stak
ehol
ders
. –
Carb
on s
eque
stra
tion
proc
esse
s.–
Diet
s ba
sed
on c
erea
ls
(Wes
t and
Sou
ther
n Af
rica)
, ro
ots,
tube
rs a
nd p
lant
ains
(C
entra
l). L
ocal
pro
duct
ion
of
mea
t, fru
it an
d ve
geta
bles
. Lo
cal p
roce
ssin
g an
d m
arke
ts.
Corri
dors
for f
ood
trade
(e.g
. Ou
agad
ougo
u-Ac
cra)
.
– M
any
regi
onal
org
aniza
tions
w
ith o
verla
ppin
g. D
evel
opm
ent
of c
ivil
soci
ety
orga
niza
tions
. In
tra S
SA m
obili
ty fo
r hum
ans,
an
imal
s an
d go
ods.
Info
rmal
tra
de. A
bund
ant b
ut u
neve
nly
spre
ad e
nerg
y re
sour
ces.
–
Carb
on s
eque
stra
tion
proc
esse
s.–
Diet
s ba
sed
on c
erea
ls
(Wes
t and
Sou
ther
n Af
rica)
, ro
ots,
tube
rs a
nd p
lant
ains
(C
entra
l). L
ocal
pro
duct
ion
of
mea
t, fru
it an
d ve
geta
bles
. Lo
cal p
roce
ssin
g an
d m
arke
ts.
Corri
dors
for f
ood
trade
(e.g
. Ou
agad
ougo
u-Ac
cra)
.
– Ci
vil s
ocie
ty p
rom
otes
plu
ralis
m,
resp
ect f
or h
uman
righ
ts a
nd
dece
ntra
lizat
ion.
Pea
cefu
l el
ectio
ns in
a fe
w c
ount
ries.
Urb
an
Afric
ans
star
ting
to in
vest
in S
SA.
Bette
r-hea
rd S
SA v
oice
s in
glo
bal
gove
rnan
ce.
– Ca
rbon
seq
uest
ratio
n pr
oces
ses
and
deve
lopm
ent o
f ren
ewab
le
ener
gy.
– Di
ets
base
d on
div
ersi
ty o
f pr
oduc
ts (i
ncre
ased
con
sum
ptio
n of
frui
ts a
nd v
eget
able
s, p
ulse
s,
mea
t, da
iry a
nd e
ggs)
for
impr
oved
nut
rient
con
tent
. For
pr
omot
ion
of h
ealth
y di
ets:
pub
lic
heal
th p
olic
ies
and
educ
atio
n of
w
omen
.
Dire
ct
driv
ers
of
chan
ge
– Sl
owdo
wn
in u
rban
con
cent
ratio
n;
med
ium
-size
d ci
ties
and
cont
inuo
us
incr
ease
of r
ural
pop
ulat
ion.
–
Mos
tly in
secu
re la
nd a
nd p
rope
rty
right
s; m
argi
naliz
ed fa
rmer
s.–
Past
oral
ism
in S
ahel
, Hor
n of
Afri
ca
and
parts
of S
outh
ern
Afric
a; b
acky
ard
lives
tock
. Mul
tiple
func
tions
of l
ives
tock
. –
Agro
fore
stry
, cro
p-liv
esto
ck
asso
ciatio
ns. P
ickin
g an
d hu
ntin
g pr
ovid
e re
venu
es a
nd e
mpl
oym
ent (
e.g.
Cen
tral
Afric
a). S
ome
com
mun
ities
ove
rexp
loit
or
inte
nsify
with
out r
esou
rce
man
agem
ent
stra
tegi
es. O
ther
com
mun
ities
pro
vide
la
rge
shar
e of
nut
rient
s, in
nova
te a
nd
take
care
of r
esou
rces
.
– W
est a
nd S
outh
ern
Afric
a; m
egac
ities
in
vast
urb
an cl
uste
rs.
– In
vest
men
ts in
agr
icultu
re b
y ur
bani
tes;
la
nd-g
rabb
ing.
Dec
reas
ing
size
of fa
rms.
M
argi
naliz
atio
n of
rura
l pop
ulat
ion
(e.g
. in
Cong
o Ba
sin).
– De
fore
stat
ion,
land
deg
rada
tion.
Co
nven
tiona
l int
ensifi
catio
n (m
aize
in
East
ern
and
Sout
hern
Afri
ca, c
otto
n in
Wes
t Af
rica)
pro
mot
ed b
y ex
tens
ion
serv
ices.
Som
e ar
eas c
onne
cted
to g
loba
l val
ue ch
ains
(e
xpor
ts o
f nat
ural
reso
urce
s and
agr
icultu
ral
prod
ucts
).Co
llaps
e of
crop
ping
syst
ems i
n m
argi
naliz
ed
area
s, n
ot co
nnec
ted
to m
arke
ts.
– W
est A
frica
: mul
ti-ac
tive
and
mob
ile h
ouse
hold
s in
ru
ral-u
rban
arc
hipe
lago
s.–
Inde
pend
ent f
arm
s w
ith
com
mer
cial
dep
ende
ncy
(e.g
. Co
tton
Basi
n in
Wes
t Afri
ca,
Sene
gal R
iver
Del
ta).
– Pa
stor
alis
m a
nd a
gro-
past
oral
ism
, and
mul
tiple
fu
nctio
ns o
f liv
esto
ck.
– Ag
rofo
rest
ry, c
rop-
lives
tock
as
soci
atio
ns.
– W
est A
frica
: rur
al a
reas
in
tegr
ated
into
urb
an n
etw
orks
th
roug
h va
lue
chai
ns.
– In
depe
nden
t far
ms
with
co
mm
erci
al d
epen
denc
y (e
.g.
Cotto
n Ba
sin
in W
est A
frica
, Se
nega
l Riv
er D
elta
).–
Farm
ers’
kno
wle
dge
of
natu
ral r
esou
rce
man
agem
ent.
– Pa
stor
alis
m in
Sah
el,
Horn
of A
frica
and
par
ts
of S
outh
ern
Afric
a.
– Su
stai
nabl
e in
tens
ifica
tion
and
agro
ecol
ogy
prom
oted
th
roug
h pa
rtici
pato
ry
appr
oach
es.
– M
egac
ities
in v
ast u
rban
clu
ster
s in
Wes
t and
Sou
ther
n Af
rica.
So
me
rura
l are
as in
tegr
ated
into
ur
ban
netw
orks
thro
ugh
valu
e ch
ains
. –
Deve
lopm
ent o
f coo
pera
tives
(e
.g. h
ortic
ultu
re o
f Bal
imi f
arm
ers
in T
anza
nia,
pot
ato
grow
ers
in
Ugan
da).
– Pa
stor
alis
m in
Sah
el, H
orn
of A
frica
and
par
ts o
f Sou
ther
n Af
rica.
–
Sust
aina
ble
inte
nsifi
catio
n pr
omot
ed a
mon
g sm
allh
olde
rs.
Assi
sted
nat
ural
rege
nera
tion
to
rest
ore
degr
aded
fore
sts.
307
15. Regional Dimension of the Agrimonde-Terra Scenarios
people mostly consume imported ultra-processed food, with high fat and sugar content; and malnutrition, overweight and non-communicable diseases become very frequent. Before 2050, it appears that, on most large farms, yields have not increased as promised; climate change at the global level has very negative impacts on the agronomic potential of soils, yields and the nutrients of plants; the use of chemical inputs has also had negative impacts on health and the environment. Also, increasing water demand in cities and for irrigation creates severe tensions; in large cities, there are areas where well-educated and rich people live, surrounded by slums. This leads to conflicts in urban areas, hunger riots, deaths caused by starvation and malnutrition, and massive migrations within Africa and to the rest of the world. In rural areas, conflicts over resources are extremely frequent.
The Regionalization scenario in SSA
The evolution of the global economic environment leads Africa to realize that it has no choice but to decisively consolidate and build its regional trading market, its monetary integration and political concertation. African governments realize that integration means thinking regionally as well as locally. They decide ’to mark their territory’ and define together an attractive vision for Africans: Africa will take advantage of its natural resources and its fast-growing population. It will seek as little dependency from the rest of the world as possible. Actions are taken to secure access to land for Africans, to monitor and control deforestation, and to facilitate access to infrastructure and markets for smallholders. Boosting intra-African trade, substituting imported products with local ones becomes a priority; tariff and non-tariff barriers are modified. Policies are adopted to promote the consumption of local and traditional food and to develop small agri-industries for food processing. In West Africa, the daily calorie intake is similar to the initial situation but intake of meat (mostly small ruminants), dairy products and eggs as well as fruit and vegetables and local cereals increase; consumption of rice, maize and wheat decreases. The consumption of fruit and vegetables and pulses is, however, still below the levels of a healthy diet and the consumption of roots and tubers above. In ECS Africa, the daily calorie intake increases with substantial growth in the consumption of meat, dairy and eggs, as well as roots, tubers, pulses, fruit and vegetables. Rural areas are integrated into urban networks through value chains. Efforts are made to employ youth in agricultural production, in food processing and agri-industries and in food services. A number of farms produce goods and services for the surrounding community and therefore ecosystem services are provided. Research priorities shift to topics such as the improvement of local species, optimizing use of inputs, adopting agroforestry practices, crop-livestock associations and the control of tsetse flies. Investments are made in hydropower to develop local energy.
The Households scenario in SSA
The ’cheetah generation’, i.e. mobile, intellectually agile and multi-active African graduates and professionals, see the opportunities that exist in SSA. They see solutions and not problems. They do not weep about poor governance and corruption. They see that it is possible to develop traditional and informal activities such as food vendors, cloth weavers
308
LAND USE AND FOOD SECURITY IN 2050
and tailors, repairmen, cattle herdsmen, farmers, blacksmiths and goldsmiths, as well as more modern activities. They see that information and communication technologies (ICT) can be used to improve education, health, agriculture and administration, rapidly and for a large number of people, taking into account the difficult access to electricity for a large proportion of the population. They develop their activities but also get involved in non-profit organizations, civil society organizations and connect with the African diaspora and a wide variety of non-state actors. They spend time analyzing and gathering information to determine breaks in the food supply chain process that create food shortages despite availability. Then they pragmatically and strategically focus on the bottlenecks in conjunction with relevant groups, making sure they work with honest and transparent partners. For example, they recognize early on that insecure access to land is a major constraint for farmers, especially women, and their influence leads to new land tenure systems and secure access to land. They also facilitate the sharing and maintenance of silos, of grain milling machines, of oil presses, of food depots etc.; they organize training of farmers by farmers. They are entrepreneurs and their activities lead to the development of a spirit of entrepreneurship in Africa. A great number of households benefit from this system and improve their farming and non-farming incomes; mobility facilitates access to food.
The Healthy scenario
At the international level, the limits of resources are well understood and production practices, including agricultural production, have changed. So have diets in order to decrease health costs. SSA governments, conscious of the availability of natural resources and the demands of the fast-growing population, enact policies to promote healthy diets and to contribute to the fight against climate change. They also adopt major reforms to fight corruption, ensure efficient and honest administrations, develop education and health services, and improve water and electricity distribution. Land reforms are adopted in order to secure access to land and encourage farmers to produce quality products. There is full transition to sustainable intensification and agroecology, with diversified production and agroforestry practices. Agricultural practices favouring carbon storage in the soils, especially in pastures, are adopted; land degradation neutrality objectives are reached. Cooperatives and farms are embedded in urban processes. Revenues increase thanks to the diversification of production and activities, quality products and payments for ecosystem services. Diversification of production also improves food utilization and stability for all consumers. The transition to healthy diets contributes to ending undernutrition and nutritional deficiencies. It is facilitated by the education of women, public health policies, trade regulations, support for the production of healthy African products and the development of value chains. Diets are more diverse and balanced; all over SSA, the intake of fruit and vegetables, local cereals, pulses, poultry meat, dairy and eggs increase compared to 2010. The development of the local production of these healthy products increases and creates employment for the local population. In ECS Africa, the daily calorie availability per capita increases as well as the consumption of other cereals.
309
15. Regional Dimension of the Agrimonde-Terra Scenarios
Lessons on land use and food security in 2050 in SSA from the five scenarios
Lessons on land use and food security in 2050 in SSA from the scenarios can be drawn from the qualitative information issued from the hypotheses and experts’ advice. Also, the impacts of each scenario in West Africa, and Eastern Central and Southern Africa (ECS) on the agricultural land areas, production and trade have been simulated with GlobAgri-AgT (Chapter 14). The impacts of the five scenarios on the dimensions of land use and food security and on trade dependency are summarized in Table 15.2.
Quantitative results in SSA must be interpreted with great care. First, the quality of the data available in SSA is poor and that heavily influences the results of the modelling work.72 Despite improvements in censuses and household surveys, national statistical systems in SSA are weak. Glassman and Ezeh (2014) report that “measurement of fundamentals such as births and deaths, growth and poverty, taxes and trade, land and the environment, and sickness, schooling, and safety is shaky at best” due to the limited independence and unstable budgets of national statistics offices, misaligned incentives encouraging the production of inaccurate data, donor priorities which dominate national priorities, and the limited access and usability of data; Ickowicz et al. (2014) plead for an information system on pastoralism in the Sahel.
Second, in the GlobAgri-AgT model, the rules adopted to translate hypotheses about future diets in the Agrimonde-Terra scenarios into quantitative assumptions (Chapter 14) lead to an increase of daily calorie availability per capita (especially in ECS Africa which has a low initial level of 2,225 kilocalories/person/day), and more importantly, a rise in the share of animal products in food diets (Figure 15.1). These hypotheses about future food diets, combined with hypotheses about population growth, lead to major increases in animal products consumption, whatever the scenario. Finally, the diversity of SSA countries in terms of population density, natural resources and income, also calls for a very careful interpretation of quantitative results relating to land use. According to the UN’s world population prospects (2015 revision), the average population density in SSA was 38.6 people per km2 in 2010 and 44.3 in 2015; Western and Eastern Africa have an average population density of about 59 people per km2, and the population density in Central and Southern Africa is around 23 people per km2. The diversity is even greatest at national level. In 2015, Rwanda had the highest population density (415 people per km2) and Mauritania the lowest (3.5 people per km2), and in between there were, of course, many varying situations, e.g., 83 in Kenya, 64.2 in Ivory Coast, 48.3 in Cameroon, 12.4 in Mali and 7.1 in the Central African Republic. Differences in population density result in
72. The FAO (2009) report entitled ’How to feed the world in 2050. High Level Expert Forum. The special challenge of Sub-Saharan Africa’ considered that only two countries in Africa have high standards in data collection.
310
LAND USE AND FOOD SECURITY IN 2050
major differences in cultivable area per person and in total per capita water availability which influence land use and household food security. The variety of situations calls for carrying out foresight exercises at national geographical scales.
As far as food security is concerned, there is quantitative information relating to average kilocalories per person and per day and the composition of diets. Information about food access (physical and financial), food utilization and stability, which is important for households, is found in the scenario narratives.
This being said, according to our hypotheses, ensuring SSA’s food availability in 2050 will involve expanding SSA’s agricultural land area to the detriment of forest in all scenarios. In some scenarios, this agricultural land expansion is likely to be unsustainable, especially in Western Africa.
In 2010, West Africa’s observed agricultural area (arable land and permanent crops plus pastures and meadows) covers 243 million hectares. Forests cover 75 million hectares. Cultivated (i.e., arable land and permanent crops) area reaches 98 million hectares which is lower than the maximum cultivable area (i.e., GAEZ 1 to 4, Chapter 4) of 228 million hectares. In this region, in 2050, according to our hypotheses, arable and permanent crops areas increase considerably: from 98 million hectares in the initial situation to 169 million hectares with the Healthy scenario under technology C variant, and to 231 million hectares with the Metropolization and the Communities scenarios (Table 15.2 – West Africa). Arable land and permanent crops stay just below the maximum cultivable area of 228 million hectares with the Healthy scenario and with the Regionalization scenario. With the Metropolization scenario and the Communities scenario, arable land and permanent crops reaches the maximum cultivable area. The growth of cultivated area can be explained by rapid population growth (+192% by 2050) and changes in diets combined with weak performance of agricultural production systems today and a relatively low potential improvement. Pastures and meadows cover 145 million hectares in the initial situation, and in 2050, according to our hypotheses, pastures reach 151 million hectares with the Metropolization scenario Ultrap variant and around 270 million hectares with the Regionalization scenario because import dependence is reduced in this scenario so that greater quantities of agricultural products (including ruminant products) must be produced domestically.
In 2010 ECS Africa’s observed agricultural area covers 784 million hectares. Forest areas cover 597 million hectares. The cultivated area reaches 128 million hectares which is significantly lower than the maximum cultivable area of 928 million hectares (GAEZ 1 to 4). Thus, in most ECS countries (with the exception of countries such as Rwanda, Burundi, Uganda and Malawi, which are densely populated and already cultivate more than their maximum cultivable area), there is potential for growth in agricultural areas on land which is suitable for crops.
Hypotheses about population growth from 2010 to 2050 are +155%. According to our hypotheses, in 2050, the expansion of the agricultural area will be small (about +16%) with the Communities scenario and the agroecology variant and the Metropolization scenario with the Ultrap variant (Table 15.2 – ECS Africa). With all the other scenarios, the

* (im
ports
-exp
orts
)/do
mes
tic u
se; a
ll va
riabl
es m
easu
red
in c
alor
ies.
Tab
le 1
5.2
. Th
e si
tuat
ion
of la
nd
use
and
food
sec
urit
y in
SS
A in
20
50
acc
ordi
ng
to t
he
five
Agr
imon
de-
Terr
a sc
enar
ios.
Com
mun
ities
(A
E-Co
llaps
e)M
etro
poliz
atio
n (U
ltrap
-Ani
mp)
Regi
onal
izat
ion
(A-B
)Ho
useh
olds
Heal
thy
(C-D
)
Acce
ss to
land
Secu
re fo
r som
e co
mm
uniti
es,
inse
cure
for o
ther
sIn
secu
re a
cces
s to
land
. Hig
h la
nd p
rices
.Se
cure
acc
ess
to la
nd.
Depe
nds
on re
gion
s: s
ecur
e in
so
me,
inse
cure
in o
ther
s.
Secu
re a
cces
s to
land
.
Dist
ribut
ion
of la
ndDi
vers
ifica
tion
Spec
ializ
atio
nDi
vers
ifica
tion
Prod
ucts
with
hig
her a
dded
va
lue
Dive
rsifi
catio
n
Wes
t Afri
ca (m
illio
n ha
) Ra
nge
of a
gric
ultu
ral a
reas
(ini
tial:
243)
Ar
able
& p
erm
anen
t cro
ps (i
nitia
l: 98
) Pa
stur
es a
nd m
eado
ws
(initi
al: 1
45)
ECS
Afric
a (m
illio
n ha
) Ra
nge
of a
gric
ultu
ral a
reas
(ini
tial:
784)
Ar
able
& p
erm
anen
t cro
ps (i
nitia
l: 12
7)
Past
ures
and
mea
dow
s (in
itial
: 656
)
38
2 (+
57%
)-461
(+90
%)
231-
231
151-
230
926
(+18
%)-1
,430
(+82
%)
162-
322
764-
1,10
8
383
(+58
%)-4
16 (+
71%
) 23
1-23
1 15
1-18
5
897
(+14
%)-1
,331
(+69
%)
129-
181
768-
1,15
0
503
(+10
1%)-5
24 (+
116%
) 19
1-21
3 26
7-27
6
1,09
7 (+
27%
)-1,3
57 (+
73%
) 12
4-13
2 97
9-1,
225
Sam
e as
Reg
iona
lizat
ion
392
(+61
%)-4
23 (+
74%
) 16
9-19
3 22
3-23
0
1,20
5 (+
53%
)-1,2
56 (+
60%
) 11
1-12
8 1,
094-
1,12
8
Serv
ices
pro
vide
d by
the
land
(e
mpl
oym
ent a
nd e
cosy
stem
ser
vice
s)Go
od in
som
e co
mm
uniti
es,
and
few
in o
ther
s.Ve
ry fe
w. N
o at
tent
ion
to
serv
ices
pro
vide
d by
land
.Go
od: e
mpl
oym
ent i
n ag
ricul
ture
and
food
sys
tem
s.
Atte
ntio
n to
land
man
agem
ent.
In s
ome
area
s, c
olle
ctiv
e la
nd
man
agem
ent i
mpr
oves
ser
vice
s an
d em
ploy
men
t. In
oth
er
area
s, fe
w s
ervi
ces.
Empl
oym
ent a
nd e
cosy
stem
se
rvic
es.
Food
ava
ilabi
lity
av. K
cal/
p/da
y
Wes
t Afri
ca
ECS
Afric
a2,
663
2,
500
3,00
0
3,00
0 2,
663
2,
500
2,66
3
2,50
0 2,
750
2,
750
Food
acc
ess
(phy
sica
l and
eco
nom
ic)
Unev
en a
cces
s. D
epen
ds o
n th
e co
mm
uniti
es.
Ineq
uita
ble.
Acc
ess
faci
litat
ed
by e
cono
mic
dev
elop
men
t. Ea
sy in
met
ropo
les,
but
diffi
cult
in m
argi
naliz
ed a
reas
.
Unev
en a
cces
s. D
epen
ds o
n re
sour
ces
of th
e te
rrito
ry.
Acce
ss e
asy
for m
ulti-
activ
e an
d m
obile
hou
seho
lds.
Di
fficu
lt fo
r oth
ers.
Acce
ss fa
cilit
ated
by
econ
omic
co
oper
atio
n an
d fo
od p
olic
ies.
Di
vers
ifica
tion
of p
rodu
ctio
n.
Food
util
izat
ion
Heal
thy
diet
s fo
r co
mm
uniti
es p
ract
icin
g ag
roec
olog
y; p
oor d
iets
in
urba
n ar
eas.
Ultra
-pro
cess
ed fo
od. P
oor
nutri
tious
qua
lity.
Cons
umpt
ion
of lo
cal f
ood,
he
alth
y di
ets.
Mos
tly h
ealth
y di
ets,
but
som
e ho
useh
olds
hav
e po
or d
iets
.He
alth
y di
ets
for m
ost p
eopl
e.
Food
sta
bilit
yLo
w in
com
es in
urb
an a
reas
re
duce
s st
abili
ty.
Clim
ate
chan
ge le
ads
to
inst
abili
ty b
ut in
tern
atio
nal
mar
ket c
an s
tabi
lize
Faci
litat
ed b
y in
tra-re
gion
al
trade
.Ri
sks
whe
n th
ere
are
confl
icts
an
d sh
ifts
in a
llian
ces.
Stab
ility
if c
onsu
mpt
ion
of s
easo
nal p
rodu
ctio
n is
po
ssib
le.
Trad
e de
pend
ency
*
Wes
t Afri
ca
ECS
Afric
a9%
-23%
12
%21
%
16%
-10%
5%
1%5%
1%
11%
12
%
312
LAND USE AND FOOD SECURITY IN 2050
expansion of the agricultural area will be between +53% (Healthy scenario with variant C) and +82% (Communities scenario with collapse variant). In ECS Africa, the agricultural net import dependency was 12% in 2010. In 2050, it reaches 16% with the Metropolization scenario and the ultra-processed foods variant, and stays between around 12% with all other scenarios (Table 15.2 – Trade dependency).
With the Healthy scenario, in West Africa, in 2050, according to our hypotheses, agricultural areas expand by +67%, which is above the expansion of the agricultural areas with Metropolization scenario with Ultrap variant (+58%) and the Communities scenario with agroecology variant (+57%). It is below the expansion of agricultural areas with the Regionalization scenario (Table 15.2). With the Healthy scenario, in ECS Africa, the expansion of the agricultural areas is much higher (around +56%) than with the Metropolization scenario with Ultrap variant (+14%) and the Communities scenario with agroecology variant (+18%). However, the Healthy scenario insures secure access to land, integration of rural areas into urban networks through value chains, and thereby leads to employment. Also, practices such as agroforestry contribute to improved soil quality and storage of organic carbon in the soils, thus higher yield potentials. Above all, Healthy is the scenario which contributes most to reducing malnutrition and undernutrition and to preventing the development of obesity for all the population because of diets based on food diversity.
The Metropolization scenario with Ultrap variant does not lead to a major expansion of agricultural areas in ECS Africa and West Africa. However, in this scenario, extreme climatic events will contribute to land degradation and food crises. Land-grabbing will probably develop. Some groups will benefit from technological developments and a “green revolution”, but many farmers will not have access to land, water and inputs and will strive for survival. No attention will be paid to agricultural employment and ecosystem services. Metropolization scenario contributes most to inequality in access to food between urban and rural areas, and between the richest and the poorest. It also contributes to increased nutritional deficiencies, and the expansion of overweight and diet-related non-communicable diseases. Its impact on food trade dependency is significant, which means financial resources are necessary to import food. This scenario is also likely to result in increased price instability on world agricultural markets, which will be very detrimental in access to food for the poorest Africans.
The Communities scenario in SSA will lead to the deterioration of agricultural production performance, which is already low compared to the rest of the world. The on-going conflicts over land and water between communities, between farmers and herders, will become very important and may contribute to even more political and economic fragmentation. The number of households affected by food insecurity will therefore increase.
In SSA, the main limit of the Regionalization scenario is access to food, especially in West Africa. This scenario involves a limit in trade and therefore an increased capacity in local production. As West Africa is already close to its maximum cultivable area, the expansion of agricultural areas is at the expense of forests and cultivation on areas with a low agronomic potential.

313
15. Regional Dimension of the Agrimonde-Terra Scenarios
Conclusion
As far as land use and food security are concerned, six important and related challenges for SSA for the next 30 years are (a) to slow down the land degradation process and improve the agronomic potential of soils; (b) to secure access to land and water for local populations, especially for women, and to reduce competition over access to land and water between farmers and herders; (c) to improve crop yields and livestock efficiencies; (d) to absorb the booming labour force of young women and men in the context of an incipient economic transition and ensure their activities provide them with an income; (e) to improve local access to food for the population, whatever its origin, and (f) to feed the fast-growing population in the healthiest possible manner to reduce nutritional deficiencies, prevent stunting and avoid the development of obesity.
The five scenarios provide different answers to these challenges, and each one raises specific questions. In the Communities scenario, some farmers will organize themselves, develop agroecological farms and manage land so as to provide foodstuffs, energy and environmental services. Other farmers will fail to organize themselves and become more marginalized. There will, therefore, be inequity at continental and national levels and a struggle for resources. Access to food for all will mean increasing agricultural import dependency with a high risk of food price shocks. If the Metropolization scenario develops in SSA as in the rest of the world, there is a major risk of spatial divide and dual agriculture, degradation of the agronomic potential of soils due to climate change, a high number of landless farmers who become jobless, increased competition in agricultural markets between locally and imported products, as well as increased malnutrition, overweight and non-communicable diseases. Given the trends in the population and the current state of industries and services, this pathway seems to have far more disadvantages than benefits for SSA. With the Regionalization scenario, Africans will become the primary beneficiaries of their production. However, given the demand, the reduction of imports, especially of animal product imports, is likely to lead to considerable deforestation. Regionalization in the sense of a limitation in imports and exports does not make sense for Africa. All the other assumptions of the Regionalization scenario are potentially beneficial for SSA. With the Households scenario, an important challenge will be the regulation of the influence of foreign agri-business and ICT companies on African smallholders as States will not exercise their regulatory powers. Finally, the Healthy scenario requires major and difficult political changes as well as changes in diets in SSA; it leads to an expansion of agricultural areas, but also to carbon sequestration in soils; it can contribute to employment in the agri-food sector; therefore, it will be globally beneficial for land use and food security but not without challenges especially in West Africa where, in 2050, arable land and permanent crops will be close to the maximum cultivable area.
For SSA, examining the whole food system instead of looking only at agriculture could contribute to an improved relationship between rural and urban areas, and the creation of
314
LAND USE AND FOOD SECURITY IN 2050
jobs in agriculture and agricultural product processing; local access to food and nutrition could thus be improved. This development of the food system could have both negative and positive effects on other sectors. The negative effects could be a redirection of investment from other sectors and an increase in labour and capital costs, while positive effects could happen through increased demand.
Given the multiple pathways which are on-going and contradict each other and the importance of the challenges, given the fact that SSA is a puzzle (Hugon, 2016), each country in SSA should develop a vision of future land use and identify the best levers to change its on-going trajectory. This can only be done through discussions at a national level with a range of public and private stakeholders. The analysis provided above can serve as a basis for discussion, but each country (or group of countries) should build its own scenarios in relation to its specific context and past trends and breaks.

315
16. Lessons on Land Use and Food Security from the ScenariosChantal Le Mouël, Olivier Mora and Marie de Lattre-Gasquet
Introduction
In this chapter we report the main insights that can be drawn from the qualitative and quantitative analysis of the five Agrimonde-Terra scenarios. We summarize these insights in five broad messages which constitute the following five sections of the chapter.
Ensuring world food availability in 2050 will involve expanding the world’s agricultural land area…
Most Agrimonde-Terra scenarios lead to an expansion of the world’s agricultural land area (Table 16.1). Hence, according to our quantitative hypotheses (Chapter 14), the land-using effects of increased world food consumption (following increased world population, either reinforced or alleviated by changing food diets) tend to exceed the land-saving effects of increased performance in world agricultural production (following increased crop yields and improved livestock feed-to-output ratios).
❚❚ … But with major differences between scenarios
However, the extent of the expansion in world agricultural land varies widely across scenarios. It is particularly high for scenarios involving either a stagnation in crop yields and deterioration of livestock production performance (+2 billion ha or +41% for ’Communities with collapse’) or a huge increase in animal product consumption (+1.3 billion ha or +27% for ’Metropolization with animal products’). It is far more limited, even close to zero, for scenarios involving either reduced calorie availability in food regimes (+142 million ha or +3% for ’Communities with agroecology’) or a limited increase in consumption of animal products coupled with the substitution of ruminant meat with monogastric meat in meat consumption (+29 million ha or +0.6% for ’Healthy with agricultural technology C’ and –54 million ha or –1% for ’Metropolization with ultra-processed products’).
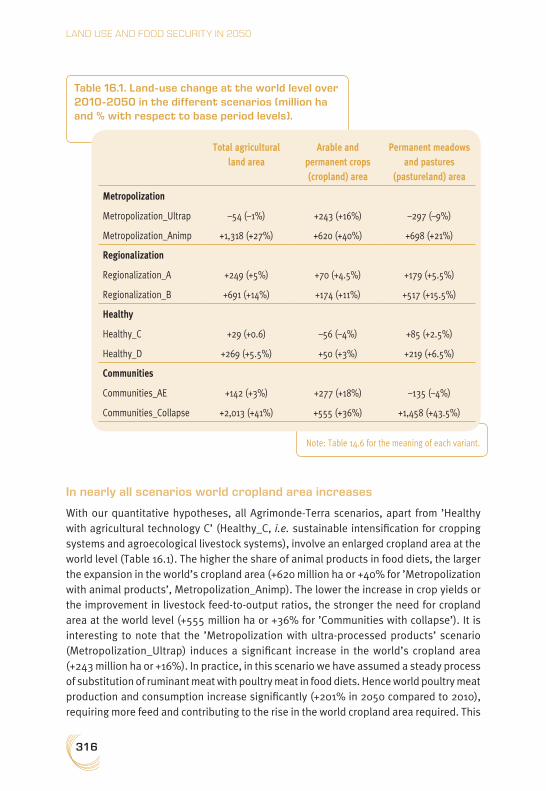
316
LAND USE AND FOOD SECURITY IN 2050
In nearly all scenarios world cropland area increases
With our quantitative hypotheses, all Agrimonde-Terra scenarios, apart from ’Healthy with agricultural technology C’ (Healthy_C, i.e. sustainable intensification for cropping systems and agroecological livestock systems), involve an enlarged cropland area at the world level (Table 16.1). The higher the share of animal products in food diets, the larger the expansion in the world’s cropland area (+620 million ha or +40% for ’Metropolization with animal products’, Metropolization_Animp). The lower the increase in crop yields or the improvement in livestock feed-to-output ratios, the stronger the need for cropland area at the world level (+555 million ha or +36% for ’Communities with collapse’). It is interesting to note that the ’Metropolization with ultra-processed products’ scenario (Metropolization_Ultrap) induces a significant increase in the world’s cropland area (+243 million ha or +16%). In practice, in this scenario we have assumed a steady process of substitution of ruminant meat with poultry meat in food diets. Hence world poultry meat production and consumption increase significantly (+201% in 2050 compared to 2010), requiring more feed and contributing to the rise in the world cropland area required. This
Note: Table 14.6 for the meaning of each variant.
Table 16.1. Land-use change at the world level over 2010-2050 in the different scenarios (million ha and % with respect to base period levels).
Total agricultural land area
Arable and permanent crops (cropland) area
Permanent meadows and pastures
(pastureland) area
Metropolization
Metropolization_Ultrap –54 (–1%) +243 (+16%) –297 (–9%)
Metropolization_Animp +1,318 (+27%) +620 (+40%) +698 (+21%)
Regionalization
Regionalization_A +249 (+5%) +70 (+4.5%) +179 (+5.5%)
Regionalization_B +691 (+14%) +174 (+11%) +517 (+15.5%)
Healthy
Healthy_C +29 (+0.6) –56 (–4%) +85 (+2.5%)
Healthy_D +269 (+5.5%) +50 (+3%) +219 (+6.5%)
Communities
Communities_AE +142 (+3%) +277 (+18%) –135 (–4%)
Communities_Collapse +2,013 (+41%) +555 (+36%) +1,458 (+43.5%)
317
16. Lessons from the Scenarios
adjustment mechanism is particularly marked in regions such as India and ECS Africa and, to a lesser extent, West Africa, where the share of meat in food diets is particularly low in the initial situation, so that transition in diets even when based on ultra-processed products induces a significant increase in meat consumption (Chapter 14). On the contrary, it is also interesting to note the ’cropland saving’ nature of the ’Healthy’ scenario (from –56 million ha in the variant C to +50 million ha in the variant D, i.e. agroecology for both cropping and livestock systems). In this scenario, the increase in world production and consumption of meat and animal products more generally is limited because of both the decrease in the daily calories available per capita in most regions and the substitution of pulses for animal products in regions where the share of animal products in food diets is initially high (developed and emerging regions, see EU 27, for example, in Chapter 14).
The change in the world’s agricultural area is mostly driven by the change in the world’s pastureland area
With our hypotheses, in most Agrimonde-Terra scenarios the change in the world’s agricultural land area is mainly explained by the change in the world’s pastureland area (Table 16.1). Once again, the lower the increase in crop yields or the improvement in livestock feed-to-output ratios, the larger the world pastureland area in 2050 (+1.46 billion ha or +43.5% for the ’Communities with collapse’ scenario). The higher the share of animal products in food diets, the larger the world pastureland area required (+698 million ha or +21% for Metropolization_Animp). The ’pastureland using’ nature of the ’Regionalization’ scenario (+517 million ha or +15.5% for ’Regionalization with agricultural technology B’, Regionalization_B, i.e., agroecology for both cropping and livestock systems) partly relates to the higher share of small ruminant meat in food diets involved in this scenario. Because in Africa and the Near and Middle East, traditional diets are based on small ruminant meat, the ’Regionalization’ scenario implies a significant increase in small ruminant meat consumption in these regions. Overall, the small ruminant sector is less efficient than monogastric sectors in transforming feed into meat, so the additional pastureland area required at the world level is significant.
❚❚ No further expansion of agricultural land at the world level with ’Metropolization_Ultrap’ and ’Healthy_C’
With our hypotheses, only the scenarios ’Metropolization with ultra-processed products’ (Metropolization_Ultrap) and ’Healthy with agricultural technology C’ (Healthy_C) are able to produce sufficient food for the expected growing population up to 2050 without further expansion in agricultural land and potential deforestation at the world scale. Under all the other scenarios, ensuring food availability in 2050 would require large additional agricultural land areas, which would likely be obtained through deforestation, at least partially. In some cases, world agricultural land expansion and then potential deforestation is so huge that the corresponding scenarios may be considered clearly unsustainable in 2050: both ’Communities_Collapse’ and ’Metropolization_Animp’ scenarios for example. Moreover, the ’Regionalization’ scenario also induces a significant expansion in world agricultural land, whatever the variant. Although more limited, the agricultural land

318
LAND USE AND FOOD SECURITY IN 2050
expansion and induced potential deforestation under the ’Healthy with agricultural technology D’ (Healthy_D) scenario puts into question the consistency of this scenario, given that it involves strong mitigation objectives aimed at stabilizing climate change.
The two scenarios which involve the largest expansion in agricultural land (’Metropolization’ with the animal product variant and ’Communities’ with the collapse variant) are also those where the political context leads to insecure access to land. In the first case, farm structures evolve towards ’hit-and-run agro-investments’ or ’independent farms’ contracting with agri-food companies. Land expansion will be stimulated by these farm structures, either by renting or grabbing the land of small farmers, who will then be displaced and may push the agricultural frontier further, or by expanding themselves. In the second case, farm structures evolve towards ’marginalized farms’ that practice subsistence farming in a degraded environment with high competition for access to land as a consequence of the increased rural population. It will be these farm-type structures which contribute to land expansion and it will not have the same impact on the rural population as in the first case. In the other three scenarios, the political context favours security in access to land and land expansion is more limited.
Limiting agricultural land expansion will require increased performance of agriculture in some regions
Given the initial situation and with our quantitative hypotheses, there are three regions where the agricultural land area expands significantly under all scenarios: India, West Africa and ECS Africa. This is not the case for other regions where agricultural land may expand or decrease according to the scenarios (Figure 16.1).
Figure 16.1. Regional agricultural land area in the initial 2010 situation and in 2050 in the various scenarios (million ha).
Source: GlobAgri-AgT model.

319
16. Lessons from the Scenarios
Beyond the historical social, economic and political differences between India as a continent-wide country and Africa as a 45 country-continent, the initial situation (initial food diets and initial agricultural performance), the Agrimonde-Terra hypotheses for food diets in 2050 (and their quantitative translation) and the UN projections adopted for population change largely explain this specific situation for India, West Africa and ECS Africa.
❚❚ In India, West Africa and ECS Africa, hypotheses on dietary changes lead to increased consumption of animal products in all scenarios
India, West Africa and ECS Africa all show initial food diets where both the daily calorie availability per capita and the share of animal products (especially meat) are the lowest in the world: 2,390 kcal/cap/day including 6% of animal products and less than 1% of meat for India; 2,663 kcal/cap/day including 3% of animal products and 2% of meat for West Africa; 2,225 kcal/cap/day including 9% of animal products and 4% of meat for ECS Africa. Hence, as all our hypotheses about the future of food diets result in an increase to 2,500 or 3,000 daily kcal per capita in 2050 and an increase to 10% or 16% in the share of animal products for those regions which are below these levels in the initial situation, India, West Africa and ECS Africa all experience changes in diets which are little differentiated across the scenarios (except for the share of meat in ’Metropolization_Animp’) and which induce a rather large increase in the share of animal products in diets (Chapter 14). However, in India, due to traditional vegetarian diets, meat consumption remains stable in all scenarios apart from ’Metropolization_Animp’ which assumes a huge increase in meat consumption, notably poultry meat; in the ’Healthy’ scenario, Indian consumption of animal products is replaced by consumption of pulses.
❚❚ India, West Africa and ECS Africa are likely to experience a strong population increase from 2010 to 2050
West Africa and ECS Africa are the two regions where the population is expected to increase the most in the world: +192% and +155% respectively from 2010 to 2050. The expected population increase is lower in India (+45%) but remains very substantial in absolute numbers given the current size of the Indian population.
The combination of dietary change and increasing population implies huge consumption increases, notably for animal products, in the three regions in all scenarios. In this regard it is interesting to emphasize the contrasting positions of India and China regarding diet and population change on the one hand, and the resulting expansion in agricultural land on the other. In contrast to India, the Chinese population is expected to stop growing and remain stable from 2010 to 2050. Furthermore, in China, our hypotheses for the future of food diets result in stable or a decrease in daily calorie availability per capita as well as a fall in the share of animal products in diets in all scenarios except ’Metropolization_Animp’. Hence it is not so surprising that while both regions already use nearly all their cultivable area in the initial situation (Chapter 14), in most scenarios China experiences
320
LAND USE AND FOOD SECURITY IN 2050
a reduction in its agricultural land area while India expands its agricultural land area (Figure 16.1) and is increasingly constrained by its cultivable area.
❚❚ In India, West Africa and ECS Africa the performance of agricultural production systems is rather weak in the initial situation
This third piece of the puzzle is particularly significant in the two African regions (Chapter 14) where the acceleration in the growth of crop yields and in the improvement of livestock feed-to-output ratios, which is assumed in most of our scenarios, closes only partially the initial gap observed with the average performance of developed and emerging regions.
Therefore, it is not surprising that all three regions are among the largest contributors to the expansion of the world’s agricultural land area in all Agrimonde-Terra scenarios, either through an expansion of the cropland area (India and West Africa) or through the expansion of pastureland area (ECS Africa). As a direct consequence, these three regions are likely to experience significant deforestation in most Agrimonde-Terra scenarios. Hence, it is clear from Figure 16.1 that under our quantitative hypotheses, all of our Agrimonde-Terra scenarios are unsustainable for West Africa, ECS Africa and, to a lesser extent, India, which would all experience a dramatic expansion in their agricultural land area, seriously threatening their forest area.
❚❚ Limiting agricultural land expansion in India, West Africa and ECS Africa will require improvements to the performance of their agriculture
In other words, given the hypothesis of population increase in West Africa, ECS Africa and, to a lesser extent, India, and given the hypotheses about food diet evolution in these regions, especially the increasing consumption of animal products, ensuring world food availability in 2050 without major deforestation around the world would certainly require limiting the expansion of the agricultural land area in these regions either by increasing imports or through improving the performance of their agricultural production systems, especially livestock production systems. Increasing Indian, West African and ECS Africa imports would make it possible to save some agricultural land area, avoiding some of the potential deforestation in these regions. Such an adjustment would not induce more potential deforestation at the world level provided that the available agricultural land in other regions is sufficient for producing these additional imports. But it would also mean that these three regions have the means to buy food abroad.
Increasing the performance of Indian, West African and ECS African agricultural production systems, particularly livestock systems, would also be a land-saving lever, making it possible to reduce the threat to forest areas. Our hypotheses on the future of cropping and livestock systems result in a sharp improvement in performance of the agricultural production systems

321
16. Lessons from the Scenarios
in the three regions, especially in the African ones, in most scenarios. There is, however, uncertainty regarding the potential for increased performance in all three regions.
Let us underline at this stage that West Africa and ECS Africa are the two world regions exhibiting the lowest initial performance in terms of livestock feed-to-output ratios, especially in ruminants. For instance, in the initial situation, the feed-to-output ratios of the mixed systems in the dairy sector and in the beef sector in the two African regions are five (dairy sector in ECS Africa) to 15 (beef sector in West Africa) times higher than those of the EU 27 (one of the world’s best performers in dairy and beef meat production). This means that producing 1 tonne of milk or of bovine meat in ECS Africa or West Africa requires five to 15 times more dry matter feed than in the EU. Of course, there are great uncertainties regarding the initial livestock feed-to-output ratio data, notably in West Africa and ECS Africa. In this regard it is worth noting the roles of livestock in West and ECS Africa (and in India) where mixed crop-livestock systems and pastoralism are very common and livestock not only provide nutrient-rich food products but also draught power, organic manure and domestic fuel; livestock also serve as a source of income, as a means for capital accumulation and insurance against income shocks, generate employment and play a role in the security of territories. Despite huge uncertainties, one may assume however, notably on the basis of literature and experience, that room for manoeuvre exists for improving livestock feed-to-output ratios in all three regions.
Whatever the scenario, international trade will play a key role for ensuring world food availability in 2050
World trade increases in all scenarios, apart from ’Regionalization’ (Figure 16.2). Unsurprisingly, ’Metropolization’ is the scenario inducing the highest increase in world trade (from 2010 to 2050, world exports in kcal would increase by +151% under the ’Animal products’ variant and by +71% under the ’Ultra-processed products’ variant), while the ’Healthy’ and ’Communities’ scenarios result in far smaller rises (from +20% to +30% according to the scenario and variant). In contrast, the regionalization of food systems involved in the ’Regionalization’ scenario logically leads to a reduction in world trade (–15% in both variants).
Beyond these global figures, the Agrimonde-Terra scenarios lead to far different world trade configurations and positioning of regions in international trade (Figure 16.2). ’Metropolization’ relies on international trade and specialization. Hence in this scenario, world agricultural production concentrates both on a few products and in a few of the most competitive regions. Regions with lower comparative advantages become more dependent on imports. In such a situation, ensuring world and regional food availability requires increased trade flows between exporting and importing regions. In ’Metropolization’, agricultural production and exports are clearly concentrated in Brazil/Argentina and Canada/USA, two regions benefiting from large areas of available

322
LAND USE AND FOOD SECURITY IN 2050
cultivable land. In contrast, North Africa, the Near and Middle East, India, West Africa and ECS Africa experience dramatic rises in their agricultural imports, increasing their dependence on world markets to ensure their food availability. This raises questions about access at the regional level and probably at the household level too. Interestingly, we note that concerning exports, the concentration process is more marked in the ’Animal products’ variant than in the ’Ultra-processed products’ one. In the ’Animal products’ variant, Brazil/Argentina and Canada/USA share the leadership on world agricultural export markets because they are the both largest exporters of animal products and feed ingredients. In the ’Ultra-processed’ variant, both regions share the leadership on world agricultural export markets with the Rest of Asia due to the significance of
Figure 16.2. Agricultural trade in the initial 2010 situation and in 2050 in the various scenarios (1,000 Giga calories).
Source: GlobAgri-AgT model.
a. Gross exports
b. Gross imports

323
16. Lessons from the Scenarios
this region in palm oil exports and the central role of vegetal oils in the diet based on ultra-processed products.
World trade also increases under the ’Healthy’ scenario, but to a significantly lesser extent and without the concentration process specific to ’Metropolization’. ’Healthy’ is one scenario allowing net importing regions to alleviate the increasing trend in their food import dependence, and in addition with higher quality standards for products on international markets. Reducing the dependence on international trade is part of the spirit of ’Regionalization’ but world trade would be far from finished and would continue to play a key role regarding food availability.
According to our hypotheses, some regions are likely to become highly dependent on imports for their food whatever the scenario. This is clearly the case for North Africa as well as the Near and Middle East, with both regions initially strongly dependent on imports, a situation which worsens in all scenarios. This also seems to be the case for West Africa and to a lesser extent for India. These four regions experience strong population growth, pushing up food demand, but are either constrained or almost constrained by their cultivable land area, which limits the potential for an increase in domestic production in most scenarios. In this regard, the almost 80% net import dependence that North Africa reaches in the ’Metropolization’ scenario (meaning that in 2050, 80% of North African food needs are covered by imports) is due, at least partly, to the loss of half its cultivable area induced by the strong climate change hypothesis involved in this scenario.
In all scenarios, apart from ’Regionalization’, India and West Africa would experience a significant increase in their import dependency, which is often double or even four times greater than in the initial situation. Both these regions have small reserves of cultivable land for meeting the increase in domestic consumption. Hence they start to increase their imports. The case of India under ’Metropolization’, whereby food diets change towards an increased share of animal products, is particularly striking: facing the upper limit of cultivable land, India starts to import both feed ingredients and monogastric meat.
Over-reliance on food imports can increase the risk of disruption to supply and access caused by global fluctuations in production and price volatility, as well as trade wars. Over-reliance on food imports also places a significant burden on State budgets.
Increasing food and nutritional diversity in 2050 will require greater diversification in cropping and livestock systems
Among Agrimonde-Terra scenarios, two involve increased food and nutritional diversity in 2050: the ’Healthy’ scenario and, to a lesser extent depending on traditional regional
324
LAND USE AND FOOD SECURITY IN 2050
diets, the ’Regionalization’ scenario.73 According to our hypotheses, both these scenarios lead to an expansion in agricultural land, thus potential further deforestation, at the world level, but to a very different extent depending on the scenarios and the variants within each scenario.
First of all, increasing food and nutritional diversity through the ’Healthy’ scenario would use significantly less land than increasing food and nutritional diversity through the ’Regionalization’ scenario (Table 16.1 and Figure 16.1). In addition to the differences between the ’Healthy’ and the ’Regional’ food diets, implying differentiated changes in regional food consumption of various products, the decrease in inter-regional trade in the ’Regionalization’ scenario also contributes to greater land use. By favouring the substitution of imported products with local ones, the ’Regionalization’ scenario also leads to increased production in regions which are less productive, resulting in a greater requirement for agricultural land at the world level. All in all, the land-use changes induced by both scenarios exhibit significant discrepancies, the ’Regionalization’ scenario achieving increased food and nutritional diversity at a far greater cost in terms of the global expansion of the agricultural land area than the ’Healthy’ scenario: +249 million ha agricultural land (+70 million ha cropland and +179 million ha pastureland) under ’Regionalization_A’ and +29 million ha agricultural land (–56 million ha cropland and +85 million ha pastureland) under ’Healthy_C’ for instance.
Secondly, among the possible development paths for cropping and livestock systems, the A and C variants would demand significantly less land than the B and D variants, whatever the scenario. This is not surprising and is closely related to the quantitative hypotheses adopted, which make changes in crop yields up to 2050 more favourable in the variants ’Regionalization_A’ and ’Healthy_C’ than in the variants ’Regionalization_B’ and ’Healthy_D’. The same thing is observed for average livestock feed-to-output ratios, but only in the ’Regionalization’ scenario (Chapter 14, Table 14.5). Beyond the quantitative hypotheses, which may be questioned given the lack of empirical evidence on the input-to-output performance of crops and animals in agroecological systems compared to conventional systems, both scenarios suggest the unavoidable need for the appropriate diversification of cropping and livestock systems (mainly regarding the composition of animal rations) together with an increase in food and nutritional diversity if we wish to limit the expansion of agricultural land and, therefore, deforestation around the world.
An illuminating illustration is the situation of Brazil/Argentina in both scenarios. In Brazil/Argentina, the increased food and nutritional diversity involved in both the ’Healthy’ and the ’Regionalization’ scenarios (as well as the reduced inter-regional trade in the latter) contradicts the development path the region had previously adopted, at least for
73. The ’Communities’ scenario also increases food and nutritional diversity in 2050 since it shares the same food diet pathway as the ’Regionalization’ scenario. But in this case, because of the context of crises and low economic growth, the increased diversity is compensated by a decrease in available energy per capita and per day (Chapter 14).
325
16. Lessons from the Scenarios
an important chunk of its agriculture: openness on international markets, simplification of production systems and specialization in products at the heart of the nutritional transition (vegetable oils, sugar and poultry meat). Hence these scenarios would lead to tremendous changes for Brazil/Argentina’s agriculture, which would experience a decrease in agricultural land area (from –5 to –12% according to the variant and scenario) following the –25% (’Healthy’) or –50% (’Regionalization’) decrease in domestic soyabean production, the –10% decrease (’Healthy’) or quasi-stagnation (’Regionalization’) in domestic production of sugar plants and products and the quasi-stagnation in the production of animal products in both scenarios. Of course, given the assumptions in the scenarios, the production of some diversified products would increase substantially (nearly a +350% increase in fruit and vegetable production in the ’Healthy’ scenario and nearly a +150% increase in roots and tuber production in the ’Regionalization’ one) and, according to our quantitative hypotheses, their yields per hectare as well. This faster increase in per-hectare yields of diversified products (resulting from induced technical change) avoids an expansion in agricultural land in Brazil/Argentina in both scenarios. Hence, these results suggest that for some regions, such as Brazil/Argentina, increasing food and nutritional diversity all over the world would imply huge changes in their production systems and a total redesign and adaptation of production systems aimed at diversity. This could take some time and in the meanwhile it is likely that following increased food and nutrition diversity, agricultural land would expand in these regions.
Only the ’Healthy’ scenario is likely to be able to ensure world food and nutrition security in 2050
Among the Agrimonde-Terra scenarios, at least two are clearly not able to ensure sustainable world food and nutrition security in 2050: the ’Metropolization’ (both variants) and the ’Communities’ scenarios, notably under the ’Collapse’ variant. Furthermore, two have ambiguous results: the ’Regionalization’ and the ’Households’ scenarios. Only the ’Healthy’ scenario seems likely to be able to meet the objective of world food and nutrition security in 2050.
❚❚ ’Healthy’: Reduction in over and undernutrition with limited agricultural area expansion
’Healthy’ is the scenario which contributes most to reducing not only overnutrition and its related diseases, but also undernutrition. This is also the one scenario allowing world food availability to be achieved at the cost of a rather limited expansion in the agricultural land area at the world level. There are some regions, however, where promoting healthier diets induces an increased consumption of animal products, such as India, West Africa and ECS Africa. In these regions, even the ’Healthy’ scenario is likely to induce an expansion in the agricultural land area and potentially significant deforestation. As the ’Healthy’ scenario

326
LAND USE AND FOOD SECURITY IN 2050
also involves a strong commitment from governments, corporations and international institutions to mitigating climate change, requiring the production of renewable energy and the maintenance of world forest cover as far as possible, there are potential tensions between the objectives of food security and climate change stabilization, resulting in increased competition for land between agricultural and forestry uses. Agroforestry and farming practices that contribute to improved soil quality and the storage of organic carbon in soils (thus yield potentials) could be very interesting options in this case, since they simultaneously work towards the objectives of food security and climate change stabilization.
❚❚ ’Metropolization’: Unsustainable from both the public health and resource preservation perspectives
’Metropolization’ is the scenario which contributes most to the expansion of overweight, obesity and diet-related non-communicable diseases all over the world, with considerable impacts on public health and economic activities. In setting up a kind of race between changing food systems, increasing yields, deteriorating natural resources and propagating diet-related non-communicable diseases, ’Metropolization’ induces a series of effects which work against food and nutrition security at various levels. Firstly, as far as food availability is concerned, previous analysis has clearly shown that the propagation all over the world of animal rich food diets is unsustainable both at the world level and for some regions. However, the expansion of agricultural land area and related potential deforestation could be significantly reduced if transition in diets was based on ultra-processed products all over the world. Secondly, ’Metropolization’ relies on crop and livestock systems which are sensitive to climate change and contribute to natural resource degradation (notably soil and water). This throws into question the future performances of such systems and therefore world food availability in the longer term. Thirdly, this uncertainty, combined with the international specialization process involved in the ’Metropolization’ scenario, is likely to result in increased price instability on world agricultural markets, which is likely to put into question the stability dimension of world and regional food security. Fourthly, as ’Metropolization’ involves increased spatial and economic inequalities, a large section of the rural and urban population is marginalized with poor access to food due to low incomes.
❚❚ ’Communities’: Multiple crises and reduction of food availability at the world and regional level
’Communities’ is a multi-crisis scenario in which the deterioration in agricultural production performance would create a reduction in food availability at the world and regional level. Because every region needs more land to meet its food needs, there is a struggle for resources, with very serious tensions over land and a degradation of natural resources, including soils. Long-term world food availability is put into question. World food availability and accessibility can be ensured only if communities are able to re-build collectively

327
16. Lessons from the Scenarios
local food systems based on agroecological cropping and livestock systems. But even if this is the case, the smaller expansion in agricultural land area corresponds to a –10% decrease in daily calorie availability per capita in most regions. In developed countries, this reduction in food availability could contribute to reducing overnutrition and related diseases. In developing countries, however, it could cause increased undernutrition, affecting women and children. In addition, as the ’Communities’ scenario involves sluggish economic growth all over the world, households are likely to see their incomes stagnate or even decrease and therefore they could face difficulties in accessing food, mainly in urban areas. On the other hand, re-built local food systems could facilitate food access for rural populations as well as contributing to increased food and nutritional diversity through the crop diversification involved in agroecological cropping systems.
❚❚ ’Regionalization’: Ambiguous results
The ’Regionalization’ scenario induces a series of changes that work in favour of world and regional food and nutrition security, but at the same time leads to ambiguous results regarding world food availability. ’Regionalization’ is a scenario opposing the global convergence of diets towards a few standardized products through the promotion of traditional diets and products. It therefore favours food and nutritional diversity and contributes to limiting the development of diet-related non-communicable diseases in world and regional populations, mostly by reducing the global diffusion of ultra-processed foods. This scenario also involves the development of agri-food industries in small and medium-sized cities acting as intermediaries between rural areas and urban centres. These industries positively affect rural development, rural employment and rural incomes for men and women. Hence ’Regionalization’ may improve access to food for rural populations. However, ’Regionalization’ is only able to ensure world and regional food availability at the cost of a significant expansion of the agricultural land area and a considerable threat to forest area at the world level. Land area expansion and potential deforestation by farmers may even be dramatic in regions poorly endowed with land and sometimes poor in other natural resources (water, for instance) such as North Africa, the Near and Middle East, India and West Africa, or better endowed with land but exhibiting poor agricultural productivity such as ECS Africa. In such regions, the ’Regionalization’ scenario appears rather unsustainable.
❚❚ ’Households’: An intermediate scenario with reduced undernutrition but increased overnutrition
Finally, ’Households’ appears as an intermediate scenario, contributing to a decrease in undernutrition but with the opposite effects on overnutrition. Changes are induced by a wide variety of actors (groups of citizens, associations, NGOs, enterprises etc.). Regarding food and nutrition security, ’Households’ is an intermediate scenario which has common elements with three other scenarios. It shares with ’Healthy’ a major public interest in
328
LAND USE AND FOOD SECURITY IN 2050
nutrition, but State regulation is not involved. It shares with ’Regionalization’ the idea that local food systems could respond to demands from consumer groups; the food diversification implied could have a positive impact on overnutrition. However, the main question raised by such a scenario is the extent to which changes in demand towards healthier foods from various consumer groups are able to induce the transformation of food systems without a regulatory framework. It therefore seems plausible that ultra-processed foods would retain non-negligible shares in both food diets and food systems in the ’Households’ scenario, contributing to an increase in overnutrition. Finally, ’Households’ is a scenario in which households use mobility to diversify their sources of incomes, accessing non-farm jobs in urban or rural areas. This income diversification is likely to improve food access and result in reduced undernutrition.
Conclusion
Agrimonde-Terra’s scenarios identify a diversity of pathways of change for agricultural land use and food security in 2050. They highlight the fact that we are entering a period of great uncertainty and instability, which finds its origin in the dynamics and the interconnectedness between trend factors (demography, urbanization, climate change etc.), uncertainty and risk factors (economic growth, employment, eating patterns, climate change mitigation etc.), private actions and public policies at local, national and international levels.
Agrimonde-Terra’s scenarios also suggest that ensuring world and regional food and nutrition security in a context of climate change is a difficult, long and narrow path. Public policies are likely to have a key role in guiding current agricultural and food systems towards this path.

329
17. Options for Public PoliciesMarie de Lattre-Gasquet
Introduction
The Agrimonde-Terra scenarios demonstrate that the road to global food and nutrition security is narrow. If there is food insecurity at a global level, it means that a number of households are food insecure in a number of countries, and this might be a catalyst for major security problems and costly health issues at the local, national and regional levels. Two scenarios are clearly not able to ensure sustainable world food and nutrition security in 2050. In the ’Metropolization’ scenario (both variants), where cities are fed at the expense of rural areas, some groups in rural areas can face undernutrition while in metropolises some people are over and poorly fed and face health problems. In the ’Communities’ scenario, the deterioration in agricultural production performance creates a reduction in food availability at the world and regional level. In these two scenarios large groups of the population could be hit by undernutrition and even hunger, and this situation could lead to fights over food supplies, land and water within countries and even between countries. The hunger riots that took place during the 2008 food crisis are manifestations of what could take place before 2050 at a global level if the ’Metropolization’ and the ’Communities’ pathways develop. The ’Regionalization’ scenario appears to be unsustainable in Africa, the Near and Middle East and India because of the ’food sovereignty’ approach, which is unrealistic in regions where population growth is rapid. Undernutrition and hunger in these regions could lead to major international migrations and conflicts. With the ’Household’ scenario, there are risks of instability in food supply availability when conflicts arise between interest groups, causing a sudden shift in stakeholder networks and alliances. Only the ’Healthy’ scenario seems likely to meet the objective of world food and nutrition security in 2050 while managing resources in a sustainable manner.
A foresight exercise aims to inform policy-making and to provide vision at the service of action. After exploring probable futures of land use and food security, it is therefore appropriate to think about possible strategies and policies. The lessons of the process have therefore been translated into six general objectives regarding the issues and choices to be given priority over the medium term, irrespective of the scenario for the future; we also offer operational objectives for each general objective. No policy measures are proposed as these are nationally specific. Second, we propose a few objectives for policies for each scenario.
330
LAND USE AND FOOD SECURITY IN 2050
Whatever the scenario: six general objectives for policies
There are no one-size-fits-all solutions. Each region and each country should find its own pathway related to its past situation and ongoing trends. It needs to identify its own policies and its leverage points and their feedback loops to change pathways. However, there are ’no-regret’ objectives, i.e. objectives that should be pursued whatever the scenario because of the importance of the challenge in order to avoid catastrophes.
❚❚ Objective 1: Building synergetic governance for land use and food security at different spatial scales
It is crucial to build global governance on land use and food security to prevent food crises, land grabbing and degradation, and to mitigate the effects of climate change. Several of the 17 interlinked and integrated Sustainable Development Goals (SDGs) of Agenda 2030 are particularly related to land use and food security. These are: achieving zero hunger (SDG 2), halting the spread of diet-related non-communicable diseases (SDG 3) while empowering women (SDG 4), having affordable and clean energy (SDG 7), mitigating climate change (SDG 13), and sustainably managing forests and reversing land degradation (SDG 15). They can only be accomplished if the existence and experience of the 570 million farms as well as the diversity of the supply chain actors are taken into account, and if all stakeholders recognize the limits of world resources and accept the need for healthier diets and stabilization of climate change and the necessary socio-technical transformation of agriculture as well as investing some of their profits for this transformation. It also implies focusing on systems, on qualitative variables and not only on food availability and the need to increase productivity (Bourgeois and Losch, 2017). Collective action and cooperation could give the issue of food and nutrition security the status of a global public good, as has been done for the environment (climate change and biodiversity). Efforts to reconcile science and society could be undertaken. Ongoing global initiatives and places for discussions are numerous, e.g., Conferences of Parties, Codex Alimentarius, International Plant Protection Convention (IPPC), World Organization for Animal Health (OIE) and Committee on World Food Security. They must take into account a variety of positions but remain as independent as possible from lobbies, whether they are from the private sector or NGOs. Global initiatives have however two limits. First, although governments are involved in the discussions of these initiatives, they do not always implement their recommendations. Second, they could tend to promote uniform standards, but keeping diversity of action is very important because regional and national conditions and consumer and citizens’ preferences often differ (OECD, 2016).
Therefore, it is also crucial to reinforce national governance of land use and food security with a wide range of stakeholders who can play multiple roles in land use and food security (e.g., farmer and researcher, consumer and intermediary) (FAO/INRA, 2016). Furthermore, it is only by having policies built with participatory governance that unsustainable land

331
17. Options for Public Policies
use and food insecurity can be fought. The continuum of participation in policies can take several formats such as the contribution to predetermined policies, consultation, cooperation and consensus-building. It means including a large variety of stakeholders so that the interest of a few stakeholders does not dominate over the others. Groups which have been hitherto excluded from public policies, for example representatives of landless farmers or smallholdings or of consumers’ associations, should be included. They can learn how to professionally negotiate public policy projects for rural development and become ’transactional leaders’ who are essential to the proper functioning of public policies, as has been done in countries such as Brazil (Massardier et al., 2012). Participatory governance also means having a reliable and valid knowledge base of the past and present situations of land use and food security. It should include different knowledge sources, e.g., expert and practical knowledge, in order to be socially robust.
But the national level is not enough because it is at the territorial level that most decisions on land use are taken. A territory is a geographical area within which there is “a set of social, economic, cultural and political processes that include systems of local or locally-involved players” (Vanier, 2009). They provide a framework for individual or collective social, technical, organizational and institutional innovation. The promotion of ’terroir’ or origin-linked products is a striking example. Access to land, work, production and exchanges fit into a local system of social relations and forms of power, the original combination of which may foster (or on the contrary hamper) cooperation, coordination and information dynamics.
At each spatial scale, for the transformation to succeed, there must be a common understanding of the policies and plan, the roles of each stakeholder and the management of the process.
The toolbox designed by Agrimonde-Terra can be a help in the preparation of policies and strategies at the national and territorial levels (Box 17.1).
For objective 1, operational objectives are: – Establishing and promoting links between policy makers, industries and services from
the agri-food, energy, financial and trading sectors, farmer-based organizations, research organizations and support services.
– Improving commercial integration among farmers, merchandisers and processors wit-hin the agricultural value chain, including improvement in risk transfer, technology trans-fer, product development, logistics and market information transfer.
– Supporting the development of farmers’ organizations and cooperatives, promoting farmer-based approaches aimed at enhancing the capacity of farmers’ organizations in all spheres of their existence, especially in management and finance.
❚❚ Objective 2: Developing coherent and coordinated policies on land use and food security
Having coherent land use and food and nutrition policies that consider the five complementary, interlinked and dynamic dimensions of land use and the four dimensions

332
LAND USE AND FOOD SECURITY IN 2050
Sources: de Lattre-Gasquet et al. (2017a); INRAT-PHARE (2017); Elloumi et al. (2017).
Box 17.1. Building national governance for land use and food security: The contribution of Agrimonde-Terra in Tunisia
In March 2015, the ability of Agrimonde-Terra’s outputs to be used as a ’tool for dialogue’ for the construction of national land use scenarios was tested in Tunisia. A two-day workshop was organized at the initiative of the Institut National de la Recherche Agronomique de Tunisie (INRAT) and part of the Agrimonde-Terra team, with the Syndicat des Agriculteurs de Tunisie (Synagri). Twenty Tunisians from the Ministry of Agriculture, the Ministry of Environment, agricultural development groups, farmers’ associations, Bizerte agri-industrial hub and representatives of three development agencies participated.
The Agrimonde-Terra land use and food security system and assumptions were the basis for building land use scenarios for Tunisia. The following method was used:1. A shared diagnostic of land use in 2015 in Tunisia. A retrospective analysis
prepared by the Agrimonde-Terra team formed the basis for discussion.2. Preparation of assumptions for the future using as a basis for discussion the
retrospective analysis and the assumptions prepared by Agrimonde-Terra.3. Construction of land use scenarios for Tunisia. These scenarios were specific to
Tunisia but shared some similarities with the Agrimonde-Terra scenarios.4. Comparison of the Tunisian scenarios and identification of the most important
challenges. 5. Identification of policy objectives and measures that should be taken whatever
the pathway, and leverages to shift to the most sustainable pathway.
In 2017, the report ’For a successful, sustainable and resilient agriculture. Strategic options for a new paradigm for agricultural and rural development’ prepared by the Forum Agriculture and Rurality (PHARE), a think-tank led by the Institut National de la Recherche Agronomique de Tunisie (INRAT), and the Tunisian report of the Agricultural Transformation Pathway Initiative (ATPi) presented the Tunisian sce-narios designed with the help of Agrimonde-Terra. They also used one of the sce-narios as a basis for the identification of challenges and future objectives, and recommendations for actions.
In 2018, within the framework of a ’Twinning programme’ financed by the European Union to support the Ministry of Agriculture, Water Resources and Fisheries and to strengthen its capacities for developing and implementing inclusive, participatory and long-term agricultural and rural policies, three training sessions on foresight and three training sessions on agricultural policy-making took place for the mana-gers of the Ministry and related institutions. During the training sessions, the par-ticipants carried out a very rapid exercise about the futures of land use and food security in a Tunisian governorate. Participants were struck by their own capacity to imagine several possible futures and how these helped in proposing new policy objectives and measures.
333
17. Options for Public Policies
of food security, as well as the interconnections between the drivers of the land use and food security system, will contribute to the fact that food insecurity does not become a catalyst of global insecurity. Coherence between national policies and global governance, as well as between territorial actions and national policies, must be searched. At the national level, lack of coordination combined with limited economic resources tends to diminish the possible impact of interventions. Policy coherence implies integrating the multiple dimensions of land use and food and nutrition security at all stages of policy making to exploit positive synergies across policies to support food and nutrition security, to increase governments’ capacities to balance divergent policy objectives and to avoid or minimise the negative side-effects and impacts of land use policies on food security.
Policy processes must be up to the task of managing complex land use and food security systems and serving the public interest instead of a particular interest. This means breaking out of the policy ’silos’ with each policy having its own objectives and time scales, and having a more holistic approach with policy interventions which tackle diverse aspects of a problem simultaneously. It also means avoiding a ’dual policy approach’ with, for example, on the one hand policies promoting the conventional intensification of agriculture and on the other social policies to fight poverty. Integrated land use and food security policies are required to overcome the biases of sectoral policies and the decrease in importance of rural development policies. Progress towards breaking out of silos can be achieved through discussions between representatives of various ministries and agencies.
To reach this objective of coordinated and coherent policies, four operational objectives are:
– Reconciling domestic policy objectives with broader international objectives, notably the Sustainable Development Goals (SDG). The SDGs involve significant challenges in terms of both domestic actions and responsibilities at a global level. A number of countries and regional institutions such as the European Union have been active in negotiations and planning the SDGs as well as other United Nations processes about climate change, but are not necessarily developing action plans that are congruent with the decisions taken. Improving policy coherence is a long-term process that requires strong political leader-ship (Gregersen et al., 2016).
– Agreeing on a limited set of priorities, pursuing a reduced number of objectives but with simultaneous investment in infrastructure, skills, research and innovation, and defining steps towards the goal. This requires weighing the trade-offs among multiple objectives, anticipating the need for agility, looking for synergies and abandoning certain actions. A plan for transforming land use will not succeed if it tries to cover everything. It should focus on the changes that are most likely to impact food and nutrition security, therefore selectively focusing on the points of the system where small changes are likely to cause larger shifts. This means identifying goals on a limited number of crop and livestock value chains and working with stakeholders of the whole value chain (link with objective 1). It also means considering explicitly the trade-offs and communicating them.
– Extending agricultural policies to rural policies promoting all the functions and dimen-sions of family farming. This means recognizing that family farming has a production

334
LAND USE AND FOOD SECURITY IN 2050
function but also fulfils functions for society and territories. Agricultural production leads also to income generation and capitalisation, management of natural resources, shaping of landscapes, development of food systems, social relations in communities, relation-ships between generations and genders etc. (Bélières et al., 2015). Production is also a territorialized action and the recognition of family farming also involves recognising its contribution to the creation and renewal of territorial resources (Bélières et al., 2015). Also, better coordination of agricultural, trade, environmental, biofuels and food safety policies that currently buffer farmers from risk is necessary and could facilitate the inte-gration of crops and livestock (Garrett et al., 2017).
– Having evidence-based policies. Data should be used to comparatively assess costs and likely outcomes of different policies, as well as to redirect programmes where out-comes are not meeting targets.
❚❚ Objective 3: Promoting changes on both the demand and supply sides for transition towards healthy diets and reduced waste and losses
Attaining food and nutrition security for all, and especially for the most vulnerable households, involves a transition from current diets to healthier and more diversified diets, as well as a reduction in waste and losses at all stages of the food chain, from field to plate. The evolution of diets will vary according to the initial situations, but generally it means more coarse grains, legumes, fruit and vegetables, and less animal products in diets in most regions of the world, with the exception of Africa and India. It also means better quality products which are more nutritious and contain fewer residues from chemical agricultural inputs. On the demand side, public policies, including price and subsidy policies, food processing, storage and transportation norms, and education are essential to accelerate progress towards healthy diets and the reduction of consumption waste and losses. On the supply side, farming techniques and work organization should lead to improvements in the use of inputs and to crop diversification, while improving the quality of soils and water, enriching biodiversity and guaranteeing adequate and stable returns on investments. Changes should also target the reduction of production losses in the field and at the farm gate with minimal negative effects on the environment. Changes in processing (such as the choices made concerning technological processes, additives and ingredients, and packaging), marketing (distribution channels, improvements in labelling with regard to nutrition and the diminution of marketing pressure for food goods rich in energy, saturated fats, trans-fatty acids, free sugars and salt; gradual redrawing of products), waste treatment and secure contracts between farmers and buyers will also contribute to healthy diets and the reduction of waste and losses.
Agriculture and food related industries and services, and their technologies and products, have made a considerable contribution to food security, but negative impacts on health and the environment of a number of food products have now been identified. Despite repeated appeals by nutritionists for public action to curb the rise of obesity and non-communicable

335
17. Options for Public Policies
diet-related diseases, few changes have taken place. Some individuals modify their diets, some industries change their strategies to take greater care of health and the environment as they see they can improve their short- and long-term gains, but there are still many obstacles to the implementation of policies favouring transition towards diversified and healthy diets and the reduction of waste and losses. Obstacles relate to the extent of individual and collective responsibilities, to the strategies used by transnational corporations to undermine policies aimed at the control and prevention of non-communicable diseases (Moodie et al., 2013), to the complexity of implementing multi-sectoral policies (Swinburn et al., 2015), and the difficulty of establishing a comprehensive framework to both protect and promote healthy diets (Vandevijvere, 2014).
Change agents, e.g. other farmers or people from the public and private sectors with whom farmers interact regularly and trust, play a major role in this evolution. They might provide knowledge, financial services, inputs or marketing services.
The operational objectives are: – Producing data to provide detailed information about past and current diets, about
waste and losses etc. to consumers. – Setting up norms and standards for industry about the use of sugars and fats, use of
energy and water, and packaging. – Encouraging diversity in the organization of agriculture as well organizational innova-
tions (e.g., access to capital through microfinance, warehouse receipting and inventory credits, and cooperation and mutualizing of investments), behavioural changes (such as weather-proofing grain stores or thinking more carefully about discarding wholesome food), and technical changes (e.g., storage, packaging, product stabilization and com-munication infrastructure) (Ingram et al., 2016).
❚❚ Objective 4: Improving the economic, environmental and social performance of cropping and livestock systems or redesigning them
The economic, environmental and social performance of cropping and livestock systems determines the impact of agricultural activities on revenues, food security and the environment and resources. Besides the current dominant conventional intensification path, which has demonstrated its strengths and limits, Agrimonde-Terra has analysed two alternative pathways for cropping systems – ’Sustainable intensification’ and ’Agroecology’– and three alternative pathways for livestock systems –’Agroecological livestock’, ’Livestock on marginal land’ and ’Backyard livestock’– with different combinations. These alternative systems are clearly subject to controversy; their agricultural and economic performance and their environmental and social consequences are very difficult to compare because they respond to different logics, with very different outputs and outcomes and a lack of retrospective data; they cannot be reduced to yield or input use levels. However, the five scenarios show that their implementation needs to be examined at the crossroads of four factors: knowledge and investment capacities of farmers and land access, changes

336
LAND USE AND FOOD SECURITY IN 2050
in food supply chains and markets, rural development and urbanization dynamics, and ecosystem constraints. The importance of these four factors varies between regions, but pathways for the transformation of agricultural systems are generally driven by factors of different economic sectors, both in rural and urban areas. The transformation of cropping and livestock systems, as a diversified mosaic of pathways, will be embedded into the current dynamics of the transformation of food chains, rural development and urbanization, household strategies and environmental changes and should be based on regional, national and territorial challenges.
Five operational objectives are: – Promoting sustainable intensification and agroecology as efficient means for farmers
to solve problems linked to input use, soil degradation, climate change, instability of production etc. This could be attained through a variety of actions such as supporting participative research and innovation on sustainable intensification and agroecological approaches and revisiting funding models of agricultural research; deepening farmers’s knowledge and education; combining incentive public policies such as regulations, finan-cial support, eco-certification and payment for environmental services (pest control, soil conservation, nutrient cycle and water regulation, biodiversity preservation etc.); suppor-ting local seed production and management; developing metrics to address local context and system complexity in support of decision-making.
– Acting on a territorial scale to encompass natural resources, landscape and knowledge management, organization of local markets, etc and address challenges with local stakeholders.
– Building strong links with consumers in order to build broader coalitions in favour of healthy and environmentally friendly food supplies. This will involve alliances between the sustainable intensification, agroecology, organic farming, biodynamic and perma-culture movements.
– Preparing for the digitalization of agriculture by setting up policies that ensure the fair sharing of the value generated by farm data, and setting up contracts that protect pri-vacy, data ownership and data use.
– Abandoning policies that contribute to conventional intensification, such as policies that encourage the specialization of production, policies that create restrictions and fines regar-ding the presence of manure on cropland, subsidies for chemical inputs or biofuel man-dates that inflate the price of individual crops for specific markets (Garrett et al., 2017).
❚❚ Objective 5: Rethinking the organization of trade
The importance of trade and the roles of new actors require a rethinking of its organization. Even if only around 13% of agricultural production is officially traded, multilateral trade seems absolutely essential for national food and nutrition security because population growth and the expansion of food production occur at different rates in different geographic regions. International trading of agricultural and food products has changed significantly over past decades, following the liberalization of agricultural markets supported by the World Trade

337
17. Options for Public Policies
Organization. It has increased and become far more competitive; new financial actors and intermediaries have emerged putting pressure on traditional actors; transport routes and harbours have become strategic for world security; norms and standards have also become strategic and heavily discussed at the World Trade Organization since tariff barriers have been put under strict discipline; world agricultural markets face significant distortions from interventions from a few governments; pests and diseases are increasingly spread through trade. In this regard, ’Healthy’ and ’Regionalization’, both scenarios involving more diversified and healthier diets, clearly show the key role that nutritional and environmental standards for the former and indications of origin for the latter could play in regulating multilateral trade towards high nutritional quality products or regional trade towards traditional products.
❚❚ Objective 6: Securing access to land for all types of farming structures and caring about rural development
All the above imply securing access to land for all types of farming structures and caring about rural development. Rural development will depend on the capacity to link up with urban and peri-urban areas and to attract younger generations to become active in farming or in agriculture-related activities. Policies and actions are necessary to secure access to land for all types of farming structures, to involve rural inhabitants in decision-making about land policy development at national and territorial levels, to protect the ’global commons’, in other words the land that women, men, indigenous peoples and local communities traditionally use collectively, and to improve legal frameworks for contracts.
Four operational objectives are:
– Reinforcing land governance through a combination of interventions integrating tax policies, regulatory provisions (cap on leasing and sharecropping to limit land rents, limi-tation of land use etc.), and the creation and/or reinforcement of ad hoc mechanisms to facilitate inter-generational transfer outside the family context of holdings, limiting land concentration and securing access rights to land resources (Bélières et al., 2015)
– Adopting land tenure systems that secure access to land for all, but with a special atten-tion to youth and women; developing a legal framework and setting up credit for easier access to land and capital investments. Changes in land tenure systems can be achieved through a variety of means such as the inclusion of customary and traditional use rights in national legislation, changes in inheritance law, property rights and land titling, facili-tating training and access to credit. A large diversity of actors needs to be involved, and farmers’ organizations, municipalities and local councils have a role to play.
– Improving the working conditions and income of agricultural workers. Today, many hired agricultural workers – many of whom are women – are still employed on a seaso-nal basis, paid at the end of the day or for piece work. Working conditions are often dif-ficult and job contracts non-existent. Seasonal jobs attract migrants from poor regions but sometimes immigration restrictions prevent seasonal workers from returning to their home country in time for harvest. To overcome labour shortages, some agricultural struc-tures adopt practices such as the use of chemical herbicides or mechanization – even
338
LAND USE AND FOOD SECURITY IN 2050
in countries with high unemployment – leading to health problems and/or soil degrada-tion. Policies should protect agricultural workers and set up a legal framework for job contracts and remuneration levels. The latter should be attractive and, if possible, com-parable to other economic sectors. Developing health, education, transport and cultural services in rural areas would also contribute to this objective.
– Setting up an integrated information system and monitoring mechanism on farm struc-tures. The World Census of Agriculture collected by the United Nations Food and Agriculture Organization (FAO) provides data at national scale, but data it is difficult to compare which has contributed to policy neglect of agricultural structures (UNCTAD, 2015). The monito-ring of changes in agricultural structures is very important. Further work should be car-ried out at the international level to better apprehend various drivers of change in farm structures, and be able to compare and monitor them.
Specific policies per scenario
The six objectives which have been presented in the previous section should be sought whatever the scenario. In each scenario, specific policy objectives will be pursued and we present here three possible policy trends for the ’Metropolization’, ’Regionalization’, ’Communities’ and ’Households’ scenarios. We present important leverage points to shift towards the ’Healthy’ pathway which contributes most to reducing undernutrition and overnutrition.
❚❚ Policies in the ’Metropolization’ scenario
In the ’Metropolization’ scenario, there is an alliance between multinational corporations, investment funds and international institutions; markets tend to rule; governments’ roles are weak but they will nevertheless enact policies. As many farmers will be integrated within the agri-industrial sector, favour specialization, have access to capital and use highly developed machines and genetic resources, public action should, on the one hand, concentrate on the economic advantages of efficiently using machines, energy and inputs and diversifying production. On the other, public policies should focus on farmers’ responsibilities towards consumer health and environmental sustainability. Public policies should also encourage the funding of public research and training programmes by the private sector. Secondly, policies should aim to limit the impacts of diet on health because of the cost to the economy of diet-related non-communicable diseases. If the products sold by agri-food companies overly contribute to diet-related non-communicable diseases, at some point in time these companies will have to pay for these costs. Thirdly, public policies should contribute to reducing the levels of risk faced by poor urban people and marginalized farmers in order to avoid riots.
❚❚ Policies in the ’Regionalization’ scenario
In the ’Regionalization’ scenario, States join in large regional blocs and are therefore ready to share their power with other partners. First, public policies should focus on

339
17. Options for Public Policies
meeting the objective of ’food sovereignty and subsidiarity’ at the regional bloc level by encouraging centralized land use management and supply policies with a diversification of production. The regions should be able to deal with scarcities, i.e. to limit the use of certain products that cannot be produced in the region both on the demand and the supply side. This will require strong governance, organization and support for intra-regional trade though transport, infrastructure, norms, traders’ organizations and protectionism. Secondly, agricultural policies should on the one hand encourage all kinds of market-driven opportunities for farmers. On the other, within the region, a mechanism should be set up to help the territories which have limited land or high population density. Thirdly, policy transparency, cooperation and coherence should be encouraged.
❚❚ Policies in the ’Communities’ scenario
In this scenario, the political and economic context is fragmented and therefore governments have few means for policy-making. Governance takes place more at the local level, not necessarily through policies. Communities develop their own priorities and rules.
❚❚ Policies in the ’Households’ scenario
The State has little involvement in this scenario. Nevertheless, the numerous groups which are active suggest initiatives that can be later used as the basis of policies. A first factor for the success of multi-active and mobile households will be the agricultural transformation plans led by ad hoc networks which will differentially target agri-food systems and geographic areas. This should be accompanied by laws relative to labour in order to facilitate multi-activity. A second factor of success will be to give farmers the opportunity to raise their household income through improving productivity (instead of increasing volumes), cultivating high-value crops, getting involved in downstream processing and developing non-farm activities. Policies should seek to ensure access to food for all and stability of production. Thirdly, products will be exchanged in many different ways and policies should facilitate the variety of modes of exchanges and trade.
❚❚ Leverage points for the ’Healthy’ scenario
In the ’Healthy’ scenario, States cooperate among themselves and with businesses, civil society organizations and international institutions, and all these actors have a strong commitment towards the mitigation of climate change, regulation of the nutritional quality of food products, health and the shift to a green economy. The role of governments is very important and coherent with international action. Policies promote sustainability and equity instead of relying purely on the market (Godfray et al., 2010). This scenario requires important changes in governance and vision (de Lattre-Gasquet et al., 2017b).
To facilitate the evolution of a complex system, Donella Meadows (1999) proposes accepting the complexity and looking for leverage points in the system, instead of simplifying the system and neglecting the study of causal links.

340
LAND USE AND FOOD SECURITY IN 2050
First, politicians should be flexible, unattached to paradigms and have the ability to offer a vision. The vision should promote at land uses for food quality, healthy nutrition, and stabilized climate change’, which requires collaboration between economic, social and environmental actors for a sustainable world, arbitration between food production and mitigation of climate change, crop and livestock systems, making the best use of productive and human resources at the local level, creation of jobs in the agri-food sectors, and food and nutrition security for all households throughout the year. Also, the issue of food and nutrition security should be given the status of a global public good, as has been done for some environmental issues (climate change and biodiversity). They should also understand that the shift from the current pathway to this new pathway will require time, commitment and investment. Very few actors in the economic sector have yet understood that the shift towards land use for food quality and healthy nutrition can be a source of revenue while being socially and environmentally responsible, and politicians must convince them and support them in this radical move.
Policies should be pragmatic, take into account the limits on resources, the shift to a green economy, the role of soil organic matter and the need for quality food products, but also the complementarity between the public and private sectors. Public investments should be designed to catalyze private sector engagement towards the vision, to encourage an extremely efficient and limited use of natural resources, integrate sustainable agriculture into private and public education and extension programmes (FAO/INRA, 2016), and promote social and environmental responsibility.
The rules of the system (incentives, punishments and constraints) should limit the consumption of non-healthy products by reducing the accessibility and availability of foods high in saturated fats, salts, sugars and refined carbohydrates (especially ultra-processed products) via regulations and taxes. Policies should encourage the consumption of healthy products by increasing accessibility to diverse foods rich in fibre and nutrients (legumes, fruit and vegetables, whole grains, livestock and fish, including farmed fish) and by subsidizing fresh produce.
For the shift towards the ’Healthy’ pathway, policies should also address information flows. Adding information is a powerful means of intervention, usually easier and cheaper than rebuilding physical infrastructure. For example, giving more information to consumers about how food is produced could lead to a change in diets which, in turn, could help change the way food is produced. Public agricultural research should target questions that the private sector will never tackle because answers will not generate profits, i.e. data collection and analysis, land use in remote areas and poor quality soils, analysis of the economic and social performance of cropping and livestock systems, and externalities, especially those related to carbon. Questions of intellectual property should also be carefully considered.
Finally, special attention should be given to feedback loops in order to reinforce positive impacts and limit negative ones. Policies should carefully consider the time required for changes, in order to avoid underestimating or overestimating the time necessary. The
341
17. Options for Public Policies
final leverages to be considered by policy makers should be stocks, flows and numbers. These mechanisms are often targeted by policies, but interventions on them produce only minimal changes and do not change behaviours.
Conclusion
Foresight can impact policy-making in various ways. It can inform policy by detecting emerging threats, identifying new opportunities, generating insights about possible futures and identifying policies that should be adopted without regrets; it can support policy definition by translating outcomes into specific objectives (Da Costa et al., 2008; Cook et al., 2014). This is what has been done in this chapter. Public policy objectives that are valid regardless of the scenario have been identified as well as public policy objectives specific to each pathway. When carried out at the national or territorial level, foresight can contribute to reconfiguring the policy system in a way that makes it more apt to address long-term challenges and facilitate policy implementation by enhancing the capacity for change through the participative process (Da Costa et al., 2008). This requires an entry point into the political system, a promoter and a sponsor. Time is also needed because policy cycles last four to five years whereas foresight has a long-term horizon (Cuhls, 2015).
342
ConclusionAmong the Agrimonde-Terra scenarios, at least two are clearly not able to ensure sustainable world food and nutrition security in 2050: the ’Metropolization’ and the ’Communities’ scenarios, notably under the ’Collapse’ variant. Furthermore, two have ambiguous results: the ’Regionalization’ and the ’Households’ scenarios. Only the ’Healthy’ scenario seems likely to be able to meet the objective of sustainable world food and nutrition security in 2050.
’Healthy’ is the scenario which contributes most to reducing not only over-nutrition and related diseases, but also undernutrition, through diversified diets based on increased consumption of fruits and vegetables, coarse grains and pulses. ’Healthy’ is also the one scenario allowing world food availability to be achieved at the cost of a rather limited expansion in the agricultural land area at the world level. There are some regions, however, where promoting healthier diets induces an increased consumption of animal products, such as India, West Africa and ECS Africa. In these regions, even the ’Healthy’ scenario is likely to induce an expansion in the agricultural land area and potentially significant deforestation. As the ’Healthy’ scenario also involves a strong commitment from governments, corporations and international institutions to mitigating climate change, requiring the production of renewable energy and the maintenance of world forest cover as far as possible, there are potential tensions between the objectives of food security and climate change stabilization, resulting in increased competition for land between agricultural and forestry uses. Agroforestry and farming practices that contribute to improved soil quality and the storage of organic carbon in soils (thus yield potentials) could be very interesting options in this case, since they simultaneously work towards the objectives of food security and climate change stabilization.
The ’Regionalization’ scenario also induces a series of changes that work in favour of world and regional food and nutrition security, but at the same time leads to ambiguous results regarding world food availability. ’Regionalization’ is a scenario opposing the global convergence of diets towards a few standardized products through the promotion of traditional diets and products. It therefore favours food and nutritional diversity and contributes to limiting the development of diet-related non-communicable diseases in world and regional populations, mostly by reducing the global diffusion of ultra-processed foods. This scenario also involves the development of agri-food industries in small and medium-sized cities acting as intermediaries between rural areas and urban centres. These industries positively affect rural development, rural employment and rural incomes for men and women. Hence ’Regionalization’ may improve access to food for rural populations. However, ’Regionalization’ is only able to ensure world and regional food availability at the cost of a significant expansion of the agricultural land area and a considerable threat to forest area at the world level. Land area expansion and potential deforestation by farmers may even be dramatic in regions poorly endowed with land and

343
Conclusion
sometimes poor in other natural resources (water, for instance) such as North Africa, the Near and Middle East, India and West Africa, or better endowed with land but exhibiting poor agricultural productivity such as ECS Africa. In such regions, the ’Regionalization’ scenario appears rather unsustainable. Increasing the performance of Indian, West African and ECS African agricultural production systems, particularly livestock systems, would be a land-saving lever, making it possible to reduce the threat to forest areas.
It is worth noting that current trends in agricultural and food systems in most part of the world converge towards the ’Metropolization’ scenario. Such trends could result in the ’perfect storm’ as involved in the ’Communities’ scenario, especially in case of severe climate warming and induced detrimental impacts on agriculture. Therefore, changing the course of ongoing trends towards ’Healthy’ or ’Regionalization’ will be one of the main challenges of the next decades and requires systemic transformation, strong and coherent public policies and consistent actions from a wide range of actors.
International cooperation and global climate and nutritional policies are necessary condition for climate change stabilization and new dietary changes towards more diversified and healthier diets to emerge as in the ’Healthy’ scenario. Such transition would also require a change towards sustainable agricultural production systems all over the world, allowing both producing enough quantities and diversity of high quality products, sequestering carbon, and providing ecosystem services and employment. Coordinated policies in many areas, such as innovation and research, support to agriculture, environmental regulation, land planning and land rights and rural and urban development, are needed to favour this change.
Regional cooperation and market integration are necessary condition for the emergence of the ’Regionalization’ scenario. This means cooperation between States and coordinated climate, nutritional and trade policies at broad regional scales. Such a transition would also require national rural development policies in line with efforts to develop regional food value chains, as well as national and/or local land planning and land policies aimed at safeguarding the land resources necessary for food production.
Hence, Agrimonde-Terra shows that the roads towards food and nutritional security while simultaneously addressing other major challenges, notably climate change, are very narrow. Of course, there are some positive on-going changes such as the recent pattern in dietary changes in developed countries, towards less animal products, or international cooperation on climate through the United Nation framework convention on climate change (UNFCCC), the successive Conference of Parties (COP) and the Paris Agreement signed in 2016. However, ’Metropolization’ trends are observed in many parts of the world (especially in emerging countries and in some developing countries). They are strong and work towards standardisation of food diets and globalisation of food value chains in these parts of the world, where population is numerous and expected to grow very fast.
Therefore, it is clear that the work and the contribution to the debate on land use and food security must continue at national, regional and global levels. In this respect, one strength of the Agrimonde-Terra scenarios is to propose a wide range of possible futures for the world agricultural and food systems. In these possible futures, significantly contrasted
344
LAND USE AND FOOD SECURITY IN 2050
and consistent food diets, which are in line with changes in rural-urban relationships and the shaping of food industry, constitute a strength of Agrimonde-Terra scenarios and an originality relative to other existing scenarios. This allows pointing out the key role of rural and urban development as regards land use and food security. Another strength of Agrimonde-Terra scenarios is that they take into account the evolution of farm structures, which is rarely done in such foresight processes. The successful coupling between the qualitative and the quantitative analysis is also a strength of the Agrimonde-Terra scenarios. This helps comparing scenarios, detecting their main driving hypotheses, and assessing the extent of uncertainties, risks and challenges.
But, of course Agrimonde-Terra scenarios have limits and further work could be envisaged. Among missing dimensions, losses and wastes, as well as the recycling of co-products, are potentially important factors regarding the land use and food security issue, and would deserve to be considered further. Secondly, on the quantitative side, it would be interesting to evaluate the GHG emissions induced by the various scenarios in order to be able to check whether these emissions are consistent with the scenarios’ climate change pathways.
On a more general ground, Agrimonde-Terra scenarios have shown that the future of livestock systems is a key factor as regard the land use and food security issue. Unfortunately, we lack information and data on the current livestock systems all over the world and their relative technical, economic, environmental and social performance. In addition, there is great uncertainty on the potential development of livestock systems and further work in clearly needed in this area. The situation is similar for current and future pastureland area and production potential. For pastureland, there is a specific need of a clear definition and classification in database. In the same vein, Agrimonde-Terra has shown that we need to add to our knowledge on relative technical, economic, environmental and social performance of the different cropping systems.
Agrimonde-Terra scenarios show the entanglements of diets, food chains, ecosystem and land uses, and how much issues of food and nutrition security, agriculture, environment and trade are interlinked at various scales. It is necessary to take into account such linkages if the aim is to build sustainable pathways.
For the future, we hope that Agrimonde-Terra scenarios will continue to be used as a tool for dialogue at national levels, and that the Agrimonde-Terra method and results will contribute to current work on global scenarios, such as the Shared Socio-economic Pathways and the related Agricultural Representative Pathways.

345
References
ACET, 2014. Overview. African transformation, report. Growth with Depth. Accra, The African Center for Economic Transformation, Accra.
AfDB, OECD and UNDP, 2016. African Economic Outlook 2016. Sustainable Cities and Structural Transformation. African Development Bank, Organization for Economic Cooperation and Development, United Nations Development Program, 400 p.
Agarwal B., 1994. A Field of One’s Own: Gender and Land Right in South Asia. Cambridge: Cambridge University Press.
Alary V., Duteurtre G., Faye B., 2011. Elevages et sociétés : les rôles multiples de l’élevage dans les pays tropicaux. Productions animales, 24(1), 145-156.
Albaladejo C., 2012. Les transformations de l’espace rural pampéen face à la mondialisation. Annales de Géographie, 4, 387-409.
Albaladejo C., Arnauld De Sartre X., Gasselin P., 2012. Agriculture entrepreneuriale et destruction du travail dans la Pampa argentine. Etudes Rurales, 190, 177-192.
Alcantara C., Kuemmerle T., Baumann M., Bragina E.V., Griffith P., Hostert P., Knorn J., Müller D., Prishchepov A.V., Schierhorn F., Sieber A., Radeloff C., 2013. Mapping the extent of abandoned farmland in Central and Eastern Europe using MODIS time series satellite data. Environnemental Research Letters, [on line], 8, 035031. http://iopscience.iop.org/article/10.1088/1748-9326/8/3/035035/pdf (accessed February 1st, 2018).
ALEPH, 2004. La méthode des scénarios, outil d’une démarche prospective, les dossiers d’ALEPH, 1, janvier 2004, 16 p.
Alexandratos N., Bruinsma J., 2012. World agriculture towards 2030/2050: the 2012 revision. ESA Working Paper N°12-03. Rome, FAO, 160 p.
Alexandratos N., Bruinsma J., 2012. World agriculture towards 2030/2050: the 2012 revision. ESA Working Paper N°12-03. FAO: Rome.
Alexandratos N., Bruinsma J., 2012. World agriculture towards 2030/2050: the 2012 revision. ESA Working Paper N°12-03. Rome, Food and Agriculture Organization of the United Nations, Rome, 160 p.
Ali D., Deininger K., 2014. Is there a farm-size productivity relationship in African agriculture? Evidence from Rwanda. World Bank Policy Research Paper 6770 (World Bank, Washington, DC). http://elibrary.worldbank.org/doi/abs/10.1596/1813-9450-6770 (accessed on January, 2018).
Allen A., 2009. Sustainable cities or sustainable urbanisation? Palette UCL’s journal of sustainable cities, [online], <http://www.ucl.ac.uk/sustainable-cities/results/gcsc-reports/allen.pdf> (accessed on January 21st, 2013).
Alston J., Babcock B., Pardey P., 2010. The shifting patterns of agricultural production and productivity worldwide. Iowa State University, Ames: Midwest Agribusiness Trade and Research Information Center, 482 p.
Altieri M., Funes-Monzote F.R., Petersen P., 2012. Agroecologically efficient agricultural systems for smallholder farmers: contributions to food sovereignty. Agronomy for Sustainable Development, 32(1), 1-13.
Altieri M.A., 2002. Agroecology: the science of natural resource management for poor farmers in marginal environments. Agriculture, Ecosystems and Environment, 74, 19-31.

346
LAND USE AND FOOD SECURITY IN 2050
Altieri M.A., Funes-Monzote F.R., Petersen P., 2011. Agroecologically efficient agricultural systems for smallholder farmers: contributions to food sovereignty. Agronomy for Sustainable Development, 32(1), 1-13.
Al-Zubaidi L., Assubuji P., 2013. Editorial. In: Perspectives. Women and Land Rights: Questions of Access, Ownership and Control. Heinrich Böll Foundation – Africa, Capetown, 32 p.
Amanor K.S., 2012. Land Governance in Africa: How historical context has shaped key contemporary issues relating to policy on land. Land Governance in the 21st Century. Framing the Debate Series No.1. International Land Coalition (ILC), Rome, 64 p.
Anderson K., 2010. Globalization’s effects on world agricultural trade, 1960–2050. Philos. Trans. R Soc. Lond. B Biol. Sci., 365 (1554), 3007–3021, http://rstb.royalsocietypublishing.org/content/365/1554/3007 (accessed January 31st, 2018).
Andersson Djurfeldt A., 2002. The Bright Lights Grow Fainter - migration, livelihoods and a small town in Zimbabwe. Stockholm University, Department of Human Geography, Stockholm: Acta Universitatis Stockholmiensis, 206 p.
Andersson Djurfeldt A., 2015a. Urbanization and linkages to smallholder farming in sub-Saharan Africa: implications for food security. Global Food Security, 4, 1-7.
Andersson Djurfeldt A., 2015b. Multi-local livelihoods and food security in rural Africa. J. Int. Dev., 27(4), 528-545.
Andersson Djurfeldt A., Jirström M., 2013. Urbanization and changes in farm size in Sub-Saharan Africa and Asia from a geographical perspective: a review of the literature. Background Paper for the ISPC Foresight Study on Farm Size and Urbanization, 33 p.
Angelsen A., Kaimowitz D., 2001. Introduction: the Role of Agricultural Technologies in Tropical Deforestation. In: Agricultural Technologies and Tropical Deforestation. (A. Angelsen, D. Kaimowitz, eds). CABI and CIFOR, 1-17.
Anseeuw W., Ducastel A., 2012b. New agricultural investment models and agrarian change in South Africa. In: 50th Annual Conference of the Agricultural Economics Association of South Africa, Bloemfontein, South Africa, October 1-3rd, 2012. AEASA. s.l.: s.n., 17 p.
Anseeuw W., Jayne T., Kachule R., Kotsopoulos J., 2016. The Quiet Rise of Medium-Scale Farms in Malawi. Land 5(3), 19.
Anseeuw W., Wily L. A., Cotula L., Taylor M., 2012a. Land Rights and the Rush for Land, Findings of the Global Commercial Pressures on Land Research Project. International Land Coalition (ILC), Rome, 73 p.
Arimond M., Ruel M.T., 2004. Dietary diversity is associated with child nutritional status: evidence from 11 demographic and health surveys. Journal of Nutrition, 134 (10), 2579-85.
AUC-ECA-AfDB Consortium, 2010. Land Policy in Africa: North Africa Regional Assessment. African Union, Economic Commission for Africa, African Development Bank, Addis Ababa, 124 p.
Bahner T., 2011. Hamburg City Estates. Case study, Hamburg, Germany. In Access to land for community connected farming. Seven case studies from the UK, Germany, Romania, France, Lithuania and Italy (coll., 2011).
Bajzelj B., Richards K.S., Allwood J.M., Smith P., Dennis J.S., Curmi E., Gilligan C.A., 2014. Importance of food-demand management for climate mitigation. Nature Climate Change, 4, 924-929.
Baker P., Friel S., 2014. Processed foods and the nutrition transition: evidence from Asia. Obesity Reviews, 15 (7), 564-577.
Baldos U., Hertel T.W., 2014. Global food security in 2050: The role of agricultural productivity and climate change. Australian Journal of Agricultural and Resource Economics, 58, 1-18.
347
References
Barquera S., Hernandez-Barrera L., Tolentino M.L., Espinosa J., Ng S.W., Rivera J.A., Popkin B.M., 2008. Energy intake from beverages is increasing among Mexican adolescents and adults. Journal of Nutrition, 138(12), 2454-2461.
Barro R.J., Lee J.W., 2010. A new data set of educational attainment in the world, 1950–2010. NBER Working Paper Series, Working Paper 15902, National Bureau of Economics Research, Cambridge, Massachusetts, 49 p.
Bazin G., Bourdeau-Lepage L., 2011. L’agriculture dans les pays d’Europe centrale et orientale. Continuité et adaptation. Économie rurale, 325-326, (5), 10-24.
Beauchemin C., Bocquier P., 2004. Migration and urbanization in Francophone West Africa: a review of the recent empirical evidence. Urban Studies, 41(11), 2245-2272.
Beintema N., Stads G.J., 2017. A Comprehensive Overview of Investments and Human Resource Capacity in African Agricultural Research. Agricultural Science and Technology Indicators (ASTI) Synthesis Report, International Food Policy Research Institute (IFPRI), Washington, D.C., 56 p.
Bélières J.-F., Bonnal P., Bosc P.-M., Losch B., Marzin J., Sourisseau J.-M., 2013. Les agricultures familiales du monde. Définitions, contributions et politiques publiques. Tome 1. Report for AFD, MAE and MAAF. Montpellier: CIRAD, 195 p.
Bélières J.-F., Bonnal P., Bosc P.-M., Losch B., Marzin J., Sourisseau J.-M., 2015. Family farming around the world. Definitions, contributions and public policies. Agence Française de Developpement (AFD) and Cirad, A Savoir 28, Paris, 190 p.
Benin S., 2016. Agricultural Productivity in Africa. Trends, Patterns and Determinants. International Food Policy Research Institute (IFPRI), Washington, D.C.
Benoit-Cattin M., Dorin B., 2012. Disponible alimentaire et productivité agricole en Afrique subsaharienne. Une approche dynamique comparative (1961-2003). Cah Agric, [on line], 21:5, 337-347, http://revues.cirad.fr/index.php/cahiers-agricultures/article/view/30990 (accessed February 1st, 2018).
Berger G., 1967. Étapes de la prospective, PUF, Paris, 129 p.
Berndes G., Ahlgren S., Börjesson P., Cowie A.L., 2013. Bioenergy and land use change - state of the art. Wiley Interdisciplinary Reviews: Energy and Environment, 2, 282 – 303.
Bertucci G., 2006. Preface. In: Report of the Experts Group Meeting on Ethics, Integrity, and Accountability in the Public Sector: Re-building Trust in Government through Implementation of the United Nations Convention against Corruption. Saint Petersburg, 3-4.
Bezemer D., Headey D., 2008. Agriculture, Development, and Urban Bias. World Development, 36(8), 1342-1364.
Biermann F., Stevens C., Bernstein S., Gupta A., Kabiri N., Kanie N., Levy M., Nilsson M., Pintér L., Scobie M., Young O.R., 2014. Integrating Governance into the Sustainable Development Goals. POST2015/UNU-IAS Policy Brief #3. Tokyo: United Nations University Institute for the Advanced Study of Sustainability.
Bierschenk T., Chauveau J.-P., Olivier de Sardan J.-P. (eds), 2000. Courtiers en développement. Les villages africains en quête de projet. Editions Karthala and APAD, bibl. ’Hommes et Sociétés’, 318 p.
Bindraban P.S., Van der Velde M., Ye L., Van den Berg M., Materechera S., Kiba D.I., Tamene L., Ragnarsdóttir K.V., Jongschaap R., Hoogmoed M., Hoogmoed W., Van Beek C., Van Lynden G., 2012. Assessing the impact of soil degradation on food production. Current Opinion in Environmental Sustainability, 4, 478-88.
Bingley K., 2016. Foresight and International Development. IDS Bulletin, 47(4), September 2016.

348
LAND USE AND FOOD SECURITY IN 2050
Binswanger H.P., Feder G., 1995. Power, distortions, revolt and reform in agricultural land relations. In: Handbook of Development Economics. Volume 3, Part B, Chapter 42, pp. 2659-2772. World Bank, USA. https://doi.org/10.1016/S1573-4471(95)30019-8
Binswanger-Mkhizer H.P., Savastano S., 2017. Agricultural intensification: the status in six African countries. Food Policy, 67, 26-40.
Birn A.E., 2014. Philanthrocapitalism, past and present: The Rockefeller Foundation, the Gates Foundation, and the setting(s) of the international global health agenda. Hypothesis, [on line], 12(1), 1-27. http://www.hypothesisjournal.com/?p=2503 (accessed January 31st, 2018).
Black R.E., Victora C.G., Walker S.P., and the Maternal and Child Nutrition Study Group, 2013. Maternal and child undernutrition and overweight in low-income and middle-income countries. Lancet, 382, 427-451.
Bocquier P., 2004. World Urbanization Prospects: an alternative to the UN model of projection compatible with urban transition theory, DIAL, Working Paper, IRD, Paris, 27 p.
Bodansky D., 2010. The Copenhagen Climate Change Conference: a post-mortem. American Journal of International Law, 104(2), 230–240.
Bodansky D., 2016. The Paris Climate Change Agreement: A New Hope? American Journal of International Law, 110(2), 288-319.
Boone C., 2017. Legal empowerment of the poor through property rights reform: Tensions and trade-offs of land registration and titling in sub-Saharan Africa. United Nations University, World Institute for Development Economics Research, WIDER Working Paper, 2017/37, Helsinki, 23 p.
Borras S.M., Franco J.C., Kay C., Spoor M., 2011. Land grabbing in Latin America and the Caribbean viewed from broader international perspectives. A paper prepared for and presented at the Latin America and Caribbean seminar: ’Dinámicas en el mercado de la tierra en América Latina y el Caribe’, 14-15 November 2011, FAO Regional Office, Santiago, Chile, 54 p.
Böttinger S., Doluschitz R., Klaus J., Jenane C., Samarakoon N., 2013. Agricultural Development and Mechanization in 2013. A Comparative Survey at a Global Level. University of Hohenheim and United Nations Industrial Development Organization (UNIDO), 17 p.
Boukharaeva L., Marloie M., 2011. L’utilisation des sols par le jardinage urbain à grande échelle de Russie. Economie Rurale, 325-326 (5), 176-191.
Bouma J., 1997. The land use systems approach to planning sustainable land management at several scales. ITC Journal, 3/4, 237-242.
Bourgeois R., Losch B., 2017. The challenge of decolonizing the future of hunger. Papier presented at the 3rd International Conference on Global Food Security Conference, Symposium “Foresight for decision-making on food security”, Cape-Town, December 3, 2017.
Bouwman A.F., Van der Hoek K.W., Eickhout B., Soenario I., 2005. Exploring changes in world ruminant production systems. Agricultural Systems, 84 (2), 121-153.
Bowman M.S., Soares-Filho B.S., Merry F.D., Nepstad D.C., Rodrigues H., Almeida O.T., 2012. Persistence of cattle ranching in the Brazilian Amazon: A spatial analysis of the rationale for beef production. Land Use Policy, 29, 558-568.
Boyce J.K., 2004. A future for small farms? Biodiversity and sustainable agriculture. ln: Human Development in the Era of Globalization: Essays in Honor of Keith B. Griffin (J.K. Boyce , S. Cullenberg, P.K. Pattanaik , R. Pollin, eds), Northampton , Edward Elgar, 83-104.
Brenner N., Schmid C., 2013. The “Urban Age” in Question. International Journal of Urban and Regional Research, 38(3), 731-755.

349
References
Bricas N., Tchamda C., Martin P., 2016. Les villes d’Afrique de l’Ouest et du Centre sont-elles si dépendantes des importations alimentaires ? Cah. Agric. [on line], 25(5), 55001, https://www.cahiersagricultures.fr/fr/articles/cagri/pdf/2016/05/cagri160015.pdf (accessed February 1st, 2018).
Brockington D., Wilkie D., 2015. Protected areas and poverty. Phil. Trans. R. Soc. B 370: 20140271.
Brundtland G.H., 1987. Our Common Future. Report of the World Commission on Environment and Development. Oxford University Press, Oxford, 398 p.
Brunelle T., 2014. Climate change as a driver of land uses. Working Paper Agrimonde-Terra, 37 p.
Bryceson D., 2002. The scramble in Africa: reorienting rural livelihoods. World Development 30(5), 725-739.
Burnod P., Tonneau J.-P., 2013. Le foncier : facteur ou marqueur de l’évolution des agricultures ? Cahiers Agricultures, 22(1), 4-9.
Busch L., 2007. Performing the Economy, Performing Science: From Neoclassical to Supply Chain Models in the Agrifood Sector. Economy and Society, [on line], 36(3), 439-468, http://www.tandfonline.com/doi/full/10.1080/03085140701428399 (accessed January 31st, 2018).
Cadilhon J.J., Moustier P., Poole ND., Thi Giac Tan P., Fearne A.P., 2006. Traditional vs. modern food systems? Insights from vegetable supply chains to Ho Chi Minh City (Vietnam). Development Policy Review, 24(1), 31-49.
Caron P., Valette E., Wassenaar T., Coppens d’Eeckenbrugge G., Papazian V., 2017. Living territories to transform the world, collection « Agricultures et défis du monde », éditions Quæ, Versailles, 274 p.
CFS, 2009. Reform of the committee on world food security. Final version, CFS 2009/2 Rev.2, Food and Agriculture Organization of the United Nations, Committee on World Food Security, Rome.
CFS, 2012. Coming to terms with terminology: Food Security, Nutrition Security, Food Security and Nutrition, Food and Nutrition Security. CFS 2012/39/4, Food and Agriculture Organization of the United Nations, Committee on World Food Security, Rome.
Chaléard J.L., 1996. Temps des villes, temps des vivres : l’essor du vivrier marchand en Côte d’Ivoire. collection « Hommes et sociétés », Karthala, Paris, 661p.
Challinor A.J., Watson J., Lobell D.B., Howden S.M., Smith D.R., Chhetri N., 2014. A meta-analysis of crop yield under climate change and adaptation. Nature Climate Change, 4, 287-291.
Chatel C., Imbernon J., Moriconi-Ebrard F., 2016. Megacities and archipelagos: an emerging urban framework. In: A New Emerging Rural World. An Overview of Rural Change in Africa(Pesche D., Losch B., Imbernon J. eds), Atlas for the NEPAD Rural Futures Programme. 2nd edition revised and enlarged. Montpellier, Cirad, NEPAD, 76 pages.
Chauvin N.D., Mulangu F., Porto G., 2012. Food Production and Consumption Trends in Sub-Saharan Africa: Prospects for the Transformation of the Agricultural Sector. United Nations Development Programme, Regional Bureau for Africa, UNDP Working Paper 2012-011, 76 p.
Checkland P., 1981. Systems Thinking, Systems Practice. Wiley, New-York, 424 p.
Chopra M., Galbraith S., Darnton-Hill I., 2002. A global response to a global problem: the epidemic of overnutrition. Bulletin of the World Health Organization, 80, 952-958.
Chouquer G., 2011. Le nouveau commerce triangulaire mondial. Ou les analogies du foncier contemporain. Études Rurales, 187 (1), 95-130.
Clapp J., 2014. Financialization, distance and global food politics. The Journal of Peasant Studies, 41 (5), 797-814, doi:10.1080/03066150.2013.875536.
Clapp J., Isakson S.R., Visser O., 2016. The complex dynamics of agriculture as a financial asset: introduction to a symposium. Agriculture and Human Values 34(1), 179-183.
Cochet H., 2011. L’agriculture comparée. éditions Quæ, Versailles, 159 p.
350
LAND USE AND FOOD SECURITY IN 2050
Cochet H., Merlet M., 2011. Land grabbing and share of the added value in agricultural processes. A new look at the distribution of land revenues. Communication in the International Academic Conference ’Global Land Grabbing’ 6 - 8 April 2011, Futures agricultures Consortium, Institute of Development Studies (IDS), University of Sussex, Brighton, UK, 18 p.
Codjoe S., Owusu G., 2011. Climate change/variability and food systems: evidence from the Afram Plains, Ghana. Regional Environmental Change, 11, 753-765.
Cohen B., 2006. Urbanization in Developing Countries: Current Trends, Future Projections, and Key Challenges for Sustainability. Technology in Society, 28(1-2), 63-80.
Connor P., Cohn D., Gonzalez-Barrera A., Oates R., 2013. Changing patterns of global migrations and remittances. Pew Research Center, Washington, D.C., 30 p.
Cook C.N., Inayatullah S., Burgman M.A., Sutherland W.J., Wintle B.A., 2014. Strategic foresight: how planning for the unpredictable can improve environmental decision-making. Trends in Ecology & Evolution [online], 29(9), 531-541, http://www.cell.com/trends/ecology-evolution/fulltext/S0169-5347(14)00156-6 (accessed March 1st, 2018).
Corson C., 2011. Territorialization, enclosure, and neoliberalism: non-state influence in struggles over Madagascar’s forests. The Journal of Peasant Studies, 38(4), 703-726.
Cotula L., Berger, T., 2014. Agricultural commercialization contracts: concessions over people? IIED Briefing. October 2014. http://pubs.iied.org/17260IIED
Cotula L., Toulmin C., Quan J., 2006. Better land access for the rural poor. Lessons from experience and challenges ahead. International Institute for Economic Development and Food and Agriculture Organization of the United Nations, London and Rome, 53 p.
Cotula L., Vermeulen S., Leonard R., Keeley J., 2009. Land grab or development opportunity? Agricultural investment and international land deals in Africa, IIED/FAO/IFAFD, London / Rome.
Crino M., Sacks G., Vandevijvere S., Swinburn B., Neal B., 2015. The influence on population weight gain and obesity of the macronutrient composition and energy density of the food supply. Current Obesity Reports, 4 (1), 1-10.
Crotty J., 2009. Structural causes of the global financial crisis: a critical assessment of the ’new financial architecture’. Cambridge Journal of Economics, 33, 563–580.
Cuhls K., 2015. Bringing Foresight to decision-making - lessons for policy-making from selected non-European countries. Policy Brief by the Research, Innovation, and Science Policy Experts (RISE). European Commission, Directorate-General for Research and Innovation, Brussels, 41 p.
Da Costa O., Warnke P., Cagnin C., Scapolo F., 2008. The impact of foresight on policy-making: insights from the FORLEARN mutual learning process. Technology Analysis & Strategic Management [on line], 20 (3), 369-387, https://www.tandfonline.com/doi/pdf/10.1080/09537320802000146?needAccess=true (accessed March 1st, 2018).
Dabat M.H., Lahmar R., Guissou R., 2012. La culture du niébé au Burkina Faso : une voie d’adaptation de la petite agriculture à son environnement ? Autrepart, 2012/2, No. 63.
Daviron B., Douillet M., 2013. Major players of the international food trade and the world food security. FOODSECURE Working paper 12, FOODSECURE Consortium, 95 p.
Davis B., Winters P., Carletto G., Covarrubias K., Quinones E., Zezza A., Stamoulis K., Azzarri C., DiGiuseppe S., 2010. A cross-country comparison of rural income generating activities. World Development 38 (1), 48-63.
Dayang Norwana A.A.B., Kunjappan R., Chin M., Schoneveld G., Potter L., Andriani R., 2011. The Local Impacts of Oil Palm Expansion in Malaysia: An Assessment based on a case study in Sabah State. CIFOR. Working Paper, volume 78, 17 p.
351
References
de Brauw A., Harigaya T., 2007. Seasonal Migration and Improving Living Standards in Vietnam. Am J Agric Econ, 89 (2), 430-447.
De Haan C., 2016. Prospects for Livestock-Based Livelihoods in Africa’s Drylands. World Bank Studies, World Bank, Washington, D.C., 199 p.
De Haan C., Gerber P., Opio C., 2010. Structural changes in the Livestock sector. In: Livestock in a Changing Landscape Vol. 1 Drivers, Consequences, and Responses. (H. Mooney, L. Neville, H. Steinfeld, F. Schneider, eds), Island Press, 35-50.
De Haan C., Van Veen T.S., Brandenburg B., Gauthier J., Le Gall F., Mearns R., Simeon M., 2001. Livestock development: implications for rural poverty, the environment, and global food security. Washington, D.C.: Directions in development, The World Bank. 96 p.
de Haan C., Ericksen P., Said M., Robinson L., Flintan F., Shaw A., Kifugo S., Wane A., Touré I., Ickowicz A., Corniaux C, Barr J., Martignac C., 2016. Trends and Drivers of Vulnerability in SSA Drylands. In: Prospects for Livestock-Based Livelihoods in Africa’s Drylands (C. De Haan, ed.). World Bank Studies, World Bank, Washington D.C., 199 p.
De Janvry A., Platteau J.P., Gordillo G., Sadoulet E., 2001. Access to Land and Land Policy Reforms. In: Access to Land, Rural Poverty, and Public Action (A. de Janvry, G. Gordillo, E. Sadoulet, J.P. Platteau eds), WIDER Studies in Development Economics, Oxford University Press, chapter 1.
de Jouvenel B., 1972. L’Art de la Conjecture, Sedeis, Futuribles, Paris, 407p.
de Jouvenel H., 1986. Prospective for a new citizenship. Futures, 18 (2), 125-133.
de Jouvenel H., 2000. A brief methodological guide to scenario building. Technological Forecasting and Social Change, 65, 37-48.
de Jouvenel H., 2004. An invitation to foresight. Futuribles, Paris, 90 p.
De Koning G.H.J., Verburg P.H., Veldkamp A., Fresco L.O., 1999. Multiscale Modelling of Land Use Change Dynamics in Ecuador. Agricultural System, 61, 77-93.
de Lattre-Gasquet M., Donnars C., Marzin J., Piet L., 2014. Quel(s) avenir(s) pour les structures agricoles ? Cahier Demeter, 15, 169-196.
de Lattre-Gasquet, M., Moreau, C., Elloumi, M., Ben Becher L., 2017a. Vers un scénario « Des usages agroécologiques des terres pour une alimentation diversifiée et de qualité et un système alimentaire territorialisé » en Tunisie en 2050. OCL [on line], 24 (3), D306, https://www.ocl-journal.org/articles/ocl/full_html/2017/03/ocl170025s/ocl170025s.html (accessed March 1st, 2018).
de Lattre-Gasquet M., Mora O., Le Mouël C., Dumas P., Brunelle T., Donnars C., Rechauchère O., 2017b. Que nous apprend le scénario « Des usages des terres pour une alimentation de qualité et une nutrition saine » de la prospective Agrimonde-Terra ? In: La sécurité alimentaire mondiale : État des lieux et prospectives (J.L. Rastoin, C. Férault, ed.). L’Harmattan, Paris, 314 p.
De Schutter O., 2011. The Green Rush: The Global Race for Farmland and the Rights of Land Users. Harvard International Law Journal, 52(2), 504-559.
De Schutter O., 2013. The agrarian transition and the “feminization” of agriculture. Paper presented at the international conference “The food sovereignty: a critical dialogue”. New-Haven: 14-15 September 2013, conference paper 37, 46 p.
de Ponti T., Rijk B., van Ittersum M.K., 2012. The crop yield gap between organic and conventional agriculture. Agricultural Systems, 108, 1-9.
Deaton A., Drèze J., 2009. Food and nutrition in India: facts and interpretations. Economics and Political Weekly, 44(7), 42-65.
Deininger K., Byerlee D., 2012. The Rise of Large Farms in Land Abundant Countries: Do They Have a Future? World Development, 40 (4), 701-714.

352
LAND USE AND FOOD SECURITY IN 2050
Deininger K., Byerlee D., Lindsay J., Norton A., Selod H., Stickler M., 2011. Rising Global Interest in Farmland: Can It Yield Sustainable and Equitable Benefits? The World Bank, Washington D.C., 266 p.
Delgado C., Rosegrant M., Steinfeld H., Ehui S., Courbois C., 1999. Livestock to 2020. The next food revolution. Food, Agriculture and the Environment Discussion Paper 28. International Food Policy Research Institute, Food and Agriculture Organization of the United Nations, International Livestock Research Institute: Washington, DC, 72 p.
Delisle H., 2010. Findings on dietary patterns in different groups of African origin undergoing nutrition transition. Applied Physiology, Nutrition, and Metabolism, 35, 224-228.
Denis E., Marius-Gnanou K., 2011. Toward a better appraisal of urbanisation in India. Cybergeo: European Journal of Geography [on line], 569, http://cybergeo.revues.org/24798 (accessed March 7th, 2018).
Deshingkar P., 2012. Environmental risk, resilience and migration: implications for natural resource management and agriculture. Environmental Research Letters, 7(1), 015603.
Detomasi D.A., 2007. The Multinational Corporation and Global Governance: Modelling Global Public Policy Networks. Journal of Business Ethics, 71, 321–334.
Develtere P., Pollet I., Wanyama F., 2008. Cooperating out of Poverty. International Labour Office, Geneva, 397 p.
Devereux S., 2007. The impact of droughts and floods on food security and policy options to alleviate negative effects. Agricultural Economics, 37, 47-58.
Deytieux V., Thomas Nemecek T., Freiermuth Knuchel R., Gaillard G., Munier-Jolain N., 2012. Is Integrated Weed Management efficient for reducing environmental impacts of cropping systems? A case study based on life cycle assessment. European Journal of Agronomy, 36(1), 55-65.
Dixon J., Omwega A.M., Friel S., Burns C., Donati K., Carlisle R., 2007. The health equity dimensions of urban food systems. Journal of Urban Health, 84, 118-129.
Djürfeldt Anderson A., Djürfeldt G., 2013. Structural Transformation and African Smallholders: Drivers of Mobility within and between the Farm and Non-farm Sectors for Eight Countries. Oxford Development Studies, 41(3), 281-306.
Djürfeldt Anderson A., Jirström M., 2013. Urbanization and Changes in Farm Size in Sub-Saharan Africa and Asia from a Geographical Perspective, a review of the literature, Final paper for the ’Trends in Urbanization and Changes in Farm Size in Developing Countries: Implications for Agricultural Research’, CGIAR’s Independent Science and Partnership Council (ISPC), 32 p.
Donald B., Gertler M., Gray M., Lobao L., 2010. Re-regionalizing the Food System? (Introduction to Special Issue on Food Relocalization). Cambridge Journal of Regions Economy and Society, 3, 171-175.
Doré T., Clermont-Dauphin C., Crozat Y., David C., Jeuffroy M.-H., Loyce C., Makowski D., Malezieux E., Meynard J.-M., Valantin-Morison M., 2008. Methodological progress in on-farm regional diagnosis. A review. Agronomy for Sustainable Development, 28, 151-161.
Doré T., Makowski D., Malézieux E., Munier-Jolain N., Tchamitchian M., Tittonell P., 2011. Facing up to the paradigm of ecological intensification in agronomy: Revisiting methods, concepts and knowledge. Europ. J. Agronomy, 34, 197-210.
Dorin B., 2014. Dynamiques agricoles en Afrique subsaharienne : une perspective à 2050 des défis de la transformation structurelle. [research report] Centre de Sciences Humaines (CSH), 52 p.
Doss C., Kovarik C., Peterman A., Quisumbing A.R., van den Bold M., 2013. Gender Inequalities in Ownership and Control of Land in Africa. Myths versus Reality. International Food Policy Research Institute, Discussion Paper 01308, Washington, D.C., 48 p.
Drewnowski A., 2000. Nutrition transition and global dietary trends. Nutrition, 16, 486-487.
353
References
Drewnowski A., 2009. Obesity, diets, and social inequalities. Nutrition Review, 67 (S1), 36-39.
Drewnowski A., Popkin B.M., 1997. The nutrition transition: New trends in the global diet. Nutrition Reviews, 55, 31-43.
Ducastel A., Anseeuw W., 2017. Agriculture as an asset class: reshaping the South African farming sector. Agriculture and Human Values, 34(1), 199-209.
Dugué P., Autfray P., Blanchard M., Djamen P., Dongmo A., Girard P., Olina JP, Ouedraogo S. Sissoko F., Vall E., 2014. L’agroéecologie pour l’agriculture familiale dans les pays du Sud : impasse ou voie d’avenir ? Le cas des zones de savane cotonnière de l’Afrique de l’Ouest et du Centre. GRET. René Dumont revisité et les politiques agricoles africaines, Nov 2012, Paris, France. GRET, pp.93, 2014. https://hal.archives-ouvertes.fr/cirad-01066447/document
Dumas P., 2014. GlobAgri: Disagregation and reaggregation of livestock data. Note rédigée pour Agrimonde-Terra, 8 p.
Dumas P., Manceron S., 2014. GlobAgri methodology. Note rédigée pour Agrimonde-Terra, 7 p.
Dumont B., Fortun-Lamothe L., Jouven M., Thomas M., Tichit M., 2013. Prospects from agroecology and industrial ecology for animal production in the 21st century. Animal, 7(6), 1028-1043.
Eastwood R., Lipton M., Newell A., 2009. Farm size. In: Handbook of Agricultural Economics. Agricultural Development: Farm Policies and Regional Development (R.E. Evenson, P.L. Pingali, eds). Handbooks in Economics, 4 (18), 3323-3397. Elsevier North-Holland, Oxford; Amsterdam.
ECLAC-FAO-IICA, 2013. The Outlook for Agriculture and Rural Development in the Americas: A Perspective on Latin America and the Caribbean. Santiago, 153 p.
EFS, 2013. Science in Society: caring for our futures in turbulent times. Science Policy Briefing. European Science Foundation, Strasbourg, 36 p.
ELD Initiative, UNEP, 2015. The Economics of Land Degradation in Africa: Benefits of Action Outweigh the Costs. The Economics of Land Degradation Initiative and United Nations Environment Program, Bonn and Nairobi, 156 p.
Ellis F., 1998. Household Strategies and Rural Livelihood Diversification. The Journal of Development Studies, 1(35), 1-38.
Ellis F., 2000. The determinants of rural livelihood diversification in developing countries. Journal of Agricultural Economics, 51(2), 289-302.
Elloumi M., Bahri H., Annabi M., Gargouri K., Schwoob M.H., 2017. Pour une trajectoire vers une agriculture durable à l’horizon 2030. Rapport final de l’Initiative pour le développement de Trajectoires de Transformation Agricole (ATPi), Tunisie.
Erb K.-H., Gaube V., Krausmann F., Plutza, C., Bondeau A., Haberl H., 2007. A comprehensive global 5min resolution land-use dataset for the year 2000 consistent with national census data. Journal of Land Use Science, 2(3), 191-224.
Erb K.H., Haberl H., Krausmann F., Lauk C., Plutzar C., Steinberger J.K., Müller C., Bondeau A., Waha K., Pollack G., 2009. Eating the Planet. Feeding and Fuelling the World Sustainably, Fairly and Humanely: a Scoping Study. Commissioned by Compassion in World Farming and Friends of the Earth UK. Institute of Social Ecology and PIK Potsdam, Vienna, Potsdam, 134 p.
European Parliament Policy Department, 2015. Structural and Cohesion Policies. www.europarl.europa.eu/RegData/etudes/STUD/2015/540369/IPOL_STU(2015)540369_EN.pdf (accessed on January, 2018).
Fairbairn M., 2014. Like gold with yield’: evolving intersections between farmland and finance. The Journal of Peasant Studies, 41(5), 777-795.

354
LAND USE AND FOOD SECURITY IN 2050
Fanzo J., 2012. The Nutrition Challenge in Sub-Saharan Africa. United Nations Development Programme, Regional Bureau for Africa, UNDP Working Paper 2012-012, 70 p.
Fanzo J., 2014. Strengthening the engagement of food and health systems to improve nutrition security: synthesis and overview of approaches to address malnutrition. Global Food Security, 3, 183-192.
FAO, 1976. A framework for land evaluation. Soils Bulletin 32. Food and Agriculture Organization of the United Nations, Rome. http://www.fao.org/soils-portal/resources/soils-bulletins/en/ (accessed January 31st, 2018).
FAO, 2000. The State of Food and Agriculture 2000: Lessons from the past 50 years. Food and Agriculture Organization of the United Nations, Rome, 313 p.
FAO, 2007. Un système intégré de recensements et d’enquêtes agricoles. Volume 1 : Programme mondial du recensement de l’agriculture 2010. Food and Agriculture Organization of the United Nations, Rome.
FAO, 2009a. High Level Expert Forum - How to Feed the World in 2050. The technology challenge, 4 p. http://www.fao.org/wsfs/forum2050/wsfs-background-documents/hlef-issues-briefs/en/ (accessed March 6th, 2018).
FAO, 2009b. Proceedings of the Regional Land Degradation Assessment in Drylands (LADA). Workshop for South East Asia, Bangkok, April 27-30th, 2009.
FAO, 2009c. The State of Food and Agriculture 2009: Livestock in the balance. Food and Agriculture Organization of the United Nations, Rome, 166 p.
FAO, 2010. Global Forest Resources Assessment 2010. FAO Forestry Paper 163. Food and Agriculture Organization of the United Nations, Rome, 2010, 198 p.
FAO, 2011a. The State of Food and Agriculture 2010-2011, Women in agriculture: closing the gender gap in development Rome. 148 p.
FAO, 2011b. The State of the World’s Land and Water Resources for Food and Agriculture (SOLAW) – Managing Systems at Risk. Food and Agriculture Organization of the United Nations, Rome and Earthscan, London, 285 p.
FAO, 2012. Voluntary Guidelines on the Responsible Governance of Tenure of Land, Fisheries and Forests in the Context of National Food Security. Food and Agriculture Organization of the United Nations, Rome, 48 p.
FAO, 2012a. The State of Food and Agriculture 2012: Investing in agriculture for a better future. Food and Agriculture Organization of the United Nations, Rome, 106 p.
FAO, 2012b. Stratégie mondiale pour l’amélioration des statistiques agricoles et rurales. This work was originally published by The World Bank in English as Global Strategy to Improve Agricultural and Rural Statistics in 2011. This French translation was arranged by the Food and Agriculture Organization of the United Nations, report 56719-GLB, FAO, Rome, 43 p.
FAO, 2013. 2000 World Census of Agriculture. Analysis and international comparison of the results (1996-2005). Food and Agriculture Organization of the United Nations, Rome, 164 p.
FAO, 2013. State of Food and Agriculture 2013: Food Systems for Better Nutrition. Food and Agriculture Organization of the United Nations, Rome, 114 p.
FAO, 2014. FAO Statistical Yearbook 2014 - Latin America and the Caribbean. Food and Agriculture Organization of the United Nations, Regional Office for the Latin America and the Caribbean, Santiago, Chile, 199 p.
FAO, 2015a. The State of Agricultural Commodity Markets. Trade and food security: achieving a better balance between national priorities and the collective good. Food and Agriculture Organization of the United Nations, Rome, 89 p.
355
References
FAO, 2015b. Regional Overview of Food Insecurity: African Food Security Prospects brighter than ever. Accra, FAO.
FAO, 2016a. Coping with Water Scarcity in Agriculture. A global Framework for action in a changing climate. Food and Agriculture Organization, Rome, 12 p.
FAO, 2016b. Agricultural mechanization, a key input for sub-Saharan African smallholders. Integrated Crop Management, 23, Food and Agriculture Organization of the United Nations, Rome, 44 p.
FAO, 2017a. Food and Agriculture. Driving action across the 2030 Agenda for Sustainable Development. Food and Agriculture Organization of the United Nations, Rome, 40 p.
FAO, 2017b. The future of food and agriculture; Trends and challenges. Food and Agriculture Organization of the United Nations, Rome, 163 p.
FAO, 2017c. Regional Overview of Food Security and Nutrition in Africa 2016. The Challenges of building Resilience to Shocks and Stresses. Accra.
FAO, IFAD and WFP. 2015. The State of Food Insecurity in the World 2015. Meeting the 2015 international hunger targets: taking stock of uneven progress. Food and Agriculture Organization of the United Nations, Rome, 57 p.
FAO, WFP and IFAD, 2012. The State of Food Insecurity in the World 2012. Economic growth is necessary but not sufficient to accelerate reduction of hunger and malnutrition. Rome, 65 p.
FAO/INRA, 2016. Innovative markets for sustainable agriculture – How innovations in market institutions encourage sustainable agriculture in developing countries (A. Loconto, A.S. Poisot, P. Santacoloma, eds), Rome, 390 p.
FAO-ILO-IUF, 2007. Agricultural workers and their contribution to sustainable agriculture and rural development. Food and Agriculture Organization (FAO), International Labour Organization (ILO), and International Union of Food, Agricultural, Hotel, Restaurant, Catering, Tobacco and Allied Workers’ Associations (IUF). Geneva: ILO, 988 p.
Fardet A., Rock E., 2014. Toward a New Philosophy of Preventive Nutrition: From a Reductionist to a Holistic Paradigm to Improve Nutritional Recommendations. Advances in Nutrition, 5 (4), 430-46.
Fardet A., Rock E., Bassama J., Bohuon P., Prabhasankar P., Monteiro C., Moubarac J.-C., Achir N., 2015. Current food classification in epidemiological studies does not enable reaching solid nutritional recommendations for preventing diet-related chronic diseases: the impact of food processing. Advances in Nutrition, 6(6), 629-638.
Fay M., Opal C., 2000. Urbanization without Growth: A Not So Uncommon Phenomenon. Washington DC: World Bank.
Fischer G., Hizsnyik E., Prieler S., Wiberg D., 2011. Scarcity and abundance of land resources: Competing uses and the shrinking and resource based. SOLAW Background Thematic Report - TR02, Food and Agriculture Organization of the United Nations, Rome, 58 p.
Fischer G., Shah M., 2010. Farmland Investments and Food Security, Statistical Annex, Report prepared under World-Bank-IIASA Contract (International Institute for Applied Systems Analysis, Laxenburg, Austria), 42 p.
Fletschner D., Kenney L., 2014. Rural Women’s Access Financial Services: Credit, Savings, and Insurance. In: Gender in Agriculture (Quisumbing A., Meinzen-Dick R., Raney T., Croppenstedt A., Behrman J., Peterman A., eds). Springer, 187-208.
Fouilleux E., Bricas N., Alpha A., 2017. Feeding 9 billion people: global food security debates and the productionist trap. Journal of European Public Policy, 24(11), 1658-1677.
Fournier S., Touzard J.M., 2017. Diversité et confrontation de modèles au sein des systèmes alimentaires: vers une convergence ? In: Systèmes agro-alimentaires en transition (P. Lubello, A. Falque, L. Temri, eds), Collection Updates Sciences & Technologies, Éditions Quæ, Versailles, 137-148.
356
LAND USE AND FOOD SECURITY IN 2050
Fraticelli M., 2011. La Coopérative Agricoltura Nuova. Étude de cas, Italy, Rome. Les Etudes d’Agter n°5, 28 p.
Friis C., Nielsen J.Ø., 2017. Land-use change in a telecoupled world: the relevance and applicability of the telecoupling framework in the case of banana plantation expansion in Laos. Ecol. Soc., 22 (4), 30 p.
FTP, 2014. A Glossary of Terms commonly used in Futures Studies. Global Forum on Agricultural Research (GFAR), Forward Thinking Platform, Rome.
Fuglie K., Heisey P., King J., Pray C., Day-Rubenstein K., Schimmelpfennig D., Wang S.L., Karmarkar-Deshmukh R., 2011. Research Investments and Market Structure in the Food Processing, Agriculture Input and Biofuel Industries Worldwide. Economic Research Report 130, Economic Research Service, U.S. Department of Agriculture, Washington D.C., 34 p.
Fuglie K., Rada N., 2013. Resources, Policies, and Agricultural Productivity in Sub-Saharan Africa. United States Department of Agriculture (USDA) Economic Research Report 145, Washingon D.C., 78 p.
Fuglie K.O., 2008. Is a slowdown in agricultural productivity growth contributing to the rise in commodity prices? Agricultural Economics, 39 (2008) supplement, 431-441.
Fukuyama F., 2013. What Is Governance? Governance, 26, 347–368.
Gaigné C., Capt D., Faguer E., Frappier L., Hilal M., Hovelaque V., Le Cotty T., Parrot L., Schmitt B., Soulard C.T., 2011. Urbanisation et durabilité des systèmes alimentaires. In: Pour une alimentation durable. Réflexion stratégique duALIne (Esnouf, C., Russel, M., Bricas, N., eds). Versailles, éditions Quæ, pp. 123-142.
Garrett R.D., Niles M., Gil J., Dy P., Reis J., Valentim J., 2017. Policies for Reintegrating Crop and Livestock Systems: A Comparative Analysis. Sustainability, 9, 473.
Garrett R.D., Rueda X., Lambin E.F., 2013. Globalization’s unexpected impact on soybean production in South America: linkages between preferences for non-genetically modified crops, eco-certifications, and land use. Environ. Res. Lett., 8, 1-11.
Garrity D., Dixon J., Boffa J.M., 2012. Understanding African Farming Systems: Science and Policy Implications. Prepared for Food Security in Africa: building research and practice. 29-30 November 2012, Sydney, 63 p.
Gautier D., Denis D., Locatelli B., 2016. Impacts of drought and responses of rural populations in West Africa: a systematic review. WIREs Clim Change [on line], 7:666-681, http://wires.wiley.com/WileyCDA/WiresArticle/wisId-WCC411.html (accessed February 1st, 2018).
Geary K., 2012. Our land, our lives; Time out on the global land rush. London: Oxfam, briefing note 10-2012, 28 p.
Geist H.J., Lambin E.F., 2002. Proximate Causes and Underlying Driving Forces of Tropical Deforestation. BioScience, 52(2), 143-150.
Gerber P., Mooney H. A., Dijkman J., Tarawali S., de Haan C., 2010. Cross-Cutting Observation and Conclusions. In: Livestock in a Changing Landscape Vol. 2 Experiences and Regional Perspectives. (P. Gerber, H. Mooney, J. Dijkman, eds), Island Press, 172-174.
Gilpin R., 1975. U.S. Power and the Multinational Corporation: The Political Economy of Foreign Direct Investment. Basic Books, New York, 291 p.
Glassman A., Ezeh, A., 2014. Delivering on a Data Revolution in Sub-Saharan Africa. Center for 7/7/2014. Global Development. Brief.
Gning T., Larue F., 2014. Le nouveau modèle coopératif dans l’espace OHADA : un outil pour la professionnalisation des organisations paysannes ? Etudes, Fondation FARM, Paris, 126 p.
Godet M., 1994. From Anticipation to Action, Paris: UNESCO.
357
References
Godet M., 2000. The art of scenarios and strategic planning: tools and pitfalls. Technological Forecasting and Social Change, 65, 3-22.
Godfray, C.G., Beddington, J.R., Crute, I.R., Haddad, L., Lawrence, D., Muir, J.F., Pretty, J., Robinson, S., Thomas, S.M., Toulmin C., 2010. Food Security: The Challenge of Feeding 9 Billion People. Science, 327: 812.
Gomez M.I., Ricketts K.D., 2013. Food value chain transformations in developing countries: Selected hypotheses on nutritional implications. Food Policy, 42, 139-150.
Grain, 2008. Seized! The 2008 land grab for food and financial security. Barcelona: Grain. Grain Briefing, 1-11.
Grassini P., Cassman K.G., 2012. High-yield maize with large net energy yield and small global warming intensity. PNAS, 109, 1074-1079.
Grassini P., Eskridge K.M., Cassman K.G., 2013. Distinguishing between yield advances and yield plateaus in historical crop production trends. Nature Communications, 4, 2918.
Grataloup C., 2007. Géohistoire de la mondialisation. Le temps long du monde. Paris: A. Colin.
Gregersen C., Mackie J., Torres C., 2016. Implementation of the 2030 Agenda in the European Union. Constructing an EU Approach to Policy Coherence for Sustainable Development. European Center for Policy Development Management (ECPDM) Discussion Paper No. 197, 41 p.
Griffon M., 2006. Nourrir la planète. Odile Jacob, Paris, 456 p.
Griffon M., 2010. Pour des agricultures écologiquement intensives. Éditions de l’Aube, 144 p.
Grubb M., 2010. Copenhagen, Back to the future. Climate Policy, 10 (2), 127-130.
GSMA, 2016. The Mobile Economy. Africa 2016. London, GSMA. https://www.gsmaintelligence.com/research/?file=3bc21ea879a5b217b64d62fa24c55bdf&download
Guarin A., 2013. The Value of Domestic Supply Chains: Producers, Wholesalers, and Urban Consumers in Colombia. Development Policy Review, 31, 511-530.
Gulbrandsen L.H., 2012. Dynamic governance interactions: Evolutionary effects of state responses to non-state certification programs. Regulation and Governance, 8(1), 74-92.
Guyomard H, Forslund A., Dronne Y., 2011. Biofuels and World Agricultural Markets: Outlook for 2020 and 2050. In: Economic Effects of Biofuel Production (M.A. dos Santos Bernardes, ed.), InTech Publisher, chapter 7.
Haggblade S., Hazell P., Reardon T., 2010. The rural non-farm economy: Prospects for growth and poverty reduction. World Development, 38 (10), 1429-1441.
Havas A., Schartinger D., Weber M., 2010. The impact of foresight on innovation policy-making: Recent experiences and future perspectives, Research Evaluation, 19(2), 91-104.
Hawkes C., 2006. Uneven dietary development: linking the policies and processes of globalization with the nutrition transition, obesity and diet-related chronic diseases. Global Health, 2, 4.
Hawkes C., 2012. Food policies for healthy populations and healthy economies. BMJ: British Medical Journal [Online], 344, e2801.
Hawkes C., Chopra M., Friel S., 2009. Globalization, trade and the nutrition transition. In: Globalization and Health: Pathways, Evidence and Policy (Labonté R., Schrecker T., Packer C. and Runnels V., eds), chapter 10, Routledge, New-York, 235-262.
Hawkes C., Jewell J., Allen K., 2013. A food policy package for healthy diets and the prevention of obesity and diet-related non-communicable diseases: the NOURISHING framework. Obesity Reviews, 14 (S2), 159-68.
358
LAND USE AND FOOD SECURITY IN 2050
Hazell P., Poulton C., Wiggins S., Dorward A., 2007. The future of small farms for poverty reduction and growth. International Food Policy Research Institute (IFPRI) 2020 Discussion Paper 42, May 2007. Washington D.C: IFPRI, 38 p.
Heimans J., Timms H., 2014. Understanding “New Power”. Harvard Business Review, December.
Herrero M., Havlik P., Valin H., Notenbaret A., Rufino M.C., Thornton P.K., Blümmel M., Weiss F., Grace D., Obersteiner M., 2013. Biomass use, production, feed efficiencies, and greenhouse gas emissions from global livestock systems. Proc. Natl. Acad. Sci., 110 (52), 20 888-20 893.
Herrero M., Thornton P.-K., Bernuès A., Baltenweck I., Vervoort J., van de Steeg J., Makokha S., van Wijk M.-T., Karanja S., Rufino M.-C., Staal S.-J., 2014. Exploring future changes in smallholder farming systems by linking socio-economic scenarios with regional and household models. Global Environmental Change, 24, 165-182.
Herrero M., Thornton P.K., Power B., Bogard J.R., Remans R., Fritz S., Gerber J.S., Nelson G., See L., Waha K., Watson R.A., West P.C., Samberg L.H., van de Steeg J., Stephenson E., van Wijk M., Havlik P., 2017. Farming and the geography of nutrient production for human use: a transdisciplinary analysis. Lancet Planet Health, 1, e33-e42.
Hersperger A.M., Gennaio M., Verburg P.H., Bürgi M., 2010. Linking land change with driving forces and actors: four conceptual models. Ecol. Soc., 15 (4), 1, https://www.ecologyandsociety.org/vol16/iss2/resp1/main.html (accessed February 1st, 2018).
Hertel T.W., Burke M.B., Lobell D.B., 2010. The poverty implications of climate-induced crop yield changes by 2030. Global Environmental Change, 20, 577-585.
Hervieu B., Purseigle F., 2009. Pour une sociologie des mondes agricoles dans la globalisation. Etudes Rurales 183 (1), 177-200.
Hill S.B., Mac Rae R.J., 1995. Conceptual framework for the transition from conventional to sustainable agriculture. Journal of Sustainable Agriculture, 7 (1), 81-87.
Himmelstein J., Ares A., Gallagher D., Myers J., 2017. A meta-analysis of intercropping in Africa: impacts on crop yield, farmer income, and integrated pest management effects. International Journal of Agricultural Sustainability, 15 (1), 1-10.
Hishamunda N., Ridler N.B., Bueno P., Yap W.G., 2009. Commercial aquaculture in Southeast Asia: Some policy lessons. Food Policy, 34 (1), 102-107.
Hiwasaki L., Idrissou L., Okafor C., van der Hoek R., 2016. Constraints and opportunities in using multi-stakeholder processes to implement integrated agricultural systems research? The Humidtropics case. In: Sustainable Intensification in Smallholder Agriculture. An integrated systems research approach (Öborn I., Vanlauwe B., Phillips M., Thomas R., Brooijmans W., Atta-Krah K., eds), Earthscan Food and Agriculture, Routledge, 350-366.
HLPE, 2013. Biofuels and food security. A report by the High-Level Panel of Experts on Food Security and Nutrition of the Committee on World Food Security, Rome, 132 p.
HLPE, 2013. Investing in smallholder agriculture for food security. A report by the High Level Panel of Experts on Food Security and Nutrition of the Committee on World Food Security. Rome: Committee on World Food Security, 110 p.
Hu F.B., 2011. Globalization of diabetes: the role of diet, lifestyle, and genes. Diabetes Care, 34, 1249-57.
Hubert B., Ison R., 2017. Systems thinking. Towards transformation in praxis and situations. In: Sustainable Intensification in Smallholder Agriculture. An integrated systems research approach (I. Öborn, B. Vanlauwe, M. Phillips, R. Thomas, W. Brooijmans, L. Atta-Krah, eds), Earthscan Food and Agriculture, Routledge, 115-129.
Hugon P., 2016. Afriques. Entre puissance et vulnérabilité, Paris: Armand Colin, 272 p.

359
References
Hulme P., 2009. Trade, transport and trouble: managing invasive species pathways in an era of globalization. Journal of Applied Ecology, [on line] 46(1), 10-18. http://onlinelibrary.wiley.com/doi/10.1111/j.1365-2664.2008.01600.x/full (accessed January 31st, 2018).
IAASTD, 2009. Agriculture at a Crossroads: Global Report. Washington DC: International Assessment of Agricultural Knowledge, Science and Technology for Development, 98 p.
Ickowicz A., Garba I., Toutain B., Cesaro J.D., Gerber P., Touré I., 2014. Plaidoyer pour un système d’information sur le pastoralisme au Sahel. Afrique contemporaine, 1 (249), 90-92.
IEA, 2014. Africa Energy Outlook. A focus on energy prospects in sub-Saharan Africa. International Energy Agency, World Energy Outlook Special Report, Paris, 237 p.
IFAD 2016. Rural Development Report; Fostering inclusive rural transformation. International Fund for Agricultural Development, Rome, Italy, September. 78 p.
IFAD, 2008. Improving access to land and tenure security: Policy. International Fund for Agricultural Development, Rome. 42 p.
Ifland J.R., Preuss H.G., Marcus M.T., Rourke K.M., Taylor W.C., Burau K., Jacobs W.S., Kadish W., Manso G., 2009. Refined food addiction: a classic substance use disorder. Medical Hypotheses, 72(5), 518-526.
Iizumi T., Yokozawa M., Sakurai G., Travasso M.I., Romanenkov V., Oettli P., Newby T., Ishigooka Y., Furuya J., 2014. Historical changes in global yields: major cereal and legume crops from 1982 to 2006. Global Ecol. Biogeogr., 23 (3), 346–357.
ILO, 2005a. Yearbook of labour statistics (63rd edition). International Labour Organization. 1582 p.
ILO, 2005b. Introductory Report: Decent Work – Safe Work. XVIIth World Congress on Safety and Health at Work. Orlando, 18-22 Sep. 2005. Geneva: International Labour Office. 48 p.
ILO, 2007. Agricultural workers and their contribution to sustainable agriculture and rural development. Food and Agriculture Organization of the United Nations, International Labour Organization and International Union of Food, Agricultural Hotel, Restaurant, Catering, Tobacco and Allied Workers’ Association, Geneva, 102 p.
ILO, 2015. World employment and social outlook: Trends 2015. International Labour Office, Geneva, 100 p.
ILO, 2017. Employment Research Brief. Geneva: International Labour Office, Geneva, 8 p.
Imamura F., Micha R., Khatibzadeh S, Fahimi S., Shi P., Powles J., Mozaffarian D., 2015. Dietary quality among men and women in 187 countries in 1990 and 2010: a systematic assessment. Lancet Global Health, 3, E132-E142.
IMF, 2016. Regional Economic Outlook. Sub-Saharan Africa. Multispeed Growth. International Monetary Fund, Washington, D.C.
IMF, 2017. Regional Economic Outlook: Fiscal Adjustment and Economic Diversification. International Monetary Fund, Washington, D.C.
Ingram J., Dyball R., Howden M., Vermeulen S., Garnett T., Redlingshöfer B., Guilbert S., Porter J.R., 2016. Food Security, Food Systems, and Environmental Change. Solutions, 7(3), 63-73.
INRAT – PHARE, 2017. Rapport de la composante IDEAGRI – INRAT/AFD, du projet Modernisation de l’agriculture tunisienne (CTP 1153).
International Food Policy Research Institute (IFPRI), 2016. Global Nutrition Report 2016: From Promise to Impact: Ending Malnutrition by 2030. Washington, DC, 156 p.
360
LAND USE AND FOOD SECURITY IN 2050
IPBES, 2016. The assessment report of the Intergovernmental Science-Policy Platform on Biodiversity and Ecosystem Services on pollinators, pollination and food production. S.G. Potts, V.L. Imperatriz-Fonseca, H.T. Ngo, (eds). Secretariat of the Intergovernmental Science-Policy Platform on Biodiversity and Ecosystem Services, Bonn. 552 p.
IPCC, 2006. Agriculture, Forestry and Other Land Use, Volume 4. In: 2006 IPCC Guidelines for National Greenhouse Gas Inventories, Institute for Global Environmental Strategies, Japan.
IPCC, 2007. Climate Change 2007. Synthesis Report, IPCC, Geneva.
IPCC, 2013. Climate Change 2013. The Physical Science Basis. Contribution of Working Group I to the Fifth Assessment Report of the Intergovernmental Panel on Climate Change (Stocker T.F., Qin D., Plattner G.-K., Tignor M., Allen S.K., Boschung J., Nauels A., Xia Y., Bex V., Midgley P.M., eds), Cambridge University Press, Cambridge, United Kingdom and New York, NY, USA, 1535 p.
IPCC, 2014a. Climate Change 2014. Impacts, Adaptation, and Vulnerability. Part A: Global and Sectoral Aspects. Contribution of Working Group II to the Fifth Assessment Report of the Intergovernmental Panel on Climate Change (Field C.B., Barros V.R., Dokken D.J., Mach K.J., Mastrandrea M.D., Bili, T.E., Chatterjee M., Ebi K.L., Estrada Y.O., Genova R.C., Girma B., Kissel E.S., Levy A.N., MacCracken S., Mastrandrea P.R., White L.L., eds), Cambridge University Press, Cambridge, United Kingdom and New York, NY, USA, 1131 p.
IPCC, 2014b. Climate Change 2014. Impacts, Adaptation, and Vulnerability. Part B: Regional Aspects. Contribution of Working Group II to the Fifth Assessment Report of the Intergovernmental Panel on Climate Change (Barros V.R., Field C.B., Dokken D.J., Mastrandrea M.D., Mach K.J., Bilir T.E., Chatterjee M., Ebi K.L., Estrada Y.O., Genova R.C., Girma B., Kissel E.S., Levy A.N., MacCracken S., Mastrandrea P.R., White L.L., eds), Cambridge University Press, Cambridge, United Kingdom and New York, NY, USA, 601 p.
IPCC, 2014c. Climate Change 2014: Mitigation of Climate Change. Contribution of Working Group III to the Fifth Assessment Report of the Intergovernmental Panel on Climate Change (Edenhofer, O., R. Pichs-Madruga, Y. Sokona, E. Farahani, S. Kadner, K. Seyboth, A. Adler, I. Baum, S. Brunner, P. Eickemeier, B. Kriemann, J. Savolainen, S. Schlömer, C. von Stechow, T. Zwickel, J.C. Minx, eds), Cambridge University Press, 161 p.
IPES-Food, 2017. Too big to feed: Exploring the impacts of mega-mergers, consolidation, and concentration of power in the agri-food sector. International Panel of Experts on Sustainable Food Systems (IPES-Food), 108 p.
ISAAA, 2016. Global Status of Commercialized Biotech/GM Crops: 2016. Executive summary. International Service for the Acquisition of Agri-biotech Applications (ISAAA), brief 52.
Jackson L., Bawa K., Pascual U., Perrings C., 2005. Agrobiodiversity: a new science agenda for biodiversity in support of sustainable agroecosystems, Diversitas, 4, 44 p.
Jarrar Y., 2016. By 2030, what will regional governance look like? https://www.weforum.org/agenda/2016/12/by-2030-what-will-regional-governance-look-like/ (accessed January 31st, 2018).
Jayne T.S., Chamberlin J., Headey D., 2014. Land pressures, the evolution of farming systems, and development strategies in Africa: A synthesis. Food Policy, 48, 1-17.
Jayne T.S., Chamberlin J., Traub L., Sitko N., Muyanga M., Yeboh F., Anseeuw W., Chapoto A., Wineman A., Nkonde C., Kachule R., 2016. Africa’s changing farm size distribution patterns: the rise of medium-scale farms. Agric. Econ., 47 (supplement), 197-214.
Jedwab R., Christiaensen L., Gindelsky M., 2015. Demography, urbanization and development: Rural push, urban pull and… urban push? Journal of Urban Economics, 98, 6-16.
361
References
Jenks B., Topping J., 2016. Financing the United Nations Development System. Current Trends and New Directions. Dag Hammarskjöld Foundation and the United Nations Multi-Partner Trust Fund Office (MPTFO), 96 p.
Jessop R., Diallo B., Duursma M., Mallek A., Harms J., van Manen B., 2012. Assurer l’accès à la finance agricole. Conclusions d’une étude horizontale couvrant le Cambodge, le Mali, le Sénégal, la Tanzanie, la Thaïlande et la Tunisie. Agence Française de Développement (AFD), A Savoir 14, Paris, 138 p.
Kastner T., Erb K.-H., Haberl H., 2014. Rapid growth in agricultural trade: effects on global area efficiency and the role of management. Environ. Res. Lett., 9 (3), 034015.
Kastner T., Schaffartzik A., Eisenmenger N., Erb K.-H., Haberl H., Krausmann F., 2014. Cropland area embodied in international trade: Contradictory results from different approaches. Ecological Economics, 104, 140-144.
Kearney J., 2010. Food consumption trends and drivers. Philos. Trans. R Soc. Lond. B Biol. Sci., 365, 2793-2807.
Keats S., Wiggins S., 2014. Future diets: implications for agriculture and food prices. Report for Shockwatch: managing risk in an uncertain world. London: Overseas Development Institute and UK Department of International Development, 117 p.
Keding G.B., Msuya J.M., Maass B.L., Krawinkel M.B., 2011. Dietary patterns and nutritional health of women: The nutrition transition in rural Tanzania. Food and Nutrition Bulletin, 32, 218-226.
Keding G.B., Schneider K., Jordan I., 2013. Production and processing of foods as core aspects of nutrition-sensitive agriculture and sustainable diets. Food Security, 5 (6), 825-846.
Kelly T.N., Yang W., Chen C.-S., Reynolds K., He J., 2005. Global burden of obesity in 2005 and projections to 2030. International Journal of Obesity, 32 (9), 1431-37.
Kepe T., Tessaro D., 2014. Trading-off: Rural food security and land rights in South Africa. Land Use Policy, 36, 267-274.
Khoury C.K., Bjorkman A.D., Dempewolf H., Ramirez-Villegas J., Guarino L., Jarvis A., Rieseberg L.H., Struik P.C., 2014. Increasing homogeneity in global food supplies and the implications for food security. Proc. Natl Acad. Sci., 111 (11), 4001-4006.
Klein Goldewijk K., Beusen A., de Vos M., 2011. The HYDE 3.1 spatially explicit database of human-induced global land-use change over the past 12,000 years. Global Ecology and Biogeography, 20(1), 73-86.
Kleinert S., Horton R., 2015. Rethinking and reframing obesity. Lancet, 385, 2326-2328.
Kloeppinger-Todd R., Sharma M., 2010. Innovations in rural and agriculture finance. IFPRI 2020 Vision Focus.18, International Food Policy Research Institute and World Bank, Washington D.C, 34 p.
Kneafsey M., 2010. The region in food-important or irrelevant? Cambridge Journal of Regions Economy and Society, 3, 177-190.
Kodila-Tedika O., Bolito-Losembe R., 2014. Corruption et Etats fragiles africains. African Development Review, 26, 50-58.
Koroma S., Nimarkoh J., You N., Ogalo V., Owino B., 2017. Formalization of informal trade in Africa. Trends, experiences and socio-economic impacts. Food and Agriculture Organization (FAO), Regional Office for Africa, Accra, 38 p.
Kremen C., Miles A., 2012. Ecosystem services in biologically diversified versus conventional farming systems: Benefits, externalities, and trade-offs. Ecol. Soc., 17 (4), 40.

362
LAND USE AND FOOD SECURITY IN 2050
Kuemmerle T., Levers C., Erb K., Estel S., Jepsen M., Müller D., Plutzar C., Stürck J., Verkerk P.J., Verburg P.H., Reenberg A., 2016. Hotspots of land use change in Europe. Environ. Res. Lett., 11 (064020), 1-14. http://iopscience.iop.org/article/10.1088/1748-9326/11/6/064020/pdf (accessed February 1st, 2018).
Kumar B.M., Nair P.K.R., 2004. The enigma of tropical homegardens. Agrofor. Syst., 61-62, 135-152.
Kumpatla S.P., Buyyarapu R., Abdurakhmonov I.Y., Mammadov J.A., 2012. Genomics-Assisted Plant Breeding in the 21st Century: Technological Advances and Progress. In: Plant Breeding (I. Abdurakhmonov, ed.), InTech, 364 p.
Kushnir K., Mirmulstein M.L., Ramalho R., 2010. Micro, Small, and Medium Enterprises around the World: How Many Are There, and What Affects the Count? MSME country indicators. The World Bank and IFC, 9 p.
Lal R., 2004. Soil carbon sequestration impacts on global climate change and food security. Science, 304, 1623-1627.
Lambin E., Meyfroidt P., 2011. Global land use change, economic globalization, and the looming land scarcity. PNAS, 108 (9), 3465-3472.
Lambin E.F, Turner B.L., Geist H.J., Agbola S.B., Angelsen A., Bruce J.W., Coomes O.T., Dirzo R., Fisher G., Folke C., George P.S., Homewood K., Ramakrishnan P.S., Richard J.F., Skanes H., Steffen W., Stone G., Svedin U., Vekdkamp T.A, Vogel C., Xu J., 2001. The causes of land-use and land-cover change: moving beyond the myths. Global Environmental Change, 11, 261-269.
Lambin E.F., Geist H.J., 2006. Land use and land cover change: local processes and global impacts. The IGBP Series, Springer-Verlag, Berlin, 222 p.
Lambin E.F., Geist H.J., Lepers E., 2003. Dynamics of land-use and land-cover change in tropical regions. Annu. Rev. Environ. Resour., 28, 205-241.
Lambin E.F., Meyfroidt P., 2010. Land use transitions: Socio-ecological feedback versus socio-economic change. Land Use Policy, 27, 108-118.
Lambin E.F., Meyfroidt P., 2011. Global land use change, economic globalization, and the looming land scarcity. PNAS, 108 (9), 3465-3472, http://www.pnas.org/content/pnas/108/9/3465.full.pdf (accessed January 31st, 2018).
Lambin E.F., Meyfroidt P., Rueda X., Blackman A., Börner J., Cerutti P.O., Dietsch T., Jungmann L., Lamarque P., Lister J., Walker N.F., Wunderm S., 2014. Effectiveness and synergies of policy instruments for land use governance in tropical regions. Global Environmental Change, 28, 129-140.
Lang T., 1999. Diet, health and globalization: five key questions. Proc. Nutr. Soc., 58, 335-343.
Lanjouw P., Murgai R., 2009. Poverty decline, agricultural wages, and non-farm employment in India: 1983-2004. Policy Research Working Paper 4858. World Bank.
Larson D., Otsuka K., Matsumoto T., Kilic T., 2013. Should African rural development strategies depend on smallholder farms? An exploration of the inverse productivity hypothesis. Agric. Econ., 45 (3), 1-13.
Latour B., 2016. Onus Orbis Terrarum: About a Possible Shift in the Definition of Sovereignty. Millennium: Journal of International Studies, 44 (3), 305-320.
Lavelle P., Dugdale R., Scholes R., Berthe A.A., Carpenter E., Codispoti L., Izac A.M., Lemoalle J., Luizao F., Scholes M., Tréguer P., Ward D., 2005. Nutrient cycling. In: Ecosystems and human wellbeing: current state and trends. Millennium Ecosystem Assessment, (R. Hassan, R. Scholes, N. Ash, eds). Island Press.
Lavigne Delville P., 2010. Sécurisation foncière, formalisation des droits, institutions de régulation foncière et investissements. Pour un cadre conceptuel élargi. Revue des Questions Foncières, 1, 5-34.
Le Cotty T., Dorin B., 2012. A global foresight on food crop needs for livestock. Animal, 6 (9), 1528-1536.
363
References
Le Mouël C., Forslund A., 2017. How to feed the world in 2050: A review of the responses from global scenario studies. European Review of agricultural Economics, 44 (4), 541-591.
Leach M., Rockström J., Raskin P., Scoones I., Stirling A.C., Smith A., Thompson J., Millstone E., Ely A., Arond E., Folke C., Olsson P., 2012. Transforming innovation for sustainability. Ecol. Soc., 17 (2), 11, https://www.ecologyandsociety.org/vol17/iss2/art11/ (accessed January 1st, 2018).
Leavy J., Smith S., 2010. Future Farmers: Youth Aspirations, Expectations and Life Choices. Discussion Paper 013, Future Agricultures Consortium, 14 p.
Leclerc C., Mwongera C.N., Camberlin P., Moron V., 2014. Cropping System Dynamics, Climate Variability, and Seed Losses among East African Smallholder Farmers: A Retrospective Survey. Weather, Climate, and Society, 6 (3), 354-370.
Lerin F., Louafi S., 2012. La sécurité alimentaire : la construction d’un bien public global ? OCL, 19 (5), 276-282, https://www.ocl-journal.org/articles/ocl/pdf/2012/05/ocl2012195p276.pdf (accessed February 1st, 2018). Available in English: IDDRI Working Paper 10, 2014, 12 p.
Lerner A.M., Eakin H., 2011. An obsolete dichotomy? Rethinking the rural-urban interface in terms of food security and production in the global south. Geographical Journal, 177, 311-320.
Levesque R., 2014. La question foncière renouvelée : pour une alimentation durable de l’humanité et une souveraineté alimentaire européenne. Cahiers Demeter Concurrence entre usages agricoles et usagers des sols agricoles :la question foncière renouvelée, 15, 7-48, https://s1.membogo.com/company/CPYeQ23lLcPYvZ9GTj339cZ7/asset/files/la_question_fonciere_renouvelee_pour_une_alimentation_durable_de_l_humanite_et_une_souverainete_alimentaire_europeenne.pdf (accessed February 1st, 2018).
Levesque R., 2016. Chinese purchases in the Berry. A European case. La Revue Foncière, 11, 10-12.
Licker R., Johnson M., Barford C., Foley J.A., Kucharik C.J., Monfreda C., Ramankutty N., 2010. Mind the gap: How do agricultural management explain the ’yield gap’ of cropland around the world? Glob. Ecol. Biogeogr., 19, 769-782.
Liu J., Hull V., Batistella, V., De Fries R., Dietz T., Fu F., Hertel T., Izaurralde R., Lambin E., Li S., Martinelli L.A., Mc Connell W.J., Moran E.F., Naylor R., Ouyand Z., Polenske K., Reenberg A., de Miranda Rocha G., Simmons C., Verburg P.H., Vitousek P.M., Zhang F., Zhu C., 2013. Framing sustainability in a telecoupled world. Ecol. Soc., 18 (2), 26, https://www.ecologyandsociety.org/vol18/iss2/art26/ (accessed February 1st, 2018).
Liu Y., Pan X., Li J., 2015. 1961–2010 record of fertilizer use, pesticide application and cereal yields: a review. Agron. Sustain. Dev., 35, 83-93.
Lobell D., Burke M. B., 2008. Why are agricultural impacts of climate change so uncertain? The importance of temperature relative to precipitation. Environ. Res. Lett., 3, 034007.
Lobell D., Cassman K., Field C., 2009. Crop yield gaps: their importance, magnitudes, and causes. Annu. Rev. Environ. Resour., 34, 179-204.
Lobell D.B., Schlenker W., Costa-Roberts J., 2011. Climate Trends and Global Crop Production Since 1980. Science, 333 (6042), 616-620.
Losch B., 2012. L’agriculture, le défi de l’emploi et les impasses du débat international sur le développement. Preparatory note for the conference ’Évolution du marché international du travail, impacts des exclusions paysannes’, 16 October 2012, CIRAD-AFD, 307 p.
Losch B., 2016. Structural transformation to boost youth labour demand in sub-Saharan Africa: The role of agriculture, rural areas and territorial development. International Labour Office, Employment Policy Department, Employment and Labour Market Policies Branch, Geneva, 78 p.
364
LAND USE AND FOOD SECURITY IN 2050
Losch B., Fréguin-Gresh S., White E., 2011. Rural Transformation and Late Developing Countries in a Globalizing World. A Comparative Analysis of Rural Change. Final Report of the RuralStruc Program, Revised Version, The World Bank.
Losch B., Fréguin-Gresh S., White E.T., 2012. Structural transformation and Rural Change Revisited; Challenges for Late Developing Countries in a Globalizing World. African Development Forum series. The World Bank, 277 p.
Losch B., Magrin G., Imbernon J., 2013. A new emerging rural world. An overview of rural change in Africa. Atlas for the NEPAD Rural Futures programme, CIRAD, Montpellier, 46 p.
Louw A., Ndanga L., Chikazunga D., 2008. Restructuring food markets in the sub-Saharan Africa region: Dynamics in context of the fresh produce subsector. A synthesis of country findings. Regoverning Markets project, Innovative Practice series, London, 69 p.
Loveridge D., 2009. Foresight. The art and science of anticipating the futures. Routledge, New York, 288 p.
Lowder S., Skoet J., Ranney T., 2016. The Number, Size, and Distribution of Farms, Smallholder Farms, and Family Farms Worldwide. World Development, 87, 16-29.
Lowder S.K., Skoet J., Signh S., 2014. What do we really know about the number of farms and family farms in the world? Background paper for The State of Food and Agriculture 2014. ESA Working Paper 14-02. Food and Agriculture Organization of the United Nations, Rome, 39 p.
Lowder S.K.. Skoet J., Raney T., 2016. The Number, Size, and Distribution of Farms, Smallholder Farms, and Family Farms Worldwide. World Development, 87, 16-29.
Macdiarmid J., Kyle J., Horgan G., Loe J., Fyfe C., Johnstone A., Mcneill G., 2011. Livewell: A Balance of Healthy and Sustainable Food Choices. World Wildlife Fund UK, 64 p.
Macours K., de Janvry A., Sadoulet E., 2010. Insecurity of property rights and social matching in the tenancy market. European Economic Review, 54 (7), 80-899.
Maietta M., Kennedy E., Bourse F., 2017. The future of Aid. INGOs in 2030. IARAN – The Inter-Agency Regional Analysts Network, 178 p.
Maire B., Lioret S., Gartner A., Delpeuch F., 2002. Nutritional transition and non-communicable diet-related chronic diseases in developing countries. Santé, 12 (1), 45-55.
Malézieux E., 2012. Designing cropping systems from nature. Agronomy Sust. Developm., 32 (1), 15-29
Malézieux E., Crozat Y., Dupraz C., Laurans M., Makowski D., Ozier-Lafontaine H., Rapidel B., De Tourdonnet S., Valantin-Morison M., 2009. Mixing plant species in cropping systems: tools and models. A review. Agron. Sustain. Dev., 29, 43-62.
Manceron S., Ben-Ari T., Dumas P., 2014. Feeding proteins to livestock: Global land use and food vs. feed competition. OCL, 21 (4), D408, https://www.ocl-journal.org/articles/ocl/pdf/2014/04/ocl140020.pdf (accessed February 1st, 2018).
Mariotti F., 2017. Vegetarian and Plant-Based Diets in Health and Disease Prevention, Academic Press, 922 p.
Marsden T.K., Sonnino R., 2012. Human Health and Wellbeing and the Sustainability of Urban-Regional Food Systems. Curr. Opin. Environ. Sustain., 4 (4), 427-430.
Martin S.M., Lorenzen K., 2016. Livelihood diversification in rural Laos. World Development, 83, 231-243.
Martins A.P.B., Levy R.B., Claro R.M., Moubarac J., Monteiro C.A., 2013. Increased contribution of ultra-processed food products in the Brazilian diet (1987-2009). Revista Saúde Pública, 47, 656-665.
365
References
Massardier G., Sabourin E., Lecuyer L., Avila M., 2012. La démocratie participative comme structure d’opportunité et de renforcement de la notabilité sectorielle : le cas des agriculteurs familiaux dans le programme de développement rural territorial durable territorial au Brésil, territoire Aguas Emendadas. Participation, n° 2.
Masters W., 2013. CGIAR ISPC foresight study on urbanization and farm size in developing countries: Implications for agricultural research. Synthesis document presented at the 7th meeting of the ISPC, 25-27.
Matthiesa B.D., Karimov A.A., 2014. Financial drivers of land use decisions: The case of smallholder woodlots in Amhara, Ethiopia. Land Use Policy, 41, 474-483.
Maxwell D., Wiebe K., 1999. Land Tenure and Food Security: Exploring Dynamic Linkages. Development and Change, 30, 825-849.
Mazoyer M., Roudart L., 1997. L’histoire des agricultures du monde: du néolithique à la crise contemporaine, Seuil, 528 p.
Mbow C., Van Noordwijk M., Luedeling E., Neufeldt H., Minang P., Kowero G., 2014. Agroforestry solutions to address food security and climate change challenges in Africa. Curr. Opin. Environ. Sustain., 6 (14), 61-67.
McCullough E., Pingali P., Stamoulis K., 2008. Small Farms and the Transformation of Food Systems: An Overview. In: The Transformation of Agri-food Systems: globalization, supply chains and smallholder farmers (McCullough E., Pingali P., Stamoulis K., eds.), Earthscan Publishers, London, 416 p.
McGee T.G., 1991. The emergence of Desakota Regions in Asia: Expanding and Hypothesis. In: The extended Metropolis Settlement Transition in Asia (Ginsburg N., Koppel B., McGee T.G., eds.), Honolulu, University of Hawaï Press, 3-25.
McGee T.G., 2009. The Spatiality of Urbanization: The Policy Challenges of Mega-Urban and Desakota Regions of Southeast Asia, UNU-IAS Working Paper n°161, 40 p.
McGranahan G., Satterthwaite D., 2014. Urbanisation concepts and trends. IIED Working Paper. International Institute for Environment and Development, London, 28 p.
McIntyre B., Herren H., Wakhungu J., Watson R., 2009. Agriculture at Crossroads. International Assessment of Agricultural Knowledge, Science and Technology for Development (IAASTD): Global Report. Island Press, 590 p.
McLeod A., 2011. World Livestock 2011. Livestock in food security. Food and Agriculture Organization of the United Nations, Rome, 130 p.
McMichael P., 2009. Banking on Agriculture: A Review of the World Development Report 2008. Journal of Agrarian Change, 9 (2), 235-246.
McMillan M.S., Rodrik D., 2011. Globalization, structural change and productivity growth. NBER Working Paper 17143, 32 p.
Millennium Ecosystem Assessment (MEA), 2005a. Ecosystems and Human Well-Being: Biodiversity Synthesis. 100 p. https://www.millenniumassessment.org/documents/document.354.aspx.pdf (accessed March 7th, 2018).
Millennium Ecosystem Assessment (MEA), 2005b. Ecosystems and Human Well-being: Synthesis. Island Press, 155 p.
Meadows D., 1999. Leverage points: Places to intervene in a system [online]. http://donellameadows.org/archives/leverage-points-places-to-intervene-in-a-system/ (accessed 1st,March 2018).
Meadows D.H., Meadows D.L., Randers J., Behrens W.W., 1972. The Limits to Growth: A Report for the Club of Rome’s Project on the Predicament of Mankind. Universe Books, New York, 205 p.
366
LAND USE AND FOOD SECURITY IN 2050
Meert H., Van Huylenbroeck G., Vernimmen T., Bourgeois M., van Hecke E., 2005. Farm household survival strategies and diversification on marginal farms. J. Rural Stud., 21, 81-97.
Mendelsohn R., Nordhaus W.D., Shaw D., 1994. The impact of global warming on agriculture: A Ricardian analysis. Am. Econ. Rev., 84 (4), 753-771.
Mendez M.A., Popkin B.M., 2004. Globalization, urbanization and nutritional change in the developing world. eJADE, 1, 220-241.
Mendola M., 2008. Migration and technological change in rural households: Complements or substitutes? J. Dev. Econ., 85 (1-2), 150-175.
Mercandalli S., 2013. Le Rôle complexe des migrations dans les reconfigurations des systèmes d’activités des familles rurales : la circulation comme ressource ? Localité de Leonzoane, Mozambique 1900-2010, thèse de doctorat en sciences économiques, Paris-Sud-XI, 499 p.
Mercandalli S., Losch B., 2017. Rural Africa in Motion. Dynamics and Drivers of Migration South of the Sahara. FAO and CIRAD, Rome, 60 p.
Mercandalli S., Nshimbi C., 2016. Migration dynamics: contrasted patterns, diversity and potential. In: A New Emerging Rural World. An Overview of Rural Change in Africa (D. Pesche, B. Losch, J. Imbernon, eds.), Atlas for the NEPAD Rural Futures programme, Second edition, Revised and Enlarged. CIRAD and NEPAD Agency, Montpellier, 76 p.
Merlet M., 2010. Rights to land and natural resources. ’Land Tenure and Development’ Technical Committee, briefing note, December 2010.
Mermet L., 2005. Un cadre théorique ouvert pour l’extension des recherches prospectives. In : Etudier les écologies futures- un chantier ouvert pour les recherches prospectives environnementales (L. Mermet, eds), chapitre 2, Peter Lang, 69-114.
Mermet L., 2009. Extending the perimeter of reflexive debate on futures research: an open framework. Futures, 41 (2), 105-115.
Mewett J., Paplinska J., Kelley G., Lesslie R., Pritchard P., Atyeo C., 2013. Towards national reporting on agricultural land use change in Australia, ABARES technical report, Canberra, 27 p.
Meyfroidt P., Lambin E.F., Erb K-H., Hertel T., 2013. Globalization of land use: distant drivers of land change and geographic displacement of land use. Curr. Opin. Environ. Sustain., 5, 438-444.
Meynard J.M., Messéan A., Charlier A., Charrier F., Farès M., Le Bail M., Magrini M.B., 2013. Freins et leviers à la diversification des cultures. Etude au niveau des exploitations agricoles et des filières. Rapport d’étude, INRA, 226 p.
Miflin B., 2000. Crop improvement in the 21th century. J. Exp. Bot., 51, 1-8.
Miggiano L., Taylor M., Mauro A., 2010. Links between Land Tenure Security and Food Security. Contribution of the International Land Coalition to the Updating of the High Level Task Force’s (HLTF) Comprehensive Framework for Action (CFA). International Land Coalition, 35 p.
Miller R., 2007. Futures literacy: A hybrid strategic scenario method. Futures, 39 (4), 341-362.
Monfreda C., Ramankutty N., Foley J. A., 2008. Farming the planet: 2. Geographic distribution of crop areas, yields, physiological types, and net primary production in the year 2000. Global biogeochemical cycles, 22, GB1022.
Monteiro C.A., Cannon G., 2012. The impact of transnational “Big Food” companies on the South: a view from Brazil. PLoS Medecine, 9, e1001252.
Monteiro C.A., Conde W.L., Popkin B.M., 2007. Income-specific trends in obesity in Brazil: 1975-2003. Am. J. Public Health, 97, 1808-1812.
Monteiro C.A., Levy R.B., Claro R.M., Castro I.R.R., Cannon G., 2010. A new classification of foods based on the extent and purpose of food processing. Cadernos de Saúde Pública, 26 (11), 2039-2050.
367
References
Monteiro C.A., Moubarac J.C., Cannon G., Ng S.W., Popkin B., 2013. Ultra-processed products are becoming dominant in the global food system. Obesity Reviews, 14 (2), 21-28.
Montgomery M., 2008. The demography of the urban transition: what we know and don’t know. In: The new global frontier (G. Martine, G. McGranahan, M. Montgomery and R. Fernandez-Castilla, eds.), Earthscan, London, 17-36.
Moodie R., Stuckler D., Monteiro C., Sheron N., Neal B., Thaksaphon T., Lincoln P., Casswell S., 2013. Profit and pandemics: prevention of harmful effects of tobacco, alcohol and ultra-processed food and drink industries. Lancet, 381 (9867), 670-679 https://www.sciencedirect.com/science/article/pii/S0140673612620893 (accessed March 1st, 2018).
Mora O., Lançon F., Aubert F., de Lattre-Gasquet M., 2014. New urban-rural relationships to 2050: impacts on land use and food security, Report from the Agrimonde-Terra workshop, Paris, INRA/CIRAD, 63 p.
Moriconi-Ebrard F., 2014. Urbanisation dynamics, some learnings from e-Geopolis program. In: New urban-rural relationships to 2050: impacts on land use and food security. (Mora O., Lançon F., Aubert F. and de Lattre-Gasquet M., eds). Report of the Agrimonde Terra workshop, INRA/CIRAD, Paris.
Moriconi-Ebrard F., 2016. Megacities and archipelagos: an emerging urban framework. In: A New Emerging Rural World. An Overview of Rural Change in Africa (Pesche D., Losch B., Imbernon J. eds), Atlas for the NEPAD Rural Futures Programme. 2nd edition revised and enlarged. Montpellier, Cirad, NEPAD, 76 pages.
Moriconi-Ebrard F., Denis E., Harre-Roger D., Chatel C., Thiam O., Séjourné M., 2008. Africapolis (English version): Urbanization study in West Africa (1950-2020), https://halshs.archives-ouvertes.fr/halshs-00368181/document (accessed March 7th, 2018), 123 p.
Moriconi-Ebrard F., Denis E., Marius-Gnanou K., 2010. Repenser la géographie économique. Les arrangements du rapport de la Banque Mondiale avec les sciences géographiques urbaines. [“Reshaping Economic Geography”: The World Bank Report arrangements with urban geographical sciences]. Cybergeo: European Journal of Geography, http://cybergeo.revues.org/23144 (accessed March 7th, 2018).
Morris M., Kelly V.A., Kopicki R.J., Byerlee D., 2007. Fertilizer use in African Agriculture: lessons learned and good practices guideline. World Bank, 144 p.
Morton J.F., 2007. The impact of climate change on smallholder and subsistence agriculture. PNAS, 104, 19680-19685.
Mottet A., de Haan C., Falcucci A., Tempio G., Opio C., Gerber P., 2017. Livestock: On our plates or eating at our table? A new analysis of the feed/food debate. Global Food Security, 14, 1-8.
Moustier P., 2017. Short urban food chains in developing countries: signs of the past or of the future? Natures Sciences Sociétés, 25 (1), 7-20.
Moustier P., Fall A.S., 2004. Dynamiques de l’agriculture urbaine : caractérisation et évaluation. In: Développement durable de l’agriculture urbaine en Afrique francophone : enjeux, concepts et méthodes (Smith O.B., Moustier P., Mougeot L.A., Fall A., eds.), CIRAD/CRDI, 23-37.
Mueller N.D., Gerber J.S., Johnston M., Ray D.K., Ramankutty N., Foley J.A., 2012. Closing yield-gaps through nutrient and water management. Nature, 490, 254-257.
Mueller N.D., Lassaletta L., Runck B., Billen G., Garnier J., Gerber J.S., 2017. Declining spatial efficiency of global cropland nitrogen allocation. Global Biogeochem. Cycles, 31 (2), 245-257.
Müller C., Bondeau A., Popp A., Waha K., Fader M., 2010. Climate Change Impacts on Agricultural Yields: Background Note to the World Development Report 2010. Potsdam Institute for Climate Impact Research, Germany, 12 p.

368
LAND USE AND FOOD SECURITY IN 2050
Müller C., Robertson R.D., 2014. Projecting future crop productivity for global economic modeling. Agricultural Economics, 45, 37-50.
Nasi R., Taber A., Van Vliet N., 2011. Empty forests, empty stomachs? Bushmeat and livelihoods in Congo and Amazon Basins. International Forestry Review, 13 (3), 355-368.
Nelson G., See L., Waha K., Watson R.A., West P.C., Samberg L.H., van de Steeg J., Stephenson E., van Wijk M., Havlik P., 2017. Farming and the geography of nutrient production for human use: a transdisciplinary analysis. Lancet Planet Health, 1, e33-e42.
Nelson G.C., Rosegrant M.W., Palazzo A., Gray I., Ingersoll C., Robertson R., Tokgoz S., Zhu T., Sulser T.B., Ringler C., Msangi S., You L., 2010. Food Security, Farming, and Climate Change to 2050: Scenarios, Results, Policy Options. IFPRI, Washington, 140 p.
Nelson G.C., van der Mensbrugghe D., Ahammad H., Blanc E., Calvin, K., Hasegawa T., Havlik P., Heyhoe E., Kyle P., Lotze-Campen H., Von Lampe M., Mason d’Croz D. M., van Meijl H., Müller C., Reilly J., Robertson R., Sands R. D., Schmitz C., Tabeau A., Takahashi K., Valin H., Willenbockel D., 2014. Agriculture and climate change in global scenarios: why don’t the models agree? Agricultural Economics, 45, 85-101.
Nesheim I., Reidsma P., Bezlepkina I., Verburg R., Abdeladhim M.A., Bursztyn M., Chen L., Cissé Y., Feng S., Gicheru P., König H.J., Novira N., Purushothaman S., Rodrigues-Filho S., Sghaier M., 2014. Causal chains, policy tradeoffs and sustainability: Analysing land (mis)use in seven countries in the South. Land Use Policy, 37, 60-70.
Neubert S., Kömm M.., Krumsiek A., Schulte A., Tatge N., Zeppenfeld L., 2011. Agricultural Development in a Changing Climate in Zambia. Increasing resilience to climate change and economic shocks in crop production. German Development Institute and Deutsches Institut für Entwicklungspolitik (DIE), Bonn, 272 p.
Ng M., Fleming T., Robinson M. et al., 2014. Global, regional, and national prevalence of overweight and obesity in children and adults during 1980-2013: a systematic analysis for the Global Burden of Disease Study 2013. Lancet, 384, 766-781.
Nicholls A., Huybrechts B. 2017. Fair Trade and Co-operatives. In: The Handbook of Co-operative and Mutual Businesses (J. Michie, J. Blassi, C. Borzaga, eds), Oxford University Press, 470-479.
Nkonya E., Johnson T., Young Kwon H., Kato E., 2016. Economics of Land Degradation in Sub-Saharan Africa. In: Economics of Land Degradation and Improvement – A Global Assessment for Sustainable Development (E. Nkonya, A. Mirzabaev, J. von Braun, eds), chapter 9, Springer Link, 215-259.
Nolte K., Chamberlain W., Giger M., 2016. International Land Deals for Agriculture. Fresh insights from the Land Matrix: Analytical Report II. Bern, Montpellier, Hamburg, Pretoria: Centre for Development and Environment, University of Bern; Centre de coopération internationale en recherche agronomique pour le développement; German Institute of Global and Area Studies; University of Pretoria; Bern Open Publishing, 68 p.
Norman D., Atta-Krah K., 2016. Systems research for agricultural development. Past, present and future. In: Sustainable Intensification in Smallholder Agriculture. An integrated systems research approach (I. Öborn., B. Vanlauwe, M. Phillips, R. Thomas, W. Brooijmans, K. Atta-Krah, eds), Earthscan Food and Agriculture, Routledge, London, 19-42.
Nshimbi C.C., 2015. Networks of Cross-border Non-State Actors: The Role of Social Capital in Regional Integration. Journal of Borderlands Studies, 30 (4), 537-560.
Öborn I., Vanlauwe B., Phillips M., Thoas R., Brooijmans W., Atta-Krah K., 2017. Sustainable Intensification in Smallholder Agriculture. Earthscan Food and Agriculture, Routledge, London, 387 p.
Odegard I.Y.R, van der Voet E., 2014. The future of food: Scenarios and the effect on natural resource use in agriculture in 2050. Ecological Economics, 97, 51-59.
369
References
OECD, 2015. In It Together: Why Less Inequality Benefits All. Organisation for Economic Co-operation and Development, OECD Publishing, Paris, 332 p.
OECD, 2015. Statistiques de l’OCDE de la population active. OECD, Paris. https://data.oecd.org/fr/emp/population-active.htm (accessed on January, 2018).
OECD, 2016. Alternative Futures for Global Food and Agriculture. Organisation for Economic Co-operation and Development, OECD Publishing, Paris, 112 p.
OECD, 2017. Government at a glance 2017. Highlights. Organisation for Economic Co-operation and Development, Paris, 20 p.
OECD/FAO, 2016. OECD-FAO Agricultural Outlook 2016-2025. Special Focus: sub-Saharan Africa. OECD Publishing, Paris, 137 p.
Omran A.R., 2005. The epidemiologic transition: A theory of the epidemiology of population change. The Milbank Quarterly, 83, 731-757.
O’Neill B.C., Kriegler E., Ebi K.L., Kemp-Benedict E., Riahi K., Rothman D.S., van Ruijven B.J., van Vuuren D.P., Birkmann J., Kok K., Levy M., Solecki W., 2017. The roads ahead: Narratives for shared socioeconomic pathways describing world futures in the 21st century. Global Environ. Change, 42, 169-180.
O’Neill B.C., Kriegler E., Riahi K., Ebi K.L., Hallegatte S., Carter T.R., Mathur R., van Vuuren D.P., 2014. A new scenario framework for climate change research: the concept of shared socioeconomic pathways. Clim. Change, 122, 387-400.
Oniang’o R.K., Mutuku J.M., Malaba S.R., 2003. Contemporary African food habits and their nutritional and health implications. Asia Pacific J. Clin. Nutr., 12 (3), 231-236.
Ostrom E., 2011. Background on the institutional analysis and development framework. Policy Stud. J., 39 (1), 7-27.
Ostrom E., Burger J., Field C.B., Norgaard R.B., Policansky D., 1999. Revisiting the Commons: Local Lessons, Global Challenges. Science, 284 (5412), 278-282.
Ostwald M., Wibeck V., Stridbeck P., 2009. Proximate causes and underlying driving forces of land-use change among small-scale farmers – illustrations from the Loess Plateau, China. J. Land Use Sci., 4 (3), 157-171.
Ouedraogo S., Vall E., 2016. Sustainable Intensification of Mixed Farming Systems in Sub-humid Savannah of West Africa in Relation to Local Values Chains (maize, cattle, small ruminants, cotton...). PROIntensAFrica. In Depth Case Study Final Report. INERA-CIRAD, Bobo-Dioulasso, 57 p.
Ouma S., 2014. Situating global finance in the Land Rush Debate: A critical review. Geoforum, 57, 62-66.
Oya C., 2013. Methodological reflections on ’land grab’ databases and the ’land grab’ literature ’rush’. The Journal of Peasant Studies, 40 (3), 503-520.
Pace M.L., Gephart J., 2017. Trade: a driver of present and future ecosystems. Ecosystems, 20 (1), 44-53.
Paillard S., Treyer S., Dorin B., 2010. Agrimonde: Scenarios and Challenges for Feeding the World in 2050. Editions Quæ, Versailles, 240 p.
Pallagst K., Aber J., Audirac I., Cunningham-Sabot E., Fol S., Martinez-Fernandez C., Moraes S., Mulligan H., Vargas-Hernandez J., Wiechmann T., Wu T. (eds), 2009. The Future of Shrinking Cities: Problems, Patterns and Strategies of Urban Transformation in a Global Context. Center for Global Metropolitan Studies, Institute of Urban and Regional Development, and the Shrinking Cities International Research Network, Berkley, University of California, 168 p.
Pardey P., Chang-Kang, Dehmer S.P., Beddow, J.M., 2016. Agricultural R&D is on the move. Nature, 537 (15), 301-303.
370
LAND USE AND FOOD SECURITY IN 2050
Pardey P.G., Beddow J.M., Hurley T.M., Beatty T.K.M., Eidman V.R., 2014. A Bounds Analysis of World Food Futures: Global Agriculture Through to 2050. Australian Journal of Agricultural and Resource Economics, 58, 571-589.
Paxton A., 1994. The Food Miles Report. Sustainable Agriculture, Food & Environment (SAFE) Alliance, London, 60 p.
Pesche D., Diop A., 2016. Decentralisation in Africa: An opportunity for rural areas? In: A New Emerging Rural World. An Overview of Rural Change in Africa (D. Pesche, B. Losch, J. Imbernon, eds.), Atlas for the NEPAD Rural Futures programme, Second edition, Revised and Enlarged. Cirad and NEPAD Agency, Montpellier, 76 p.
Petit M., 2011. Pour une agriculture mondiale productive et durable. Éditions Quæ. Versailles, 120 p.
Piesse J., Thirtle C., 2010. Agricultural R&D, technology and productivity. Phil. Trans. R. Soc. B., 365, 3035-3047, http://rstb.royalsocietypublishing.org/content/365/1554 (accessed January 31st, 2018)
Piketty T., 2013. Le capital au XXIème siècle. Collection Les Livres du nouveau monde, Seuil, Paris, 976 p.
Pinedo-Vasquez M., Padoch C., 2009. Urban and rural and in-between: Multisited households, mobility and resource management in the Amazon floodplain. In: Mobility and Migration in Indigenous Amazonia (Alexiades M., dir.), Berghahn books, 86-96.
Pingali P., 2007. Westernization of Asian diets and the transformation of food systems: Implications for research and policy. Food Policy, 32, 281-98.
Pingali P., 2012. Green Revolution: Impacts, limits, and the path ahead. PNAS, 109 (31), 12302-12308.
Pinstrup-Andersen P., 2013. Nutrition-sensitive food systems: from rhetoric to action. Lancet, 382, 375-376.
Plaza S., Ratha D., 2011. Diaspora for development in Africa. The International Bank for Reconstruction and Development/The World Bank, 358 p.
Popkin B.M., Adair L.S., Ng S.W., 2012. Global nutrition transition and the pandemic of obesity in developing countries. Nutrition Reviews, 70, 3-21.
Popkin B.M., Slining M.M., 2013. New dynamics in global obesity facing low- and middle-income countries. Obesity Reviews., 14 (2), 11-20.
Popp A., Calvin K., Fujimori S., Havlik P., Humpenöder F., Stehfest E., Bodirsky B., Dietrich J.P., Doelmann J.C., Gusti M., Hasegawa T., Kyle P., Obersteiner M., Tabeau A., Takahashi K., Valin H., Waldhoff S., Weindl I., Wise M., Kriegler E., Lotze-Campen H., Fricko O., Riahi K., van Vuuren D.P., 2017. Land-use futures in the shared socio-economic pathways. Global Environmental Change, 42, 331-345.
Popp A., Lotze-Campen H., Bodirsky B., 2010. Food consumption, diet shifts and associated non-CO2 greenhouse gases from agricultural production. Global Environmental Change, 20 (3), 451-462.
Potts D., 2005. Counter-urbanization on the Zambian Copperbelt? Interpretations and Implications. Urban Studies, 42 (4), 583-609.
Potts D., 2009. The slowing of sub-Saharan Africa’s urbanization: evidence and implications for urban livelihoods. Environ. Urban., 21, 253-259.
Potts D., 2013. Rural-urban and urban-rural migration flows as indicators of economic opportunity in sub-Saharan Africa: What do the data tell us? Migrating out of Poverty RPC Working Paper 9, Migrating out of Poverty Consortium, University of Sussex, Brighton, 39 p.
Powell J.M., Pearson R.A., Hiernaux P.H., 2004. Crop-Livestock Interactions in the West African Drylands. Agron. J., 96, 469-483.
Preston D., Ngah I., 2012. Interpreting Rural Change in Malaysia. Singapore Journal of Tropical Geography, 33 (3), 351-364.

371
References
Pretty J.N., Noble A.D., Bossio D., Dixon J., Hine R.E., Penning de Vries F.W.T, Morison J.I.L., 2006. Resource-conserving agriculture increases yields in developing countries. Environ. Sci. Technol., 40 (4), 1114-1119.
Proctor F., Lucchesi V., 2012. Small-scale farming and youth in an era of rapid rural change. London, Hivos, 68 p.
Prunier D., 2013. De nouvelles ruralités en Amérique centrale ? Dynamiques de mobilité, ressources et organisations familiales, thèse de doctorat, géographie, Paris-Diderot - Paris VII, 467 p.
Quizon A.B., 2013. Land Governance in Asia: Understanding the debates on land tenure rights and land reforms in the Asian context. Framing the Debate Series No.3. International Land Coalition (ILC), Rome, 68 p.
Radel C., Schmook B., McCandless S., 2010. Environment, transnational labor migration, and gender: case studies from southern Yucatán, Mexico and Vermont, USA. Population and Environment, 32(2-3), 177-197.
Rae A., Nayga R., 2010. Trends in Consumption, Production and Trade in Livestock and Livestock products. In: Livestock in a Changing Landscape Vol. 1 Drivers, Consequences, and Responses. (H. Mooney, L. Neville, H. Steinfeld, F. Schneider Eds.), Island Press, 11-34.
Rajamani L., 2010. The making and unmaking of the Copenhagen Accord. International and Comparative Law Quarterly, 59 (3), 22-41.
Ramankutty N., Evan T.E., Monfreda C., Foley J.A., 2008. Farming the planet: 1. Geographic distribution of global agricultural land in the year 2000. Global biogeochemical cycles, 22, GB1003.
Ramankutty N., Foley J.A., Norman J., McSweeney K., 2002. The global distribution of cultivable lands: current patterns and sensitivity to possible climate change. Global Ecology and Biogeography, 11, 377-392.
Rastoin J.-L., Ghersi G., 2010. Le système alimentaire mondial. Concepts et méthodes, analyses et dynamiques. Éditions Quæ, 584 p.
Ray D.K., Foley J.A., 2013. Increasing global crop harvest frequency: recent trends and future directions. Environmental Research Letters, 8 (4), 44-41. http://iopscience.iop.org/article/10.1088/1748-9326/8/4/044041/pdf (accessed February 1st, 2018).
Ray D.K., Ramankutty N., Mueller N.D., West P.C., Foley J.A., 2012. Recent patterns of crop yield growth and stagnation. Nature Communications, 3, 1293.
Reale A., Handmer J., 2011. Land tenure, disasters and vulnerability. Disasters, 35 (1), 160–182.
Reardon T., Chen K., Minten B., Lourdes A., 2012. The quiet revolution in staple food value chains in Asia: enter the dragon, the elephant, and the tiger. Asian Development Bank and International Food Policy Research Institute, Philippines, 286 p.
Reardon T., Stamoulis K., Pingali P., 2007. Rural nonfarm employment in developing countries in an era of globalization. Agricultural Economics, 37 (1), 173-183.
Reardon T., Timmer C.P., 2014. Five inter-linked transformations in the Asian agrifood economy: Food security implications. Global Food Security, 3 (2), 108-117.
Reich R., 2008. Supercapitalism. The Transformation of Business, Democracy and Everyday life. Society and Business Review, 3 (3), 256-258.
Rhisiart M., Miller R., Brooks S., 2015. Learning to use the future: developing foresight capabilities through scenario processes. Technol. Forecast. Soc. Change, 101, 124-133.
Ricard D., 2007. Revival of quality food production: the case of white lentils in France and Italy. Journal of Mediterranean Geography, 109, 71-77.

372
LAND USE AND FOOD SECURITY IN 2050
Riesgo L., Louhichi K., Gomez y Paloma S., Hazell P., Ricker-Gilbert J., Wiggins S., Sahn D.E., Mishra A., 2016. Food and nutrition security and role of smallholder farms: challenges and opportunities. Workshop proceedings. JRC, 84 p.
Rigg J., 2006. Land, farming, livelihoods, and poverty: rethinking the links in the rural South. World Development, 34 (1), 180-202.
Rigg J., Salamanca A., 2014. Waving or drowning? The paradox of farming in Thailand. In: New urban-rural relationships to 2050: impacts on land use and food security (Mora O., Lançon F., Aubert F., de Lattre-Gasquet, M., eds). Report of the Agrimonde-Terra workshop, INRA/CIRAD, Paris.
Rigg J., Salamanca A., Parnwell M., 2012. Joining the dots of agrarian change in Asia: A 25 year view from Thailand. World Development, 40 (7), 1469-1481.
Rigg J., Salamanca A., Thompson E.C., 2016. The puzzle of East and Southeast Asia’s persistent smallholder. J. Rural Stud., 43, 118-133.
Rights and Resources Initiative, 2015. Who Owns the Land in Latin America? The Status of Indigenous and Community Land Rights in Latin America. Fact Sheet, November 2015, Washington, D.C., 8 p.
Ritchey T., 2011. Modeling alternative futures with general morphological analysis. World Future Review, 3 (1), 83-94.
Rittel H., Weber M., 1973. Dilemmas in a general theory of planning. Policy Sciences, 4, 155-169.
Rivera J.A., Barquera S., Gonzalez-Cossio T., Olaiz G., Sepulveda J., 2004. Nutrition transition in Mexico and other Latin American countries. Nutrition Reviews, 62, S149-57.
Robineau O., 2014. Bridging the rural, the urban and the intra-urban: example of a West African urban food system. In: New urban-rural relationships to 2050: impacts on land use and food security (Mora O., Lançon F., Aubert F. and de Lattre-Gasquet M., eds.). Report of the Agrimonde-Terra workshop, INRA/CIRAD, Paris.
Robineau O., 2015. Toward a systemic analysis of city-agriculture interactions in West Africa: A geography of arrangements between actors. Land Use Policy, 49, 322-331.
Rockström J., Steffen W., Noone K., Persson Å., Chapin III F.S., Lambin E., Lenton T.M., Scheffer M., Folke C., Schellnhuber H., Nykvist B., De Wit C.A., Hughes T., van der Leeuw S., Rodhe H., Sörlin S., Snyder P. K., Costanza R., Svedin U., Falkenmark M., Karlberg L., Corell R.W., Fabry V.J., Hansen J., Walker B., Liverman D., Richardson K., Crutzen P., Foley J., 2009. Planetary boundaries: exploring the safe operating space for humanity. Ecol. Soc., 14 (2), 32. http://www.ecologyandsociety.org/vol14/iss2/art32/ (accessed February 1st, 2018).
Roesel K., Grace D., 2015. Food Safety and Informal Markets: Animal Products in Sub-Saharan Africa. London, Routledge, 288 p.
Roose E., Zougmore R., Stroosnijder L., Dugué P., Bouzou-Moussa I., 2017. Techniques traditionnelles de restauration de la productivité des sols dégradés en régions semi-arides d’Afrique occidentale. In: Restauration de la productivité des sols tropicaux et méditerranéens : contribution à l’agroécologie (E. Roose, ed.). IRD Éditions, Marseille, 491-517.
Roudart L., 2010. Terres cultivables et terres cultivées : apports de l’analyse croisée de trois bases de données à l’échelle mondiale. Notes et Etudes Socio-Economiques, 34, 57-95.
Roudier P., Sultan B., Quirion, P., Berg A., 2011. The impact of future climate change on West African crop yields: What does the recent literature say? Global Environmental Change, 21 (3), 1073-1083.
Rudel T.K., 2013. The national determinants of deforestation in sub-Saharan Africa. Philos. Trans. R Soc. Lond. B Biol. Sci., 368, 20120405; DOI: 10.1098/rstb.2012.0405.

373
References
Rudel T.K., Schneider L., Uriarte M., Turner B.L., DeFries R., Lawrence D., Geoghegan J., Hecht S., Ickowitz A., Lambin E., Birkenholtz T., Baptista S., Grau R., 2009. Agricultural intensification and changes in cultivated areas, 1970–2005. PNAS, 106 (49), 20675-20680, http://www.pnas.org/content/106/49/20675.full.pdf (accessed February 1st, 2018).
Rudel T.K., Hernandez M., 2017. Land Tenure Transitions In The Global South: Trends, Drivers, and Policy Implications. Annu. Rev. Environ. Resour., 42 (1), 1-1.19, http://www.annualreviews.org/toc/energy/42/1 (accessed February 1st, 2018).
Rueda X., Lambin E.-F., 2013. Linking globalization to local land uses: How eco-consumers and gourmands are changing the Colombian coffee landscapes. World Development, 41, 286-301.
Rulli M.C., Savioria A., D’Odorico P., 2013. Global land and water grabbing. PNAS, 110 (3), 891-897, http://www.pnas.org/content/pnas/110/3/892.full.pdf (accessed February 1st, 2018).
Sachs J., 2012. From Millennium Development Goals to Sustainable Development Goals. Lancet, 379, 2206-2211.
Samberg L.S., Gerber J.S., Ramankutty N., Herrero M., West P.C., 2016. Subnational distribution of average farm size and smallholder contributions to global food production. Environmental Research Letters, 11, 124010.
Satterthwaite D., Tacoli C., 2003. The urban part of rural development: the role of small and intermediate urban centres in rural and regional development and poverty reduction. Rural-urban Working Papers Series, 9, International Institute for Environment and Development, London, 64 p.
Satterthwaite D., McGranahan G., Tacoli C., 2010. Urbanization and its implications for food and farming Philos. Trans. R Soc. Lond. B Biol. Sci., 365 (1554), 2809-2820.
Schaffnit-Chatterjee C., 2014. Agricultural value chains in Sub-Saharan Africa. From a development challenge to a business opportunity. Deutsche Bank Research, Frankfurt, 28 p.
Scherr S., 1999. Soil Degradation: A Threat to Developing-Country Food Security by 2010. Food, Agriculture and the Environment Discussion Paper 63, International Food Policy Research Institute, Washington, D.C., 71 p.
Schlenker W., Lobell D.B., 2010. Robust negative impacts of climate change on African agriculture. Environmental Research Letters, 5 (1).
Schmitz C., van Meijl H.,Kyle P., Nelson G.C., Fujimori S., Gurgel A., Havlik P., Heyhoe E., Mason d’Croz D., Popp A., Sands R., Tabeau A., van den Mensbrugghe D., Von Lampe M., Wise M., Blanc E., Hasegawa T., Kavallari A., Valin H., 2014. Land-use change trajectories up to 2050: insights from a global agro-economic model comparison. Agricultural Economics, 45, 69-84.
Schmook B., Radel C., 2008. International Labor Migration from a Tropical Development Frontier: Globalizing Households and an Incipient Forest Transition. Human Ecology, 36 (6), 891-908.
Schwartz P., 1991. The Art of the Long View: Planning for the Future in an Uncertain World, Currency Doubleday, New York, 272 p.
Schwoob M.H., 2012. Sécurité alimentaire en Chine : quels arbitrages ? Quels acteurs ? Working paper 22, IDDRI, Paris (France), 26 p.
Sebastian K., 2014. Atlas of African Agriculture Research & Development: Revealing Agriculture’s Place in Africa, International Food Policy Research Institute.
Sebillotte M., 1974. Agronomie et agriculture. Essai d’analyse des taches de I’agronome. Cah. ORSTOM. sér. Biol., 24, 3-25.
Sebillotte M., 1990. Système de culture, un concept opératoire pour les agronomes. In: Les systèmes de culture (L. Combe, D. Picard, eds). Inra, Versailles, 165-196.

374
LAND USE AND FOOD SECURITY IN 2050
Serdeczny O., Adams S., Baarsch F., Coumou D., Robinson A., Hare B., Schaeffer M., Perrette M., Reinhard J., 2016. Climate change impacts in Sub-Saharan Africa: from physical changes to their social repercussions. Regional Environmental Change, 17 (6), 1585-1600.
Seto K.C., Güneralp B., Hutyra L.R., 2012. Global forecasts of urban expansion to 2030 and direct impacts on biodiversity and carbon pools. PNAS, 109, 7687-92.
Seufert V., Ramankutty N., Foley J.A., 2012. Comparing the yields of organic and conventional agriculture. Nature, 485 (7397), 229-232.
Severino J.M., Ray O., 2009. The End of ODA: Death and Rebirth of a Global Public Policy. Center for Global Development, Working paper 167, 32 p.
Shantiko B., 2014. Urban and rural trends in Indonesia (Java, Sumatra). In: New urban-rural relationships to 2050: impacts on land use and food security (Mora O., Lançon F., Aubert F. and de Lattre-Gasquet M., eds). Report of the Agrimonde Terra workshop, INRA/CIRAD, Paris.
Sheahan M., Barrett C.B., 2017. Ten striking facts about agricultural input use in Sub-Saharan Africa. Food Policy, 67, 12-25.
Sheahan M., Barrett C.B., Goldvale C., 2017. Human health and pesticide use in Sub-Saharan Africa. Agricultural Economics, 48, 27-41.
Shen X., Mab L.J.C., 2005. Privatization of rural industry and de facto urbanization from below in southern Jiangsu, China. Geoforum, 36 (6), 761-777.
Siebert S., Frenken K., 2014. Irrigated Areas. In: Atlas of African agriculture research and development: Revealing agriculture’s place in Africa (K. Sebastian, ed.). International Food Policy Research Institute (IFPRI), Washington, D.C.
Simon D., McGregor D., Nsiah-Gyabaah K., 2004. The changing urban-rural interface of African cities: definitional issues and an application to Kumasi, Ghana. Environ. Urban., 16 (2), 235-248.
Sims B., Hilmi M., Kienzle J., 2016. Agricultural mechanization. A key input for sub-Saharan African smallholders. Integrated Crop Management, 23, Food and Agriculture Organization, Rome, 55 p.
Sinclair T.R., Rufty T.W., 2012. Nitrogen and water resources commonly limit crop yield increases, not necessarily plant genetics. Global Food Security, 1, 94-98.
Sitko N.J., Jayne T.S., 2014. Structural transformation or elite land capture? The growth of “emergent” farmers in Zambia. Food Policy, 48, 194-202.
Smalley B., 2013. Plantations, Contract Farming and Commercial Farming Areas in Africa: A Comparative Review. Land and Agricultural Commercialization in Africa project, LACA Working Paper 055, 73 p.
Smeets E.M.W., Faaij A.P.C., Lewandowski I.M., Turkenburg W.C., 2007. A bottom-up assessment and review of global bio-energy potentials to 2015. Prog. Energy Combust. Sci., 33 (1), 36-106.
Smith I.F., 2013. Sustained and integrated promotion of local, traditional food systems for nutrition security. In: Diversifying Food and Diets: Using Agricultural Biodiversity to Improve Nutrition and Health (Fanzo J., Hunter D., Borelli T., Mattei F., eds), Earthscan, London, 122-39.
Smith L., Haddad L., 2015. Reducing Child Undernutrition: Past Drivers and Priorities for the Post-MDG Era. World Development, 68, 180-204.
Smith P., Martino D. , Cai Z., Gwary D., Janzen H., Kumar P., McCarl B., Ogle S., O’Mara F., Rice C., Scholes B., Sirotenko O., 2007. Agriculture. In Climate Change 2007: Mitigation of Climate Change. Contribution of Working Group III to the Fourth Assessment Report of the Intergovernmental Panel on Climate Change (B. Metz, O.R. Davidson, P.R. Bosch, R. Dave, L.A. Meyer, eds), Cambridge University Press.
Smith P., Ashmore M., Black H., Burgess P., Evans C., Quine T., Thomson A., Hicks K., Orr H., 2012. The role of ecosystems in regulating climate, and soil, water and air quality. J. Appl. Ecol., 50, 812-829.
375
References
Sonnino R., 2009. Feeding the city: towards a new research and planning agenda. International Planning Studies, 14, 425-435.
Staatz J., Hollinger F., 2016. West African Food Systems and Changing Consumer Demands. West African Paper 04, OECD Publishing, Paris, 26 p.
Steel G., van Lindert P., 2017. Rural livelihood transformations and local development in Cameroon, Ghana and Tanzania. IIED Working Paper, London, 40 p.
Steffen W., Richardson K., Rockström J., Cornell S.F., Fetzer I., Bennett E.M., Biggs R., Carpenter S.R., de Vries W., de Wit C.A., Folke C., Gerten D., Heinke J., Mace G.M., Persson L.M., Ramanathan V., Reyers B., Sörlin S., 2015. Planetary boundaries: Guiding human development on a changing planet. Science, 347 (6223).
Stern D., Piernas C., Barquera S., Rivera J.A., Popkin B.M., 2014. Caloric beverages were major sources of energy among children and adults in Mexico, 1999-2012. J. Nutr., 144, 949-956.
Stern N., 2006. The Economics of Climate Change. A report to the Government of the United Kingdom. [The Stern Report]. Cambridge University Press, 576 p.
Stevenson J.R., Villoria N., Byerlee D., Kelley T., Maredia M., 2013. Green Revolution research saved an estimated 18 to 27 million hectares from being brought into agricultural production. PNAS, 110 (21), 8363-8368.
Stomph T.J., Fresco L.O., Van Keulen H., 1994. Land Use Systems Evaluation: Concepts and Methodology. Agricultural Systems, 44, 243-245.
Strassburg B., 2012. Increasing agricultural output while avoiding deforestation: a case study for Mato Grosso. Rio de Janeiro, Brazil: International Institute for Sustainability, 43 p.
Sud N., 2014. Governing India’s Land. World Development, 60, 43-56.
Sultan B., Roudier P., Quirion A., Alhassane B., Muller M., Dingkuhn P., Ciais M., Guimberteau S., Traore S.B., Baron C., 2013. Assessing climate change impacts on sorghum and millet yields in the Sudanian and Sahelian savannas of West Africa. Environmental Research Letters, 8 (1).
Swinburn B., Kraak V., Rutter H., Vandevijvere S., Lobstein T., Sacks G., Gomes F., Marsh T., Magnusson R., 2015. Strengthening of accountability systems to create healthy food environments and reduce global obesity. Lancet, 385 (9986), 2534-2545.
Swinburn B., Sacks G., Hall K.D., McPherson K., Finegood D.T., Moodie M.L., Gortmaker S.L., 2011. The global obesity pandemic: shaped by global drivers and local environments. Lancet, 378, 804-814.
Tacoli C., 1998. Bridging the divide: Rural-Urban interactions and livelihood strategies. Gatekeeper series, 77, International Institute for Environment and Development, London, 16 p.
Tacoli C., 2002. Changing rural-urban interactions in sub-Saharan Africa and their impact on livelihoods: a summary. Working Paper Series on Rural-Urban Interactions and Livelihood Strategies, 7, International Institute for Environment and Development, London, 37 p.
Tacoli C., 2003. The links between urban and rural development. Environment and Urbanization, 15 (3), 3-12.
Takeda S., Matsuoka M., 2008. Genetic approaches to crop improvement: responding to environmental and population changes. Nature genetics, 9, 444-457.
Temple L., Minkoua Nzie J.R., Marquis S., Dury S., 2008. Impact de l’urbanisation sur l’intensification des systèmes de production horticoles au Cameroun. In: Agricultures et développement urbain en Afrique Subsaharienne : environnement et enjeux sanitaires, (L. Parrot, ed.), L’Harmathan, Paris, 110-127.
The Montpellier Panel, 2013. Sustainable Intensification: A New Paradigm for African Agriculture, London, 40 p.

376
LAND USE AND FOOD SECURITY IN 2050
Thérond O., Duru M., Roger-Estrade J.J., Richard G., 2017. A new analytical framework of farming system and agriculture model diversities: a review. Agronomy for Sustainable Development, 37, 21. https://doi.org/10.1007/s13593-017-0429-7.
Thornton P.K., 2010. Livestock production: recent trends, future prospects. Philos. Trans. R Soc. Lond. B Biol. Sci., 365 (1554), 2853-2867.
Thornton P.K., Kruska R.L., Henninger N., Kristjanson P.M., Reid R.S., Atieno F., Ndegwa T., 2002. Mapping poverty and livestock in the developing world. ILRI, Nairobi, 124 p.
Thornton P.K., Notenbaert A., van de Steeg J., Herrero, M., 2008. The livestock-climate-poverty nexus: A discus sion paper on ILRI research in relation to climate change. ILRI, Nairobi, Kenya, 80 p. http://hdl.handle.net/10568/302 (accessed May 28th, 2018).
Thornton P.K., van de Steeg J., Notenbaert A., Herrero M.K., 2009. Impact of Climate Change on Livestock and Livestock Systems in Developing Countries: A Review of what we know and what we need to know. Agricultural Systems, 101, 113-127.
Thornton P.K., Ericksen P.J., Herrero M., Challinor A.J., 2014. Climate variability and vulnerability to climate change: a review. Global Change Biology, 20 (11), 3313-3328.
Tibi A., Thérond O., 2017. Evaluation des services écosystémiques rendus par les écosystèmes agricoles : une contribution au programme EFESE. Synthèse issue du rapport scientifique de l’étude menée par l’Inra de novembre 2014 à mars 2017, 118 p.
Timmer C.P., 2009. A world without agriculture. The structural transformation in historical perspective. The AEI Press, 84 p.
Toccaceli D., 2014. Tuscany case study. In: New urban-rural relationships to 2050: impacts on land use and food security (Mora O., Lançon F., Aubert F., de Lattre-Gasquet M., eds). Report of the Agrimonde-Terra workshop, INRA/CIRAD, Paris.
Toillier A., de Lapeyre de Bellaire L., 2017. Agri-Chains and Partnership Approaches to Research. In: Sustainable Development and Tropical Agri-chains (E. Bienabé, A. Rival, D. Loeillet, eds.), Springer, 107-124.
Torero M., 2014. Information and communication technologies: Farmers, markets, and the power of connectivity. In 2013 Global food policy report (Marble A. and Fritschel H., eds.). Chapter 6, 63-74. Washington, D.C.: International Food Policy Research Institute (IFPRI).
Toulmin C., 2009. Securing land and property rights in sub-Saharan Africa: the role of local institutions. Land Use Policy, 26 (1), 10-19.
Tourrand J.F., Veiga J.B., Poccard-Chapuis R., Hostiou N., Ferreira L.A., Rosario Ludovino R.M., Piketty M.G., 2004. The effects of cattle ranching on land use of family holdings in the Eastern-Amazon region of Brazil. In: Beyond tropical deforestation: from tropical deforestation to forest cover dynamics and forest development (D. Babin, ed.). Cirad, Montpellier, 205-219.
Triomphe B., Floquet A., Letty B., Kamau G., Almekinders C., Waters-Bayer A., 2017. How can external interventions build on local innovations? Lessons from an assessment of innovation experiences in African smallholder agriculture. In: Sustainable Intensification in Smallholder Agriculture. An integrated systems research approach (I. Öborn., B. Vanlauwe, M. Phillips, R. Thomas, W. Brooijmans, K. Atta-Krah, eds), Earthscan Food and Agriculture, Routledge, London, 334-349.
Tschirley D.L., Ayieko M.W., Hichaambwa M., Goeb J., Loescher W.H., 2010. Modernizing Africa’s fresh produce supply chains without rapid supermarket takeover: towards a definition of research and investment priorities. Department of Agricultural, Food, and Resource Economics, Department of Economics, Michigan State University East Lansing, 29 p.
Tseng M., 2005. Conceptualizing dietary Westernization, observing dietary transitions. Public Health Nutrition, 8, 545-546.

377
References
Turnpenny J., Lorenzoni I., Jones M., 2009. Noisy and definitely not normal: Responding to wicked issues in the environment, energy and health. Environmental Science and Policy, 12 (3), 347-358.
UNCTAD, 2013. Economic Development in Africa. Intra-African trade: Unlocking private sector dynamism. Trade and Development Board, sixtieth session, Geneva, 16-27 September 2013, item 6 of the provisional agenda.
UNCTAD, 2015a. Commodities and Development Report 201. Smallholder Farmers and Sustainable Commodity Development. United Nations Conference on Trade and Development, Geneva, 88 p.
UNCTAD, 2015b. Key Statistics and Trends in International Trade 2015. United Nations Conference on Trade and Development, Geneva, 30 p.
UNCTAD, 2017. World investment report. Investment and the digital economy. United Nations Conference on Trade and Development, Geneva, 252 p.
UN-DESA, 2015. Income convergence or persistent inequalities among countries? Development Issues 5, United Nations, Department of Economic and Social Affairs, New York, 2 p.
UN-DESA, 2017. International Migration Report 2017. United Nations, Department of Economic and Social Affairs, Population Division, New York, 38 p.
UNDP, 2016. Human Development Report 2016. Global Development for Everyone One. United Nations Development Programme, New York, 286 p.
UNECA, 2011. Minerals and Africa’s Development: International Study Group Report on Africa’s Mineral Regimes. United Nations Economic Commission for Africa, Addis Ababa, 230 p.
UNECA, 2017. 2017 Africa Sustainable Development Report. Tracking Progress on Agenda 2063 and the Sustainable Development Goals. United Nations Economic Commission for Africa.
UNEP, 2013. Global Chemicals Outlook. Towards sound management of chemicals. United Nations Environment Programme, Geneva, 245 p.
UNEP, 2014. Assessing Global Land Use: Balancing Consumption with Sustainable Supply. A Report of the Working Group on Land and Soils of the International Resource Panel (S. Bringezu, H. Schütz, W. Pengue, M. O’Brien, F. Garcia, R. Sims, Howarth R., L. Kauppi, M. Swilling, J. Herrick, eds.), United Nations Environment Programme, Nairobi, 132 p.
UNEP/UNECE, 2016. Global Environmental Outlook. GEO-6 Assessment for the pan-European region. United Nations Environment Programme, Nairobi, 376 p.
UNEP-africa, 2016. Global Environmental Outlook. GEO-6 Regional Assessment for Africa. United Nations Environnent Programme, Nairobi, 215 p.
UNEP-asia, 2016. Global Environmental Outlook. GEO-6 Regional Assessment for Asia and the Pacific. United Nations Environment Programme, Nairobi, 226 p.
UNEP-lac, 2016. Global Environmental Outlook. GEO-6 Regional Assessment for Latin America and the Caribbean. United Nations Environment Programme, Nairobi, 264 p.
UNFCCC, 1992. United Nations Framework Convention on Climate Change. New York, United Nations, 25 p. http://unfccc.int/resource/docs/convkp/conveng.pdf (accessed may 18th, 2016).
UNFCCC, 2016. Aggregate effect of the intended nationally determined contributions: an update. Synthesis report by the Secretariat, 75 p.
UNIDO, 2013. Industrial Development Report 2013. Sustaining Employment Growth: The Role of Manufacturing and Structural Change. United Nations Industrial Development Organization, Vienna, 265 p.
United Nations (UN), 2012. The State of the World’s Cities Report 2012/2013: Prosperity of Cities. Nairobi, United Nations Human Settlements Programme.

378
LAND USE AND FOOD SECURITY IN 2050
United Nations (UN), 2015. World Urbanization Prospects: The 2014 Revision. (ST/ESA/SER.A/366), 517 p., https://esa.un.org/unpd/wup/publications/files/wup2014-report.pdf (accessed May 29th, 2018).
United Nations Human Settlements Programme (UN-HABITAT), 2008. The state of African cities: A framework for addressing urban challenges in Africa. Nairobi: United Nations Human Settlements Programme, 206 p.
United Nations Interagency Framework Team for Preventive Action, 2012. Toolkit and guidance for preventing and managing land and natural resources conflict. New York, 51 p.
United Nations System Standing Committee on Nutrition (UNSCN), 2010. Progress in Nutrition. 6th Report on the World Nutrition Situation, Geneva, 131 p.
United Nations, Department of Economic and Social Affairs, Population Division, 2014. World urbanization prospects: The 2014 revision, highlights (ST/ESA/SER.A/352). United Nations Organization, 27 p.
Uusitalo U., Sobal J., Moothoosamy L., Chitson P., Shaw J., Zimmet P., Tuomilehto J., 2005. Dietary Westernisation: conceptualisation and measurement in Mauritius. Public Health Nutrition, 8, 608-619.
Vaast P., Harmand J.M., Rapidel B., Jagoret P., Deheuvels O., 2016. Coffee and Cocoa Production in Agroforestry - A Climate-Smart Agricultural Model. In: Climate Change and Agriculture Worldwide (Torquebiau E., ed.), Springer, 373 p.
van der Eng P., 2004. Productivity and Comparative Advantage in Rice Agriculture in South-East Asia Since 1870. Asian Economic Journal, 18 (4), 345-370.
van der Ploeg J.D., 2014. Peasant-driven agricultural growth and food sovereignty. The Journal of Peasant Studies 41 (6), 999-1030.
van der Ploeg J.D., Laurent C., Blondeau F., Bonnafous P., 2009. Farm diversity, classification schemes and multifunctionality. J. Environ. Manage., 90, 124-131.
van Dooren C., Marinussen M., Blonk H., Aiking H., Vellinga P., 2014. Exploring dietary guidelines based on ecological and nutritional values: A comparison of six dietary patterns. Food Policy, 44, 36-46.
Van Ittersum M.K., van Bussel L., Wolf J, Grassini P., van Wart J., Guipart N., Claessen L., de Groot H. Wiebe K., Mason-D’Croze D., Yang H., Boogaard H., van Oort P., van Loon P., Saito K., Adimo O., Adjei-Nshahi S., Agali A., Balak A., Chikowol R., Kaizzi K., Kouressy M. Makoi J., Ouattara K., Tesfaye K., Cassman K., 2016. Can sub-Saharan Africa feed itself? PNAS, 113 (52), 4964-14969, http://www.pnas.org/content/early/2016/12/07/1610359113.full (accessed February 1st, 2018).
van Vuuren D. P., Batlle Bayer L., Chuwah C., Ganzeveld L., Hazeleger W., van den Hurk B., van Noije T., O’Neill B., Strengers B. J., 2012. A comprehensive view on climate change: coupling of earth system and integrated assessment models. Environmental Research Letters, 7 (2), 024012.
Van Vuuren D., Ochola W., Riha S., 2009. Outlook on Agricultural Change and Its Drivers. In: International Assessment of Agricultural Knowledge, Science and Technology for Development. Global Report (B. Mc Intyre, H. Herren, J. Wakhungu, R. Watson, eds.), Island Press, 255-305.
Vandevijvere S., 2014. Why a global convention to protect and promote healthy diets is timely. Public Health Nutrition, 17, 2387-2388.
Vanier M. (dir.), 2009. Territoires, territorialité, territorialisation, Controverses et perspectives, Rennes, PUR, coll. « Espace et territoires », 228 p.
Vassas Toral A., 2011. Ruralité et agriculture au prisme des mobilités spatiales. L’Altiplano Sud de la Bolivie à l’heure du boom de la quinoa, thèse de doctorat, Géographie et Aménagement de l’Espace, Université de Montpellier 3, IRD, 345 p.
Vatn A., 2002. Multifunctional agriculture: some consequences for international trade regimes. European Review of Agricultural Economics, 29 (3), 309-327.

379
References
Verburg P., Soepboer W., Veldkamp A., Limpiada R., Espaldon V., Mastura S., 2002. Modeling the Spatial Dynamics of Regional Land Use: The CLUE-S Model. Environmental Management, 30, 391-405.
Via Campesina, 2010. Peasant and Family Farm based Sustainable Agriculture Can Feed the world. Via Campesina Views, paper 6. Jakarta, Indonesia, 15 p.
Von Lampe M., Willenbockel D., Ahammad H., Blanc E., Cai Y., Calvin K., Fijimori S., Hasegawa T., Havlik P., Heyhoe E., Kyle P., Lotze-Campen H., Mason d’Croz D., Nelson G.C., Sands R.D., Schmitz C., Tabeau A., Valin H., van der Mensbrugghe D., van Meijl H., 2014. Why do global long-term scenarios for agriculture differ? An overview of the AgMIP global economic model intercomparison. Agricultural Economics, 45, 1-18.
Vorster H.H., Kruger A., Margetts B.M., 2011. The nutrition transition in Africa: can it be steered into a more positive direction? Nutrients, 3, 429-441.
Vranken L., Avermaete T., Petalios D., Mathijs E., 2014. Curbing global meat consumption: Emerging evidence of a second nutrition transition. Environmental Science and Policy, 39, 95-106.
Walker B., Holling C.S., Carpenter S.R., Kinzig A., 2004. Resilience, adaptability and transformability in social-ecological systems. Ecol. Soc., 9 (2), 5.
Wang M.Y.L., 1997. The Disappearing Rural-urban Boundary: Rural Socio-economic Transformation in the Shenyang-Dalian Region of China. Third World Planning Review, 19 (3), 229-250.
Warren Raffa D., Bogdanski A., Tittonell P., 2015. How does crop residue removal affect soil organic carbon and yield? A hierarchical analysis of management and environmental factors. Biomass and Bioenergy, 81, 345-55.
WEF, 2015. Africa Competitiveness Report 2015. World Economic Forum, Geneva, 179 p.
WEF, 2018. The Global Risks Report 2018. 13th edition. World Economic Forum, Geneva, 80 p.
Weinzettel J., Hertwich E.G., Peters G.P., Steen-Olsen K., Galli A., 2013. Affluence drives the global displacement of land use. Global Environmental Change, 23, 433-438.
WHO, 2010. Exposure to Highly Hazardous Pesticides: A Major Public Health Concern. World Health Organization, Geneva, 6 p.
Wiggins S., Keats S., 2013. Smallholder agriculture’s contribution to better nutrition. Report commissioned by the Hunger Alliance. England: Overseas Development Institute, 95 p.
Williams P., 2011. War and conflict in Africa. Polity Press, Cambridge, U.K., 320 p.
Winrock International, 1992. Assessment of animal agriculture in Sub-Saharan Africa. Winrock Int. Inst. for Agric. Dev., Morrilton, AK.
Wirsenius S., Azar C., Berndes G., 2010. How much land is needed for global food production under scenarios of dietary changes and livestock productivity increases in 2030? Agricultural Systems, 103 (9), 621-638.
Woodhouse P., 2010. Beyond Industrial Agriculture? Some Questions about Farm Size, Productivity and Sustainability. Journal of Agrarian Change, 10 (3), 437-453.
World Bank, 2003. Reaching the rural poor: a renewed strategy for rural development, The World Bank, 208 p.
World Bank, 2007. World development document 2008: Agriculture for development, The World Bank, 395 p.
World Bank, 2010. Rising Global Interest in Farmland: Can It Yield Sustainable and Equitable Benefits? September 7, 2010, The World Bank, 214 p.
World Bank, 2016. Africa’s pulse. An analysis of issues shaping Africa’s economic future. World Bank Group, 96 p.

World Energy Council (WEC), 2013. World Energy Scenarios: Composing Energy Futures to 2050, London, 280 p.
World Health Organization (WHO), 2014. Global Status Report on noncommunicable diseases 2014, Geneva, 280 p.
World Health Organization (WHO), 2016. Global Report on Diabetes. Geneva, 87 p.
World Health Organization/Food and Agriculture Organization, 2003. Diet, nutrition and the prevention of chronic diseases: report of a joint WHO/FAO expert consultation. WHO Technical Report Series 916. WHO, Geneva, 160 p.
Yaro J.A., 2006. Is deagrarianisation real? A study of livelihood activities in northern Ghana. Journal of Modern African Studies, 44 (1), 125-156.
Yu Y., Feng K., Hubacek K., 2013. Tele-connecting local consumption to global land use. Global Environmental Change, 23, 1178-1186.
Zabel F., Putzenlechner B., Mauser W., 2014. Global agricultural land resources - A high resolution suitability evaluation and its perspectives until 2100 under climate change conditions. PLoS ONE, 9 (9), e107522.
Zandstra H.G., Price E.C., Litsinger J.A., Morris R.A., 1981. A methodology for on-farm cropping systems research. International Rice Research Institute, 149 p.
Zhai F.Y., Du S.F, Wang Z.H., Zhang J.G., Du W.W., Popkin B.M., 2014. Dynamics of the Chinese diet and the role of urbanicity, 1991-2011. Obesity Reviews, 15 (1), 16-26.
Zhu Y., Qi X., Shao H., He K., 2009. The evolution of China’s in situ urbanization and its planning and environmental implications: Case studies from Quanzhou municipality. In: Urban Population-Environment Dynamics in the Developing World: Case Studies and Lessons Learned (De Sherbiniin A., Rahman A., Barbieri A., Fotso J.C., Zhu Y., eds), Committee for International Cooperation in National Research in Demography, Paris, 213-245.
Zurek M., Henrichs T., 2007. Linking scenarios across geographical scales in international environmental assessments. Technological Forecasting and Social Change, 74 (8), 1282-1295.
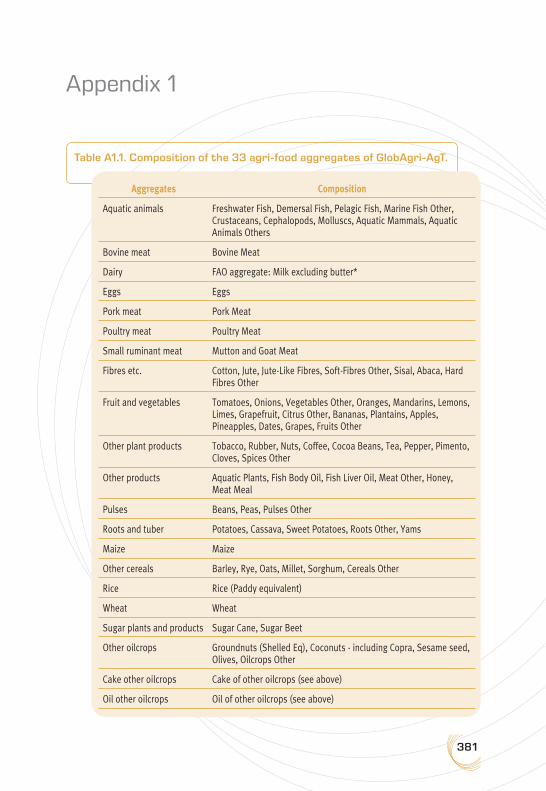
381
Appendix 1
Table A1.1. Composition of the 33 agri-food aggregates of GlobAgri-AgT.
Aggregates Composition
Aquatic animals Freshwater Fish, Demersal Fish, Pelagic Fish, Marine Fish Other, Crustaceans, Cephalopods, Molluscs, Aquatic Mammals, Aquatic Animals Others
Bovine meat Bovine Meat
Dairy FAO aggregate: Milk excluding butter*
Eggs Eggs
Pork meat Pork Meat
Poultry meat Poultry Meat
Small ruminant meat Mutton and Goat Meat
Fibres etc. Cotton, Jute, Jute-Like Fibres, Soft-Fibres Other, Sisal, Abaca, Hard Fibres Other
Fruit and vegetables Tomatoes, Onions, Vegetables Other, Oranges, Mandarins, Lemons, Limes, Grapefruit, Citrus Other, Bananas, Plantains, Apples, Pineapples, Dates, Grapes, Fruits Other
Other plant products Tobacco, Rubber, Nuts, Coffee, Cocoa Beans, Tea, Pepper, Pimento, Cloves, Spices Other
Other products Aquatic Plants, Fish Body Oil, Fish Liver Oil, Meat Other, Honey, Meat Meal
Pulses Beans, Peas, Pulses Other
Roots and tuber Potatoes, Cassava, Sweet Potatoes, Roots Other, Yams
Maize Maize
Other cereals Barley, Rye, Oats, Millet, Sorghum, Cereals Other
Rice Rice (Paddy equivalent)
Wheat Wheat
Sugar plants and products Sugar Cane, Sugar Beet
Other oilcrops Groundnuts (Shelled Eq), Coconuts - including Copra, Sesame seed, Olives, Oilcrops Other
Cake other oilcrops Cake of other oilcrops (see above)
Oil other oilcrops Oil of other oilcrops (see above)
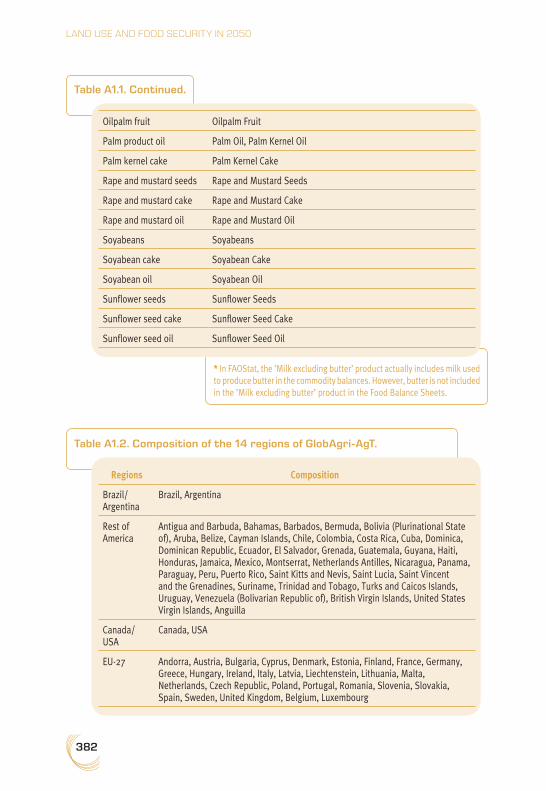
382
LAND USE AND FOOD SECURITY IN 2050
* In FAOStat, the ’Milk excluding butter’ product actually includes milk used to produce butter in the commodity balances. However, butter is not included in the ’Milk excluding butter’ product in the Food Balance Sheets.
Table A1.1. Continued.
Oilpalm fruit Oilpalm Fruit
Palm product oil Palm Oil, Palm Kernel Oil
Palm kernel cake Palm Kernel Cake
Rape and mustard seeds Rape and Mustard Seeds
Rape and mustard cake Rape and Mustard Cake
Rape and mustard oil Rape and Mustard Oil
Soyabeans Soyabeans
Soyabean cake Soyabean Cake
Soyabean oil Soyabean Oil
Sunflower seeds Sunflower Seeds
Sunflower seed cake Sunflower Seed Cake
Sunflower seed oil Sunflower Seed Oil
Table A1.2. Composition of the 14 regions of GlobAgri-AgT.
Regions Composition
Brazil/Argentina
Brazil, Argentina
Rest of America
Antigua and Barbuda, Bahamas, Barbados, Bermuda, Bolivia (Plurinational State of), Aruba, Belize, Cayman Islands, Chile, Colombia, Costa Rica, Cuba, Dominica, Dominican Republic, Ecuador, El Salvador, Grenada, Guatemala, Guyana, Haiti, Honduras, Jamaica, Mexico, Montserrat, Netherlands Antilles, Nicaragua, Panama, Paraguay, Peru, Puerto Rico, Saint Kitts and Nevis, Saint Lucia, Saint Vincent and the Grenadines, Suriname, Trinidad and Tobago, Turks and Caicos Islands, Uruguay, Venezuela (Bolivarian Republic of), British Virgin Islands, United States Virgin Islands, Anguilla
Canada/USA
Canada, USA
EU-27 Andorra, Austria, Bulgaria, Cyprus, Denmark, Estonia, Finland, France, Germany, Greece, Hungary, Ireland, Italy, Latvia, Liechtenstein, Lithuania, Malta, Netherlands, Czech Republic, Poland, Portugal, Romania, Slovenia, Slovakia, Spain, Sweden, United Kingdom, Belgium, Luxembourg
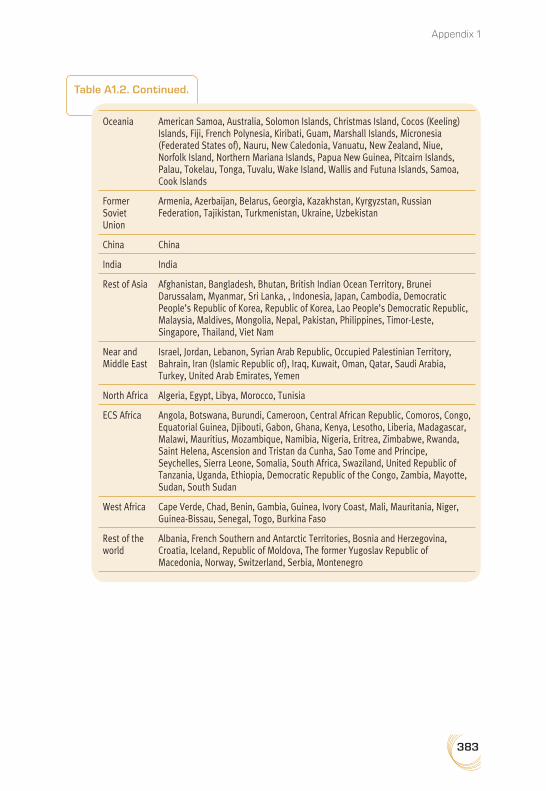
383
Appendix 1
Table A1.2. Continued.
Oceania American Samoa, Australia, Solomon Islands, Christmas Island, Cocos (Keeling) Islands, Fiji, French Polynesia, Kiribati, Guam, Marshall Islands, Micronesia (Federated States of), Nauru, New Caledonia, Vanuatu, New Zealand, Niue, Norfolk Island, Northern Mariana Islands, Papua New Guinea, Pitcairn Islands, Palau, Tokelau, Tonga, Tuvalu, Wake Island, Wallis and Futuna Islands, Samoa, Cook Islands
Former Soviet Union
Armenia, Azerbaijan, Belarus, Georgia, Kazakhstan, Kyrgyzstan, Russian Federation, Tajikistan, Turkmenistan, Ukraine, Uzbekistan
China China
India India
Rest of Asia Afghanistan, Bangladesh, Bhutan, British Indian Ocean Territory, Brunei Darussalam, Myanmar, Sri Lanka, , Indonesia, Japan, Cambodia, Democratic People’s Republic of Korea, Republic of Korea, Lao People’s Democratic Republic, Malaysia, Maldives, Mongolia, Nepal, Pakistan, Philippines, Timor-Leste, Singapore, Thailand, Viet Nam
Near and Middle East
Israel, Jordan, Lebanon, Syrian Arab Republic, Occupied Palestinian Territory, Bahrain, Iran (Islamic Republic of), Iraq, Kuwait, Oman, Qatar, Saudi Arabia, Turkey, United Arab Emirates, Yemen
North Africa Algeria, Egypt, Libya, Morocco, Tunisia
ECS Africa Angola, Botswana, Burundi, Cameroon, Central African Republic, Comoros, Congo, Equatorial Guinea, Djibouti, Gabon, Ghana, Kenya, Lesotho, Liberia, Madagascar, Malawi, Mauritius, Mozambique, Namibia, Nigeria, Eritrea, Zimbabwe, Rwanda, Saint Helena, Ascension and Tristan da Cunha, Sao Tome and Principe, Seychelles, Sierra Leone, Somalia, South Africa, Swaziland, United Republic of Tanzania, Uganda, Ethiopia, Democratic Republic of the Congo, Zambia, Mayotte, Sudan, South Sudan
West Africa Cape Verde, Chad, Benin, Gambia, Guinea, Ivory Coast, Mali, Mauritania, Niger, Guinea-Bissau, Senegal, Togo, Burkina Faso
Rest of the world
Albania, French Southern and Antarctic Territories, Bosnia and Herzegovina, Croatia, Iceland, Republic of Moldova, The former Yugoslav Republic of Macedonia, Norway, Switzerland, Serbia, Montenegro

Tab
le A
2.1
. Th
e se
ven
sele
cted
sce
nar
io s
tudi
es.
Title
Auth
ors
Mai
n fo
cus
Mod
elSc
enar
ios
Regi
ons c
once
rned
Tem
pora
l ho
rizon
Wor
ld A
gricu
lture
To
war
ds 2
030/
2050
, the
20
12 re
visio
n (F
AO)
Alex
an-
drat
os a
nd
Brui
nsm
a,
2012
Food
and
Agr
icultu
reFA
O W
orld
Food
M
odel
Base
line
Deve
lope
d/de
velo
ping
re
gion
s (di
vided
in 5
su
b-re
gion
s),
tota
l wor
ld
2005
/07-
2050
Food
secu
rity f
arm
ing
and
clim
ate
chan
ge to
205
0:
scen
ario
s, re
sults
, pol
icy
optio
ns (I
FPRI
)
Nelso
n et
al.,
20
10Fo
od se
curit
y, a
gricu
lture
an
d cli
mat
e ch
ange
IMPA
CT 2
009
Base
line
+2 w
hat i
f sc
enar
ios (
optim
istic,
pe
ssim
istic)
for s
uppo
rting
th
e fo
resig
ht w
ork
Deve
lopi
ng
coun
tries
2000
-20
50
A Bo
unds
Ana
lysis
of
Wor
ld Fo
od Fu
ture
s:
Glob
al A
gricu
lture
thro
ugh
to 2
050
Pard
ey e
t al.,
20
14Cr
opla
nd u
se u
nder
al
tern
ative
hyp
othe
ses o
n po
pula
tion
grow
th
iAP
Base
line
+ se
nsiti
vity
anal
ysis
to d
emog
raph
ic hy
poth
eses
17 re
gion
s, to
tal w
orld
2010
-20
50
The
futu
re o
f foo
d —
Sc
enar
ios a
nd th
e ef
fect
on
nat
ural
reso
urce
use
in
agric
ultu
re in
205
0
Odeg
ard
and
van
der V
oet,
2014
Reso
urce
use
and
die
tsIn
put-o
utpu
t mod
el4
IPCC
-SRE
S sc
enar
ios
(’Affl
uent
wor
ld’,
’Full
wor
ld’,
’Veg
etar
ian
wor
ld’,
’Low
-inpu
t wor
ld’)
Tota
l wor
ld20
05-
2050
Agrim
onde
(INR
A-CI
RAD)
Pailla
rd e
t al.,
20
10Fo
od se
curit
y and
ag
ricul
ture
Biop
hysic
al b
iom
ass
bala
nce
mod
elBa
selin
e GO
+1 n
orm
ative
sc
enar
io A
grim
onde
16
regi
ons,
tota
l wor
ld20
03-
2050
Land
-use
chan
ge
traje
ctor
ies u
p to
205
0:
insig
hts f
rom
a g
loba
l ag
ro-e
cono
mic
mod
el
com
paris
on (A
gMIP
)
Schm
itz
et a
l., 2
014
Crop
land
use
und
er
alte
rnat
ive S
SPs a
nd R
CPs;
re
ason
s for
disc
repa
ncie
s ac
ross
resu
lts fr
om va
rious
m
odel
s
AIM
, ENV
ISAG
E,
EPPA
, FAR
M, G
CAM
, GL
OBIO
M, G
TEM
, IM
PACT
, MAG
NET,
M
AgPI
E
4 so
cioec
onom
ic an
d cli
mat
e ch
ange
scen
ario
s fro
m th
e IP
CC-R
CP a
nd S
SP
(Soc
ioec
onom
ic Pa
thw
ays)
7 re
gion
s, to
tal w
orld
2005
-20
50
Land
-use
futu
res i
n th
e sh
ared
socio
-eco
nom
ic pa
thw
ays
Popp
et a
l.,
2017
Agric
ultu
ral la
nd u
se in
the
five
SSPs
AIM
, GCA
M, I
MAG
E,
MES
SAGE
-GLO
BIOM
, RE
MIN
D/M
AgPI
E
5 IP
CC-S
SP sc
enar
ios
5 re
gion
s, to
tal w
orld
2005
-21
00
Appendix 2
1. Additional information on scenario studies considered in Chapter 4

Appendix 2
2. Additional information on food diets
Figure A2.1. Food diets in 2010 and in 2050 under the different food diet pathways in various regions.
Canada/USA
EU 27
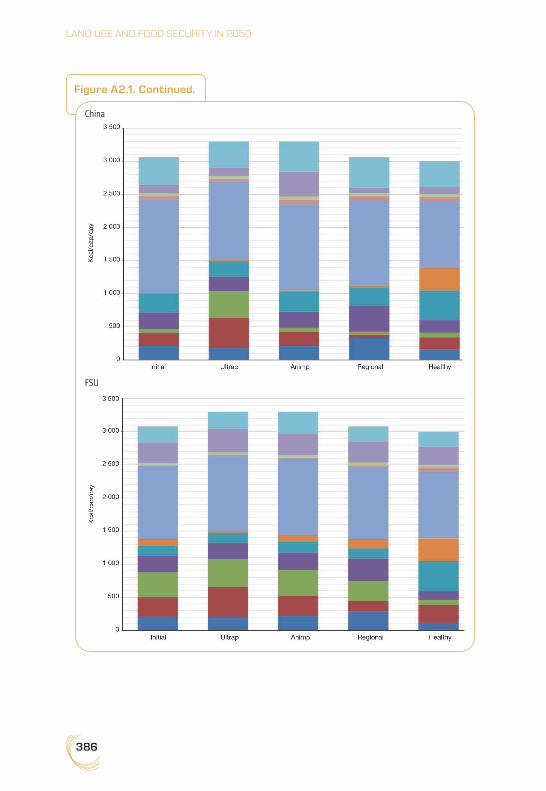
386
LAND USE AND FOOD SECURITY IN 2050
Figure A2.1. Continued.
China
FSU

387
Appendix 2
Figure A2.1. Continued.
North Africa
West Africa

388
LAND USE AND FOOD SECURITY IN 2050
Figure A2.1. Continued.
Source: Calculated from GlobAgri-AgT data.
India
ECS Africa

389
Appendix 2
3. Additional information on cropping systems
Figure A2.2. Per-ha yield in 2010 and in 2050 under the various cropping system pathways.
Maize
Rice
Soyabean

390
LAND USE AND FOOD SECURITY IN 2050
Figure A2.2. Continued.
Source: Calculated from GlobAgri-AgT and GAEZ data.
Other cereals
4. Additional information on livestock systems
The detailed analysis of initial data shows that as far as ruminant sectors are concerned, there are some characteristics in mixed and pastoral systems which are constant across regions and sectors:
– whatever the sector and region, the mixed system uses more concentrates in feed rations. The pastoral system uses mostly grass in feed rations;
– whatever the sector and region, the mixed system is more efficient in transforming feed into animal products (lower feed-to-output ratios) than the pastoral system (Fig. A2.3). There are some notable exceptions however: in West and ECS Africa where ruminant production systems are particularly poor performer in terms of feed-to-output ratios compared to all other regions, pastoral systems perform better than mixed systems in the dairy and the small ruminant meat sectors;
– whatever the sector and system, West Africa is the worst performer in transforming feed into ani-mal product outputs, followed by ECS Africa and India (except for dairy) but with significant gaps. In this regard, Figure A2.3 shows that the performance of West African and Indian beef sectors in terms of feed-to-output ratios are totally disconnected from those of other regions, especially for pasto-ral systems. There are some objective reasons for such poor performance in the beef sectors in both regions (where animals are raised and fed for other reasons and objectives than for meat produc-tion). But a question remains regarding the extent of the gap with other regions;
– initial data suggest that, for ruminant sectors, ’Urban’ and ’Other’ systems involve very different realities from one region to another: their feed-to-output ratios differ widely across regions and there is no general rule emerging regarding the ranking of both systems relative to the mixed and pasto-ral systems; in the same vein the composition of the feed rations in ’Urban’ and ’Other’ systems is so variable from one region to another than it does not provide a constant characteristic that would help to define such systems.
As far as monogastric sectors are concerned, initial data shows constant characteristics across regions and sectors, which allow for a clearer definition of the ’Urban’ and ’Other’ systems:
391
Appendix 2
– comparing feed rations of both systems indicates that urban system rations are richer in grains and cakes (i.e., in concentrates). This suggests that ’Urban’ systems are likely to correspond to industrial systems while ’Other’ systems seem closer to backyard-type systems;
– ’Other’ systems are usually better performers in transforming feed into animal products outputs (Fig. A2.3). This result which may appear to be surprising could result from the non-reporting of signi-ficant quantities of ’occasionals’ (food leftovers, see Chapter 3) fed to animal rather than indicating higher performances in ’Other’ systems compared to ’Urban’ systems.
Finally, whatever the sector, initial data show that: – within sectors, feed-to-output ratios vary widely across production systems and regions. The diffe-
rences across regions are significantly more marked for the ruminant sectors than for the monogas-tric sectors. Monogastric production systems are indeed more homogenous across the world than ruminant systems which are very different from one region to another (Fig. A2.3);
– whatever the sector, livestock systems are far more efficient in transforming feed into animal pro-duct outputs in developed countries than in developing countries (Fig A2.3);
– as far as ruminant sectors are concerned, mixed systems usually have the highest share in total production. The notable exceptions are Oceania, where the production shares of mixed systems are particularly low in the beef and dairy sectors, and the American continent, which exhibits low pro-duction shares for mixed systems for small ruminant meat (Fig. A2.4);
– concerning monogastric sectors, urban systems produce the quasi-totality of meat outputs in deve-loped and emerging countries. In developing countries, other systems usually have the highest pro-duction share. We note the particularly low production share of urban systems in India (Fig. A2.4).

392
LAND USE AND FOOD SECURITY IN 2050
Figure A2.3. Livestock feed-to-output ratios for different production systems in various sectors in the initial 2010 situation (kg dry matter feed/kg output animal product).
Beef meat
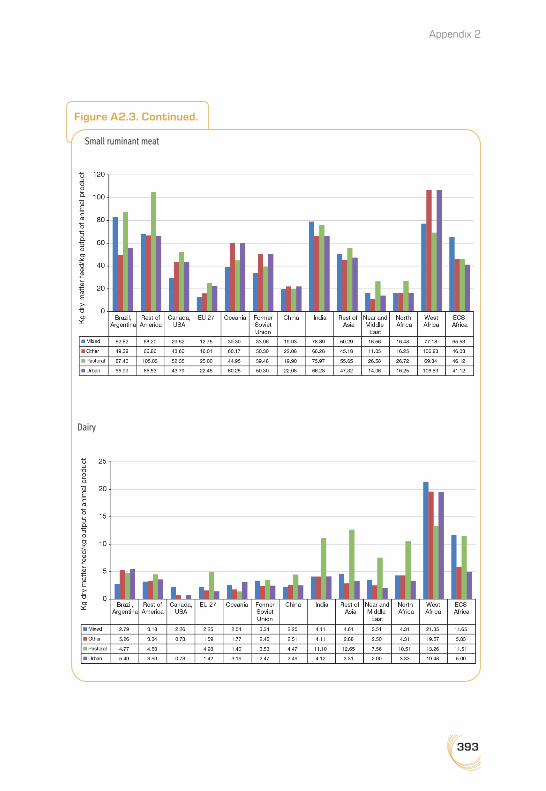
393
Appendix 2
Figure A2.3. Continued.
Small ruminant meat
Dairy

394
LAND USE AND FOOD SECURITY IN 2050
Figure A2.3. Continued.
Source: Calculated from GlobAgri-AgT data.
Pork
Poultry meat

395
Appendix 2
Figure A2.4. Shares of various production systems in total animal product production of sectors, in the initial 2010 situation in different regions.
Beef meat
Small ruminant meat
Dairy

396
LAND USE AND FOOD SECURITY IN 2050
Figure A2.4. Continued.
Source: Calculated from GlobAgri-AgT data.
Pork meat
Poultry meat

397
Authors
Francis Aubert, AgroSup Dijon-INRA-Univ. Bourgogne Franche-Comté, UMR 1041 CESAER, F-21000 Dijon, France. [email protected]
Marco Barzman, INRA, UAR 1241 DEPE, F-75338 Paris, France. [email protected]
Thierry Brunelle, CIRAD, UMR CIRED, F-94736 Nogent-sur-Marne, France. [email protected]
Christophe Cassen, CNRS, UMR CIRED, F-94736 Nogent-sur-Marne, France. [email protected]
Catherine Donnars, INRA, UAR 1241 DEPE, F-75338 Paris, France. [email protected]
Patrice Dumas, CIRAD, UMR CIRED, F-34398 Montpellier, France. [email protected]
Agneta Forslund, INRA, UAR 519 SAE2, F-35000 Rennes, France. [email protected]
Alexandre Ickowicz, (1) CIRAD, UMR SELMET, F-34398 Montpellier, France. [email protected] (2) SELMET, Univ. Montpellier, CIRAD, INRA, Montpellier SupAgro, Montpellier, France.
Véronique Lamblin, Futuribles, F-75007 Paris, France. [email protected]
Frédéric Lançon, (1) CIRAD, UMR ART-DEV, F-34398 Montpellier, France. [email protected] (2) ART-DEV, Univ. Montpellier, CIRAD, CNRS, Univ. Montpellier 3, Univ. Perpignan Via Domitia, Montpellier, France.
Marie de Lattre-Gasquet, (1) CIRAD, UMR ART-DEV, F-75116 Paris, France. [email protected] (2) ART-DEV, Univ. Montpellier, CIRAD, CNRS, Univ. Montpellier 3, Univ. Perpignan Via Domitia, Montpellier, France.
Philippe Lecomte, (1) CIRAD, UMR SELMET, PPZS, Dakar, Sénégal. [email protected] (2) SELMET, Univ. Montpellier, CIRAD, INRA, Montpellier SupAgro, Montpellier, France.
Chantal Le Mouël, INRA, UMR 1302 SMART-LERECO, F-35000, France. [email protected]

398
LAND USE AND FOOD SECURITY IN 2050
Philippe Lescoat, AgroParisTech, UMR 1048 SADAPT, F-75005 Paris, France. [email protected]
David Makowski, INRA, UMR 211 Agronomie, F-78850 Thiverval-Grignon, France. [email protected]
Eric Malézieux, (1) CIRAD, UR HortSys, F-34398 Montpellier, France. [email protected] (2) Hortsys, Univ. Montpellier, CIRAD, Montpellier, France.
Stéphane Manceron, INRA, UAR 1241 DEPE, F-75338 Paris cedex 7, France. [email protected]
Elodie Marajo-Petitzon, INRA, UMR 1302 SMART-LERECO, F-35000 Rennes, France. [email protected]
Florent Maraux, CIRAD, Direction de la recherche et de la stratégie, F-34398 Montpellier. [email protected]
Pauline Marty, INRA, UAR 1241 DEPE, Paris. Now: Univ. de technologie de Troyes, F-10004 Troyes, France. [email protected]
Jacques Marzin, (1) CIRAD, UMR ART-DEV, F-34398 Montpellier, France. [email protected] (2) ART-DEV, Univ. Montpellier, CIRAD, CNRS, Univ. Montpellier 3, Univ. Perpignan Via Domitia, Montpellier, France.
Olivier Mora, INRA, UAR 1241 DEPE, F-75338 Paris, France. [email protected]
Clémence Moreau, CIRAD, Direction de la recherche et de la stratégie, F-75116 Paris, France. [email protected]
John Okul, CIRAD, Direction de la recherche et de la stratégie, F-75116 Paris, France. [email protected]
Laurent Piet, INRA, UMR 1302 SMART-LERECO, F-35000 Rennes, France. [email protected]
Olivier Réchauchère, INRA, UAR 1241 DEPE, F-75338 Paris, France. [email protected]


Layout: Desk
Réf. : 02659
ISBN : 978-2-7592-2879-9
ISSN : 2115-1229
After a first foresight study on ‘World food security in 2050’ (Agrimonde), CIRAD and INRA have turned their attention to a new foresight exercise on ‘Land use and food security in 2050’ (Agrimonde-Terra). This new study seeks to highlight levers that could modify ongoing land-use patterns for improved food and nutrition security.
Agrimonde-Terra proposes a trend analysis on the global context, climate change, food diets, urban-rural linkages, farm structures, cropping and livestock systems, and explores five scenarios. Three scenarios entitled ‘Metropolization’, ‘Regionalization’ and ‘Households’ are based on current competing trends identified in most world regions. Two scenarios entitled ‘Healthy’ and ‘Communities’ involve potential breaks that could change the entire land use and food security system. The ‘Healthy’ scenario is the only one that makes it possible to achieve sustainable world food and nutrition security in 2050. Nevertheless, current trends in agricultural and food systems in most parts of the world converge towards the ‘Metropolization’ scenario, which is not sustainable in terms of both land use and human health. Therefore, changing the course of ongoing trends in favor of sustainable land uses and healthy food systems will be one of the main challenges of the next decades. It will require systemic transformation, strong and coherent public policies across sectors and scales, and consistent actions from a wide range of actors.
This foresight provides a large information base on land uses, food systems and food security and constitutes a tool box to stimulate debates, imagine new policies and innovations. It aims to empower decision makers, stakeholders, non-governmental organizations and researchers to develop a constructive dialogue on the futures of land uses and food security at either world, regional and national levels.
Chantal Le Mouël is an economist. Her main research topics are market and trade modeling, land-use change, agricultural and food systems change. At INRA, she is a senior researcher, working at the SMART-LERECO unit located in Rennes.
Marie de Lattre-Gasquet is a researcher from CIRAD. In the research unit “Actors, Resources and Territories in Development” (ART-Dev), she works on foresight as a tool for engagement and support for strategy and decision making at international and national levels in the fields of agriculture and food security, as well as on organizations and networks.
Olivier Mora is a foresight specialist at the Delegation for scientific expertise, foresight and advanced studies (DEPE) of INRA, located in Paris. His foresight approach focus on complexity, thinking at various scales and combining qualitative and quantitative assumptions. He works on the futures of different areas such as rural-urban linkages, forest regions, agriculture biomass and global diets.
Cover: Landscape of rice fields, Madagascar. Pierre-Yves Le Gal, © Cirad (Source Ciradimages).