
Land surface conditions over Eurasia and Indian summer...
17
Land surface conditions over Eurasia and Indian summer monsoon rainfall Alan Robock and Mingquan Mu Department of Environmental Sciences, Rutgers University, New Brunswick, New Jersey, USA Konstantin Vinnikov Department of Meteorology, University of Maryland, College Park, Maryland, USA David Robinson Department of Geography, Rutgers University, Piscataway, New Jersey, USA Received 11 March 2002; revised 8 September 2002; accepted 26 September 2002; published 20 February 2003. [1] Using observations of snow cover, soil moisture, surface air temperature, atmospheric circulation, and Indian summer monsoon precipitation from 1870 to 2000, we examine the relationship between interannual variations of the strength of the monsoon and land surface conditions over Eurasia. For the periods 1870–1895 and 1950–1995, strong Indian summer monsoon precipitation was preceded by warmer than normal temperatures over Europe and North America in the previous winter and over western Asia in the previous spring but colder temperatures over Tibet. The European temperature anomalies were related to the positive phase of the North Atlantic Oscillation (NAO). Related negative snow cover anomalies in Europe in winter and central Asia in spring were produced by circulation and temperature anomalies. The snow-albedo feedback is always operating, but the snow by itself did not physically control the monsoon. Anomalous snow cover impacts on temperature were not prolonged by soil moisture feedbacks because of its short time memory, and there was no obvious relationship between soil moisture and the monsoon. Strong Indian summer monsoon precipitation was actually preceded by higher than normal Tibetan snow cover in winter and spring in contrast to the suggestion of Blanford [1884] more than a century ago. The correlation between Indian summer monsoon rainfall and winter land temperatures and snow cover only exists when interannual variation of the NAO is very strong, and therefore NAO is not a robust predictor of the monsoon. Climate models show that the relationship between NAO and monsoon is random. INDEX TERMS: 1620 Global Change: Climate dynamics (3309); 1854 Hydrology: Precipitation (3354); 1863 Hydrology: Snow and ice (1827); KEYWORDS: monsoon, snow, soil moisture, NAO, El Nin ˜o, India Citation: Robock, A., M. Mu, K. Vinnikov, and D. Robinson, Land surface conditions over Eurasia and Indian summer monsoon rainfall, J. Geophys. Res., 108(D4), 4131, doi:10.1029/2002JD002286, 2003. 1. Introduction [2] More than 100 years ago, Blanford [1884, p. 22] suggested that winter snow cover over the Himalayas may be an important predictor of subsequent summer precipita- tion over India. In addition to a local influence that involved dry winds sweeping down from the mountains following each precipitation event that would evaporate the fallen rain at the lower levels, reducing the subsequent local source of moisture for precipitation, he also pointed out that remote influences on the large-scale pressure pattern over India were important. If there was high pressure over India, he concluded that ‘‘this excessive pressure was shown to affect so extensive a region, that it would be unreasonable to attribute it to the condition of any tract so limited as a portion of the Himalayan chain; and if dependent on the thermal conditions of the surface, which may indeed have been the case, this land must rather have been the major portion of the Asiatic continent than merely a relatively small portion of the mountain axis. This question must remain for further inquiry. It is referred to here to guard against too wide an application being assigned to the action of the Himalayan snows.’’ Here we conduct that further inquiry, making use of a newly extended data set of snow cover extent [Robinson, 2000], the new extended National Centers for Environmental Prediction/National Center for Atmospheric Research (NCEP/NCAR) reanalysis of atmos- pheric observations [Kistler et al., 2001], tropical sea sur- face temperatures [Parker et al., 1995] (data available at JOURNAL OF GEOPHYSICAL RESEARCH, VOL. 108, NO. D4, 4131, doi:10.1029/2002JD002286, 2003 Copyright 2003 by the American Geophysical Union. 0148-0227/03/2002JD002286$09.00 ACL 1 - 1
Transcript of Land surface conditions over Eurasia and Indian summer...

Land surface conditions over Eurasia and Indian summer
monsoon rainfall
Alan Robock and Mingquan MuDepartment of Environmental Sciences, Rutgers University, New Brunswick, New Jersey, USA
Konstantin VinnikovDepartment of Meteorology, University of Maryland, College Park, Maryland, USA
David RobinsonDepartment of Geography, Rutgers University, Piscataway, New Jersey, USA
Received 11 March 2002; revised 8 September 2002; accepted 26 September 2002; published 20 February 2003.
[1] Using observations of snow cover, soil moisture, surface air temperature, atmosphericcirculation, and Indian summer monsoon precipitation from 1870 to 2000, we examine therelationship between interannual variations of the strength of the monsoon and landsurface conditions over Eurasia. For the periods 1870–1895 and 1950–1995, strongIndian summer monsoon precipitation was preceded by warmer than normal temperaturesover Europe and North America in the previous winter and over western Asia in theprevious spring but colder temperatures over Tibet. The European temperature anomalieswere related to the positive phase of the North Atlantic Oscillation (NAO). Relatednegative snow cover anomalies in Europe in winter and central Asia in spring wereproduced by circulation and temperature anomalies. The snow-albedo feedback is alwaysoperating, but the snow by itself did not physically control the monsoon. Anomalous snowcover impacts on temperature were not prolonged by soil moisture feedbacks because ofits short time memory, and there was no obvious relationship between soil moisture andthe monsoon. Strong Indian summer monsoon precipitation was actually preceded byhigher than normal Tibetan snow cover in winter and spring in contrast to the suggestionof Blanford [1884] more than a century ago. The correlation between Indian summermonsoon rainfall and winter land temperatures and snow cover only exists wheninterannual variation of the NAO is very strong, and therefore NAO is not a robustpredictor of the monsoon. Climate models show that the relationship between NAO andmonsoon is random. INDEX TERMS: 1620 Global Change: Climate dynamics (3309); 1854
Hydrology: Precipitation (3354); 1863 Hydrology: Snow and ice (1827); KEYWORDS: monsoon, snow, soil
moisture, NAO, El Nino, India
Citation: Robock, A., M. Mu, K. Vinnikov, and D. Robinson, Land surface conditions over Eurasia and Indian summer monsoon
rainfall, J. Geophys. Res., 108(D4), 4131, doi:10.1029/2002JD002286, 2003.
1. Introduction
[2] More than 100 years ago, Blanford [1884, p. 22]suggested that winter snow cover over the Himalayas maybe an important predictor of subsequent summer precipita-tion over India. In addition to a local influence that involveddry winds sweeping down from the mountains followingeach precipitation event that would evaporate the fallen rainat the lower levels, reducing the subsequent local source ofmoisture for precipitation, he also pointed out that remoteinfluences on the large-scale pressure pattern over Indiawere important. If there was high pressure over India, heconcluded that ‘‘this excessive pressure was shown to affect
so extensive a region, that it would be unreasonable toattribute it to the condition of any tract so limited as aportion of the Himalayan chain; and if dependent on thethermal conditions of the surface, which may indeed havebeen the case, this land must rather have been the majorportion of the Asiatic continent than merely a relativelysmall portion of the mountain axis. This question mustremain for further inquiry. It is referred to here to guardagainst too wide an application being assigned to the actionof the Himalayan snows.’’ Here we conduct that furtherinquiry, making use of a newly extended data set of snowcover extent [Robinson, 2000], the new extended NationalCenters for Environmental Prediction/National Center forAtmospheric Research (NCEP/NCAR) reanalysis of atmos-pheric observations [Kistler et al., 2001], tropical sea sur-face temperatures [Parker et al., 1995] (data available at
JOURNAL OF GEOPHYSICAL RESEARCH, VOL. 108, NO. D4, 4131, doi:10.1029/2002JD002286, 2003
Copyright 2003 by the American Geophysical Union.0148-0227/03/2002JD002286$09.00
ACL 1 - 1

http://www.cru.uea.ac.uk/cru/data/temperature), and theGlobal Soil Moisture Data Bank [Robock et al., 2000] toexamine the relationship between preceding land surfaceconditions and the amount of summer monsoon precipita-tion in India.[3] Blanford [1884] did not suggest that positive snow
cover anomalies would increase the surface albedo, delay-ing heating of the continent or that heavy snow wouldrequire more energy to melt the snow, energy that other-wise would have gone to heating the land. Nor did hesuggest that snow anomalies would produce soil moistureanomalies with the same effect on surface heating. How-ever, Blanford’s work did inspire subsequent research thatdid lead to these ideas. Bamzai and Shukla [1999, p. 3122]recently examined the spatial pattern of snow cover anoma-lies and found that the only regions of anomalous snowcover extent that were correlated with Indian summerrainfall were in Europe and western Asia in the precedingwinter and spring. They said that a possible explanation forthis relationship ‘‘is that both the western Eurasian snowcover and the monsoon rainfall anomalies are the results oflow-frequency changes in the planetary scale circulation.We do not know of such a low-frequency phenomenon,and therefore we cannot propose this as an explanation forthe snow-monsoon relationship.’’ They also suggested thatsoil moisture interactions would provide a memory fromanomalous snow cover that perpetuated the temperatureanomaly after the snow melted. Here we address both ofthese issues, identifying the circulation mechanism andusing observations to see whether there is a soil moisturememory.[4] Shinoda [2001] recently examined the relationship
between snow cover and soil moisture in central Asia.While he found a positive relationship for a limited areacentered on Uralsk (51�N, 51�E), in general he found thatthere was no evidence for a large-scale memory effect thatcould influence the Asian monsoon. We extend theseresults by examining a larger number of Asian stationsand the direct relationship between soil moisture and themonsoon.[5] The land-ocean thermal contrast is the primary driver
for the Asian monsoon, a seasonal-scale sea breeze circu-lation [Li and Yanai, 1996; Liu and Yanai, 2001]. Temper-ature anomalies over land and ocean will both affect thethermal gradient and the strength of the monsoons.Although much work has gone into the oceanic portion ofthis relationship [Yang and Lau, 1998; Gershunov et al.,2001], here we examine the land portion. In particular,since the well-known correlation with sea surface temper-atures (SST) in the Pacific Ocean [Rasmusson and Carpen-ter, 1983] only appears at the same time as the beginning ofthe Indian summer monsoon [Clark et al., 2000; Gershunovet al., 2001], and does not allow SST observations to beused to predict the rainfall, we examine land surfaceprocesses in the previous winter to try to find predictorsof the monsoon.
2. Data Sets and Methods
[6] For the analysis presented here, we made use of anumber of observational data sets. To represent the Asiansummer monsoon, we used all-India rainfall (AIR), an area-
weighted average from 29 Indian rainfall subdivisions[Parthasarathy et al., 1995] (data available at http://grads.iges.org/india/partha.subdiv.html). We used the total amountfor June, July, August, and September (JJAS); the data areavailable for 130 years, 1871–2000. Monthly sea levelpressure, geopotential height at 500 hPa and 50 hPa, and2-m air temperature were from the NCEP/NCAR Reanalysis[Kistler et al., 2001]. The North Atlantic Oscillation (NAO)[Hurrell, 1995, and references therein] indicates the strengthof the zonal wind bringing oceanic air onto the Eurasiancontinent, producing warmer temperatures in winter when itis positive. To obtain a long record of the NAO, we used thenormalized surface pressure difference between Gibraltarand Reykjavik, Iceland [Jones et al., 1997], which extendsfrom 1821 through the present. We analyzed the December,January, and February (DJF) mean.[7] For representing the influence of oceans on the
monsoon, we used a common El Nino index, the seasonalstandardized anomaly of SST in the Nino 3.4 region (5�N–5�S, 120�–170�W), calculated using the HadCRUT data set[Parker et al., 1995]. We analyzed the June, July, andAugust (JJA) mean of the SST anomaly (SSTA), becausethe highest correlation of SST with AIR is simultaneous.[8] The soil moisture data are from Global Soil Moisture
Data Bank [Robock et al., 2000]. This data bank includesgravimetric measurements at 130 meteorological stations ofthe former Soviet Union, 102 from China, and 40 fromMongolia of plant available soil moisture for upper 10 cmand 1 m soil layers at flat observational plots with naturalgrass vegetation. The size of the observational plots is about0.1 ha. Observations were made three times per monthduring the warm season and once a month during winter.Four points in each plot were used for each measurementand the results averaged. Here we used a subset of thesestations for which we also had daily snow depth data. Thesnow depth data for 1966–1990, from former Soviet Unionhydrological snow surveys, were obtained from theNational Snow and Ice Data Center.[9] Northern Hemisphere snow cover extent has been
produced by the National Oceanic and Atmospheric Admin-istration. In this analysis, we used monthly data fromOctober 1966 through December 2000, reproduced fromweekly charts derived from visual interpretation of photo-graphic copies from visible satellite images [Robinson et al.,1993]. Although the weekly data have some problems, suchas low solar illumination, cloudiness, dense forest cover,and subgrid resolution snow features (e.g., in areas of steepterrain), at a monthly resolution these data are suitable forclimatic studies.[10] In this study, we examine the relationship between
snow cover, NAO, soil moisture, and AIR using compositeand correlation analyses. In the next section, we show therelationship between Eurasian snow cover in the precedingwinter and spring and the summer AIR. Then, in section 4,we try to explain what produces snow cover anomalies3–6 months before anomalies of summer AIR. In section 5,we examine soil moisture memory and whether soil mois-ture can prolong the snow cover anomaly signal in winterlong enough to influence the subsequent summer monsoon.Next we show that the snow cover/soil moisture/monsoonrelationships we have described are not robust over theentire climatic record and present climate model simula-
ACL 1 - 2 ROBOCK ET AL.: EURASIAN LAND SURFACE AND INDIAN MONSOON RAINFALL

tions that support this conclusion. Finally, we summarizeour study.
3. Eurasian Snow Cover Patterns AssociatedWith All-India Rainfall
[11] Figure 1 shows the temporal variation of the summerIndian monsoon rainfall (JJAS AIR) anomaly from 1950through 2000. The mean is 847 mm, calculated for the period1950–2000. For subsequent composite analyses, we definedhigh AIR to be those years where AIR was more than onestandard deviation above the mean (1955, 1956, 1959, 1961,1970, 1975, 1983, 1988, and 1994) and low AIR to be whenit was more than one standard deviation below the mean
(1951, 1965, 1966, 1968, 1972, 1974, 1979, 1982, 1985,1986, and 1987). While AIR is quite variable, there are fewernegative AIR anomalies during the periods of 1950–1964and 1988–2000, and the amplitude of AIR variation is verysmall during the last decade.[12] To examine the relationship between snow cover and
the summer monsoon, we used our new longer snow coverrecord and performed a composite of five heavy AIR casesminus eight light AIR cases for the period of the snow coverrecord, 1967–2000, for 2-month winter and spring periods(Figure 2). To examine whether soil moisture could helpprolong the snow signal, we also composited the soil mois-ture differences for 2-month periods following the snowcover periods. Because traditional statistical models cannot
Figure 1. All-India rainfall (AIR) anomaly (mm) in JJAS with respect to 1950–2000 mean. The thinlines show ±1 standard deviation. The circles indicate the high and low AIR years used for the compositeanalyses. See color version of this figure in the HTML.
Figure 2. Composites of snow cover and soil moisture patterns for the winters and springs precedingsummers of high all-India rainfall minus those of low all-India rainfall for the period 1967–2000. Areassignificantly different from zero are stippled. See color version of this figure at back of this issue.
ROBOCK ET AL.: EURASIAN LAND SURFACE AND INDIAN MONSOON RAINFALL ACL 1 - 3
ACL 1 - 4 ROBOCK ET AL.: EURASIAN LAND SURFACE AND INDIAN MONSOON RAINFALL

be used to determine the significance of these patterns, weconducted a Monte Carlo test examining 1000 randomcombinations of 5 years minus 8 years from the data set,and we show on Figure 2 those locations where the observeddifference occurs less than 5% and less than 1% of the time bychance [Livezey and Chen, 1983; Robock and Mao, 1995].[13] The snow cover patterns are highly significant, while
the soil moisture ones are not. We can see that snow coverhas strong negative anomalies in the middle latitude area ofwestern Eurasia and central Eurasia in the previous winterand spring. Nearly the whole Eurasian continent is coveredby negative anomalies of snow cover except the Tibetanarea both in the preceding winter and spring of AIR. Thepatterns are the same as those found by Bamzai and Shukla[1999], who used a shorter time series but also detected asignificant positive correlation between Tibetan snow coverand AIR, the opposite of what Blanford suggested for theHimalayas [Blanford, 1884]. This means that heavy Indiansummer monsoon rainfall is preceded by lower than normalsnow cover in the Eurasian region but by higher thannormal snow cover in the Tibetan Plateau for the periodof analysis. The snow cover anomalies clearly reflect awave-like pattern, suggesting a response to circulationanomalies rather than a direct physical influence of thesnow on the monsoon circulation.[14] The composite of soil moisture anomalies shown in
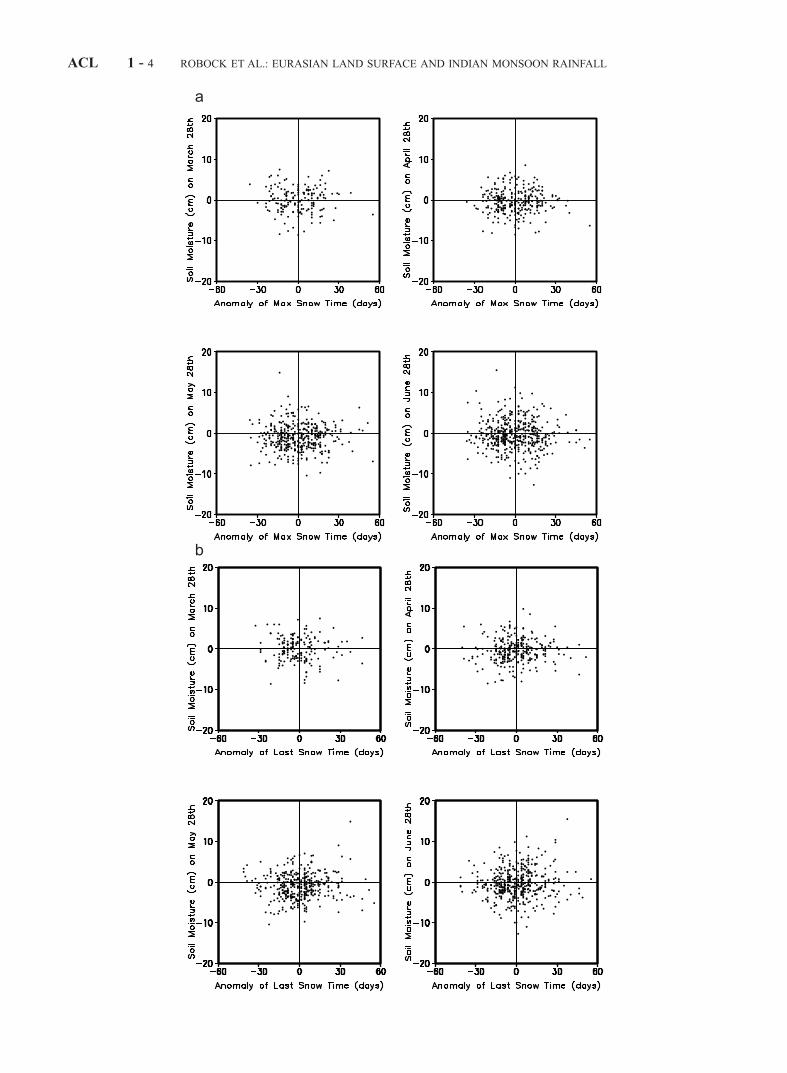
Figure 2 shows no particular patterns. Thus the soil moistureis not strongly related to the strength of the Indian summermonsoon. As it does not match the snow patterns, neither isthe soil moisture pattern a response to anomalous snowcover. The examination of the relationship between max-imum seasonal snow depth amounts just prior to the springsnowmelt and subsequent soil moisture anomalies at eachstation (not shown) also shows no relationship. In addition,we examined the relationship between both the timing of thespring snow cover peak (the time when melting begins) andthe time when all snow is gone (the time when melting ends)
and soil moisture amounts in the spring for the top 100 cm ofsoil (Figure 3). The results for the top 10 cm of soil are thesame and are not shown. Locations of the stations used for thesnow and soil moisture observations are shown in Figure 4.The speculation that an earlier melting would lead to drier soilin the spring (independent of the winter snow amount) is notsupported by these results. Similarly, a later snowmelt perioddoes not lead to wetter soil in the spring. There are severalreasons to explain this. One is that the ground is often frozenwhen the snowmelts, inhibiting infiltration of the melt water.Another is that the ground is often saturated in the winter inthis region, especially in the western part [Robock et al.,1998], and so there is no room in the soil for water toinfiltrate. Finally, examination of soil moisture observationsfor many Russian stations shows that while there is a smallspring peak in soil moisture following snowmelt, the level ofthis peak depends more on the preceding soil moistureamount from the previous winter than on the amount ofsnowmelt water. In other words, soil moisture memory isprolonged during the cold season when snow covers the soiland there is little change in the soil moisture.[15] These results are in contrast to climate model experi-
ments [Becker et al., 2001] using the European Centre forMedium-Range Weather Forecasting climate model, whichfound a large soil moisture signal from melting snow and asubsequent impact on summer Indian monsoon precipita-tion. This model, however, uses a soil moisture parameter-ization with a uniform 26-cm field capacity, which is muchlarger than observed [Robock et al., 1998] and therefore hasan unrealistically large capacity for infiltration.
4. Anomalous Atmospheric CirculationAssociated With Eurasian Snow Cover Patterns
[16] To examine the atmospheric circulation that producesthe snow cover patterns shown in Figure 2, we compositedthe pressure patterns at different levels in the winter (DJF)preceding the Indian summer monsoon for the period1950–2000 (Figure 5). Significant regions are again shownusing a Monte Carlo test. Sea level pressure (SLP) shown inFigure 5 is actually the geopotential height at 1000 hPa(H1000) transferred [Thompson and Wallace, 1998] with theformula
SLP hPa½ � ¼ 0:125 H1000 m½ � þ 1000:
The surface air temperature pattern matches that of thepositive phase of the Arctic Oscillation (AO) [Thompsonand Wallace, 1998], with warm temperatures over NorthAmerica and northern Eurasia and colder than normaltemperatures over Greenland. The circulation patterns insea level pressure and 500 hPa geopotential height matchthose of the AO only in the Atlantic sector. This pattern isclearly the North Atlantic Oscillation (NAO) [Hurrell,1995; Jones et al., 1997], the European manifestation of the
Figure 3. (opposite) Scatter diagram of anomaly of timing of (a) maximum snow depth and (b) first day with no snowcompared to the anomaly of soil moisture amount in the top 100-cm soil layer on the last day of the months of March–Junefor the stations in Figure 4. For the color version, red cross is for snow depth observations before 28 February, green circleis for observations between 28 February and 28 March, blue triangle is for observations for 28 March to 28 April, andyellow square is for observations after 28 April. See color version of this figure in the HTML.
Figure 4. Locations of soil moisture stations for the top10-cm layer (solid circles) and the top 1-m layer (opencircles). See color version of this figure in the HTML.
ROBOCK ET AL.: EURASIAN LAND SURFACE AND INDIAN MONSOON RAINFALL ACL 1 - 5

AO. The 50-hPa geopotential height does not show a strongpolar vortex, a key element of the positive phase of the AO,so this is only a tropospheric manifestation of the NAOcirculation anomaly and not related to stratosphericcirculation as is the AO. We can also notice that thestructure of the atmospheric circulation anomaly has aprominent barotropic character from the bottom (surface airtemperature) to the top (geopotential height at 50 hPa). Thepattern in the Pacific sector is similar to the Pacific/NorthAmerica (PNA) teleconnection pattern [Horel and Wallace,1981; Wallace and Gutzler, 1981] in all of the geopotentialheight fields, but this just reflects the close relationshipbetween Indian summer monsoon and El Nino SouthernOscillation (ENSO).[17] In the spring (March, April, May) the atmospheric
circulation continues to stay in a similar pattern as that inwinter (DJF). There is still a similar PNA pattern in thePacific Ocean and NAO pattern in the Atlantic Ocean.Surface air temperature still stays warm in the high andmiddle latitude region of Eurasia (not shown). The warmland surface will increase the land-ocean thermal contrast in
spring, the very important driver to set up the subsequentIndian summer monsoon.[18] Ambaum et al. [2001] pointed out that the NAO is a
more physically relevant and robust mode for NorthernHemisphere atmospheric variability than is the AO. A. S.Bamzai (personal communication, 2002), using a shortersnow cover time series, recently showed that the AO iscorrelated with the snow cover anomalies and suggestedthat it could be used as a predictor of Indian monsoonrainfall. However, as we shall see, the relationship describedabove is a fairly recent development.[19] What produces the snow cover patterns shown in
Figure 2? Clark et al. [1999] recently identified an NAOsnow signal in central Europe. Figure 6 confirms thisrelationship, by showing the correlation coefficient of theDJF NAO index and subsequent snow cover patterns. Thereis a clear negative snow cover anomaly region associatedwith the warm temperatures, which moves progressivelyeastward along the snow boundary from winter into spring.The March/April pattern shows that for warm winters, thespringtime snow deficit would allow the snow/albedo feed-
Figure 5. Composites of surface air temperature (�C), sea level pressure (hPa), and 500 hPa and 50 hPageopotential height (m) patterns for winters (DJF) preceding summers of high all-India rainfall minus thoseof low all-India rainfall for the period 1950–2000. Areas significantly different from zero are stippled(color version) or shaded (black and white version). See color version of this figure at back of this issue.
ACL 1 - 6 ROBOCK ET AL.: EURASIAN LAND SURFACE AND INDIAN MONSOON RAINFALL
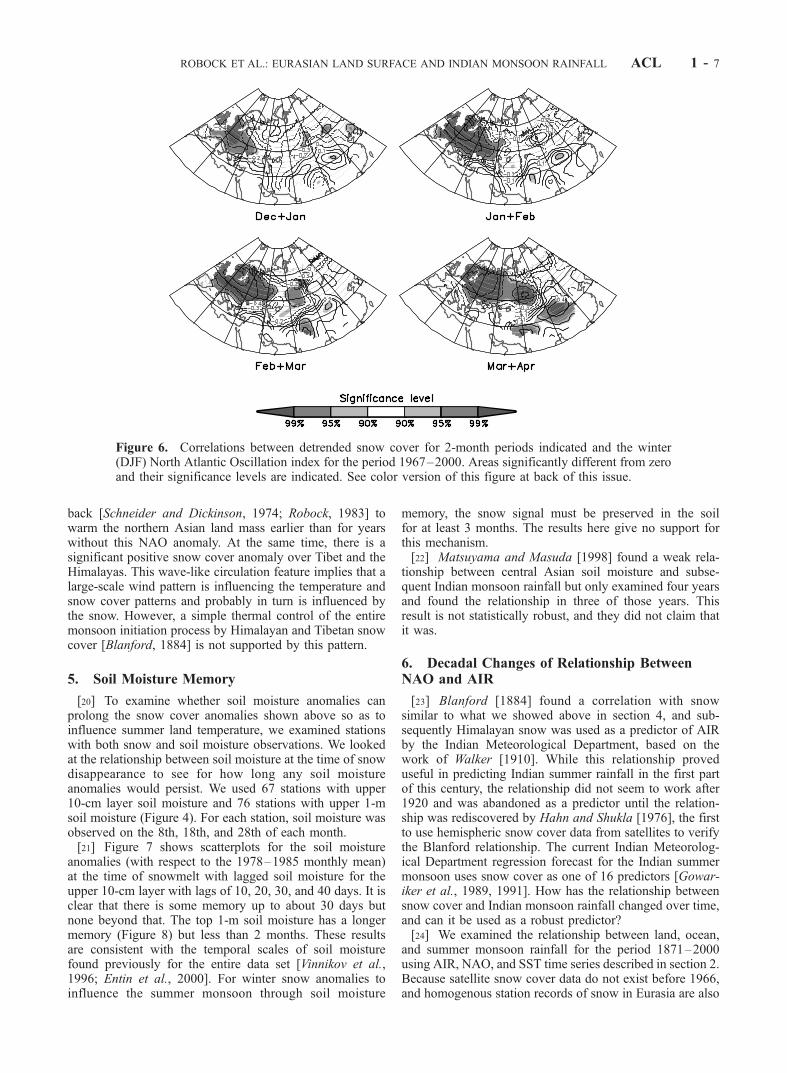
back [Schneider and Dickinson, 1974; Robock, 1983] towarm the northern Asian land mass earlier than for yearswithout this NAO anomaly. At the same time, there is asignificant positive snow cover anomaly over Tibet and theHimalayas. This wave-like circulation feature implies that alarge-scale wind pattern is influencing the temperature andsnow cover patterns and probably in turn is influenced bythe snow. However, a simple thermal control of the entiremonsoon initiation process by Himalayan and Tibetan snowcover [Blanford, 1884] is not supported by this pattern.
5. Soil Moisture Memory
[20] To examine whether soil moisture anomalies canprolong the snow cover anomalies shown above so as toinfluence summer land temperature, we examined stationswith both snow and soil moisture observations. We lookedat the relationship between soil moisture at the time of snowdisappearance to see for how long any soil moistureanomalies would persist. We used 67 stations with upper10-cm layer soil moisture and 76 stations with upper 1-msoil moisture (Figure 4). For each station, soil moisture wasobserved on the 8th, 18th, and 28th of each month.[21] Figure 7 shows scatterplots for the soil moisture
anomalies (with respect to the 1978–1985 monthly mean)at the time of snowmelt with lagged soil moisture for theupper 10-cm layer with lags of 10, 20, 30, and 40 days. It isclear that there is some memory up to about 30 days butnone beyond that. The top 1-m soil moisture has a longermemory (Figure 8) but less than 2 months. These resultsare consistent with the temporal scales of soil moisturefound previously for the entire data set [Vinnikov et al.,1996; Entin et al., 2000]. For winter snow anomalies toinfluence the summer monsoon through soil moisture
memory, the snow signal must be preserved in the soilfor at least 3 months. The results here give no support forthis mechanism.[22] Matsuyama and Masuda [1998] found a weak rela-
tionship between central Asian soil moisture and subse-quent Indian monsoon rainfall but only examined four yearsand found the relationship in three of those years. Thisresult is not statistically robust, and they did not claim thatit was.
6. Decadal Changes of Relationship BetweenNAO and AIR
[23] Blanford [1884] found a correlation with snowsimilar to what we showed above in section 4, and sub-sequently Himalayan snow was used as a predictor of AIRby the Indian Meteorological Department, based on thework of Walker [1910]. While this relationship proveduseful in predicting Indian summer rainfall in the first partof this century, the relationship did not seem to work after1920 and was abandoned as a predictor until the relation-ship was rediscovered by Hahn and Shukla [1976], the firstto use hemispheric snow cover data from satellites to verifythe Blanford relationship. The current Indian Meteorolog-ical Department regression forecast for the Indian summermonsoon uses snow cover as one of 16 predictors [Gowar-iker et al., 1989, 1991]. How has the relationship betweensnow cover and Indian monsoon rainfall changed over time,and can it be used as a robust predictor?[24] We examined the relationship between land, ocean,
and summer monsoon rainfall for the period 1871–2000using AIR, NAO, and SST time series described in section 2.Because satellite snow cover data do not exist before 1966,and homogenous station records of snow in Eurasia are also
Figure 6. Correlations between detrended snow cover for 2-month periods indicated and the winter(DJF) North Atlantic Oscillation index for the period 1967–2000. Areas significantly different from zeroand their significance levels are indicated. See color version of this figure at back of this issue.
ROBOCK ET AL.: EURASIAN LAND SURFACE AND INDIAN MONSOON RAINFALL ACL 1 - 7

not available, we take advantage of the relationship betweenNAO and snow cover shown in Figure 6 and use NAO as aproxy for Eurasian snow. We examined anomalies withrespect to 1871–2000 means for all the data.[25] Figure 9 shows the temporal variations of the corre-
lation coefficients between AIR and the NAO index (top)and between AIR and Nino 3.4 SSTA (bottom) for 11-yearand 21-year sliding windows. The relationship betweensimultaneous Nino 3.4 SSTA and AIR had a significantnegative correlation for the entire period, averaging about�0.6, with the exception of the past decade. This recentdecrease was noted by Chang et al. [2001], who examinedonly the past 60 years. The correlation between the previouswinter NAO index and AIR has a much more interestingand variable relationship. They have been significantlypositively correlated only for the period from the 1960s to1990. The only other time the correlation was this high wasin the 1880s, precisely the time when Blanford [1884] wrotehis paper! In between, the correlation was not significant,except for a brief period, 1910–1930, when it was signifi-cantly negative. In the 1990s the positive correlationbecame insignificant, as did the one with SSTA.[26] How can we explain the relationships found in
Figure 9? Clearly, we do not expect land temperature
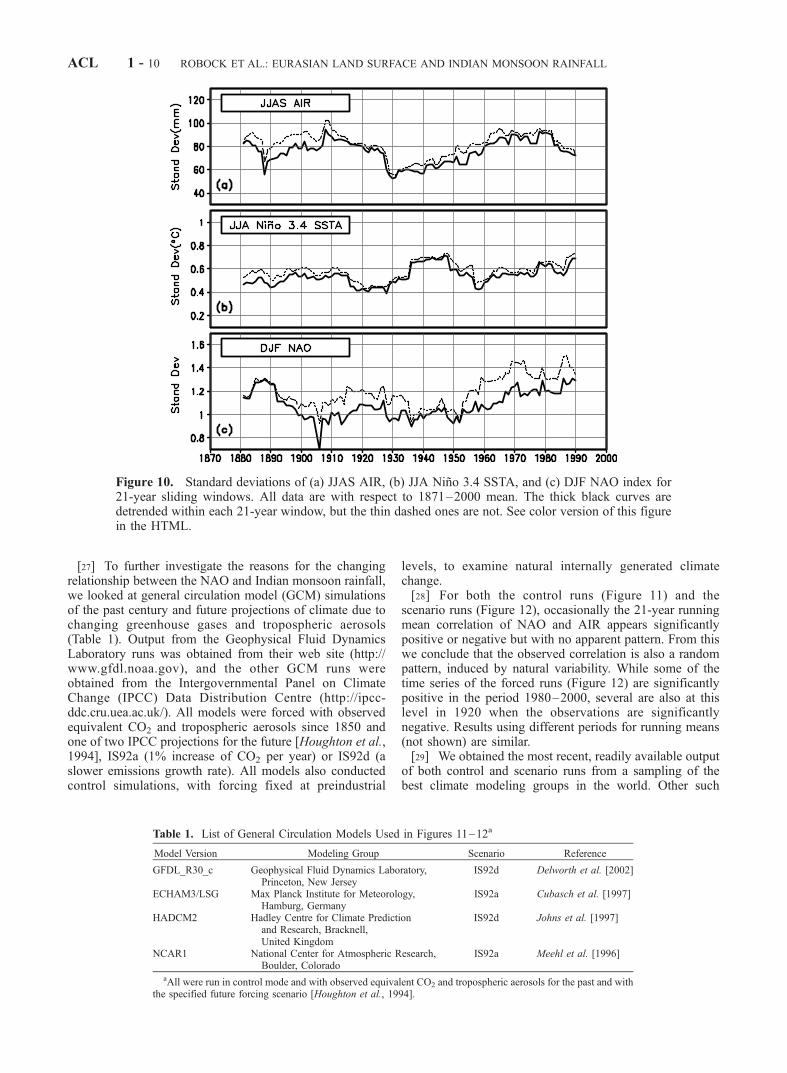
anomalies (as indicated by winter snow) or sea surfacetemperature anomalies to be the only influences on thesummer monsoon. The winter snow may indicate a circu-lation anomaly related to many other factors and not summerland temperature, and certainly there are stochastic elementsto the relationship. However, if the land or ocean has largeinterannual variance for a period, then one would think itwould be able to have a larger influence than if it were closeto its normal state. Therefore we examined the temporalvariations of the standard deviations of AIR, Nino 3.4 SSTA,and NAO index (Figure 10). The standard deviation of SSTAis nearly a constant for the entire record, with the exception ofthe period nearWorldWar II, which is clearly a data problem.AIR and NAO variances, however, have clear interdecadalvariations. Only during the periods when both have a highvariability (1880s and 1960s to 1990) is there a significantpositive correlation between them (Figure 9). This suggeststhat there is a relationship between winter circulation andsummer monsoon, but that it is only strong enough to beimportant when there is large interannual variability. As theinterannual variability of AIR has decreased in the 1990s tolevels only seen before in the 1930s (Figure 10 of this paperand Figure 4 of Vinnikov and Robock [2002]), the correlationbetween AIR and SSTA has gone away (Figure 9).
Figure 7. Scatterplots of soil moisture anomalies (cm) with respect to 1978–1985 monthly mean in thetop 10-cm soil layer at the time of snowmelt with respect to the lagged soil moisture at the same stationfor the stations shown in Figure 4. See color version of this figure in the HTML.
ACL 1 - 8 ROBOCK ET AL.: EURASIAN LAND SURFACE AND INDIAN MONSOON RAINFALL

Figure 8. Same as Figure 7, but for the top 1-m layer with lags of 20, 30, 40, and 60 days. See colorversion of this figure in the HTML.
Figure 9. Correlation coefficients between (top) JJAS AIR and DJF North Atlantic Oscillation (NAO)index and (bottom) JJAS AIR and JJA Nino 3.4 SSTA for 11-year (the thin dashed curves) and 21-year(the bold solid curves) sliding windows. All of the data were detrended within each window beforecalculating the correlation. The thin solid and dashed lines indicate the 95% significance level. See colorversion of this figure in the HTML.
ROBOCK ET AL.: EURASIAN LAND SURFACE AND INDIAN MONSOON RAINFALL ACL 1 - 9
[27] To further investigate the reasons for the changingrelationship between the NAO and Indian monsoon rainfall,we looked at general circulation model (GCM) simulationsof the past century and future projections of climate due tochanging greenhouse gases and tropospheric aerosols(Table 1). Output from the Geophysical Fluid DynamicsLaboratory runs was obtained from their web site (http://www.gfdl.noaa.gov), and the other GCM runs wereobtained from the Intergovernmental Panel on ClimateChange (IPCC) Data Distribution Centre (http://ipcc-ddc.cru.uea.ac.uk/). All models were forced with observedequivalent CO2 and tropospheric aerosols since 1850 andone of two IPCC projections for the future [Houghton et al.,1994], IS92a (1% increase of CO2 per year) or IS92d (aslower emissions growth rate). All models also conductedcontrol simulations, with forcing fixed at preindustrial
levels, to examine natural internally generated climatechange.[28] For both the control runs (Figure 11) and the
scenario runs (Figure 12), occasionally the 21-year runningmean correlation of NAO and AIR appears significantlypositive or negative but with no apparent pattern. From thiswe conclude that the observed correlation is also a randompattern, induced by natural variability. While some of thetime series of the forced runs (Figure 12) are significantlypositive in the period 1980–2000, several are also at thislevel in 1920 when the observations are significantlynegative. Results using different periods for running means(not shown) are similar.[29] We obtained the most recent, readily available output
of both control and scenario runs from a sampling of thebest climate modeling groups in the world. Other such
Figure 10. Standard deviations of (a) JJAS AIR, (b) JJA Nino 3.4 SSTA, and (c) DJF NAO index for21-year sliding windows. All data are with respect to 1871–2000 mean. The thick black curves aredetrended within each 21-year window, but the thin dashed ones are not. See color version of this figurein the HTML.
Table 1. List of General Circulation Models Used in Figures 11–12a
Model Version Modeling Group Scenario Reference
GFDL_R30_c Geophysical Fluid Dynamics Laboratory,Princeton, New Jersey
IS92d Delworth et al. [2002]
ECHAM3/LSG Max Planck Institute for Meteorology,Hamburg, Germany
IS92a Cubasch et al. [1997]
HADCM2 Hadley Centre for Climate Predictionand Research, Bracknell,United Kingdom
IS92d Johns et al. [1997]
NCAR1 National Center for Atmospheric Research,Boulder, Colorado
IS92a Meehl et al. [1996]
aAll were run in control mode and with observed equivalent CO2 and tropospheric aerosols for the past and withthe specified future forcing scenario [Houghton et al., 1994].
ACL 1 - 10 ROBOCK ET AL.: EURASIAN LAND SURFACE AND INDIAN MONSOON RAINFALL

model simulations have been conducted, and more recentversions of some these models are now being used. Resultsfrom improved models may change the conclusions here,but that analysis is for future work.
7. Summary and Discussion
[30] All the snow cover patterns shown here are bynecessity along the edge of the winter snow pack, wheresnow cover varies from one year to the next. Snow depth
might vary in the interior of the snow cover without affectingthe extent. However, Kripalani and Kulkarni [1999] usedsnow depth data for the former Soviet Union and producedpatterns very similar to the snow cover patterns shown by usand by Bamzai and Shukla [1999], so the use of snow extentshould not be a limiting factor in our discussion.[31] Liu and Yanai [2001] have recently shown that
simultaneous tropospheric temperatures over Eurasia andtropical convection over Africa are related to the amount ofIndian summer monsoon rainfall. They did not find a strong
Figure 11. The 21-year running mean correlation between NAO and AIR for observations (repeatingcurve in Figure 9) and for control runs of four general circulation models (GCMs) (Table 1). See colorversion of this figure at back of this issue.
Figure 12. The 21-year running mean correlation between NAO and AIR for observations (repeatingcurve in Figure 9) and for runs of four GCMs (Table 1) forced with observed equivalent CO2 andtropospheric aerosols for the past and Intergovernmental Panel on Climate Change scenarios (Table 1)[Houghton et al., 1994] for the future. Three different Geophysical Fluid Dynamics Laboratory ensemblemembers are shown. See color version of this figure at back of this issue.
ROBOCK ET AL.: EURASIAN LAND SURFACE AND INDIAN MONSOON RAINFALL ACL 1 - 11
relationship between spring Eurasian surface temperaturesand the summer monsoon and suggest that therefore sum-mer sea surface temperatures play the strongest role. Never-theless, the winter snow cover and atmospheric circulationprecursors we found here must exert their influence throughsome physical energy storage mechanism in the climatesystem. This mechanism remains to be explained.[32] Because soil moisture memory is very short, we
cannot use soil moisture as a bridge to link snow cover inthe winter and the subsequent Indian summer monsoon, assuggested by Bamzai and Shukla [1999]. Then how can weexplain the close relationship between the preceding winterand spring snow cover and Indian summer monsoon rainfallfor some periods? Anomalous atmospheric circulation inthe previous winter and spring may play an important rolein the development of the land-ocean thermal contrastbefore the Indian summer monsoon. However, why doesthe atmospheric circulation anomaly persist for so longfrom the winter through the spring? Does the snow-albedofeedback [Barnett et al., 1989; Yasunari et al., 1991] orsnow-circulation interaction [Cohen and Entekhabi, 1999]produce this result? This needs further study.[33] Kumar et al. [1999] and Chang et al. [2001] both
noted the decreasing relationship between AIR and JJASSTA in the Nino 3.4 region in the recent several decades.They attribute it to global warming, as manifested by theglobal temperature trends and tendency of NAO to be in amore positive mode the past several decades. By examiningdata for a much longer period, we present a larger perspec-tive on this issue. Since the high correlation of AIR withNAO began in the 1960s, but the weak correlation of AIRwith SSTA only began after 1980, the weakening relation-ship between AIR and SSTA cannot be simply attributed todisturbance by the NAO. For the past 20 years, neither hasbeen highly correlated with AIR. Also, climate modelsimulations do not show an upward trend in NAO-AIRcorrelations induced by global warming nor a consistentpattern in response to climate change.[34] As the strength of the monsoon is influenced by the
difference between the land and the ocean thermal condi-tions, it is not unexpected for the SSTs to play a role.However, it is surprising that this data analysis shows such aprominent role for the land in the recent several decades andprovides an index half a year in advance that is related to thesummer monsoon. However, this situation has changed inthe past 2 decades. Clearly, more work is needed to explainthese relationships.
[35] Acknowledgments. We thank Anjuli Bamzai, G. Srinivasan,Georgiy Stenchikov, the reviewers, and the Editor for valuable commentson the manuscript. This work was supported by NSF grant ATM-0083165.
ReferencesAmbaum, M. H. P., B. J. Hoskins, and D. B. Stephenson, Arctic oscillationor North Atlantic Oscillation?, J. Clim., 14, 3495–3507, 2001.
Bamzai, A. S., and J. Shukla, Relation between Eurasian snow cover, snowdepth, and the Indian summer monsoon: An observational study, J. Clim.,12, 3117–3132, 1999.
Barnett, T. P., L. Dumenil, U. Schlese, E. Roeckner, and M. Latif, Theeffect of Eurasian snow cover on regional and global climate variations,J. Atmos. Sci., 46, 661–685, 1989.
Becker, B. D., J. M. Slingo, L. Ferranti, and F. Molteni, Seasonal predict-ability of the Indian summer monsoon: What role do land–surface con-ditions play?, Mausam, 52, 175–190, 2001.
Blanford, H. F., On the connexion of the Himalaya snowfall with dry windsand seasons of drought in India, Proc. R. Soc. London, 37, 1–23, 1884.
Chang, C.-P., P. Harr, and J. Ju, Possible roles of Atlantic circulations on theweakening Indian monsoon rainfall-ENSO relationship, J. Clim., 14,2376–2380, 2001.
Clark, C. O., J. E. Cole, and P. J. Webster, Indian Ocean SST and Indiansummer rainfall: Predictive relationships and their decadal variability,J. Clim., 13, 2503–2519, 2000.
Clark, M. P., M. C. Serreze, and D. A. Robinson, Atmospheric controls onEurasian snow extent, Int. J. Climatol., 19, 27–40, 1999.
Cohen, J., and D. Entekhabi, Eurasian snow cover variability and NorthernHemisphere climate predictability, Geophys. Res. Lett., 26, 345–348,1999.
Cubasch, U., R. Voss, G. C. Hegerl, J. Waszkewitz, and T. J. Crowley,Simulation of the influence of solar radiation variations on the globalclimate with an ocean-atmosphere general circulation model, Clim. Dyn.,13, 757–767, 1997.
Delworth, T. L., R. J. Stouffer, K. W. Dixon, M. J. Spelman, T. R. Knutson,A. J. Broccoli, P. J. Kushner, and R. T. Wetherald, Simulation of climatevariability and change by the GFDL R30 coupled climate model, Clim.Dyn., 19, 555–574, 2002.
Entin, J. K., A. Robock, K. Y. Vinnikov, S. E. Hollinger, S. Liu, andA. Namkhai, Temporal and spatial scales of observed soil moisture var-iations in the extratropics, J. Geophys. Res., 105, 11,865–11,877, 2000.
Gershunov, A., N. Schneider, and T. Barnett, Low-frequency modulation ofthe ENSO-Indian monsoon rainfall relationship: Signal or noise?,J. Clim., 14, 2486–2492, 2001.
Gowariker, V., V. Thapliyal, R. P. Sarkeer, G. S. Mandal, and D. R. Sikka,Parametric and power regression models: New approach to long rangeforecasting of monsoon rainfall in India, Mausam, 40, 115–122, 1989.
Gowariker, V., V. Thapliyal, S. M. Kulshrestha, G. S. Mandal, N. Sen Roy,and D. R. Sikka, A power regression model for long range forecast ofsouthwest monsoon rainfall over India, Mausam, 42, 125–130, 1991.
Hahn, D. G., and J. Shukla, An apparent relationship between the Eurasiansnow cover and Indian monsoon rainfall, J. Atmos. Sci., 33, 2461–2462,1976.
Horel, J. D., and J. M. Wallace, Planetary-scale atmospheric phenomenaassociated with the Southern Oscillation, Mon. Weather Rev., 109, 813–829, 1981.
Houghton, J. T., L. G. Meira Filho, J. Bruce, H. Lee, B. A. Callender,E. Haites, N. Harris, and K. Maskell (Eds.), Radiative Forcing of ClimateChange and an Evaluation of the IPCC IS92 Emissions Scenarios, 339pp., Cambridge Univ. Press, New York, 1994.
Hurrell, J. W., Decadal trends in the North Atlantic Oscillation: Regionaltemperatures and precipitation, Science, 269, 676–679, 1995.
Johns, T. C., R. E. Carnell, J. F. Crossley, J. M. Gregory, J. F. B. Mitchell,C. A. Senior, S. F. B. Tett, and R. A. Wood, The second Hadley Centrecoupled ocean-atmosphere GCM: Model description, spinup and valida-tion, Clim. Dyn., 13, 103–134, 1997.
Jones, P. D., T. Jonsson, and D. Wheeler, Extension to the North AtlanticOscillation using early instrumental pressure observations from Gibraltarand south-west Iceland, Int. J. Climatol., 17, 1433–1450, 1997.
Kistler, R., et al., The NCEP-NCAR 50-year reanalysis: Monthly meansCD-ROM and documentation, Bull. Am. Meteorol. Soc., 82, 247–267,2001.
Kripalani, R. H., and A. Kulkarni, Climatology and variability of historicalSoviet snow depth data: Some new perspective in snow-Indian monsoonteleconnections, Clim. Dyn., 15, 475–489, 1999.
Kumar, K. K., B. Rajagopalan, and M. A. Cane, On the weakening relation-ship between the Indian monsoon and ENSO, Science, 284, 2156–2159,1999.
Li, C., and M. Yanai, The onset and international variability of the Asiansummer monsoon in relation to land-sea thermal contrast, J. Clim., 9,358–375, 1996.
Liu, X., and M. Yanai, Relationship between the Indian monsoon rainfalland the tropospheric temperature over the Eurasian continent, Q. J. R.Meteorol. Soc., 127, 909–937, 2001.
Livezey, R. E., and W. Y. Chen, Statistical field significance and its deter-mination by Monte Carlo techniques, Mon. Weather Rev., 111, 46–59,1983.
Matsuyama, H., and K. Masuda, Seasonal/interannual variations of soilmoisture in the former USSR and its relationship to Indian summermonsoon rainfall, J. Clim., 11, 652–658, 1998.
Meehl, G. A., W. M. Washington, D. J. Erickson III, B. P. Briegleb, and P. J.Jaumann, Climate change from increased CO2 and the direct and indir-ect effects of sulfate aerosols, Geophys. Res. Lett., 23, 3755–3758,1996.
Parker, D. E., C. K. Folland, and M. Jackson, Marine surface temperature:Observed variations and data requirements, Clim. Change, 31, 559–600,1995.
ACL 1 - 12 ROBOCK ET AL.: EURASIAN LAND SURFACE AND INDIAN MONSOON RAINFALL

Parthasarathy, B., A. A. Munot, and D. R. Kothawale, Monthly and seaso-nal rainfall series for all-India homogeneous regions and meteorologicalsubdivisions: 1871–1994, in Contributions From Indian Institute of Tro-pical Meteorology, Res. Rep. RR-065, 113 pp., Indian Inst. of Trop.Meteorol., Pune, 1995.
Rasmusson, E. M., and T. H. Carpenter, The relationship between the east-ern Pacific sea surface temperature and rainfall over India and Sri Lanka,Mon. Weather Rev., 111, 517–528, 1983.
Robinson, D. A., Weekly Northern Hemisphere snow maps: 1966–1999,Proceedings of the 12th Conference on Applied Climatology, Asheville,NC, p. 12, Am. Meteorol. Soc., Boston, Mass., 2000.
Robinson, D. A., K. F. Dewey, and R. R. Heim Jr., Global snow covermonitoring: An update, Bull. Am. Meteorol. Soc., 74, 1689–1696, 1993.
Robock, A., Ice and snow feedbacks and the latitudinal and seasonal dis-tribution of climate sensitivity, J. Atmos. Sci., 40, 986–997, 1983.
Robock, A., and J. Mao, The volcanic signal in surface temperature ob-servations, J. Clim., 8, 1086–1103, 1995.
Robock, A., C. A. Schlosser, K. Y. Vinnikov, N. A. Speranskaya, J. K.Entin, and S. Qiu, Evaluation of AMIP soil moisture simulations, GlobalPlanet. Change, 19, 181–208, 1998.
Robock, A., K. Y. Vinnikov, G. Srinivasan, J. K. Entin, S. E. Hollinger,N. A. Speranskaya, S. Liu, and A. Namkhai, The Global Soil MoistureData Bank, Bull. Am. Meteorol. Soc., 81, 1281–1299, 2000. (data avail-able at http://climate.envsci.rutgers.edu/soil_moisture)
Schneider, S. H., and R. E. Dickinson, Climate modeling, Rev. Geophys.,12, 447–493, 1974.
Shinoda, M., Climate memory of snow mass as soil moisture over centralEurasia, J. Geophys. Res., 106, 33,393–33,403, 2001.
Thompson, D. W. J., and J. M. Wallace, The Arctic Oscillation signature inthe wintertime geopotential height and temperature fields, Geophys. Res.Lett., 25, 1297–1300, 1998.
Vinnikov, K. Y., and A. Robock, Trends in moments of climatic indices,Geophys. Res. Lett., 29(2), 10.1029/2001GL014025, 2002.
Vinnikov, K. Y., A. Robock, N. A. Speranskaya, and C. A. Schlosser,Scales of temporal and spatial variability of midlatitude soil moisture,J. Geophys. Res., 101, 7163–7174, 1996.
Walker, G. R., Correlations in seasonal variations of weather II, Mem.Indian Meteorol. Dep., 21, 22–45, 1910.
Wallace, J. M., and D. S. Gutzler, Teleconnections in the geopotentialheight field during the Northern Hemisphere winter, Mon. WeatherRev., 109, 784–812, 1981.
Yang, S., and K.-M. Lau, Influences of sea surface temperature and groundwetness on Asian summer monsoon, J. Clim., 11, 3230–3246, 1998.
Yasunari, T., A. Kitoh, and T. Tokioka, Local and remote responses toexcessive snow mass over Eurasia appearing in the northern spring andsummer climate-A study with the MRI GCM, J. Meteorol. Soc. Jpn., 69,473–487, 1991.
�����������������������M. Mu and A. Robock, Department of Environmental Sciences, Rutgers
University, 14 College Farm Road, New Brunswick, NJ 08901-8551, USA.([email protected]; [email protected])D. Robinson, Department of Geography, Rutgers University, Piscataway,
NJ 08854-8054, USA. ([email protected])K. Vinnikov, Department of Meteorology, University of Maryland,
College Park, MD 20742, USA. ([email protected])
ROBOCK ET AL.: EURASIAN LAND SURFACE AND INDIAN MONSOON RAINFALL ACL 1 - 13

Figure 2. Composites of snow cover and soil moisture patterns for the winters and springs precedingsummers of high all-India rainfall minus those of low all-India rainfall for the period 1967–2000. Areassignificantly different from zero are stippled.
ACL 1 - 3
ROBOCK ET AL.: EURASIAN LAND SURFACE AND INDIAN MONSOON RAINFALL

Figure 5. Composites of surface air temperature (�C), sea level pressure (hPa), and 500 hPa and 50 hPageopotential height (m) patterns for winters (DJF) preceding summers of high all-India rainfall minusthose of low all-India rainfall for the period 1950–2000. Areas significantly different from zero arestippled (color version) or shaded (black and white version).
ACL 1 - 6
ROBOCK ET AL.: EURASIAN LAND SURFACE AND INDIAN MONSOON RAINFALL

Figure 6. Correlations between detrended snow cover for 2-month periods indicated and the winter(DJF) North Atlantic Oscillation index for the period 1967–2000. Areas significantly different from zeroand their significance levels are indicated.
ACL 1 - 7
ROBOCK ET AL.: EURASIAN LAND SURFACE AND INDIAN MONSOON RAINFALL

Figure 11. The 21-year running mean correlation between NAO and AIR for observations (repeatingcurve in Figure 9) and for control runs of four general circulation models (GCMs) (Table 1).
Figure 12. The 21-year running mean correlation between NAO and AIR for observations (repeatingcurve in Figure 9) and for runs of four GCMs (Table 1) forced with observed equivalent CO2 andtropospheric aerosols for the past and Intergovernmental Panel on Climate Change scenarios (Table 1)[Houghton et al., 1994] for the future. Three different Geophysical Fluid Dynamics Laboratory ensemblemembers are shown.
ACL 1 - 11
ROBOCK ET AL.: EURASIAN LAND SURFACE AND INDIAN MONSOON RAINFALL