Land Degradation Model Based on Vegetation and Erosion Aspects
16
ITB J. Sci., V Received October15 th , 2010, Re Copyright © 2012 Published by Land Degradatio Aspec Adhi Wibowo 1 , Ishak 1 R&D Cen 2 Department of Geodesy Abstract. The study o world using remote because it has been pr Kalimantan province intensive exploitation proposed in this study ETM+ imagery, both two aspects: erosion a of suppression of veg of Spectral Angle M from erosion predictio latter is said as a func value. Based on the v Degradation Index of degradation, especially at very-slightly to ve body, swamp or river. Keywords: ASTER; ero Mapper. 1 Introduction Land degradation throu for the 21 st century beca environment, and its e addition to natural disa human activities wh deforestation, industry These human activities to erosion processes, m erosion is also a natu geologic process asso Vol. 44 A, No. 1, 2012, 19-34 evised June 8 th , 2011, Accepted for publication October 25 th , 2011. y LPPM ITB, ISSN: 1978-3043, DOI: 10.5614/itbj.sci.2012.44.1.3 on Model Based on Vegetation and Er cts Using Remote Sensing Data H Ismullah 2 , Bobby S Dipokusumo 2 & Ketut Wika nter for Coal and Mineral Technology, Indonesia y and Geomatics, Institute of Technology Bandung, In Email: [email protected] of land degradation in various geographic conditions sensing is still become a concern amongst resear roven as one of the most effective ways. In Indonesia is one of the experiencing land area degradation d n of natural resouces since 1970. The degradation m y is modeled using a combination of ASTER and La taken on February 27, 2001. The model composed of aspect and vegetation aspect. Vegetation aspect is a fun getation from Crippen and Blom method and spectral Mapper (SAM) algorithm. The erosion aspect is calcu on and depends on the constant factors of b as well, an ction of Normalized Difference Vegetation Index (N validation using spectral based degradation map and Chikhaoui et al, our model proves the ability to map y to better distinguish the classification of land degrad ery-severe intensity and the ability to differentiate . osion; land degradation, Landsat ETM+; Spectra ughout the world will remain an important glob ause of its adverse impact on agronomic producti effect on food security and the quality of life asters, it is known that land degradation is induce hich are agricultural mismanagement, over and urbanization etc. s will then create a substantial amount of soil lo mainly because of loss of vegetation cover. Altho urally occurring process on all land and it is ociated with geologic cycle, very often those 19 rosion antika 2 ndonesia in the rchers a, East due to model andsat f both nction angle ulated nd the NDVI) Land p land dation water al Angle bal issue ivity, the e [1]. In ed by the rgrazing, osses due ough soil s normal e human
Transcript of Land Degradation Model Based on Vegetation and Erosion Aspects
ITB J. Sci., Vol. 4
Received October15th, 2010, Revised Copyright © 2012 Published by LPPM ITB,
Land Degradation Model Based on Vegetation and Erosion Aspects Using Remote Sensing Data
Adhi Wibowo1, Ishak H Ismullah
1R&D Center for Coal and 2Department of Geodesy and Geomatics, Institute of Technology Bandung, Indonesia
Abstract. The study of land degradation in various geographic conditions in the world using remote sensing is sbecause it has been proven asKalimantan province iintensive exploitation of natural resouces since 1970proposed in this study is ETM+ imagery, both taken on February 27, 200two aspects: erosion aspect and vegetation aspect. of suppression of vegetation of Spectral Angle Mapper (SAM) algorithmfrom erosion predictionlatter is said as a function of Normalized Difference Vegetation Index (NDVI) value. Based on the validation using spectral Degradation Index of degradation, especially toat very-slightly to verybody, swamp or river.
Keywords: ASTER; erosionMapper.
1 Introduction
Land degradation throughout the world will remain an important global issue for the 21st century because of its adverse impact on agronomic environment, and its effect on food security and the quality of life addition to natural disasthuman activities which are agricultural mismanagement, overgrazingdeforestation, industry and urbanization etc.
These human activities will then create a substantial amount of soil losses due to erosion processes, mainly because of loss of vegetation cover. Although soil erosion is also a naturally occurring process on all land and it is normal geologic process associated with geologic cycle, very often those human
ITB J. Sci., Vol. 44 A, No. 1, 2012, 19-34
, Revised June 8th, 2011, Accepted for publication October 25th, 2011.Published by LPPM ITB, ISSN: 1978-3043, DOI: 10.5614/itbj.sci.2012.44.1.3
Land Degradation Model Based on Vegetation and Erosion Aspects Using Remote Sensing Data
, Ishak H Ismullah2, Bobby S Dipokusumo2 & Ketut Wikantika
R&D Center for Coal and Mineral Technology, IndonesiaDepartment of Geodesy and Geomatics, Institute of Technology Bandung, Indonesia
Email: [email protected]
he study of land degradation in various geographic conditions in the world using remote sensing is still become a concern amongst researchers
has been proven as one of the most effective ways. In Indonesia, Kalimantan province is one of the experiencing land area degradation due to intensive exploitation of natural resouces since 1970. The degradation model proposed in this study is modeled using a combination of ASTER and Landsat
both taken on February 27, 2001. The model composed of both erosion aspect and vegetation aspect. Vegetation aspect is a function
ion of vegetation from Crippen and Blom method and spectral angle Spectral Angle Mapper (SAM) algorithm. The erosion aspect is calculated erosion prediction and depends on the constant factors of b as well, and the
said as a function of Normalized Difference Vegetation Index (NDVI) Based on the validation using spectral based degradation map and Land
of Chikhaoui et al, our model proves the ability to map laespecially to better distinguish the classification of land degradation
slightly to very-severe intensity and the ability to differentiate water body, swamp or river.
erosion; land degradation, Landsat ETM+; Spectral Angle
degradation throughout the world will remain an important global issue century because of its adverse impact on agronomic productivity, the
environment, and its effect on food security and the quality of life addition to natural disasters, it is known that land degradation is induced by the human activities which are agricultural mismanagement, overgrazingdeforestation, industry and urbanization etc.
These human activities will then create a substantial amount of soil losses due osion processes, mainly because of loss of vegetation cover. Although soil
erosion is also a naturally occurring process on all land and it is normal geologic process associated with geologic cycle, very often those human
19
Land Degradation Model Based on Vegetation and Erosion
Ketut Wikantika2
Department of Geodesy and Geomatics, Institute of Technology Bandung, Indonesia
he study of land degradation in various geographic conditions in the till become a concern amongst researchers
one of the most effective ways. In Indonesia, East due to
. The degradation model ASTER and Landsat
composed of both Vegetation aspect is a function
spectral angle is calculated
and the said as a function of Normalized Difference Vegetation Index (NDVI)
degradation map and Land the ability to map land
of land degradation severe intensity and the ability to differentiate water
Spectral Angle
degradation throughout the world will remain an important global issue productivity, the
environment, and its effect on food security and the quality of life [1]. In ers, it is known that land degradation is induced by the
human activities which are agricultural mismanagement, overgrazing,
These human activities will then create a substantial amount of soil losses due osion processes, mainly because of loss of vegetation cover. Although soil
erosion is also a naturally occurring process on all land and it is normal geologic process associated with geologic cycle, very often those human
20 Adhi Wibowo, et al.
activities are exaggerated soil erosion processes. These many processes which mainly induced by human activities, are responsible for land degradation and itcan operate individually, simultaneously, successively, or in varying combination, resulting a more difficult condition to study. In addition, degraded land is not merely an environmental issue, but has social and economic implications as well. Therefore, it is essential to study land degradation process[2].
Attempts to understand the degradation problem using geospatial techniques is still continuing elsewhere, particularly using remote sensing technology [3-7]. However, most approach is still focused through single aspect only, either based on vegetation aspect of decreasing canopy cover [8,6,9] or based on erosion aspect [7,10,11]. Hence this study is aimed to better understand the land degradation, by modeling based on both aspects, i.e. vegetation aspect and erosion aspect, using remote sensing. Case study was conducted in East Kalimantan, Indonesia, where significant land degradation and deforestation was reported as one with the fastest rate in the world [12-15].
2 Materials and Methods
2.1 Study Area
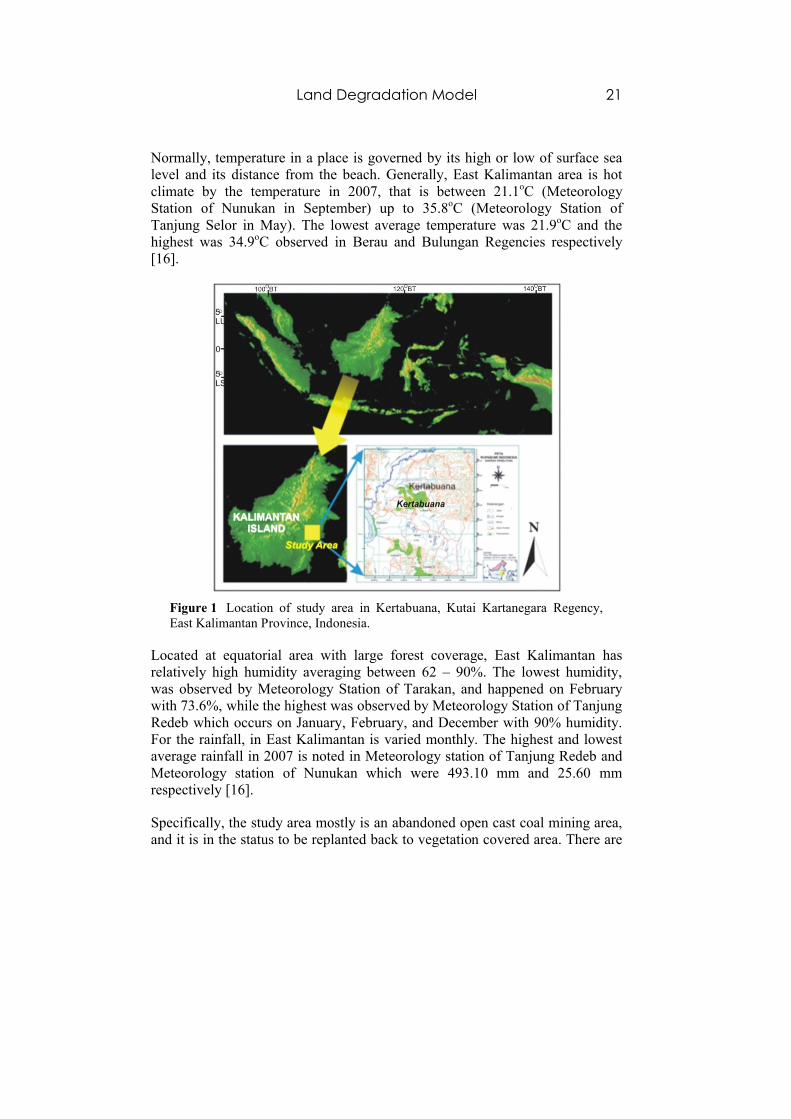
The study area is conducted around Kertabuana, East Kalimantan Province, Kalimantan Island (Figure 1). The East Kalimantan Province is one of development gates in East Indonesia. The region, which is known as timber storehouse and mining, has hundreds of rivers spread to almost all of regency/city and used as main transportation beside land transportation, and the largest river is Mahakam River. East Kalimantan also has group of mountains and hills in almost all of regencies. There are 18 lakes in East Kalimantan, most of them are located in Kutai Kartanegara Regency. The two largest lakes are Lake Semayang and Lake Melintang by each of which are 13,000 hectare, and 11,000 hectare respectively [16].
Like other Indonesian area, climate of East Kalimantan is tropic, and has two season which are dry season and rainy season. Dry season is usually happened on May until October, while rainy season is happened on November until April. This condition is happened every year that alternated by change of season on certain months. However, in the recent years, the condition of season in East Kalimantan can not be predicted as usual. In the rainy season, supposed to fall rain, it was no rain. On the contrary, in the dry season, supposed not to fall rain, it rains in a long time.
Land Degradation Model 21
Normally, temperature in a place is governed by its high or low of surface sea level and its distance from the beach. Generally, East Kalimantan area is hot climate by the temperature in 2007, that is between 21.1oC (Meteorology Station of Nunukan in September) up to 35.8oC (Meteorology Station of Tanjung Selor in May). The lowest average temperature was 21.9oC and the highest was 34.9oC observed in Berau and Bulungan Regencies respectively[16].
Figure 1 Location of study area in Kertabuana, Kutai Kartanegara Regency,East Kalimantan Province, Indonesia.
Located at equatorial area with large forest coverage, East Kalimantan has relatively high humidity averaging between 62 – 90%. The lowest humidity, was observed by Meteorology Station of Tarakan, and happened on February with 73.6%, while the highest was observed by Meteorology Station of Tanjung Redeb which occurs on January, February, and December with 90% humidity. For the rainfall, in East Kalimantan is varied monthly. The highest and lowest average rainfall in 2007 is noted in Meteorology station of Tanjung Redeb and Meteorology station of Nunukan which were 493.10 mm and 25.60 mm respectively [16].
Specifically, the study area mostly is an abandoned open cast coal mining area, and it is in the status to be replanted back to vegetation covered area. There are
22 Adhi Wibowo, et al.
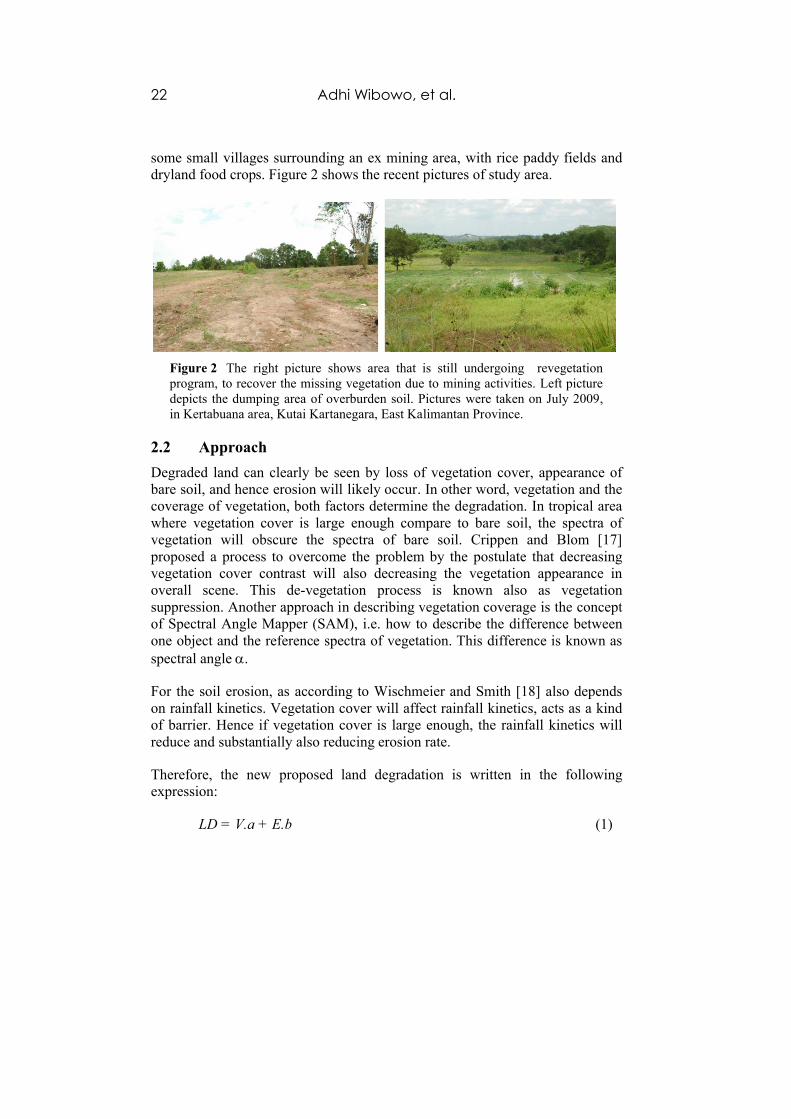
some small villages surrounding an ex mining area, with rice paddy fields and dryland food crops. Figure 2 shows the recent pictures of study area.
Figure 2 The right picture shows area that is still undergoing revegetation program, to recover the missing vegetation due to mining activities. Left picture depicts the dumping area of overburden soil. Pictures were taken on July 2009, in Kertabuana area, Kutai Kartanegara, East Kalimantan Province.
2.2 Approach
Degraded land can clearly be seen by loss of vegetation cover, appearance of bare soil, and hence erosion will likely occur. In other word, vegetation and the coverage of vegetation, both factors determine the degradation. In tropical area where vegetation cover is large enough compare to bare soil, the spectra of vegetation will obscure the spectra of bare soil. Crippen and Blom [17]proposed a process to overcome the problem by the postulate that decreasing vegetation cover contrast will also decreasing the vegetation appearance in overall scene. This de-vegetation process is known also as vegetation suppression. Another approach in describing vegetation coverage is the concept of Spectral Angle Mapper (SAM), i.e. how to describe the difference between one object and the reference spectra of vegetation. This difference is known as spectral angle .
For the soil erosion, as according to Wischmeier and Smith [18] also depends on rainfall kinetics. Vegetation cover will affect rainfall kinetics, acts as a kind of barrier. Hence if vegetation cover is large enough, the rainfall kinetics will reduce and substantially also reducing erosion rate.
Therefore, the new proposed land degradation is written in the following expression:
LD = V.a + E.b (1)
Land Degradation Model 23
where:LD : land degradation;V.a : vegetation aspect;V : prediction of vegetation cover based on devegetation Crippen and
Blom;a : calculated angle mapper from SAM;E.b : erosion aspect;E : prediction of erosion;b : constant number as function of NDVI (normalized difference
vegetation index).
Nevertheless, NDVI is used as a predictor of constant b because it’s simplicity and remains the most well-known and used index to detect live green plant canopies in multispectral remote sensing data.
Devegetation Crippen and Blom is written as:
Pixel DNnew = pixel DNori . ( target DN/curve DNveg index ) (2)
pixel DNnew : pixel after devegetation;pixel DNori : pixel original before devegetation;target DN : mean of digital number in all bands;DNnew : digital number after devegetation;DNori : digital number before devegetation;curve DNveg index : curve plot each band to band ratio 4/3.
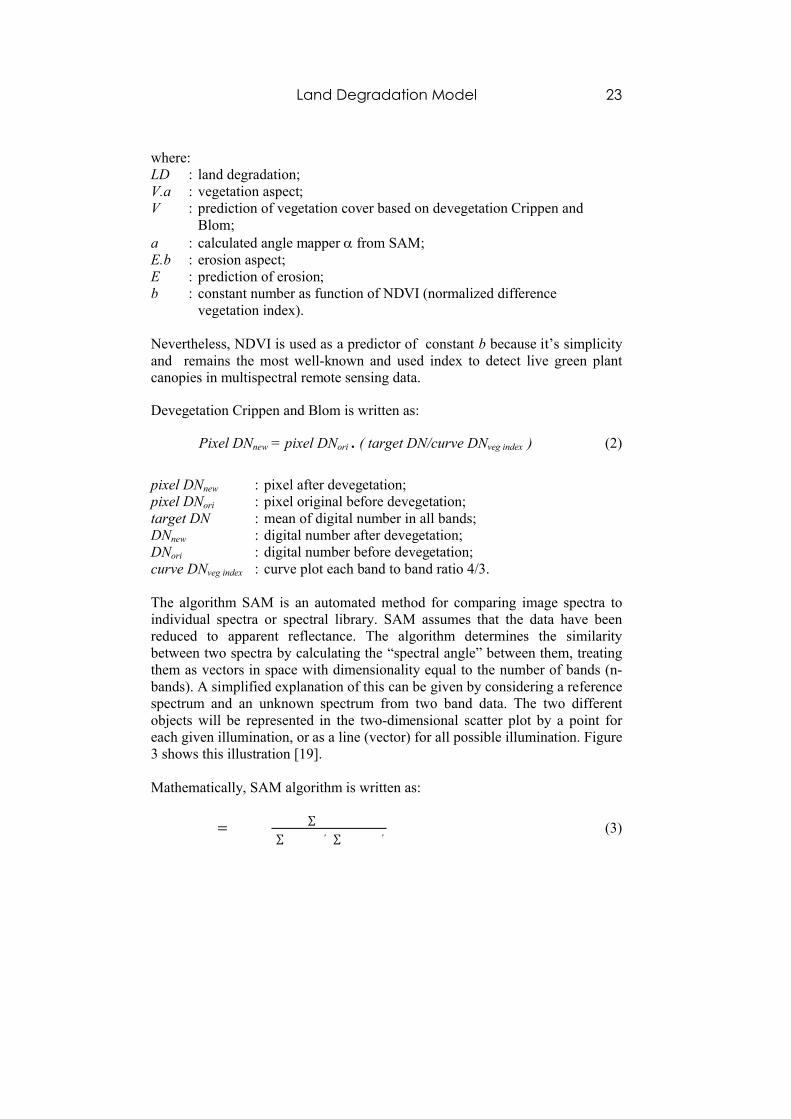
The algorithm SAM is an automated method for comparing image spectra to individual spectra or spectral library. SAM assumes that the data have been reduced to apparent reflectance. The algorithm determines the similarity between two spectra by calculating the “spectral angle” between them, treating them as vectors in space with dimensionality equal to the number of bands (n-bands). A simplified explanation of this can be given by considering a reference spectrum and an unknown spectrum from two band data. The two different objects will be represented in the two-dimensional scatter plot by a point for each given illumination, or as a line (vector) for all possible illumination. Figure 3 shows this illustration [19].
Mathematically, SAM algorithm is written as:
= ∑∑ , ∑ , (3)
24 Adhi Wibowo, et al.
where: spectral angle, in radian;t : unknown spectra vector; r : reference spectra vector;n : number of bands.
Figure 3 Two-dimensional example of Spectral Angle Mapper [19].
From the previous study [20] in the same area, prediction of erosion was performed using USLE and Honda model. Both model, calculated using ASTER and Landsat ETM+ data, give good results. However, the prediction of erosion using Honda erosion model calculated based on combined ASTER and Landsat ETM+ scene is slightly better.
Honda erosion model was proven its applicability in the soil erosion study in Mae Ao watershed in northern area of Thailand with hilly condition. This model is mainly governed by slope gradient and vegetation index, and the annual soil erosion rate E is defined as [21]:
= ( / ) . (4)
= ( − ) + (5)
where:S = gradient of the point under consideration;S30 = tan (30)o;E30 = rate of soil erosion at 30o slope.
To avoid negative value and for easy handling of digital data, NDVI value isrescaled as [21]:
= + 1 100 (6)
Land Degradation Model 25
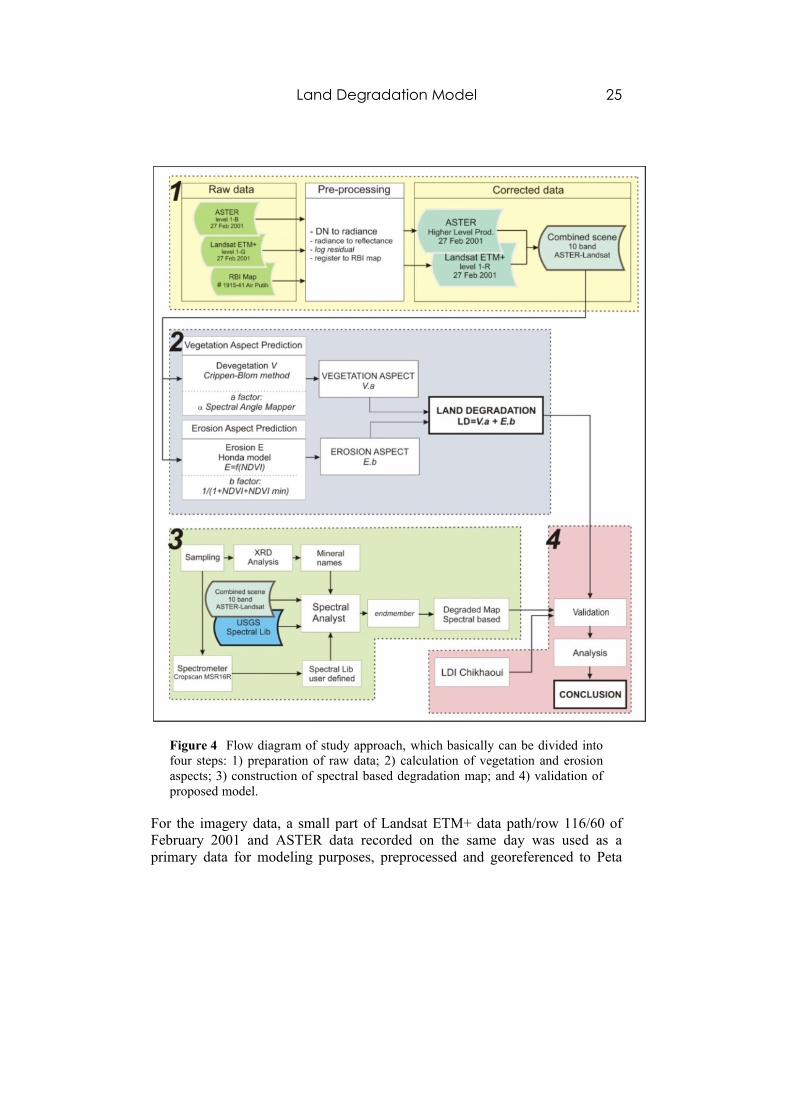
Figure 4 Flow diagram of study approach, which basically can be divided into four steps: 1) preparation of raw data; 2) calculation of vegetation and erosion aspects; 3) construction of spectral based degradation map; and 4) validation of proposed model.
For the imagery data, a small part of Landsat ETM+ data path/row 116/60 of February 2001 and ASTER data recorded on the same day was used as a primary data for modeling purposes, preprocessed and georeferenced to Peta
26
Rupabumi Indonesia, a digital version of geographic map of Indonesia produced by Bakosurtanal, Bogor, Indonesia. After conversion to spectral reflectance using the methods described by then resample to 15 m resolutiopanchromatic band to get 15m resolution. For topographic modeling, a DEM from automated processing of ASTER GDEM LPDAAC web site. Figure
3 Results and Discussion
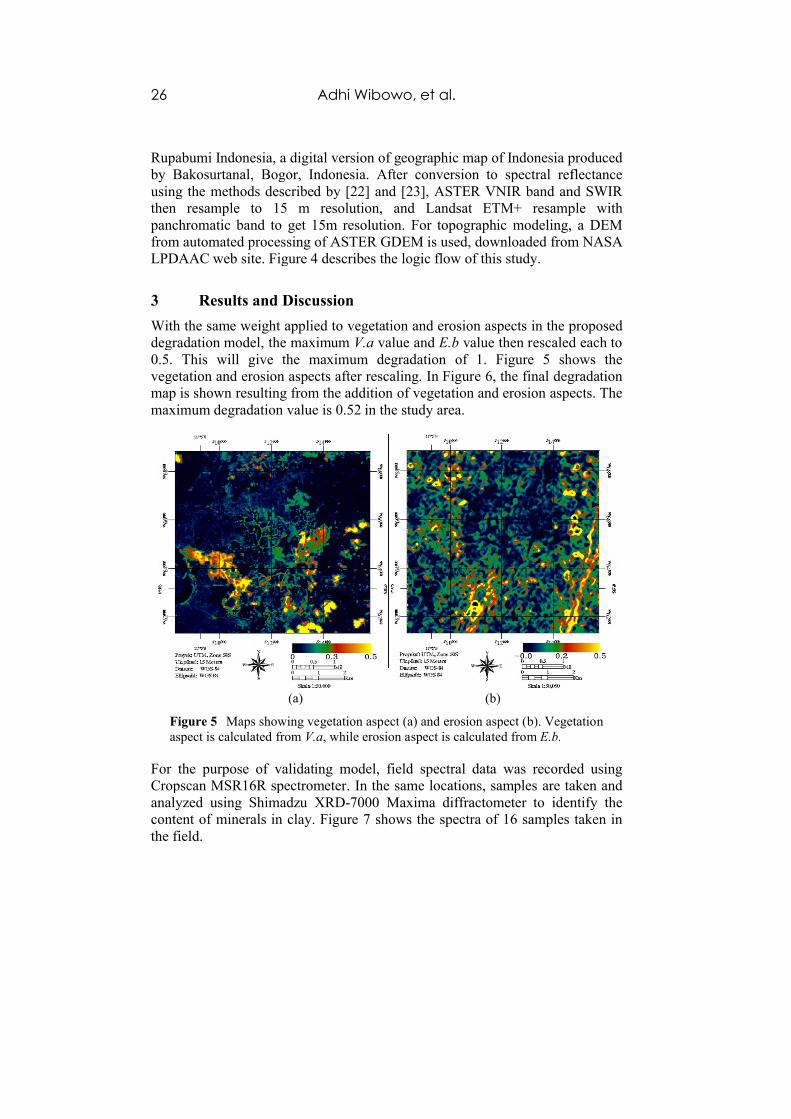
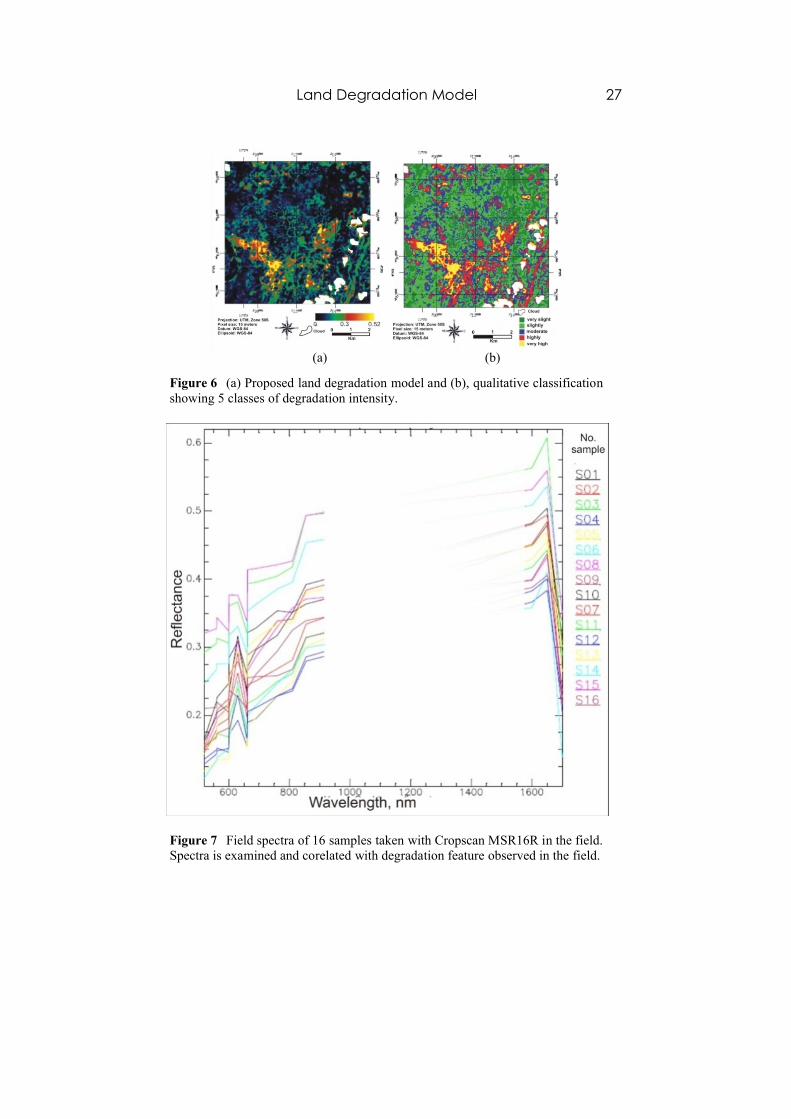
With the same weight applied to vegetation degradation model, the maximum 0.5. This will give the mavegetation and erosion aspmap is shown resulting from tmaximum degradation value is 0.52 in the study area.
Figure 5 Maps showing vegetation aspect (a) and erosion aspect (b). Vegetation aspect is calculated from
For the purpose of validating model, field spectral data was recorded using Cropscan MSR16R spectrometer. In the same locations, samples are taken and analyzed using Shimadzu XRDcontent of minerals in clay. Figurthe field.
Adhi Wibowo, et al.
Rupabumi Indonesia, a digital version of geographic map of Indonesia produced Bogor, Indonesia. After conversion to spectral reflectance
using the methods described by [22] and [23], ASTER VNIR band and SWIR then resample to 15 m resolution, and Landsat ETM+ resample with panchromatic band to get 15m resolution. For topographic modeling, a DEM from automated processing of ASTER GDEM is used, downloaded from NASA LPDAAC web site. Figure 4 describes the logic flow of this study.
Discussion
ht applied to vegetation and erosion aspects in the proposed degradation model, the maximum V.a value and E.b value then rescaled each to 0.5. This will give the maximum degradation of 1. Figure 5 shows the
on aspects after rescaling. In Figure 6, the final degradation map is shown resulting from the addition of vegetation and erosion aspectmaximum degradation value is 0.52 in the study area.
(a) (b)
ps showing vegetation aspect (a) and erosion aspect (b). Vegetation aspect is calculated from V.a, while erosion aspect is calculated from E.b.
For the purpose of validating model, field spectral data was recorded using Cropscan MSR16R spectrometer. In the same locations, samples are taken and analyzed using Shimadzu XRD-7000 Maxima diffractometer to identify the content of minerals in clay. Figure 7 shows the spectra of 16 samples taken in
Rupabumi Indonesia, a digital version of geographic map of Indonesia produced Bogor, Indonesia. After conversion to spectral reflectance
, ASTER VNIR band and SWIR n, and Landsat ETM+ resample with
panchromatic band to get 15m resolution. For topographic modeling, a DEM s used, downloaded from NASA
in the proposed value then rescaled each to
shows the , the final degradation
and erosion aspects. The
ps showing vegetation aspect (a) and erosion aspect (b). Vegetation
For the purpose of validating model, field spectral data was recorded using Cropscan MSR16R spectrometer. In the same locations, samples are taken and
7000 Maxima diffractometer to identify the shows the spectra of 16 samples taken in
Land Degradation Model 27
(a) (b)
Figure 6 (a) Proposed land degradation model and (b), qualitative classification showing 5 classes of degradation intensity.
Figure 7 Field spectra of 16 samples taken with Cropscan MSR16R in the field.Spectra is examined and corelated with degradation feature observed in the field.
28 Adhi Wibowo, et al.
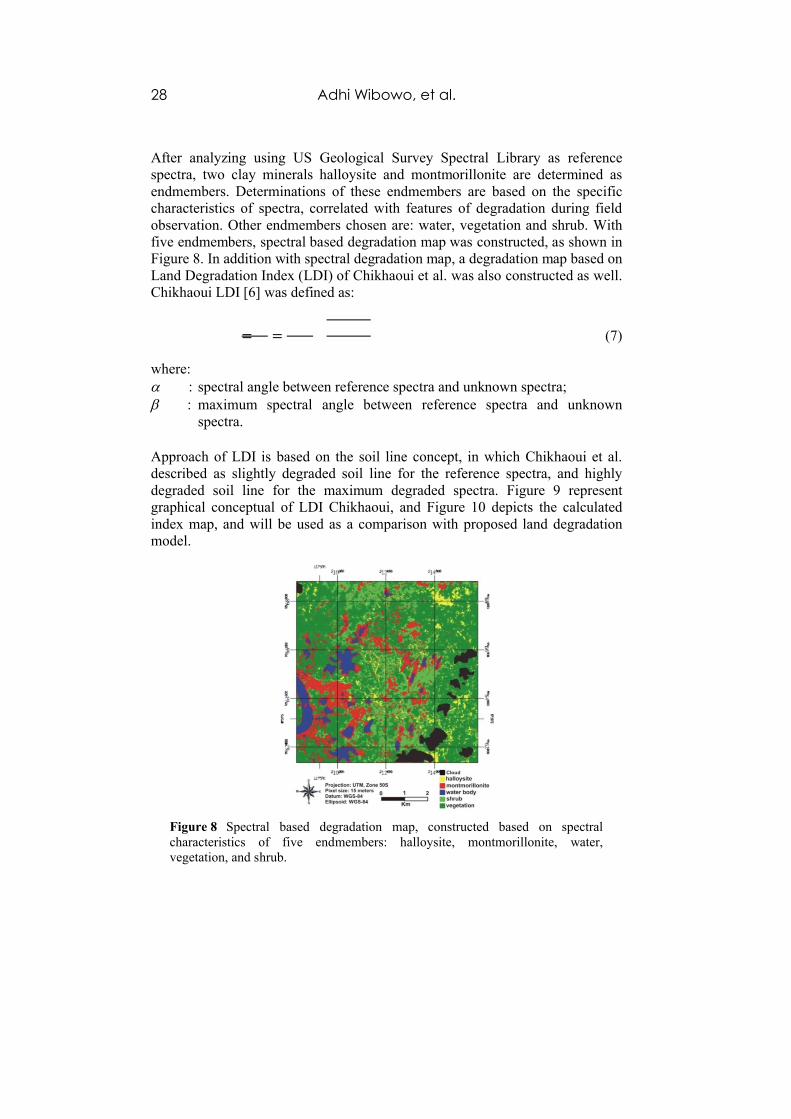
After analyzing using US Geological Survey Spectral Library as reference spectra, two clay minerals halloysite and montmorillonite are determined as endmembers. Determinations of these endmembers are based on the specific characteristics of spectra, correlated with features of degradation during field observation. Other endmembers chosen are: water, vegetation and shrub. With five endmembers, spectral based degradation map was constructed, as shown in Figure 8. In addition with spectral degradation map, a degradation map based on Land Degradation Index (LDI) of Chikhaoui et al. was also constructed as well. Chikhaoui LDI [6] was defined as:
= = (7)
where: : spectral angle between reference spectra and unknown spectra; maximum spectral angle between reference spectra and unknown
spectra.
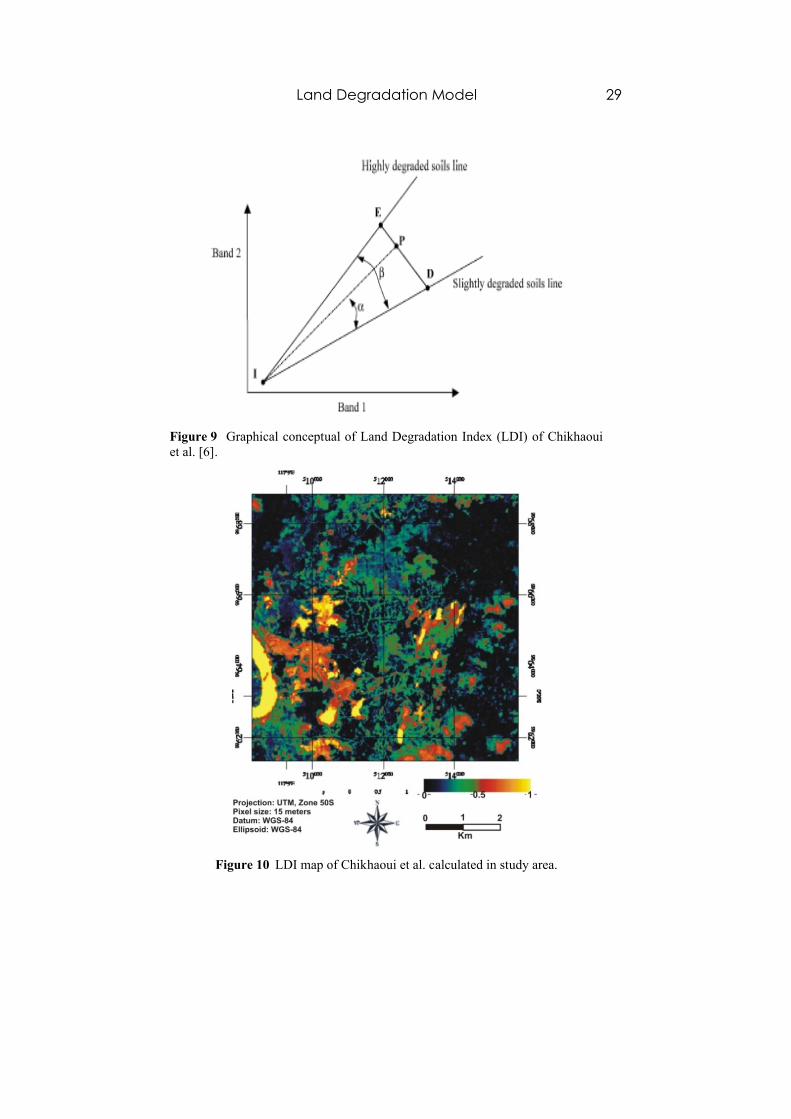
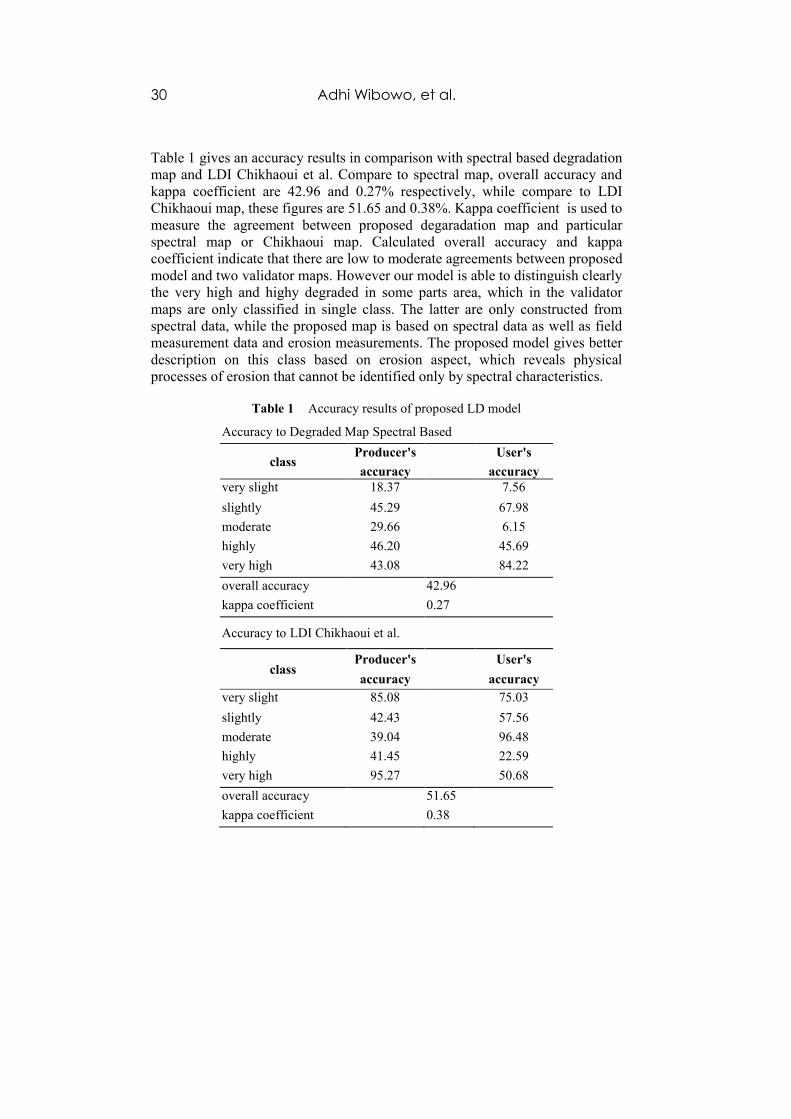
Approach of LDI is based on the soil line concept, in which Chikhaoui et al.described as slightly degraded soil line for the reference spectra, and highly degraded soil line for the maximum degraded spectra. Figure 9 represent graphical conceptual of LDI Chikhaoui, and Figure 10 depicts the calculated index map, and will be used as a comparison with proposed land degradation model.
Figure 8 Spectral based degradation map, constructed based on spectral characteristics of five endmembers: halloysite, montmorillonite, water, vegetation, and shrub.
Land Degradation Model 29
Figure 9 Graphical conceptual of Land Degradation Index (LDI) of Chikhaoui et al. [6].
Figure 10 LDI map of Chikhaoui et al. calculated in study area.
30 Adhi Wibowo, et al.
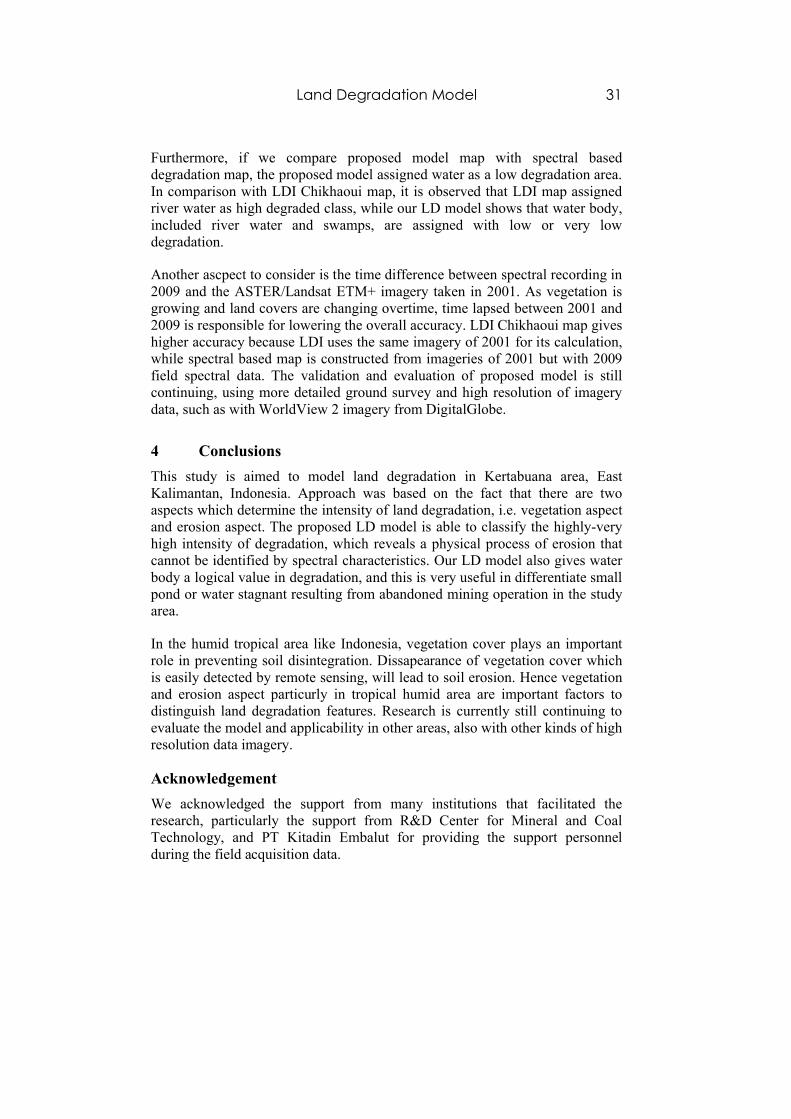
Table 1 gives an accuracy results in comparison with spectral based degradation map and LDI Chikhaoui et al. Compare to spectral map, overall accuracy and kappa coefficient are 42.96 and 0.27% respectively, while compare to LDI Chikhaoui map, these figures are 51.65 and 0.38%. Kappa coefficient is used to measure the agreement between proposed degaradation map and particular spectral map or Chikhaoui map. Calculated overall accuracy and kappa coefficient indicate that there are low to moderate agreements between proposed model and two validator maps. However our model is able to distinguish clearly the very high and highy degraded in some parts area, which in the validator maps are only classified in single class. The latter are only constructed from spectral data, while the proposed map is based on spectral data as well as field measurement data and erosion measurements. The proposed model gives better description on this class based on erosion aspect, which reveals physical processes of erosion that cannot be identified only by spectral characteristics.
Table 1 Accuracy results of proposed LD model
Accuracy to Degraded Map Spectral Based
classProducer's User's
accuracy accuracyvery slight 18.37 7.56
slightly 45.29 67.98
moderate 29.66 6.15
highly 46.20 45.69
very high 43.08 84.22
overall accuracy 42.96
kappa coefficient 0.27
Accuracy to LDI Chikhaoui et al.
classProducer's User's
accuracy accuracyvery slight 85.08 75.03
slightly 42.43 57.56
moderate 39.04 96.48
highly 41.45 22.59
very high 95.27 50.68
overall accuracy 51.65
kappa coefficient 0.38
Land Degradation Model 31
Furthermore, if we compare proposed model map with spectral based degradation map, the proposed model assigned water as a low degradation area.In comparison with LDI Chikhaoui map, it is observed that LDI map assigned river water as high degraded class, while our LD model shows that water body, included river water and swamps, are assigned with low or very low degradation.
Another ascpect to consider is the time difference between spectral recording in 2009 and the ASTER/Landsat ETM+ imagery taken in 2001. As vegetation is growing and land covers are changing overtime, time lapsed between 2001 and 2009 is responsible for lowering the overall accuracy. LDI Chikhaoui map gives higher accuracy because LDI uses the same imagery of 2001 for its calculation, while spectral based map is constructed from imageries of 2001 but with 2009 field spectral data. The validation and evaluation of proposed model is still continuing, using more detailed ground survey and high resolution of imagery data, such as with WorldView 2 imagery from DigitalGlobe.
4 Conclusions
This study is aimed to model land degradation in Kertabuana area, East Kalimantan, Indonesia. Approach was based on the fact that there are two aspects which determine the intensity of land degradation, i.e. vegetation aspect and erosion aspect. The proposed LD model is able to classify the highly-very high intensity of degradation, which reveals a physical process of erosion that cannot be identified by spectral characteristics. Our LD model also gives water body a logical value in degradation, and this is very useful in differentiate small pond or water stagnant resulting from abandoned mining operation in the study area.
In the humid tropical area like Indonesia, vegetation cover plays an important role in preventing soil disintegration. Dissapearance of vegetation cover which is easily detected by remote sensing, will lead to soil erosion. Hence vegetation and erosion aspect particurly in tropical humid area are important factors to distinguish land degradation features. Research is currently still continuing to evaluate the model and applicability in other areas, also with other kinds of high resolution data imagery.
Acknowledgement
We acknowledged the support from many institutions that facilitated the research, particularly the support from R&D Center for Mineral and Coal Technology, and PT Kitadin Embalut for providing the support personnel during the field acquisition data.
32 Adhi Wibowo, et al.
References
[1] Eswaran, H., Lal, R. & Reich, P.F., Land Degradation: An Overview, in Bridges, E.M., Hannam, I.D., Oldeman L.R., Pening de Vries, F.W.T., Sompatpanit, S., ed. Responses to Land Degradation, Proceedings 2nd
International Conference on Land Degradation and Desertification, Khon Kaen, Thailand, 2001.
[2] Qi, S. & Cai, Y., Mapping and Assessment of Degraded Land in the Heihe River Basin, Arid Northwestern China, Sensors, 7, pp. 2565-2578, 2007.
[3] Torrion, J.A., Land Degradation Detection, Mapping and Monitoring in the Lake Naivasha Basin, Kenya, M.Sc thesis, ITC, the Netherlands, 2002.
[4] Huete, A., Miura, T., Gao, X., Borghi, C. & Ojeda, R., Characterization of Land Degradation at the Ñacuñán Biosphere Reserve in Argentina with Aviris Data, ftp://popo.jpl.nasa.gov/pub/docs/ workshops/02_docs/ 2002_Huete_web.pdf, (10 March, 2006).
[5] Chabrillat, S., Kaufman, H., Palacios-Orueta, A. & Mueller, A., “Development of Land Degradation Spectral Indices in A Semi-Arid Mediterranean Ecosystem,” in Ehlers, M., Posa, F., Kaufmann, H.J., Michel, U. & De Carolis G. (ed.), Remote Sensing for Enviromental Monitoring, GIS Application, and Geology IV, Proceedings of SPIE, 5574, Washington, pp. 235-243, 2004.
[6] Chikhaoui, M., Bonn, F., Bokoye, A.I. & Merzouk, A., A Spectral Index for Land Degradation Mapping Using ASTER Data: Application to A Semi-Arid Mediterranean Catchment, International Journal of Applied Earth Observation and Geoinformation, 7, pp. 140-153, 2005.
[7] Symeonakis, E., Koukoulas, S., Calvo-Cases, A., Arnau-Rosalen, E. &Makris, I., A Landuse Change and Land Degradation Study in Spain and Greece Using Remote Sensing and GIS, Proceedings of XXth ISPRS Congress, Istanbul, Turkey, http://www.isprs.org/istanbul2004/comm7/ papers/110.pdf, (15 January, 2006).
[8] Wang, C., Qi, J. & Cochrane, M., Assessment of Tropical Forest Degradation With Canopy Fractional Cover from Landsat ETM+ and Ikonos Imagery, Earth Interactions, 9(22), 1-18, 2005.
[9] Wang, J., He, T., Li, Y., Chen, Y., & Chunyan, L., Hyperspectral Remote Sensing for Land Degradation Mapping in China, Proceedings of SPIE, 2nd International Conference on Earth Observation for Global Changes, 7471, pp. M1-M10, 2009.
Land Degradation Model 33
[10] de Jong, S.M., Application of Reflective Remote Sensing for Land Degradation Studies in a Mediterranean Environment, PhD dissertation, Dept. of Geography, Utrech University, the Netherlands, 1994.
[11] Haboudane, D., Bonn, F. & Royer, A., Land Degradation and Erosion Risk Mapping by Fusion of Spectrally-Based Information and Digital Geomorphometric Attributes, International Journal of Remote Sensing, 23(18), pp. 3795-3820, 2002.
[12] FWI/GFW, Keadaan Hutan Indonesia, Bogor, Indonesia: Forest Watch Indonesia and Washington D.C.: Global Forest Watch, US, 2001.
[13] Sunderlin, W.D., & Resosudarmo, I.A.P., Laju dan Penyebab Deforestasi di Indonesia: Penelaahan Kerancuan dan Penyelesaiannya, Occasional Paper No. 9 (1), Center for International Forestry Research, Bogor, Indonesia, 1997.
[14] Langner, A.J., Monitoring Tropical Forest Degradation and Deforestation in Borneo, Southeast Asia, PhD dissertation, GeoBio Center of the Ludwig-Maximilian-University, Munich, Germany, 2009.
[15] Rosenbarger, A., Community-based Forestry in Kalimantan: An Assessment of Authority, Policy, and Capacity, M.Sc thesis, Nicholas School of the Environment, Duke University, Durham, USA, 2009.
[16] Badan Pusat Statistik, Provinsi Kalimantan Timur, Kalimantan Timur Dalam Angka 2008, Samarinda, 2009.
[17] Crippen, R.E., & Blom, R.G., Unveiling the Lithology of Vegetated Terrains in Remotely Sensed Imagery, Photogrammetric Engineering & Remote Sensing, 67(8), pp. 935-943, 2001.
[18] Wischmeier, W.H., & Smith, D.D., Predicting Rainfall Erosion Losses: A Guide to Conservation Planning, Science and Education Administration, US Department of Agriculture, Washington DC, US, 1978.
[19] Research Systems, Inc., ENVI Tutorials, Boulder, Colorado, United States, 2004.
[20] Wibowo, A., Ismullah, I.H., Dipokusumo, B.S., & Wikantika, K., Pemodelan Degradasi Lahan Menggunakan Teknologi Remote Sensing Berbasis Komponen Vegetasi dan Komponen Erosi, Studi Kasus Wilayah Kertabuana, Kalimantan Timur, PhD dissertation, Dept. Of Geodesy and Geomatics, Institute Technology Bandung, Indonesia, 2010.
[21] Hazarika, M.K., & Honda, K., Estimation of Soil Erosion Using Remote Sensing and GIS, Its Valuation and Economic Implications on Agricultural Production, Sustaining the Global Farm, 10th International Soil Conservation Organization Meeting, Purdue University, USA, pp. 1090-1093, 1999.
34 Adhi Wibowo, et al.
[22] Abrams, M., & Hook, S., ASTER User Handbook, Version 2, Jet Propulsion Laboratory, Pasadena, United States, 1999.
[23] NASA, Landsat 7 Science Data Users Handbook, Chapter 11 – Data Products, http://landsathandbook.gsfc.nasa.gov/handbook/handbook_ html/chapter11/chapter11.html, (9 October 2005).