Land Availability and Responsible Agricultural Investments...
70
1 Land Availability and Responsible Agricultural Investments Food Security Challenges in the 21 st Century: Focus on SSA Mahendra Shah* and Gunther Fischer** •Director, Qatar National Food Security Programme and Senior Advisor, IIASA, ** Program Leader, Land Use Change and Sustainable Agriculture, IIASA Annual Bank Conference on Land Policy and Administration World Bank, Washington DC, 26-27th April 2010
Transcript of Land Availability and Responsible Agricultural Investments...

1
Land Availability and Responsible Agricultural Investments Food Security Challenges in the 21st Century: Focus on SSA
Mahendra Shah* and Gunther Fischer**•Director, Qatar National Food Security Programme and Senior Advisor, IIASA,
** Program Leader, Land Use Change and Sustainable Agriculture, IIASAAnnual Bank Conference on Land Policy and Administration
World Bank, Washington DC, 26-27th April 2010
2
WHY
HOW WHERE
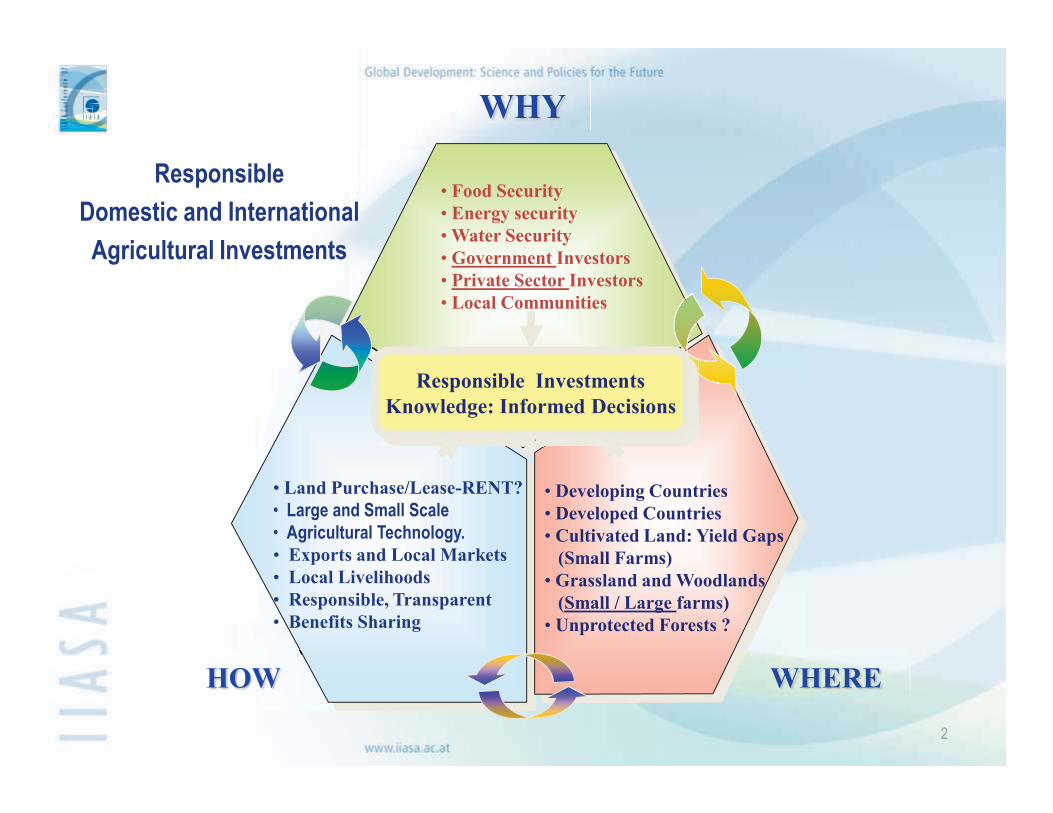
• Food Security• Energy security•Water Security• Government Investors• Private Sector Investors• Local Communities
• Land Purchase/Lease-RENT?• Large and Small Scale• Agricultural Technology.• Exports and Local Markets• Local Livelihoods• Responsible, Transparent• Benefits Sharing
• Developing Countries• Developed Countries• Cultivated Land: Yield Gaps
(Small Farms)• Grassland and Woodlands
(Small / Large farms)• Unprotected Forests ?
Responsible InvestmentsKnowledge: Informed Decisions
Responsible Domestic and International Agricultural Investments

3
OVERVIEW
IIASA – FAO Agro-ecological (AEZ) and Socio-economic (BLS) Methodology and Modelling System
Global, Regional, National Results; SSA Regional and Country Results
For any food , fuel and feed crop or mix of crops assess and quantify sustainable rainfed production potential (Area, Yield, Production); + Irrigated Current and Potential Production
Low, Intermediate and High Agricultural Technology ( Seeds, Fertilizers, Labour, Mechanization etc)
Spatially demarcated current cultivated land and unprotected grasslands, woodlands and forest areas ( + Population Density; + Transport Costs to Local Market or Shipping Port ; Yield gaps on
current cultivated land); Impacts of future climate change : Adaptation and Mitigation Options
Information for Investors and RecipientsNet Value of production over temporal period; Land Rental Valuation; Land Purchase Valuation
AEZ-BLS: Impacts on International Prices, Land Use Change, Food Security and Hunger; Imports and Exports, GDP Ag, etc
2000 – 2010 - 2030 – 2050 – 2080 ( Annual Change)
A Proven AEZ – BLS Methodology

World Food Security and Sustainable Agriculture
IIASA - FAO METHODOLOGY and MODELING FRAMEWORK ( 1977-2010)Spatial Agro-ecological Assessment with world-wide coverage(AEZ)World Agriculture System Applied General Equilibrium Model(BLS)
Food Policy Analysis: global, regional, national, local
Land Resources for Populations of the Future, UNFPA/FAO/IIASA, 1983Climate Change and Agricultural Vulnerability, WSSD 2002 Johannesburg
Biofuels and Food Security, OPEC Seminar, 2009, ViennaCHINAGRO, 2007- 2010
Land Acquisition–Global Assessment, IIASA-WB, 2010 (in preparation)
4
Land AcquisitionIIASA-WB
Forthcoming 2010

5
IIASA Modeling Framework
Developmentscenario
Climate impactresponse relations
Production Demand
TradeGlobal
Food-Feed-Biofuel System
World Market
Climatemodel
De12
3
4
5
6
Agro-ecological suitability and land productivity
Spatial distribution of land use
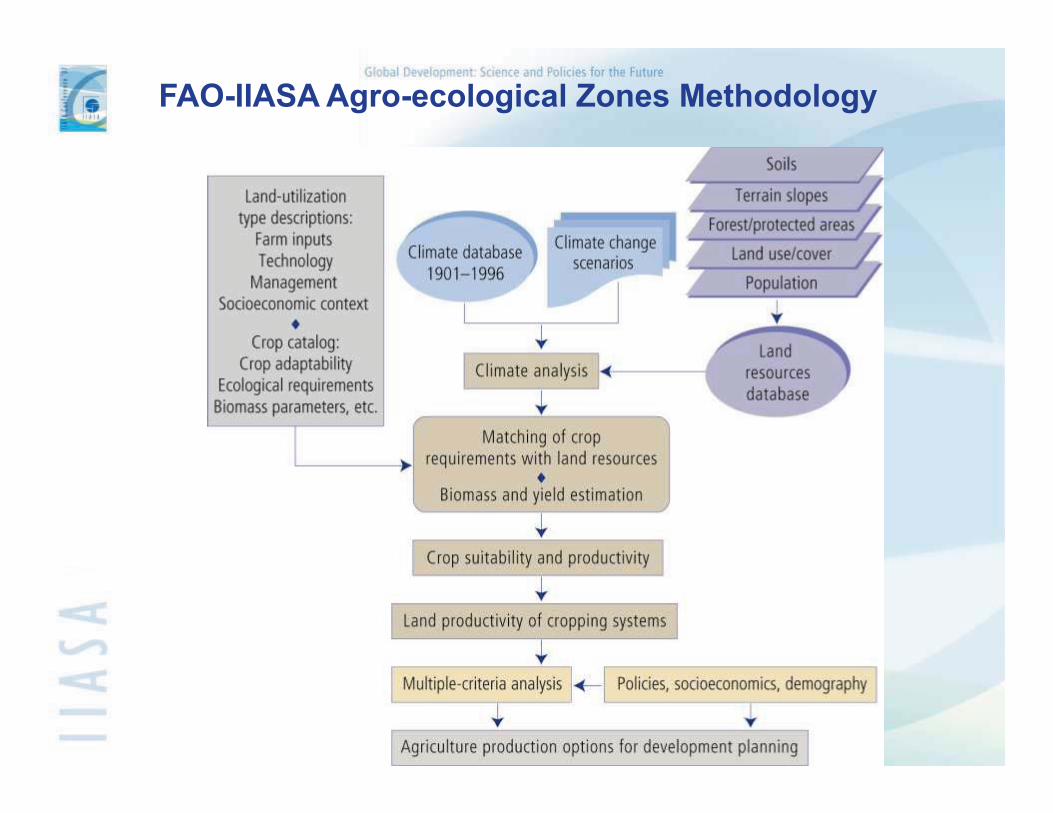
FAO-IIASA Agro-ecological Zones Methodology

7
1. Land Utilization types (LUTs) - Selected agricultural production systems with defined input and management relationships, and crop-specific environmental requirements and adaptability characteristics. These are termed Land Utilization Types (LUT);
2. Land Resources database - Geo-referenced climate, soil and terrain data which are combined into a land resources database;
3. Crop biomass and yield and LUT requirements matching - Procedures for the calculation of potential yields and for matching crop/LUT environmental requirements with the respective environmental characteristics contained in the land resources database, by land unit and grid-cell;
4. Assessments of crop suitability and land productivity, and
5. Applications for agricultural development planning.
Conceptual framework of Agro-ecological Zones methodology
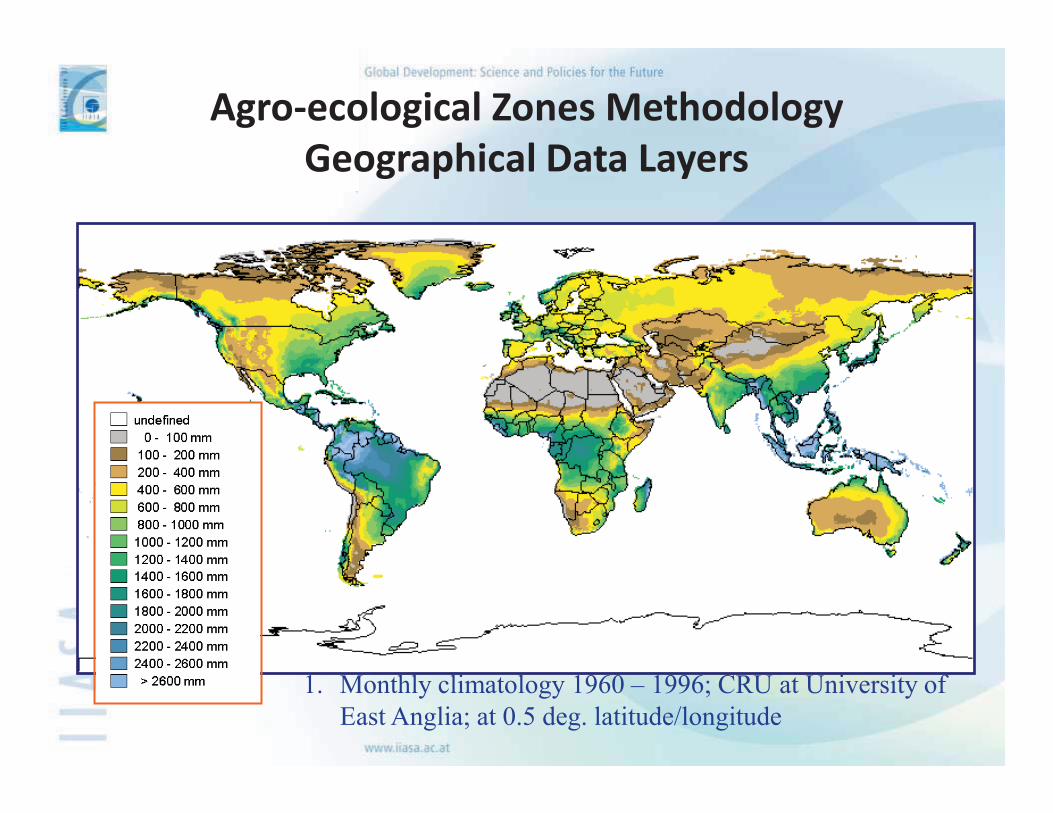
Agro-ecological Zones MethodologyGeographical Data Layers
1. Monthly climatology 1960 – 1996; CRU at University of East Anglia; at 0.5 deg. latitude/longitude

Agro-ecological Zones MethodologyGeographical Data Layers
2. Terrain slope database; USGS Eros Data Center; digital elevation at 30 arc-seconds latitude/longitude

Agro-ecological Zones MethodologyGeographical Data Layers
3. FAO/Unesco digital Soil Map of the World; UN Food and Agriculture Organization; at 5 arc-min. latitude/longitude

Agro-ecological Zones MethodologyGeographical Data Layers
4. Global land cover characteristics database; USGS Eros Data Center; at 1 km resolution.

Agro-ecological Zones MethodologyGeographical Data Layers
5. Global gridded population distribution data of 1995; CIESIN; at 2.5 arc-min. latitude/longitude resolution.

Global Agro-ecological Zones
Environmental resources database
including climate, soil, terrain, and land cover
comprising 2.2 million grid cells,
assessing the agricultural potential
of all crops, pastures, trees, shrubs
at three levels of farming technology.
COUNTRY A
WORLD MARKETS
International pricesto satisfy:• commodity balances• financial transfer balance
COUNTRY B
COUNTRY ECOUNTRY DCOUNTRY C
EXCHANGEEQUILIBRIUM
Prices, consumption, stocks, netexports to satisfy:
• Budget constraint•Market clearance• Trade balance• Trade quota
GOVERNMENT POLICIESTarget price, tariffs, taxes, quota, etc.
PRODUCTIONNon-agriculture
productionAgricultureproduction
Production inputs:• Land • Fertilizer• Labour • Others• Capital
International commodity prices PW Net trade EA
PW
PWPWPW
EC ED EE
EB
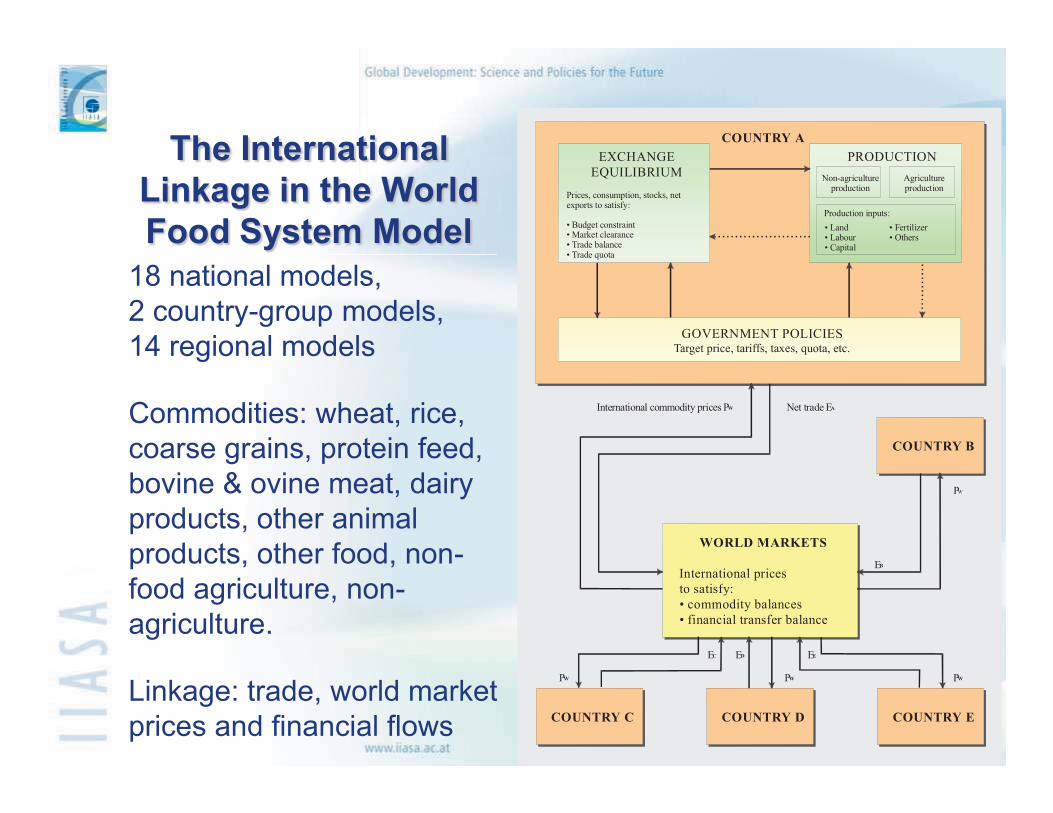
The International Linkage in the World Food System Model
18 national models,2 country-group models,14 regional models
Commodities: wheat, rice, coarse grains, protein feed, bovine & ovine meat, dairy products, other animal products, other food, non-food agriculture, non-agriculture.
Linkage: trade, world market prices and financial flows

Environmental constraints to rain-fed agriculture, reference climate 1961-90
Environmental constraints to rain-fed agriculture, HadCM3-A1FI 2080s

Suitability for rain-fed cereals, reference climate 1961-90.
Change in suitability for rain-fed cereals, HadCM3-A1FI, 2080s

WHEAT MAIZE
MILLET,SORGHUM
Undefined> 25 % 5 to 25 %-5 to 5 %-25 to -5 %< -25 %Not suitableWater
Changes in Rain-fed Cereal PotentialReference climate vs climate of 2080sHadCM3-A2 Scenario
ALLCEREALS

India :Climate Change Yield Impact - 2080
Note: weighted yield impact for rain-fed and irrigated cultivation (% change).
Wheat Rice Maize Pulses Roots Oil SugarH3A1f -41.5 0.2 -2.5 6.1 -7.5 -5.3 -9.8H3A2 -36.6 -3.6 -3.1 1.4 -23.9 -8.8 -9.6H3B2 -20.8 -3.3 -2.8 3.0 -9.3 -6.5 -8.9H3B1 -15.6 0.5 -0.8 5.9 3.8 -0.6 -6.3
CSA1 -25.2 -0.1 -0.4 9.6 1.8 -2.4 -8.0CSA2 -25.8 -1.1 -1.0 6.7 -4.8 -4.5 -9.7CSB2 -18.3 -2.7 -1.2 5.6 -1.0 -4.7 -8.9CSB1 -17.3 -1.9 -1.6 5.3 -2.2 -4.0 -7.5
C2A2 -16.5 0.5 2.4 17.2 13.7 2.3 -9.9C2B2 -17.7 2.4 1.9 17.6 17.4 3.0 -7.5
NCA2 -32.5 4.5 0.6 13.7 19.7 0.3 -6.3NCB2 -19.4 4.0 -0.5 11.4 19.9 -0.4 -4.7

19
Cereal GDP CerealProduction Agriculture Consumption
H3A1f -15.7 -4.8 -7.5H3A2 -15.9 -7.9 -6.4H3B2 -9.8 -4.4 -4.4H3B1 -5.7 -1.0 -3.8
CSA1b -9.6 -1.8 -4.6CSA2 -10.4 -3.9 -4.1CSB2 -8.2 -2.8 -4.9CSB1 -7.5 -2.7 -5.0
CSA2 -5.7 1.0 -2.2CSB2 -5.4 2.5 -1.2
NCA2 -10.3 0.9 -0.4NCB2 -5.7 1.9 0.1
India : Impact of Climate Change on Agriculture – 2080s
Note: percent change relative to respective reference projection without climate change

Table 3: Impact of climate change on land suitability and production of Cereals for rainfed culti
Current climate HadCM3 A2 2080s CSIRO A2 2080sArea Prod Yield Area Prod Yield Area Prod Yield
mln ha mln tons t/ha % change % changeSub-Saharan Africa 188 1142 6.1 -8 -5 3 -11 -6 5Eastern Africa 67 402 6.0 -4 3 7 -10 5 17Middle Africa 34 224 6.6 -4 -3 1 -6 -2 5Western Africa 72 434 6.0 -10 -10 -1 -11 -13 -3Southern Africa 14 82 5.7 -24 -24 0 -25 -31 -8
Developed 446 401 5.8 1 -1 -1 2 6 4Developing 559 547 6.3 -6 -5 2 -5 -1 4
World 1004 6116 6.1 -3 -3 0 -2 2 4
Note: Results include CO2 fertilization and assume rational adaptation and transfer of crop types and
21
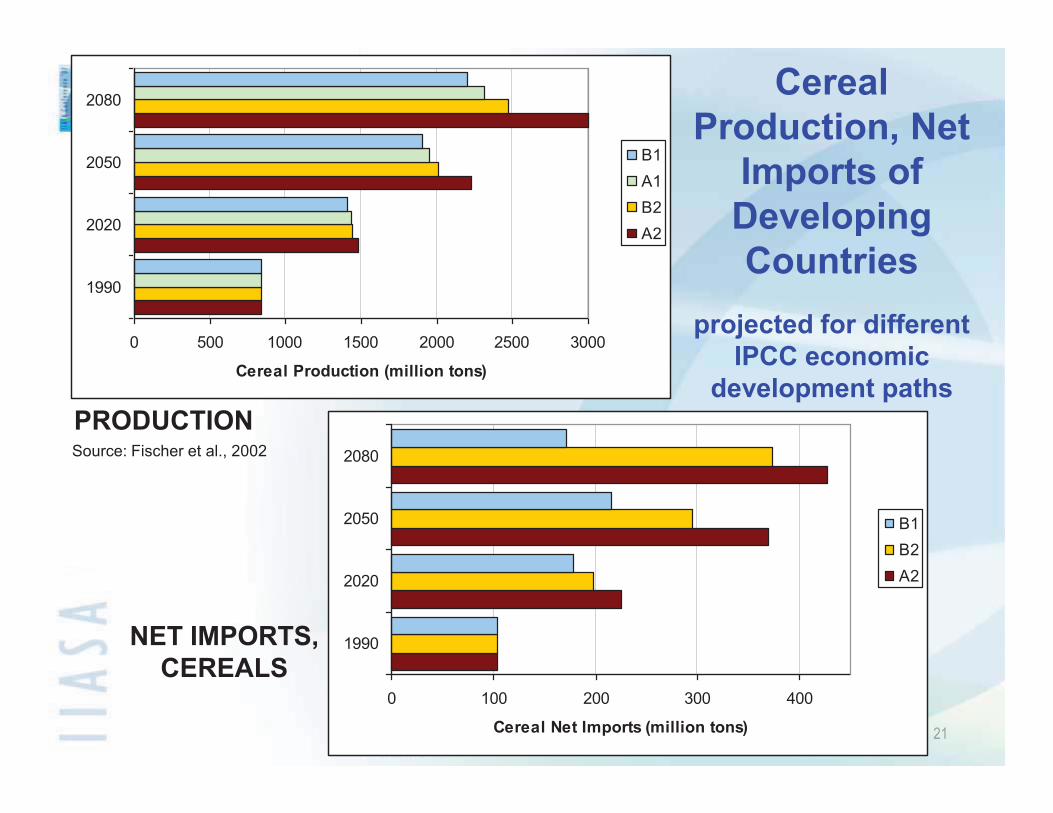
Source: Fischer et al., 2002
Cereal Production, Net
Imports of Developing Countries
projected for different IPCC economic
development pathsPRODUCTION
NET IMPORTS,CEREALS
0 500 1000 1500 2000 2500 3000
1990
2020
2050
2080
Cereal Production (million tons)
B1A1B2A2
0 100 200 300 400
1990
2020
2050
2080
Cereal Net Imports (million tons)
B1B2A2

Impacts of climate change on regionalnet irrigation water requirements in 2080
� 271 million ha irrigated out of total 1540 million ha cultivated (~ 18 %).� Agriculture uses 2630 billion m3 out of 3816 billion m3 annual water
withdrawals (~ 70%).� On average, annual global crop water deficit is 500 mm (i.e., 1350 billion m3 in
2000); about 970 mm water per irrigated hectare were applied.
0 100 200 300 400 500 600 700
NAMWEUPAO
FSU+EEMDCAFRLAMCPASASPASLDC
WORLD
Irrigation (mm per year)
A2refClimateSeason
HADCM3 A2

South Africa: Climate Change Impacts (% change) on Indicators of Agricultural Water Use – 2080
Note: percent change relative to respective reference projection without climate change. Crop water requirements calculated as crop-specific potential evapotranspiration (plus extra allowance for paddy).
� 1.5 million ha irrigated out of total 15.7 million ha cultivated (~ 9.5 %)� Agriculture uses 8 billion m3 out of 12.5 billion m3 annual water withdrawals (~ 65%)� Internal WR 44.8 bln m3/yr, external WR 5.2 bln m3/yr, < 1000 m3 /cap/yr
Precipitation Crop Water Crop Water Internal WaterRequirements Deficits Resources
H3A2 -11,0 13,7 24,5 -26,1CSA2 -9,8 10,2 18,8 -22,3C2A2 -9,2 10,3 18,8 -21,4NCA2 -3,1 5,0 8,5 -9,2
H3B1 -11,0 9,6 18,6 -23,9CSB1 -6,3 7,3 13,1 -15,2

GLC2000(30 arc-seconds grid)
IFPRI(30 arc-seconds grid)
Potential agricultural production value for high
and intermediate input levelsCurrent cropping systems for rain-fed and irrigated
production
Production gaps between current production and potential productionunder respectively high and intermediate input levels
Nationalagricultural
statisticsby major crops(FAOSTAT and
AT 2015/30)
Current agricultural production value
Current cropping systems for rain-fed and irrigated
production
Shares Major Land Categories:(i) Rain-fed cultivated land, (ii) Irrigated cultivated land, (iii) Forest(iv) Pastures and shrubs, (v) Barren and sparsely vegetated land, (vi) Urban land + rural land required for housing and infrastructure
(5 arc-minute grid)
InventoryIrrigated areas
(30 arc-seconds grid)
2 1
7
9
12 11
Land cover ClassificationProcedures
Spatiallyexplicit estimation
of agricultural productionactivities
Spatial explicit prior information• Crop suitability (AEZ)• Population distribution• Farming system zones• Commodity prices• Availability of Inputs• Distance to market, etc.
Production GapAnalysis
13
14
FRA2000(30 arc-seconds grid)
5
3
6
10
Protected areas and areas
required for settlement and infrastructure
4
8

0167333500667833100011671333150016671833200021672333250026672833300031673333350036673833>=4000
Down-scaling Results:Value of Agricultural Output per Grid-cell

OFID - IIASA Biofuels and Food Security Study, 2009
Mandates and TargetsCountry/Region
Mandatory, voluntary or indicative target
Australia At least 350 million liters biofuels by 2010
Canada 5 percent renewable content in gasolineby 2010
EuropeanUnion
5.75 percent by 201010 percent by 2020
Germany 6.25 percent by 201010 percent by 2020
France 7 percent by 2010, 10 percent by 2015,10 percent by 2020
Japan 0.6 percent of auto fuel by 2010;a goal to reduce fossil oil dependence oftransport sector from 98% to 80% by2030
New Zealand 3.4 percent target for bothgasoline and diesel by 2012
United States 12 billion gallons by 2010, risingto 20.5 billion gallons by 2015and to 36 billion gallons by 2022(with 16 billion gallons fromadvanced cellulosic ethanol) 26
Country/Region
Mandatory, voluntary or indicative target
Brazil Mandatory 25 percent ethanol blendwith gasoline; 5 percent biodiesel blendby 2010.
China 2 million tons ethanol by 2010increasing to 10 million tons by 2020;0.2 million tons biodiesel by 2010increasing to 2 million tons by 2020.
India 5 percent ethanol blending in gasolinein 2008, 10 percent as of 2009;indicative target of 20 percent ethanolblending in gasoline and 20 percentbiodiesel blending by 2017.
Indonesia 2 percent biofuels in energy mix by2010, 3 percent by 2015, and 5 percentby 2020.
Thailand 2 percent biodiesel blend by 2008, 10percent biodiesel blend by 2012; 10percent ethanol blend by 2012.
South Africa 2 percent of biofuels by 2013
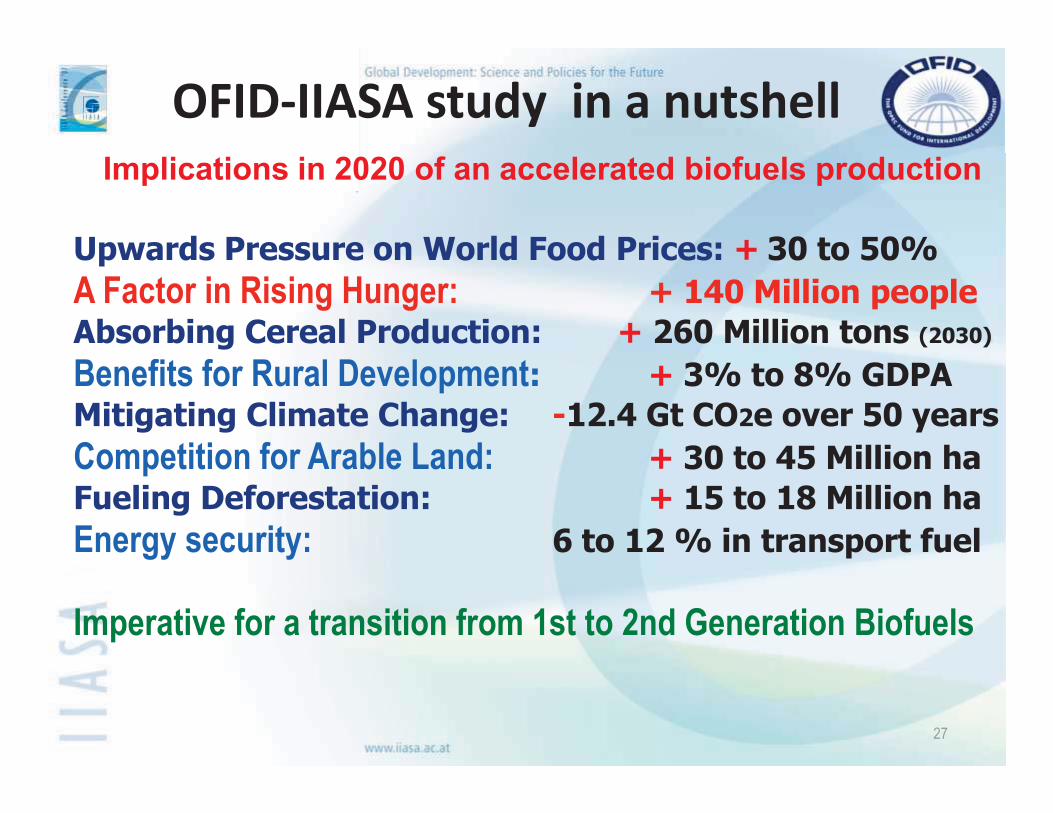
OFID-IIASA study in a nutshell
27
Upwards Pressure on World Food Prices: + 30 to 50% A Factor in Rising Hunger: + 140 Million peopleAbsorbing Cereal Production: + 260 Million tons (2030)
Benefits for Rural Development: + 3% to 8% GDPAMitigating Climate Change: -12.4 Gt CO2e over 50 yearsCompetition for Arable Land: + 30 to 45 Million haFueling Deforestation: + 15 to 18 Million haEnergy security: 6 to 12 % in transport fuel
Imperative for a transition from 1st to 2nd Generation Biofuels
Implications in 2020 of an accelerated biofuels production

Area % of globalCropland 243 mln ha 15.6Forests 519 mln ha 13.9Grass/woodland 1111 mln ha 24.4Other land 1074 mln ha 31.2TOTAL 2947 mln ha 22.1
Estimated Use of SSA Land in 2000
36%
18%
8% 1%
37% Grass/ShrubUnvegetatedForestCropsBuilt-up

29.5 29.126.7
21.5
11.0
10.5
5.2
2.4
0
5
10
15
20
25
30
35
1 2 3 4 5
mill
ion
km2
Built-upCropsForestUnvegetatedGrass/Shrub
1 ... Total land (excl. Antarctica and Greenland)2 ... excluding built-up land3 ... excluding arable and perennial cropland4 ... excluding forests5 ... excluding barren land & water
Source: IIASA-LUC, 2007
How much land is available in SSA?
Too steep3%
Protected16%
Unproductive15%
Very marginal8%
Livestock& Bioenergy
58%

30
Region TC< $30 TC $30 to $60 TC > $60 TOTAL GK$2000/Ha
SSA 30012 61285 106048 197345 1825
E. Africa 3691 15321 51848 70860 2022
M. Africa 2116 4781 28565 35462 1830
S. Africa 6308 7210 1335 14853 2041
W. Africa 17897 33972 24301 76169 1596
Suitable Area( VS + S + MS, 1000 Ha Average Yield
Region TC< $30 TC $30 to $60 TC > $60 TOTAL GK$2000/Ha
SSA 46912 109054 321396 477391 1760
E. Africa 14694 39795 157250 211740 1871
M. Africa 10195 21969 118323 150487 1772
S. Africa 5530 11026 6998 23554 1742
W. Africa 16492 36263 38826 91589 1491
Grassland and Woodland: Food Production Potential, High Technology
Current Cultivated Land: Food Production Potential, High TechnologyTranspsort Cost

31
Region PD< 10 PD 10 to 25 PD> 35 TOTAL GK$2000/Ha
SSA 48509 48657 100197 197345 1825
E. Africa 19544 16702 34614 70860 2022
M. Africa 17689 9544 8229 35462 1830
S. Africa 4685 4998 5170 14853 2041
W. Africa 6592 17412 52165 76169 1596
Region PD< 10 PD 10 to 25 PD> 25 TOTAL GK$2000/Ha
SSA 224961 122368 130033 477391 1761
E. Africa 98785 54246 58709 211740 1871M. Africa 100487 33403 16596 150487 1772
S. Africa 12611 4642 6301 23554 1742
W. Africa 13078 30077 48427 91589 1491
Suitable Area( VS + S + MS, 1000 Ha) Average Yield
Current Cultivated Land: Food Production Potential, High Technology
Grassland and Woodland: Food Production Potential, High Technology
Population Density

32
Population Density
< 10 per km210 - 25 per km2> 25 per km2Water

Density Of Ruminant Livestock in SSA
None< 11 - 55 - 1010 - 2020 - 5050 - 100100 - 200> 200Water

34
Distance to Market
< 2h2h - 5h> 5hWater

35
Transport Cost to Port ($/ton)

36
Suitability for Rain-fed Maize
UndefinedSI > 85 : Very highSI > 70 : HighSI > 55 : GoodSI > 40 : Medium SI > 25 : ModerateSI > 10 : MarginalSI > 0 : Very marginalSI = 0 : Not suitableWater
37
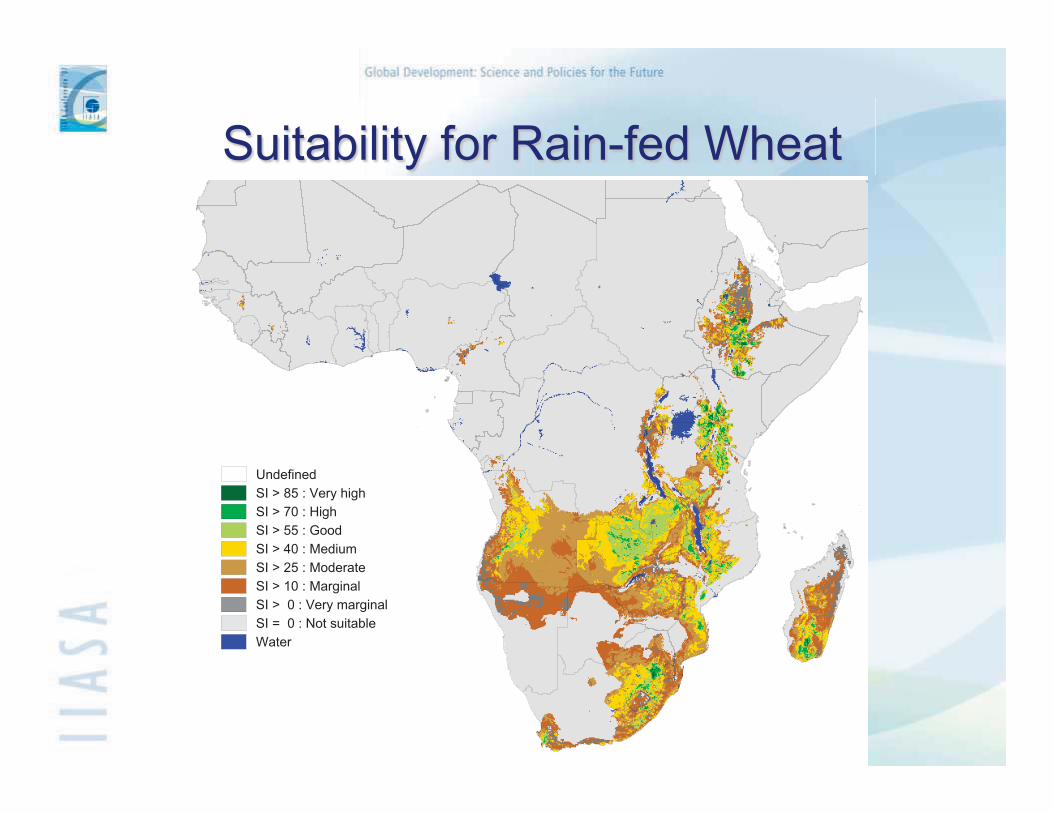
Suitability for Rain-fed Wheat
UndefinedSI > 85 : Very highSI > 70 : HighSI > 55 : GoodSI > 40 : Medium SI > 25 : ModerateSI > 10 : MarginalSI > 0 : Very marginalSI = 0 : Not suitableWater

38
Suitability for Rain-fed Sugarcane
UndefinedSI > 85 : Very highSI > 70 : HighSI > 55 : GoodSI > 40 : Medium SI > 25 : ModerateSI > 10 : MarginalSI > 0 : Very marginalSI = 0 : Not suitableWater

39
Suitability for Rain-fed Soybeans
UndefinedSI > 85 : Very highSI > 70 : HighSI > 55 : GoodSI > 40 : Medium SI > 25 : ModerateSI > 10 : MarginalSI > 0 : Very marginalSI = 0 : Not suitableWater

40
Suitability for Rain-fed Yams
UndefinedSI > 85 : Very highSI > 70 : HighSI > 55 : GoodSI > 40 : Medium SI > 25 : ModerateSI > 10 : MarginalSI > 0 : Very marginalSI = 0 : Not suitableWater

41
Suitability for Rain-fed Food Crops
UndefinedSI > 85 : Very highSI > 70 : HighSI > 55 : GoodSI > 40 : Medium SI > 25 : ModerateSI > 10 : MarginalSI > 0 : Very marginalSI = 0 : Not suitableWater

42
Potential Output Density of Food Crops (GK$/ha)
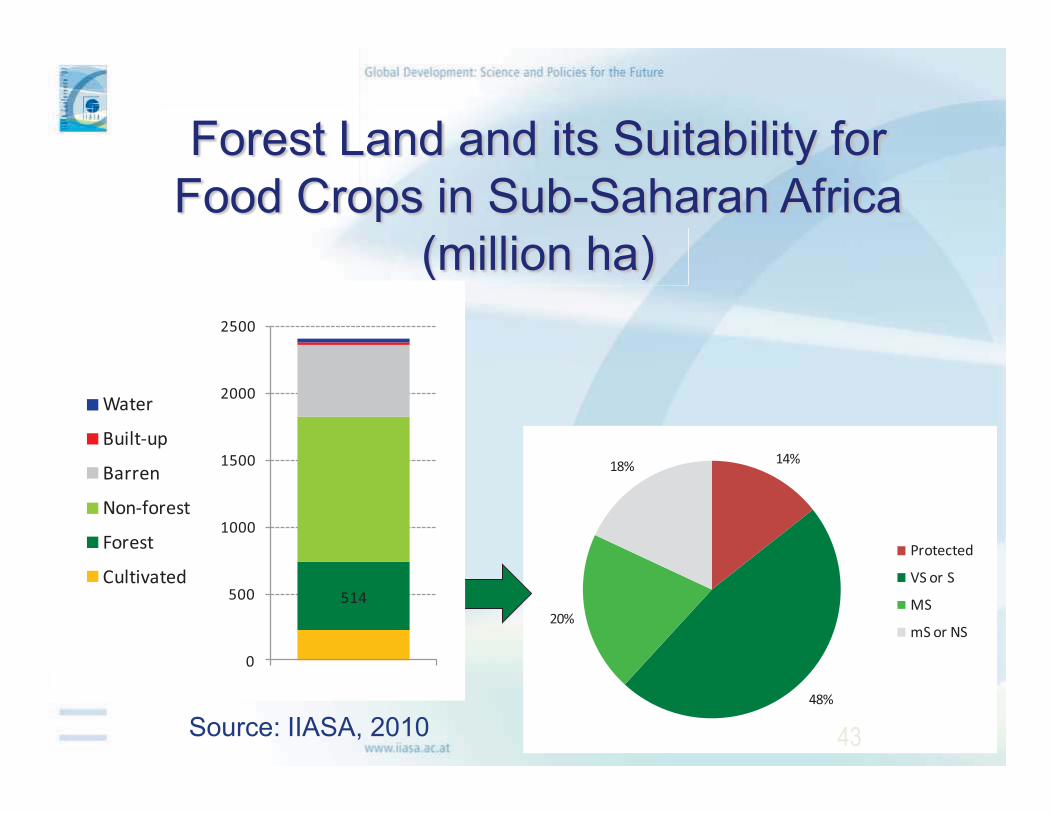
14%
48%
20%
18%
Protected
VS or S
MS
mS or NS
43
Forest Land and its Suitability for Food Crops in Sub-Saharan Africa
(million ha)
Source: IIASA, 2010
514
0
500
1000
1500
2000
2500
Water
Built-up
Barren
Non-forest
Forest
Cultivated

44
Non-forest Land and its Suitability for Food Crops in Sub-Saharan Africa
(million ha)
Source: IIASA, 2010
1,085
0
500
1000
1500
2000
2500
Water
Built-up
Barren
Non-forest
Forest
Cultivated
13%
25%
19%
43% Protected
VS or S
MS
mS or NS

14%
11%
13%62%
13%
25%
19%
43%Protected
VS or S
MS
mS or NS
45Source: IIASA, 2010
Food crops
Groundnut
Suitability of Non-forest Land in Sub-Saharan Africa
13%
2%
5%
80%
13%
21%
12%
54%
Wheat Maize
13%
20%
17%
50%
Soybean14%
4%
5%
77%
Sugarcane
Total Non-forest Land
=1085 mln ha

15%
27%
17%
41% Protected
VS or S
MS
mS or NS
46
Non-forest Land and its Suitability for Food Crops in Eastern Africa
(million ha)
478
0
100
200
300
400
500
600
700
800
900
1000
Water
Built-up
Barren
Non-forest
Forest
Cultivated
Source: IIASA, 2010

47
Non-forest Land and its Suitability for Food Crops in Western Africa
(million ha)
202
0
100
200
300
400
500
600
700
Water
Built-up
Barren
Non-forest
Forest
Cultivated
Source: IIASA, 2010
9%
22%
23%
46%Protected
VS or S
MS
mS or NS
48
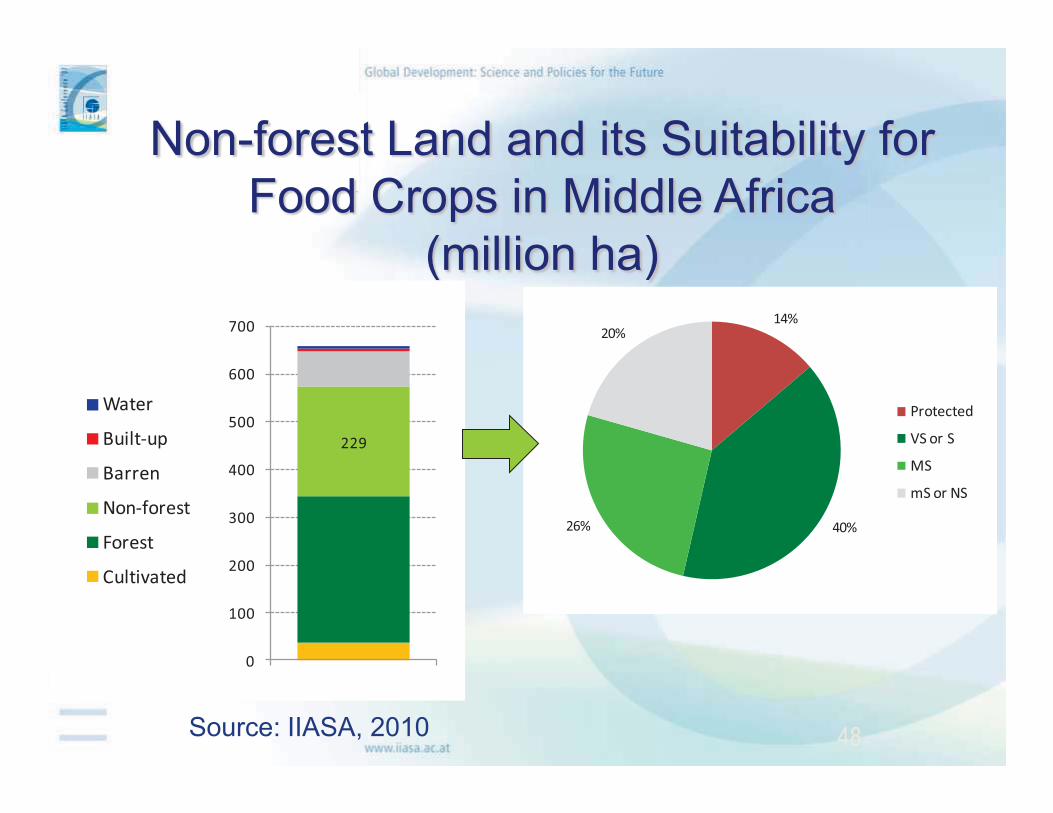
Non-forest Land and its Suitability for Food Crops in Middle Africa
(million ha)
Source: IIASA, 2010
229
0
100
200
300
400
500
600
700
Water
Built-up
Barren
Non-forest
Forest
Cultivated
14%
40%26%
20%
Protected
VS or S
MS
mS or NS

49
Non-forest Land and its Suitability for Food Crops in Southern Africa
(million ha)
Source: IIASA, 2010
176
0
50
100
150
200
250
300
Water
Built-up
Barren
Non-forest
Forest
Cultivated
15%
4%
9%
72%
Protected
VS or S
MS
mS or NS
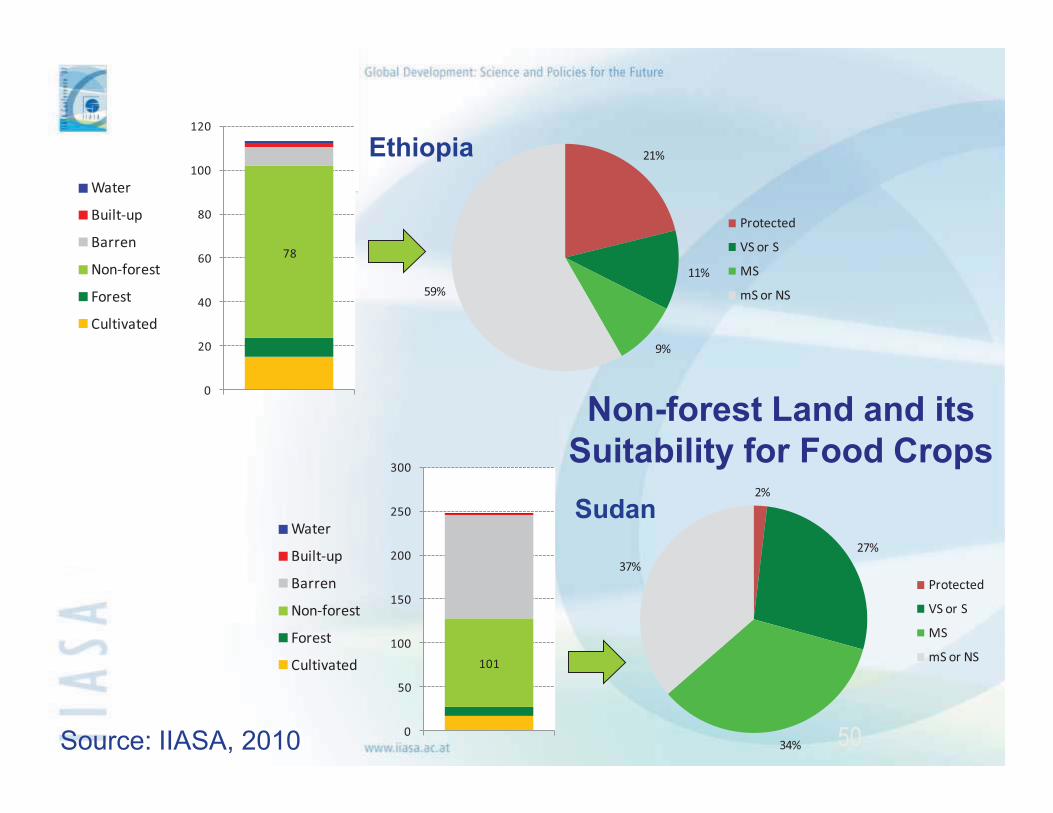
21%
11%
9%
59%
Protected
VS or S
MS
mS or NS
50Source: IIASA, 2010
78
0
20
40
60
80
100
120
Water
Built-up
Barren
Non-forest
Forest
Cultivated
2%
27%
34%
37%Protected
VS or S
MS
mS or NS101
0
50
100
150
200
250
300
Water
Built-up
Barren
Non-forest
Forest
Cultivated
Ethiopia
Sudan
Non-forest Land and its Suitability for Food Crops

18%
24%
38%
20%
Protected
VS or S
MS
mS or NS
51Source: IIASA, 2010
D.R. Congo
Angola
Non-forest Land and its Suitability for Food Crops
62
0.000
50.000
100.000
150.000
200.000
250.000
Water
Built-up
Barren
Non-forest
Forest
Cultivated
12%
61%
16%
11%
Protected
VS or S
MS
mS or NS
59
0
20
40
60
80
100
120
140
Water
Built-up
Barren
Non-forest
Forest
Cultivated

17%
50%
18%
15%
Protected
VS or S
MS
mS or NS
52
Suitability for Food Crops in Mozambique
Source: IIASA, 2010
6
25
45
0
10
20
30
40
50
60
70
80
90
Water
Built-up
Barren
Non-forest
Forest
Cultivated
19%
49%
16%
16%
Protected
VS or S
MS
mS or NS
Million hectares

53
Land by Classes of Population Density and Cost of Transport (million hectares)
Source: IIASA, 20101.7
3.72.6
2.5
3.1
1.1
2.7
2.7
0.6
1.2
1.6
1.4
0
2
4
6
8
10
12
< 30$ 30$ - 60$ > 60$
ProtectedPdens > 2510<Pdens<25Pdens < 10
2.9
7.86.2
3.4
5.0
2.33.7
4.4
0.9
1.8
3.1
3.5
0
2
4
6
8
10
12
14
16
18
20
22
< 30$ 30$ - 60$ > 60$
Protected
Pdens > 25
10<Pdens<25
Pdens < 10
Forest land (25 million ha)
Grass, scrub, wood land (45 million ha)
Note: The bars show the distribution of forest and non-forest vegetated land by broad classes of transport costs to port of export ($/ton). The color segments indicate broad classes of population density (persons/sqkm).
Mozambique
54
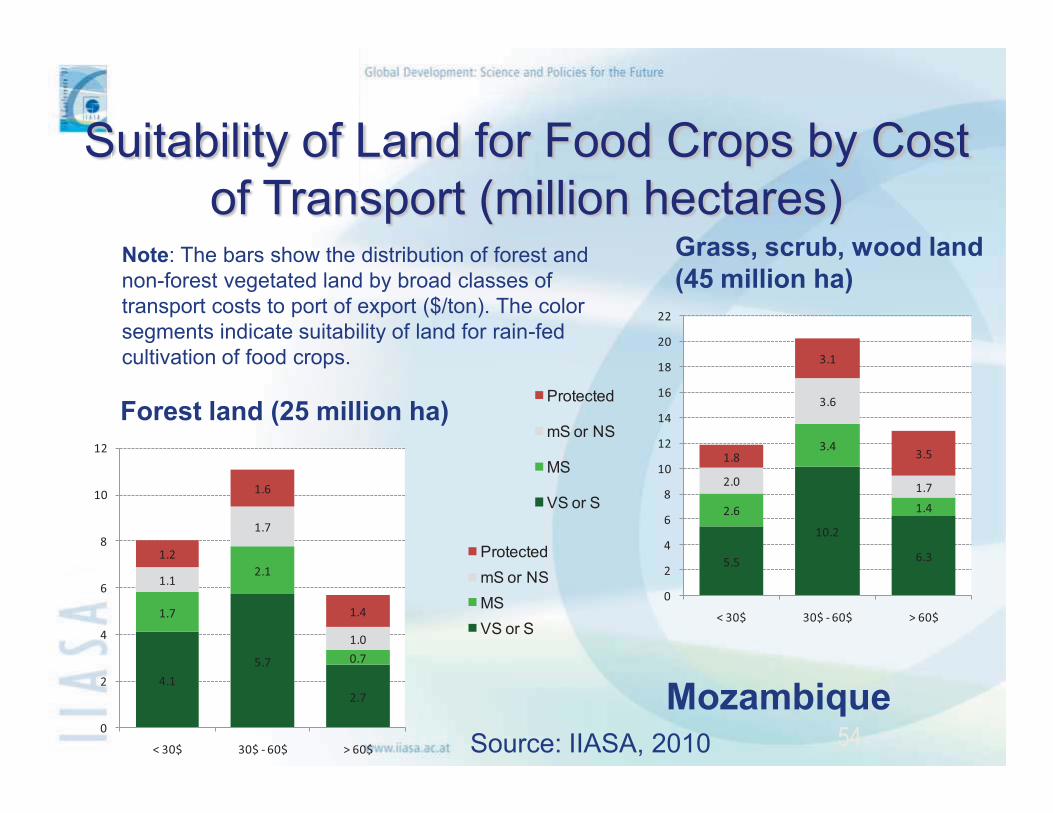
Suitability of Land for Food Crops by Cost of Transport (million hectares)
Source: IIASA, 2010
Forest land (25 million ha)
Grass, scrub, wood land (45 million ha)
Note: The bars show the distribution of forest and non-forest vegetated land by broad classes of transport costs to port of export ($/ton). The color segments indicate suitability of land for rain-fed cultivation of food crops.
Mozambique
5.5
10.2
6.3
2.6
3.4
1.4
2.0
3.6
1.7
1.8
3.1
3.5
0
2
4
6
8
10
12
14
16
18
20
22
< 30$ 30$ - 60$ > 60$
Protected
mS or NS
MS
VS or S
4.15.7
2.7
1.7
2.1
0.7
1.1
1.7
1.0
1.2
1.6
1.4
0
2
4
6
8
10
12
< 30$ 30$ - 60$ > 60$
ProtectedmS or NSMSVS or S

55
Concluding RemarksCurrent Cultivated Land
Closing the Yield Gap; Investments Partnerships and Contract Farming
“ New” Land Grasslands and WoodlandsCreate Opportunities for Nationals, reducing pressures in current cultivated land
Joint Venture partnerships with Investors, small and large farmsLand Lease Rental Valuation, Investors - Large Farms
Access to pertinent, comprehensive and timely information, Recipients and InvestorsPrinciples for responsible Domestic and International Agricultural InvestmentsCapacity building Recipients , assessment, policy analysis, negotiation skills
Due diligence and expert advise, multilateral institutions ( cf WB Inspection Panel)Universal Right to Food
Responsible International Agricultural InvestmentsAn end to a Century of Promises for a Food Secure World

Food Security: Ending a century of promises• 1905 International Institute of Agriculture• 1941 US Conference for Defense• 1943 Hot Springs Conference Food and Agriculture• 1948 Food as Human Right• 1972 Stockholm: Preserving & Enhancing the Environment
• 1973 First World Food summit• 1992 Rio Earth Summit• 1996 Second World Food summit• 2000 Millennium Summit• 2002 Third World Food Summit• 2009 World Food Security Summit
56Country Lead Food Security Programme

QNFSP
Qatar National Food Security Programme
FirstInvest in Enhancing Domestic Production
SecondResponsible International Investments


Qatar National Food Security Programme
THANK YOU

QNFSP
Qatar National Food Security Programme
FirstInvest in Enhancing Domestic Production
SecondResponsible International Investments