Lampiran 1 Kuesioner KUESIONER PENELITIANrepository.wima.ac.id/305/7/lampiran.pdfStore Theatric (X3)...
42
Lampiran 1 Kuesioner KUESIONER PENELITIAN Pengaruh Store Image, Store Atmospherics, dan Store Theatrics Terhadap Purchase Intention Pada The Body Shop Galaxy Mall Surabaya No. Responden: ....... (diisi peneliti) Responden yang terhormat, Perkenankanlah saya, Christian Hadi Wijaya, mahasiswa Jurusan Manajemen Konsentrasi Ritel Fakultas Bisnis Universitas Katolik Widya Mandala Surabaya, sedang melakukan penelitian untuk tugas akhir skripsi saya. Apabila Anda mengetahui dan mengerti, serta pernah berkunjung di The Body Shop Galaxy Mall dalam satu tahun terakhir, mohon kesediaan Anda untuk meluangkan waktu mengisi/menjawab daftar pernyataan di bawah ini dengan jujur dan benar. Data yang saya peroleh hanya akan digunakan untuk keperluan menyusun tugas akhir skripsi saja. Saya mengucapkan banyak terima kasih atas partisipasi yang anda berikan. Hormat Saya, Christian Hadi Wijaya Nrp : 3103009064
Transcript of Lampiran 1 Kuesioner KUESIONER PENELITIANrepository.wima.ac.id/305/7/lampiran.pdfStore Theatric (X3)...

Lampiran 1 Kuesioner
KUESIONER PENELITIAN
Pengaruh Store Image, Store Atmospherics, danStore Theatrics Terhadap Purchase IntentionPada The Body Shop Galaxy Mall Surabaya
No. Responden: ....... (diisi peneliti)
Responden yang terhormat,
Perkenankanlah saya, Christian Hadi Wijaya, mahasiswa Jurusan
Manajemen Konsentrasi Ritel Fakultas Bisnis Universitas Katolik Widya
Mandala Surabaya, sedang melakukan penelitian untuk tugas akhir skripsi
saya. Apabila Anda mengetahui dan mengerti, serta pernah berkunjung di
The Body Shop Galaxy Mall dalam satu tahun terakhir, mohon kesediaan
Anda untuk meluangkan waktu mengisi/menjawab daftar pernyataan di
bawah ini dengan jujur dan benar. Data yang saya peroleh hanya akan
digunakan untuk keperluan menyusun tugas akhir skripsi saja. Saya
mengucapkan banyak terima kasih atas partisipasi yang anda berikan.
Hormat Saya,
Christian Hadi Wijaya
Nrp : 3103009064

Berilah tanda (x) pada jawaban yang anda pilih.
Bagian I
1. Apakah anda pernah membeli produk The Body Shop?
a. Pernah (Berhenti)
b. Tidak Pernah (Lanjut ke No.2)
2. Usia anda saat ini:
a. < 20 tahun
b. 20 − ≥ 30
c. 31 − ≥ 40
d. 41 − ≥ 50
e. > 50 tahun
3. Sudah berapa kali anda berkunjung ke The Body Shop Galxy Mall
dalam kurun waktu 1 tahun terakhir?
a. 1-2 kali
b. 3-4 kali
c. 5-6 kali
d. Lebih dari 6 kali
Bagian II
STS : Sangat Tidak Setuju
TS : Tidak Setuju
KS : Kurang Setuju
S : Setuju
SS : Sangat Setuju

No Pernyataan STS TS N S SS
Store Image (X1)
1 The Body Shop Galaxy Mall memilikicitra yang baik dalam benak saya.
2 The Body Shop Galaxy Mall memilikikualitas layanan yang memuaskan.
3 Saya percaya The Body Shop GalaxyMall merupakan tempat berbelanjayang lengkap untuk produk kosmetik.
4 The Body Shop Galaxy Mallmenyediakan produk yangberkualitas.
Store Athmospheric (X2)
1Display produk The Body Shop GalaxyMall tertata rapi.
2Penataan produk di The Body ShopGalaxy Mall di kelompokkan sesuaidengan katagori barang.
3Alunan musik di The Body ShopGalaxy Mall mendukung suasanabelanja yang nyaman.
4
Area The Body Shop Galaxy Mallberaroma harum, sehingga dapatmeningkatkan minat saya dalamberbelanja
5
Pencahayaan pada barang dagangan diThe Body Shop Galaxy Mall akanmempengaruhi keinginan saya untukberbelanja.
6Suhu udara di dalam The Body ShopGalaxy Mall menciptakan kesegaransaat saya berkunjung.

Store Theatric (X3)
1
The Body Shop Galaxy Mall mendekorruangnya sesuai dengan tema-tematertentu. (Seperti 17 Agustus, Imlek,Natal, Lebaran, dan sebagainya)
2The Body Shop Galaxy Mallmenyediakan program demonstrasiproduk tertentu kepada konsumen.
3
The Body Shop Galaxy Mall memilikiprogram promosi pada event-eventtertentu untuk meningkatkan frekuensikunjungan konsumen.
Purchase Intention (Y)
1Ketika ada produk-produk baru yangditampilkan oleh The Body ShopGalaxy Mall, saya ingin membelinya.
2Saya ingin membeli produk dari TheBody Shop Galaxy Mall , karena sayasadar akan kualitasnya.
3
Saya percaya produk yang dijual di TheBody Shop Galaxy Mall aman untukkulit dan tubuh saya, sehingga sayaingin membelinya.


GET
FILE='D:\Skripsi\Frekuensi.sav'.
NEW FILE.
DATASET ACTIVATE DataSet2.
DATASET CLOSE DataSet1.
SAVE OUTFILE='F:\FILE CHRISTIAN\DATA FREKUENSI.sav'
/COMPRESSED.
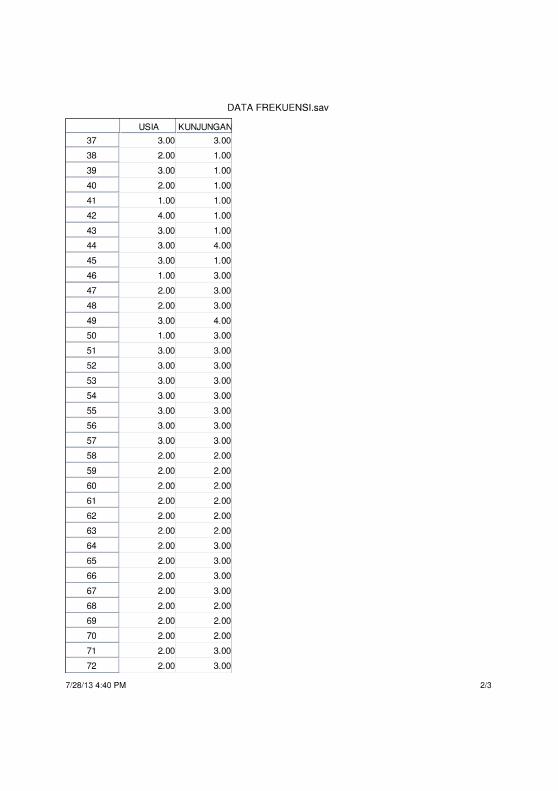
FREQUENCIES VARIABLES=USIA KUNJUNGAN
/ORDER=ANALYSIS.
Frequencies
[DataSet2] F:\FILE CHRISTIAN\DATA FREKUENSI.sav
KUNJUNGANUSIA
Valid
Missing
N
00
100100
Statistics
Frequency Table
Cumulative PercentValid PercentPercentFrequency
<20
20->30
31->40
41->50
>50
Total
Valid
100.0100.0100
100.02.02.02
98.07.07.07
91.024.024.024
67.058.058.058
9.09.09.09
USIA
Page 1
ormix
Typewritten text
Lampiran 3 Karakteristik Responden

Cumulative PercentValid PercentPercentFrequency
1-2
3-4
5-6
>6
Total
Valid
100.0100.0100
100.07.07.07
93.041.041.041
52.025.025.025
27.027.027.027
KUNJUNGAN
Page 2

Page 1
X11 Pearson CorrelationX11
1X12.367**
X13.388**
Sig. (2-tailed) .000 .000N 100 100 100
X12 Pearson Correlation .367** 1 .620**
Sig. (2-tailed) .000 .000N 100 100 100
X13 Pearson Correlation .388** .620** 1Sig. (2-tailed) .000 .000
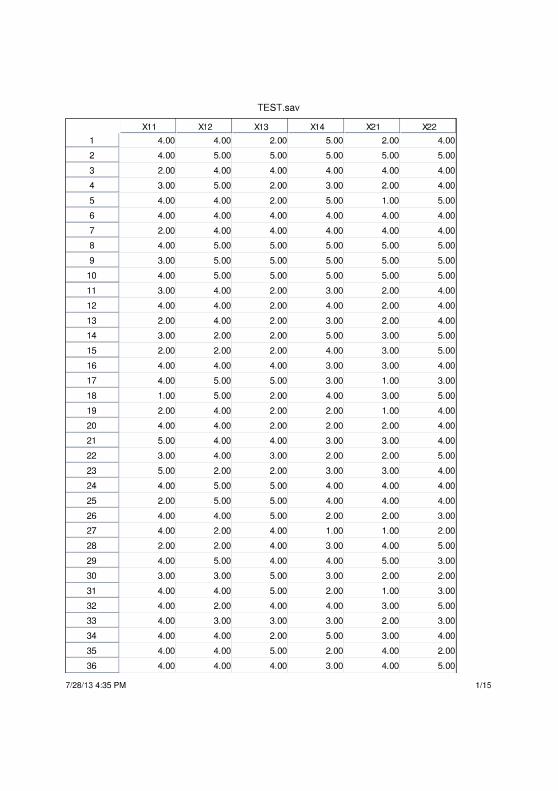
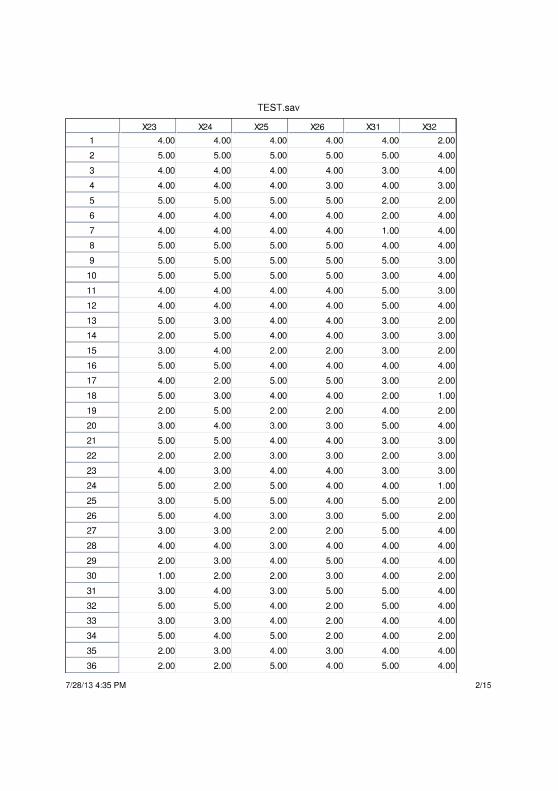
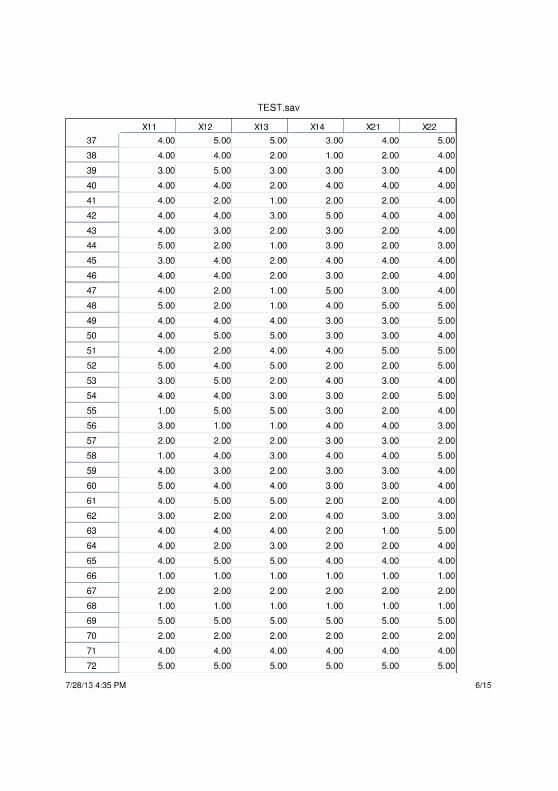
Lampiran 4 Uji ValiditasCOMPUTE X1TOTAL=X11 + X12 + X13 + X14.
EXECUTE.
COMPUTE X2TOTAL=X21 + X22 + X23 + X24 + X25 + X26.
EXECUTE.
COMPUTE X3TOTAL=X31 + X32 + X33.
EXECUTE.
COMPUTE YTOTAL=Y11 + Y12 + Y13.
EXECUTE.
SAVE OUTFILE='D:\TEST.sav'
/COMPRESSED.
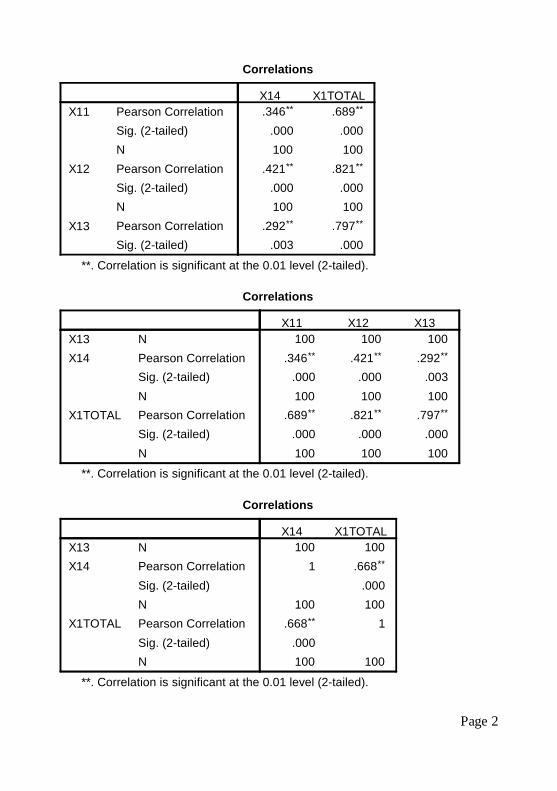
CORRELATIONS
/VARIABLES=X11 X12 X13 X14 X1TOTAL
/PRINT=TWOTAIL NOSIG
/MISSING=PAIRWISE.
Correlations
[DataSet2] D:\TEST.sav
Correlations
**. Correlation is significant at the 0.01 level (2-tailed).
Page 2
X11 Pearson CorrelationX14.346**
X1TOTAL.689**
Sig. (2-tailed) .000 .000
X12NPearson Correlation
100.421**
100.821**
Sig. (2-tailed) .000 .000
X13NPearson Correlation
100.292**
100.797**
Sig. (2-tailed) .003 .000
X13 NX11
100X12
100X13
100X14 Pearson Correlation .346** .421** .292**
Sig. (2-tailed) .000 .000 .003
X1TOTALNPearson Correlation
100.689**
100.821**
100.797**
Sig. (2-tailed) .000 .000 .000N 100 100 100
X13 NX14
100X1TOTAL
100X14 Pearson Correlation 1 .668**
Sig. (2-tailed) .000N 100 100
X1TOTAL Pearson Correlation .668** 1Sig. (2-tailed) .000N 100 100
Correlations
**. Correlation is significant at the 0.01 level (2-tailed).
Correlations
**. Correlation is significant at the 0.01 level (2-tailed).
Correlations
**. Correlation is significant at the 0.01 level (2-tailed).

Page 3
X21 Pearson CorrelationX21
1X22.500**
X23.239*
Sig. (2-tailed) .000 .016N 100 100 100
X22 Pearson Correlation .500** 1 .586**
Sig. (2-tailed) .000 .000N 100 100 100
X23 Pearson Correlation .239* .586** 1Sig. (2-tailed) .016 .000N 100 100 100
X24 Pearson Correlation .197* .562** .622**
Sig. (2-tailed) .049 .000 .000
X25NPearson Correlation
100.561**
100.753**
100.545**
Sig. (2-tailed) .000 .000 .000
X26NPearson Correlation
100.541**
100.647**
100.404**
Sig. (2-tailed) .000 .000 .000
CORRELATIONS
/VARIABLES=X21 X22 X23 X24 X25 X26 X2TOTAL
/PRINT=TWOTAIL NOSIG
/MISSING=PAIRWISE.
Correlations
[DataSet2] D:\TEST.sav
Correlations
**. Correlation is significant at the 0.01 level (2-tailed).
*. Correlation is significant at the 0.05 level (2-tailed).

Page 4
Correlations
X21 Pearson CorrelationX24.197*
X25.561**
Sig. (2-tailed) .049 .000N 100 100
X22 Pearson Correlation .562** .753**
Sig. (2-tailed) .000 .000N 100 100
X23 Pearson Correlation .622** .545**
Sig. (2-tailed) .000 .000N 100 100
X24 Pearson Correlation 1 .397**
Sig. (2-tailed) .000N 100 100
X25 Pearson Correlation .397** 1Sig. (2-tailed) .000
X26NPearson Correlation
100.308**
100.776**
Sig. (2-tailed) .002 .000
**. Correlation is significant at the 0.01 level (2-tailed).
*. Correlation is significant at the 0.05 level (2-tailed).
Page 5
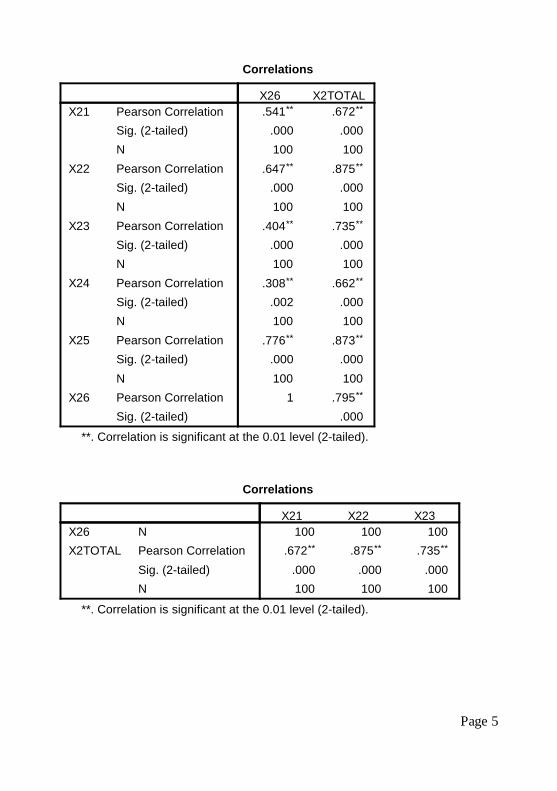
Correlations
X21 X22 X23X26X2TOTAL
NPearson Correlation
100.672**
100.875**
100.735**
Sig. (2-tailed) .000 .000 .000N 100 100 100
X21 Pearson CorrelationX26.541**
X2TOTAL.672**
Sig. (2-tailed) .000 .000N 100 100
X22 Pearson Correlation .647** .875**
Sig. (2-tailed) .000 .000N 100 100
X23 Pearson Correlation .404** .735**
Sig. (2-tailed) .000 .000N 100 100
X24 Pearson Correlation .308** .662**
Sig. (2-tailed) .002 .000N 100 100
X25 Pearson Correlation .776** .873**
Sig. (2-tailed) .000 .000N 100 100
X26 Pearson Correlation 1 .795**
Sig. (2-tailed) .000
**. Correlation is significant at the 0.01 level (2-tailed).
Correlations
**. Correlation is significant at the 0.01 level (2-tailed).

Page 6
Correlations
X26 X2TOTALX26 N 100 100X2TOTAL Pearson Correlation .795** 1
Sig. (2-tailed) .000N 100 100
X31 X32X31 Pearson Correlation
Sig. (2-tailed)1 .428**
.000N 100 100
X24 X25X26X2TOTAL
NPearson Correlation
100.662**
100.873**
Sig. (2-tailed) .000 .000N 100 100
**. Correlation is significant at the 0.01 level (2-tailed).
Correlations
**. Correlation is significant at the 0.01 level (2-tailed).
CORRELATIONS
/VARIABLES=X31 X32 X33 X3TOTAL
/PRINT=TWOTAIL NOSIG
/MISSING=PAIRWISE.
Correlations
[DataSet2] D:\TEST.sav
Correlations
**. Correlation is significant at the 0.01 level (2-tailed).

Page 7
Correlations
X32 Pearson CorrelationX31.428**
X321
Sig. (2-tailed) .000
X33NPearson Correlation
100.550**
100.716**
Sig. (2-tailed) .000 .000
X3TOTALNPearson Correlation
100.778**
100.854**
Sig. (2-tailed) .000 .000N 100 100
X32 Pearson CorrelationX33.716**
X3TOTAL.854**
Sig. (2-tailed) .000 .000N 100 100
X33 Pearson Correlation 1 .895**
Sig. (2-tailed) .000N 100 100
X3TOTAL Pearson Correlation .895** 1Sig. (2-tailed) .000N 100 100
X33 X3TOTALX31 Pearson Correlation
Sig. (2-tailed).550**
.000.778**
.000N 100 100
**. Correlation is significant at the 0.01 level (2-tailed).
Correlations
**. Correlation is significant at the 0.01 level (2-tailed).
Correlations
**. Correlation is significant at the 0.01 level (2-tailed).
CORRELATIONS

Page 8
Y11 Pearson CorrelationY11
1Y12.380**
Sig. (2-tailed) .000N 100 100
Y12 Pearson Correlation .380** 1Sig. (2-tailed) .000
Y13NPearson Correlation
100.308**
100.660**
Sig. (2-tailed) .002 .000
YNPearson Correlation
100.712**
100.856**
Sig. (2-tailed) .000 .000N 100 100
/VARIABLES=Y11 Y12 Y13 Y
/PRINT=TWOTAIL NOSIG
/MISSING=PAIRWISE.
Correlations
[DataSet2] D:\TEST.sav
Correlations
**. Correlation is significant at the 0.01 level (2-tailed).

Page 9
Y11 Pearson CorrelationY13.308**
Y.712**
Sig. (2-tailed) .002 .000
Y12NPearson Correlation
100.660**
100.856**
Sig. (2-tailed) .000 .000N 100 100
Y13 Pearson Correlation 1 .819**
Sig. (2-tailed) .000N 100 100
Y Pearson Correlation .819** 1Sig. (2-tailed) .000N 100 100
Correlations
**. Correlation is significant at the 0.01 level (2-tailed).

Page 1
Lampiran 5 Uji ReliabilitasGET
FILE='F:\FILE CHRISTIAN\TEST.sav'.
RELIABILITY
/VARIABLES=X1 X2 X3
/SCALE('ALL VARIABLES') ALL
/MODEL=ALPHA
/SUMMARY=TOTAL.
Reliability
[DataSet1] F:\FILE CHRISTIAN\TEST.sav
Scale: ALL VARIABLES
Case Processing Summary
N %Cases Valid 100 100.0
Excludeda 0 .0Total 100 100.0
a. Listwise deletion based on allvariables in the procedure.
Reliability Statistics
Cronbach'sAlpha
.849N of Items
3
Item-Total Statistics
Scale Corrected Cronbach'sScale Mean if Variance if Item-Total Alpha if Item
X1Item Deleted
6.9550Item Deleted
2.568Correlation
.808Deleted
.697X2 6.6333 3.100 .686 .820X3 6.9217 2.784 .669 .839

Page 1
RELIABILITY
/VARIABLES=X11 X12 X13 X14 X21 X22 X23 X24 X25 X26 X3
1 X32 X33 Y11 Y12 Y13
/SCALE('ALL VARIABLES') ALL
/MODEL=ALPHA
/SUMMARY=TOTAL.
Reliability
[DataSet2] D:\TEST.sav
Scale: ALL VARIABLES
Case Processing Summary
N %Cases Valid 100 100.0
Excludeda 0 .0Total 100 100.0
a. Listwise deletion based on allvariables in the procedure.
Reliability Statistics
Cronbach'sAlpha
.921N of Items
16
Item-Total Statistics
Scale Mean ifItem Deleted
ScaleVariance if
Item Deleted
CorrectedItem-TotalCorrelation
Cronbach'sAlpha if Item
DeletedX11 51.9900 139.970 .676 .915X12 51.8600 138.505 .645 .916X13 52.3200 140.018 .544 .919X14 52.1100 141.614 .625 .916X21 52.4900 142.555 .547 .919

Page 2
Item-Total Statistics
Scale Mean ifItem Deleted
ScaleVariance if
Item Deleted
CorrectedItem-TotalCorrelation
Cronbach'sAlpha if Item
DeletedX22 51.5300 139.363 .758 .913X23 51.6000 145.616 .475 .920X24 51.5800 147.923 .424 .922X25 51.5300 138.312 .802 .911X26 51.7600 139.477 .767 .913X31 51.6700 140.264 .690 .914X32 52.3600 142.354 .572 .918X33 52.0800 141.751 .632 .916Y11 51.9900 139.970 .676 .915Y12 52.0200 140.424 .655 .915Y13 51.6600 144.469 .531 .919
DATASET ACTIVATE DataSet1.
DATASET CLOSE DataSet2.

Page 1
Lampiran 6 Analisis RegresiSAVE OUTFILE='D:\TEST.sav'
/COMPRESSED.
COMPUTE X1=(X11 + X12 + X13 + X14)/4.
EXECUTE.
COMPUTE X2=(X21 + X22 + X23 + X24 + X25 + X26)/6.
EXECUTE.
COMPUTE X3=( X31 + X32 + X33)/3.
EXECUTE.
COMPUTE Y=(Y11 + Y12 + Y13)/3.
EXECUTE.
SAVE OUTFILE='D:\TEST.sav'
/COMPRESSED.
REGRESSION
/MISSING LISTWISE
/STATISTICS COEFF OUTS R ANOVA COLLIN TOL
/CRITERIA=PIN(.05) POUT(.10)
/NOORIGIN
/DEPENDENT Y
/METHOD=ENTER X1 X2 X3
/RESIDUALS DURBIN
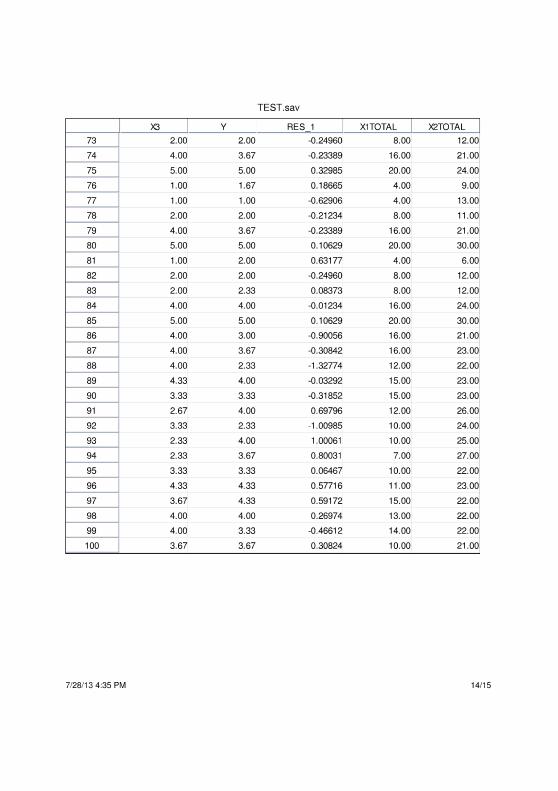
/SAVE RESID.
Regression
[DataSet2] D:\TEST.sav
Variables Entered/Removed
Model1
VariablesEntered
X3, X2, X1a
VariablesRemoved
.Method
Enter
a. All requested variables entered.

Page 2
Adjusted R Std. Error ofModel1
R.788a
R Square.620
Square.608
the Estimate.57522
Model Summaryb
a. Predictors: (Constant), X3, X2, X1
b. Dependent Variable: Y
Model Summaryb
ModelDurbin-Watson
1 2.002
b. Dependent Variable: Y
ANOVAb
Model1 Regression
ResidualTotal
Sum ofSquares
51.86231.76483.627
df Mean Square3 17.287
96 .33199
b. Dependent Variable: Y
ANOVAb
Model1 Regression
F52.247
Sig..000a
a. Predictors: (Constant), X3, X2, X1
b. Dependent Variable: Y

Page 3
Model Dimension EigenvalueCondition
Index1 1 3.912 1.000
2 .044 9.3983 .029 11.5974 .015 16.392
Coefficientsa
Unstandardized CoefficientsStandardizedCoefficients
Model B Std. Error Beta1 (Constant) .487 .264
X1 .277 .105 .283X2 .224 .099 .208X3 .381 .083 .403
a. Dependent Variable: Y
Coefficientsa
Collinearity Statistics
Model1 (Constant)
X1X2X3
t1.8462.6402.2674.589
Sig..068.010.024.000
Tolerance
.343
.471
.514
VIF
2.9142.1251.945
a. Dependent Variable: Y
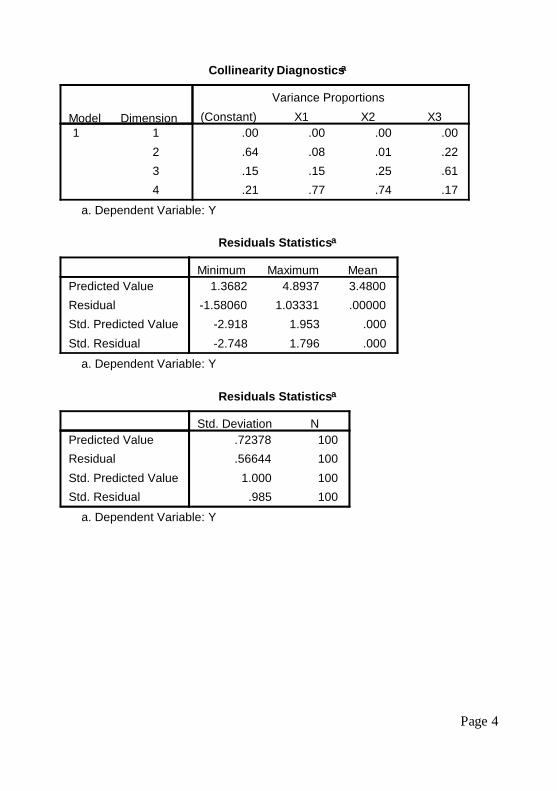
Collinearity Diagnosticsa
a. Dependent Variable: Y
Page 4
Collinearity Diagnosticsa
Variance Proportions
Model Dimension (Constant) X1 X2 X31 1 .00 .00 .00 .00
2 .64 .08 .01 .223 .15 .15 .25 .614 .21 .77 .74 .17
a. Dependent Variable: Y
Residuals Statisticsa
Minimum Maximum MeanPredicted Value 1.3682 4.8937 3.4800Residual -1.58060 1.03331 .00000Std. Predicted Value -2.918 1.953 .000Std. Residual -2.748 1.796 .000
a. Dependent Variable: Y
Residuals Statisticsa
Std. Deviation NPredicted Value .72378 100Residual .56644 100Std. Predicted Value 1.000 100Std. Residual .985 100
a. Dependent Variable: Y
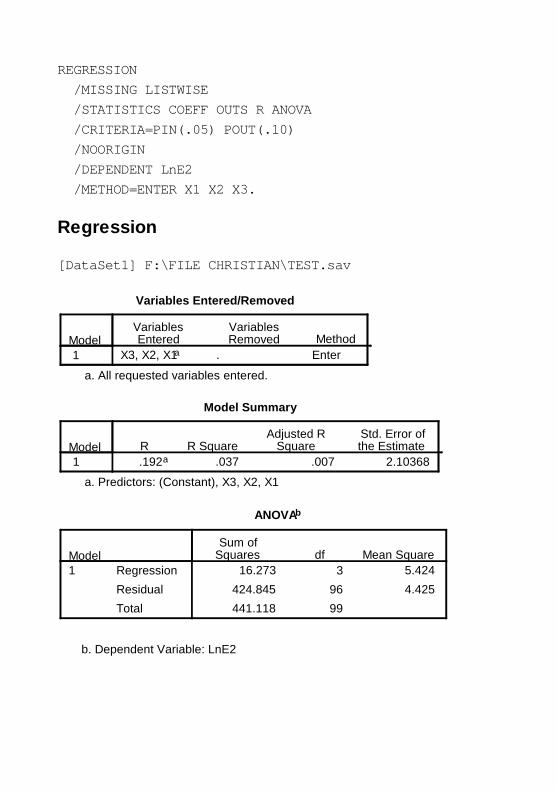
Adjusted R Std. Error ofModel1
R.192a
R Square.037
Square.007
the Estimate2.10368
REGRESSION
/MISSING LISTWISE
/STATISTICS COEFF OUTS R ANOVA
/CRITERIA=PIN(.05) POUT(.10)
/NOORIGIN
/DEPENDENT LnE2
/METHOD=ENTER X1 X2 X3.
Regression
[DataSet1] F:\FILE CHRISTIAN\TEST.sav
Variables Entered/Removed
Model1
VariablesEntered
X3, X2, X1a
VariablesRemoved
.Method
Enter
a. All requested variables entered.
Model Summary
a. Predictors: (Constant), X3, X2, X1
ANOVAb
Sum ofModel1 Regression
Squares16.273
df3
Mean Square5.424
Residual 424.845 96 4.425Total 441.118 99
b. Dependent Variable: LnE2

ANOVAb
Model1 Regression
F1.226
Sig..305a
a. Predictors: (Constant), X3, X2, X1
b. Dependent Variable: LnE2
Coefficientsa
Unstandardized CoefficientsStandardizedCoefficients
Model B Std. Error Beta1 (Constant) -1.829 .965
X1 -.225 .383 -.100X2 .407 .361 .165X3 -.379 .304 -.174
a. Dependent Variable: LnE2
Coefficientsa
Model t Sig.1 (Constant) -1.896 .061
X1 -.587 .559X2 1.128 .262X3 -1.248 .215
a. Dependent Variable: LnE2