Lagged effects of the Mistral wind on heavy precipitation ...
16
HAL Id: hal-01318086 https://hal-ensta-paris.archives-ouvertes.fr//hal-01318086 Submitted on 23 May 2016 HAL is a multi-disciplinary open access archive for the deposit and dissemination of sci- entific research documents, whether they are pub- lished or not. The documents may come from teaching and research institutions in France or abroad, or from public or private research centers. L’archive ouverte pluridisciplinaire HAL, est destinée au dépôt et à la diffusion de documents scientifiques de niveau recherche, publiés ou non, émanant des établissements d’enseignement et de recherche français ou étrangers, des laboratoires publics ou privés. Lagged effects of the Mistral wind on heavy precipitation through ocean-atmosphere coupling in the region of Valencia (Spain) Ségolène Berthou, Sylvain Mailler, Philippe Drobinski, Thomas Arsouze, Sophie Bastin, Karine Béranger, Cindy Lebeaupin-Brossier To cite this version: Ségolène Berthou, Sylvain Mailler, Philippe Drobinski, Thomas Arsouze, Sophie Bastin, et al.. Lagged effects of the Mistral wind on heavy precipitation through ocean-atmosphere coupling in the region of Valencia (Spain). Climate Dynamics, Springer Verlag, 2018, 51 (3), pp.969-983. 10.1007/s00382-016- 3153-0. hal-01318086
Transcript of Lagged effects of the Mistral wind on heavy precipitation ...

HAL Id: hal-01318086https://hal-ensta-paris.archives-ouvertes.fr//hal-01318086
Submitted on 23 May 2016
HAL is a multi-disciplinary open accessarchive for the deposit and dissemination of sci-entific research documents, whether they are pub-lished or not. The documents may come fromteaching and research institutions in France orabroad, or from public or private research centers.
L’archive ouverte pluridisciplinaire HAL, estdestinée au dépôt et à la diffusion de documentsscientifiques de niveau recherche, publiés ou non,émanant des établissements d’enseignement et derecherche français ou étrangers, des laboratoirespublics ou privés.
Lagged effects of the Mistral wind on heavyprecipitation through ocean-atmosphere coupling in the
region of Valencia (Spain)Ségolène Berthou, Sylvain Mailler, Philippe Drobinski, Thomas Arsouze,
Sophie Bastin, Karine Béranger, Cindy Lebeaupin-Brossier
To cite this version:Ségolène Berthou, Sylvain Mailler, Philippe Drobinski, Thomas Arsouze, Sophie Bastin, et al.. Laggedeffects of the Mistral wind on heavy precipitation through ocean-atmosphere coupling in the region ofValencia (Spain). Climate Dynamics, Springer Verlag, 2018, 51 (3), pp.969-983. �10.1007/s00382-016-3153-0�. �hal-01318086�
1 3
DOI 10.1007/s00382-016-3153-0Clim Dyn
Lagged effects of the Mistral wind on heavy precipitation through ocean‑atmosphere coupling in the region of Valencia (Spain)
Ségolène Berthou1,2 · Sylvain Mailler1 · Philippe Drobinski1 · Thomas Arsouze1,3 · Sophie Bastin4 · Karine Béranger1,5 · Cindy Lebeaupin Brossier6
Received: 15 November 2015 / Accepted: 26 April 2016 © Springer-Verlag Berlin Heidelberg 2016
of warm and moist air towards the Mediterranean Spanish coast, possibly leading to HPEs. The depression in the Gulf of Genoa generates intense northerly (Mistral) to north-westerly (Tramontane/Cierzo) winds. In most cases, these intense winds trigger entrainment at the bottom of the oce-anic mixed layer which is a mechanism explaining part of the SST cooling in most cases. Our study suggests that the SST cooling due to this strong wind regime then persists until the HPEs and reduces the precipitation intensity.
1 Introduction
The region of Valencia in Spain is prone to heavy precipi-tation events (HPEs) which can reach up to 800 mm in a few days like on 2 October 1957 in Javea (878 mm) or on 3 November 1987 in Oliva (817 mm) (Peñarrocha et al. 2002). The eastern part of the Prebetic chains culminates at more than 1000 m to form the the Aitana mountain range near the Cap de la Nau. This region is particularly affected by such extreme events (Fig. 1a and b present the topogra-phy of the model and the geography of the region). HPEs in the Spanish Mediterranean coastal areas are mostly favored by advection of warm and moist air from the East, jointly linked with a European anticyclone and a low developed over the Alboran Sea or on the Algerian coast, in the lee of the Atlas Mountains. At the same time, the presence of a trough or a cut-off low over the Iberian peninsula together with colder air in the high troposphere destabilizes the air advected from the east (Fernández et al. 1995; Doswell III et al. 1998; Ramis et al. 1998; Homar et al. 2002). Millán et al. (1995, 2005) and Pastor et al. (2001) showed another mechanism linked with advection of colder continental air from the east over the warmer Mediterranean which induced moisture uptake. However, Romero et al. (1999)
Abstract The region of Valencia in Spain has historically been affected by heavy precipitation events (HPEs). These HPEs are known to be modulated by the sea surface tem-perature (SST) of the Balearic Sea. Using an atmosphere-ocean regional climate model, we show that more than 70 % of the HPEs in the region of Valencia present a SST cooling larger than the monthly trend in the Northwestern Mediterranean before the HPEs. This is linked to the break-ing of a Rossby wave preceding the HPEs: a ridge-trough pattern at mid-levels centered over western France associ-ated with a low-level depression in the Gulf of Genoa pre-cedes the generation of a cut-off low over southern Spain with a surface depression over the Alboran Sea in the lee of the Atlas. This latter situation is favourable to the advection
This paper is a contribution to the special issue on Med-CORDEX, an international coordinated initiative dedicated to the multi-component regional climate modelling (atmosphere, ocean, land surface, river) of the Mediterranean under the umbrella of HyMeX, CORDEX, and Med-CLIVAR and coordinated by Samuel Somot, Paolo Ruti, Erika Coppola, Gianmaria Sannino, Bodo Ahrens, and Gabriel Jordà.
* Ségolène Berthou [email protected]
1 IPSL/Laboratoire de Météorologie Dynamique, CNRS, ENPC, ENS, PSL Research University, Ecole polytechnique, Université Paris-Saclay, UPMC Univ Paris 06, Sorbonne Universités, Palaiseau, France
2 Met Office Hadley Centre, Exeter, United Kingdom3 ENSTA ParisTech, Université Paris-Saclay, Palaiseau, France4 IPSL/Laboratoire ATmosphère, Milieux, Observations
Spatiales, Guyancourt, France5 LTHE, Grenoble, France6 GAME-CNRM, Météo France/CNRS, Toulouse, France

S. Berthou et al.
1 3
showed that the first situation (AP12, 13, 14 in their arti-cle) explained most of the HPEs in Valencia (TP5 in their article).
Most precipitation events in this region occur over orog-raphy (Pastor et al. 2010). While such events are more fre-quent in autumn, they also occur in winter and spring (Mil-lán et al. 2005).
Pastor et al. (2001, 2015) showed the importance of sea surface temperature (SST) upstream of the precipitating systems for destabilizing and moistening the air masses. Pastor et al. (2015) also showed that reducing the SST in the Balearic Sea to 10 °C prevents intense precipitation in the region of Valencia in two out of their three case studies. Most studies of the Western Mediterranean HPEs showed that changes of a few degrees in the upstream SST could modulate precipitation events but in most situations could not drastically change them (Lebeaupin et al. 2006; Kat-safados et al. 2011; Miglietta et al. 2011; Berthou et al. 2015), except in specific cases: for a squall line on the Balearic islands where SST was determinant in the erosion of an inversion layer (Romero et al. 2014) and a case where the cyclone track was affected and did not land on Calabria anymore (Senatore et al. 2014).
Lebeaupin Brossier et al. (2013) and Berthou et al. (2014, 2015) showed with regional climate hindcast sim-ulations that HPEs in the Cévennes (southern France) could be modulated by the prior history of Mistral in some cases. However, Berthou et al. (2016) showed that cooling of SST by Mistral does not systematically
occur before HPEs in the Cévennes. Moreover, in their study, precipitation in the region of Valencia had one of the strongest sensitivities to SST changes among 5 other regions hit by intense precipitation during the Hydro-logical cycle in Mediterranean experiment (HyMeX) 1st Observation Period (Ducrocq et al. 2014). They further showed that the Balearic Sea presented relatively large submonthly SST variations. These variations are most presumably due to strong wind regimes when colder and drier continental air is advected over the Western Medi-terranean basin from the north between the Massif Cen-tral and the Alps (Mistral: Guénard et al. 2005, 2006; Drobinski et al. 2005) or the northwest between the Pyr-enees and the Massif Central (Tramontane: Drobinski et al. 2001) or in the Ebre valley (Cierzo: Tout and Kemp 1985; Masson and Bougeault 1996) and to oceanic eddies. These winds generate strong air–sea fluxes able to cool down the whole oceanic mixed layer (OML), to deepen it, and to enhance the local oceanic circula-tion and the spatial SST gradients, thus bringing persis-tent SST anomalies for 10–15 days (Lebeaupin Brossier and Drobinski 2009; Small et al. 2012). Berthou et al. (2016) also showed that SST cooling in the Balearic Sea occurred in 73 % of the HPEs in the region of Valencia. The present study therefore focuses on the evolution of the synoptic situation which leads to the succession of SST cooling and HPE and on the subsequent effect on precipitation in an atmosphere–ocean coupled regional climate model (AORCM).
Fig. 1 Grey shading: orography (m). a Blue contours: occurrences of daily rain greater than 50 mm among the selected events, con-tour every 5 occurrences. Red contours: occurrences of mean surface wind greater than 10 m s
−1among the selected events, contour every 5 occurrences, first contour for 15 occurrences. Total number of events is 26. The box in thick blue lines shows the zone selected for calcu-
lating the rain differences between simulations (irain) and the box in thick red lines shows the zone selected for calculating the SST differ-ences between simulations (IPSS), maximum CAPE and mean mois-ture convergence in Fig. 4. The box in thick yellow line is used for calculating the pressure evolution in Fig. 7. b Green box: zone where the HPEs were selected

Lagged effects of the Mistral on HPEs in Valencia
1 3
Regional climate models (RCMs) give the possibility to represent mesoscale patterns of precipitation extremes mostly constrained by orography at climate time-scales (Frei et al. 2006; Herrera et al. 2010; Colin 2012; Prein et al. 2015a). Furthermore, AORCMs show good ability to reproduce strong winds (Herrmann et al. 2011) and vari-ations of SST at the submonthly time-scale which mainly involve the response of the OML to atmospheric forcings (The PROTHEUS Group et al. 2009; Sevault et al. 2014).
After the presentation of the AORCM, the simulations and the datasets in Sect. 2, we examine the characteristics of the HPEs in the Valencia region which present negative submonthly SST variations in Sect. 3. In Sect. 4, we study the evolution of the synoptic conditions which lead to a drop in SST before HPEs. The oceanic mechanisms at play in the SST cooling are then analysed in Sect. 5. Finally, we consider the influence of this cold anomaly on precipitation and establish some hypotheses about the mechanisms at work in most cases in Sect. 6.
2 Methods
2.1 MORCE platform
The MORCE (model of the regional coupled Earth system) platform is the AORCM used in this study (Drobinski et al. 2012). The MORCE system is used in HyMeX (Drobin-ski et al. 2014) and the Coordinated downscaling experi-ment (CORDEX) of the World climate research program (WCRP) (Giorgi et al. 2009) in the Mediterranean area (Med-CORDEX, Ruti et al. (2015)).
The atmospheric model within the MORCE system is the non-hydrostatic weather research and forecasting model (WRF) version 3.1.1 of the National Center for Atmos-pheric Research (NCAR) (Skamarock et al. 2008). The domain covers the Mediterranean basin in line with COR-DEX requirements with a horizontal resolution of 20 km. It has 28 vertical levels from the surface to 50 hPa using sigma coordinates. The first 1000 m are resolved on 8 levels.
The boundary layer parameterization is a K-profile scheme improved by Noh et al. (2003) (YSU). The sur-face-layer is the Monin–Obukov scheme (Stull 1988). The cumulus convection scheme is the Kain–Fritsch scheme (Kain and Fritsch 1990; Kain 2004). It is a mass flux parameterization scheme with a closure assumption based on CAPE after dilution by entrainment. Convection is trig-gered when the temperature of a 60hPa layer is higher than the environment temperature at its condensation level. A temperature deviation is added to the parcel depending on the larger scale vertical velocity in order to trigger convec-tion in a sub-cloud converging environment. Moreover, the
maximal rate of entrainment is weaker when low-level con-vergence is stronger.
The DIFF land surface model (LSM) is based on a 5-layer simple scheme where the energy budget includes radiation, sensible and latent heat. The last layer is at 16 cm depth, under which the temperature is fixed at a deep-layer average. Vegetation effects are not taken into account. Dur-ing the simulation, an empirical coefficient, called soil moisture availability is applied for latent heat flux calcula-tion. The complete set of physical parameterizations can be found in Lebeaupin Brossier et al. (2013).
The ocean model of MORCE is Nucleus for European Modelling of the Ocean (NEMO) (Madec and the NEMO Team 2008). It is used in a regional eddy-resolving Medi-terranean configuration MED12 (Lebeaupin Brossier et al. 2011; Beuvier et al. 2012) with a 1/12° horizontal resolu-tion, which represents about 6.5–7 km in the Balearic Sea. In the vertical, MED12 has 50 stretched z-levels with a resolution of 1m for the surface layer. The initial conditions for 3D potential temperature and salinity fields are provided by the Mediterranean oceanic database version 4 (MODB4) climatology (Brankart and Brasseur 1998) except in the Atlantic zone between 11°W and 5.5°W, where the Levi-tus et al. (2005) climatology is applied. In this area, a three dimensional relaxation toward this monthly climatology is used. River runoff and the Black Sea water input come from a climatology and their freshwater flux is set at the mouths of the 33 main rivers and at the strait of Darda-nelles respectively. Smaller river runoffs are summed and set as a homogeneous coastal runoff around the Mediter-ranean Sea as in Beuvier et al. (2012). Further details on the ocean model parameterization can be found in Beuvier et al. (2012) and Lebeaupin Brossier et al. (2013).
2.2 Configuration of the model and simulations
A dynamical downscaling of the ERA-Interim reanalyses is performed with the MORCE platform, on the one hand with a fully atmosphere-ocean coupled simulation and the other hand with an atmosphere-only simulation. The two companion simulations were run from 1989 to 2008. The atmosphere-ocean fully coupled simulation is called CPL: the surface fluxes calculated by WRF and the SST by NEMO are exchanged with a 3 h frequency through the OASIS coupler (Valcke 2013). The atmosphere-only simu-lation is called SMO (for monthly-smoothed SST). In fact, the SST field in SMO has been designed in order to retain the same climatology and diurnal cycle as the CPL SST, but without the submonthly SST variations. For that pur-pose, the SST value used to force the RCM at each target time step, which corresponds to 3 h, was calculated by per-forming a central moving average with a 31-day window of CPL SST (calculated by NEMO), retaining only the 31
S. Berthou et al.
1 3
time steps in the time window that correspond to the same GMT time as the target time step. This way, the high-fre-quency air–sea coupling effects (submonthly variations) are filtered out in SMO.
Nudging above the boundary layer is used in order to avoid a large-scale that would diverge from the observed large-scale structures inside the limited area (Stauffer and Seaman 1990; Salameh et al. 2010; Omrani et al. 2013). The main disadvantage of this technique is to dampen the response of the free troposphere to surface changes. However, the major advantage is that the large-scale still respects the ERA interim one and the chronology of events is similar between two simulations that have different sur-face boundary conditions (Herrmann et al. 2011). Indis-criminate nudging (Newtonian-type nudging) is used to constrain the fields above the planetary boundary layer with a coefficient of 5.10−5
s−1 (about 5.5 h) for temperature,
humidity and velocity components. The nudging coeffi-cient was chosen following Omrani et al. (2013) so that the relaxation time is large enough to constrain the large scale without prohibiting small-scale evolution.
2.3 Datasets
2.3.1 Spain02
Spain02 is a high-resolution (0.2°) daily precipitation grid-ded dataset developed for peninsular Spain and the Balearic islands using 2756 quality-controlled stations over the time period from 1971 to 2010 (Herrera et al. 2012). The grid was produced applying the kriging method in a two-step process. First, the occurrence was interpolated using a binary kriging and, in a second step, the amounts were interpolated by applying ordinary kriging to the occur-rence outcomes. The elevation is not explicitly included in the development of the dataset because the available dense gauge network appropriately represents the orography cor-responding to the 0.2° grid. Explicit comparison with the European gridded dataset E-OBS (Haylock et al. 2008) shows the better performance in terms of amount and spa-tial distribution of Spain02 to capture extreme events, espe-cially in the region of Valencia (Herrera et al. 2012). In this study, only the data for the 1989–2008 period is used.
2.3.2 CNR
This dataset also covers the whole period 1989–2008 in SST of the Western Mediterranean basin and was com-puted by the CNR-ISAC-GOS (Consiglio Nazionale delle Ricerche, Istituto di Scienze dellAtmosfera e del Clima-Gruppo di Oceanografia da Satellite, Italy) (CNR-ISAC-GOS REP L4, described in Buongiorno Nardelli et al. (2014)). We will name it CNR SST. The data corresponds
to daily (night-time) gridded optimally interpolated satel-lite estimates of the foundation SST over the Mediterra-nean, based on AVHRR Pathfinder Version 5.2 (PFV52). The interpolation is done on the original Pathfinder grid (at 4 km × 4 km spatial resolution). The SST analysis is then obtained as a linear combination of the observations, weighted directly with their correlation to the interpolation point and inversely with their cross-correlation and meas-urement error. The chosen scheme uses a daily decadal cli-matology as first guess (built from the entire PFV52 data-set), and a covariance model that assumes spatially varying parameters. The input data is selected only within a lim-ited sub-domain (within a space-time influential radius), namely within a temporal window of ten days and a spatial influential radius ranging between 300 and 900 km.
3 Characteristics of the modeled HPEs
Different definitions can be chosen to select HPEs. Romero et al. (1998) used a criteria of more than 8 stations exceed-ing 50 mm precipitation, which resulted in 21 events in 30 years (1964–1993). Millán et al. (1995) use a 80 mm criteria by station and then use a spatial average to avoid single station events. In this study, the heaviest precipita-tion events are chosen so that an average of 1.25 HPE per year of simulation is retained: a threshold of 86 mm of precipitation in the timeseries of the spatial maximum of daily rain (06 UTC to 06 UTC) over the region described in Fig. 1b is used on the 20 km spatial grid of the model. A grid point being already 20 km by 20 km big, a single point is considered as covering a large enough area to retain a HPE. In Berthou et al. (2016), we showed that this crite-ria allowed a hit rate of 0.48 in comparison with the same criteria used for gridded rain product “Spain02” (Herrera et al. 2012) (with a threshold of 78 mm in the latter dataset, regridded on the same model grid). Furthermore, 80 % of these events are also found amongst the 100 most intense events of Spain02 (Berthou et al. 2016).
Figure 2 shows the monthly distribution of these HPEs for MORCE and Spain02.
Most of these events occur in autumn but some also occur in winter and spring.
We focus on the HPEs which present a cold SST anom-aly on average in the zone upstream of the precipitation (the red zone in Fig. 1a) between CPL and SMO simulations. Such a cold anomaly reflects a drop in the SST before the precipitation event. Twenty out of the 26 HPEs that have been chosen for CPL (i.e. 77 %) present such an anomaly. This is 23 out of the 27 HPEs selected from Spain02 (i. e. 85 %), using CPL-SMO. This is all the more remarkable given that the ratio is between 50 and 60 % in the other regions studied in Berthou et al. (2016). Statistically, the

Lagged effects of the Mistral on HPEs in Valencia
1 3
mean difference between CPL SST (SSTCPL) and SMO SST (SSTSMO) in the Balearic Sea (red zone in Fig. 1a) of all events is different from a null average with 98 % prob-ability using a Student t-test. In order to isolate the impact of this SST cooling, we have only selected the 20 HPEs for which SSTCPL–SSTSMO is negative in the Balearic Sea for the rest of the study.
Figure 3a (colours), c (blue lines) show that the mean rainfall of the selected HPEs in the model agrees in terms of spatial distribution and intensity with the composite of the selected HPEs in Spain02. The maximum precipitation of just above 80 mm is located on the windward side of the Aitana range in both datasets.
Figure 3 shows the composites of synoptic and mes-oscale conditions responsible for the selected HPEs in CPL. Figure 3d (resp. Fig. 3e) shows the 500 hPa (resp. 925 hPa) geopotential height composite at 1200 UTC on the HPE days. Although this does not represent a physi-cal situation, it shows that in most cases, a cut-off low is present above the Iberian peninsula whereas higher geo-potential height values are found on the British Isles. In most cases, it is accompanied by a surface depression cen-tered on the Alboran Sea and a high atmospheric pressure on northwestern Europe. The configuration is such that an intense low-level northeasterly flux feeds the precipitat-ing systems (Fig. 3b) while the tropospheric cut-off low associated with relatively cold air increases instability and generates large-scale ascending motion in the region of Valencia. This configuration is similar to patterns obtained by Romero et al. (1999) and characteristic of warm advec-tions. Figure 3 further shows the wind at low levels blows from the East/Northeast on the Balearic Sea (panels c and e) and from the South at 500 hPa in the same area (panel d): the wind is turning clockwise with height and shows warm advection.
This composite however hides a variety of situations shown in Fig. 4. This figure shows that most events have moisture fluxes in the first 3 km of the atmosphere above 100 kg s−1 m−1 which can reach up to 400 kg s−1 m−1. The maximal CAPE over the Balearic Sea is very variable: from 200 to 3200 J kg−1. Figure 4b shows a quasi-linear relationship between CAPE and moisture convergence: the larger the moisture convergence, the larger the CAPE. Crosses in the figure signal events for which parameterized precipitation had a larger share than the explicit ones. This is the case for six HPEs, mainly with high values of CAPE and moisture convergence.
4 Succession of events in the week preceding the HPEs in the Valencia region
The origin of the cold anomaly between CPL and SMO in more than 75 % of the cases is examined here. Figure 5 shows that it is about 0.3 to 0.5 °C off the coast of the Pyr-enees and down to the Balearic Islands and 0.1–0.3 °C south of the Balearic Islands on average. Figure 6 shows a composite of synoptic conditions as a retrospective from the HPE day (D) back to 7 days before the HPEs (D-7). Seven days before the HPEs (D-7), the 500 hPa geopoten-tial height is almost zonally homogenous, characteristic of the mean circulation. At D-5, the succession of a ridge at 30°W and a trough at 10°E is discernable in the com-posite, which intensifies in the following days until D-2: this shows a Rossby wave. It is associated with a depres-sion in the Gulf of Genoa shown in the 925 hPa geopoten-tial height. This is typical of a Mistral situation (Jiang et al. 2003; Drobinski et al. 2005; Guénard et al. 2005 and cluster H2-C1 in Littmann 2000). Tramontane and Cierzo are also associated with this type of situtation. At D-1, a
20niapSLPC(a) (b)
2 4 6 8 10 120
1
2
3
4
5
6
7 all
cold SST
2 4 6 8 10 120
1
2
3
4
5
6
7 all
cold SST
Fig. 2 HPE monthly distribution (with the criteria of 1.25 HPE/year), y-axis is the number of HPEs for the period 1989–2008, x-axis shows the months. The light grey corresponds to events with negative
SSTCPL–SSTSMO whereas the added dark grey corresponds to events with positive SSTCPL–SSTSMO. a HPEs selected in CPL simulation. b HPEs selected in Spain02

S. Berthou et al.
1 3
positive meridional gradient in the geopotential at 10°W is noticed, which is a characteristic of Rossby wave breaking. The signal in the 925 hPa is mixed between a depression in the Gulf of Genoa and a depression centered over the Alboran Sea. It still looks like a physical situation such as
cluster H2–C2 in Littmann (2000). Finally, a cut-off low is present in the composite at 500 hPa on the HPE days, when the wave breaking is intensified. This is accompanied in the lower levels by a depression on the Alboran Sea and an anticyclone on northern Europe. This composite shows that
Fig. 3 Composite for the 20 events with a cold SST difference between CPL and SMO. a Colours: rain aver-age for the selected events in Spain02 (mm), the precipitation maximum is located on the windward side of the Aitana range; shading: orography every 500 m. b CAPE (colours, J kg−1). Cyan contours: explicit precipitation. Magenta con-tours: parameterised precipita-tion, contour every 10 mm. Grey shading: orography every 500 m. c Colours: moisture divergence (kg kg−1 s−1). Blue contour: total precipitation, contour every 20 mm. Black contour: orography every 500 m. d Geopotential height at 500 hPa at 1200 UTC (m). e Geopotential height at 925 hPa at 1200 UTC.
(a) Rain, Spain02
36◦N
38◦N
40◦N
42◦N
44◦N
2◦W 0◦ 2◦E 4◦E 6◦E 8◦E 10◦E20
40
60
80
100
LPC,ecnegreviderutsioMLPC,EPAC
36◦N
38◦N
40◦N
42◦N
44◦N
2◦W 0◦ 2◦E 4◦E 6◦E 8◦E 10◦E100
200
300
400
500
600
700
Jkg−1
10 ms−1
36◦N
38◦N
40◦N
42◦N
44◦N
2◦W 0◦ 2◦E 4◦E 6◦E 8◦E 10◦E-1.2e-06
-8.0e-07
-4.0e-07
0.0e+00
4.0e-07
8.0e-07
1.2e-06
kgkg−1s−
1
LPC,aPh529.poeGmiretnI-ARE,aPh005.poeG
20◦N
30◦N
40◦N
0◦60◦W 40◦W 20◦W5200528053605440552056005680576058405920
30◦N
35◦N
40◦N
45◦N
50◦N
10◦W 0◦ 10◦E 20◦E 30◦E
750
750
750
760
760
760
770
770
770
780
780
780
780
790 790
790
790 790
800 800
800 80
0 800
800800
800
800
810
810810 810
810
820
820
830840
850
0
500
1000
1500
2000
2500
(b) (c)
(d) (e)
0 50 100 150 200 250 300 350 400 450
Moisture flux. ( kg s−1m−1)
0
500
1000
1500
2000
2500
3000
3500
Jkg−1 )
0.0 0.2 0.4 0.6 0.8 1.0
Moisture conv. ( kg kg−1 s−1) ×10−6
0
500
1000
1500
2000
2500
3000
3500
CAPE(
CAPE(J
kg−1 )
(a) (b)
Fig. 4 For every HPE: crosses (resp. dots) show HPEs for which the share of parameterized precipitation is greater (resp. smaller) than explicit precipitation averaged in the blue box of Fig. 1a. a Maximum daily averaged CAPE in the SST upstream zone defined
in Fig. 1a plotted against the mean moisture flux integrated over 2800 m and entering perpendicular to the double arrow plotted in Fig. 1a. b Maximum CAPE plotted against the mean moisture con-vergence in the SST upstream zone defined in Fig. 1a

Lagged effects of the Mistral on HPEs in Valencia
1 3
most HPEs with SSTCPL–SSTSMO negative difference are preceded by a Mistral event because of the intensification and breaking of a Rossby wave.
Figure 7a completes this analysis by showing the tem-poral mean of surface pressure in the Gulf of Genoa for HPEs with SSTCPL–SSTSMO negative difference (in blue) and for all HPEs (in black). Comparing the mean time series with a climatological mean (average of the monthly means weighted by the HPE monthly distribution), this fig-ure shows that the significance interval at 97.5 % is below this average from D-5 to D-3 for all HPEs: the majority of HPEs occurring in Valencia are preceded by a depres-sion in the Gulf of Genoa in the 5 days preceding the HPE. This depression is the signature of a Mistral regime (Jiang et al. 2003; Drobinski et al. 2005; Guénard et al. 2005). Figure 7c shows the same composite for the HPEs selected in Spain02: it also shows a significant decrease in pressure in the Gulf of Genoa for the period from D-5 to D-4.
5 Mistral and SST cooling
Mistral can generate intense air–sea fluxes because of the strength of the winds and the large amplitude of tempera-ture and moisture contrast between the sea surface and the atmospheric boundary layer (Flamant 2003). For exam-ple, Lebeaupin Brossier and Drobinski (2009) showed that winds stronger than 10 m s−1 on average over the Gulf of Lions down to Sardinia for 20 h during a Mistral event which occurred in March can decrease the SST by 0.2 °C over this zone and during a Mistral event occur-ring in November with winds stronger than 10 m s−1 for 60 h can decrease the SST by 0.5 °C. This resulting cool-ing can be more or less strong according in particular to the OML stratification and depth (Small et al. 2012). The
latter is deeper in winter and shallower in summer (Houpert et al. 2015). Therefore, HPEs are not preceded by similar intensities of SST cooling, as illustrated by Fig. 9. In this figure, following Berthou et al. (2016), the index irain is cal-culated as the spatial root mean square (RMS) of rain dif-ferences between CPL and SMO in the blue box of Fig. 1a divided by the rain maximum in CPL simulation and IPSS is the spatial RMS of SST differences in the red box in Fig. 1a. Winter events have weak IPSS whereas IPSS can reach 1.4 °C in other seasons. In composite, Fig. 7b shows the time series of SSTCPL–SSTSMO intensity. It starts to decrease at D-5, when Mistral starts to blow and becomes significantly negative among cold events 2 days before the HPEs, showing that the SST decrease is larger than the monthly tendency. It is also the case for the Spain02 events using the equivalent CPL-SMO calculated from CNR SST dataset. The difference in SST with the seasonal trend is even more negative at D and already significant at D-4 in this dataset and for this HPE selection, which are totally independent of the simulations. The marginally significant positive anomalies of the SST around D-10 cannot be given a physical interpretation: they are a mere statistical conse-quence of the fact that the SMO SST is a smoothed version of the CPL SST computed by a 31-day moving average, so that negative differences at D0 statistically need to have a positive counterpart away from D0.
Although both CNR and the model show a signifi-cant cooling preceding the HPEs, it is worth noting a few model biases regarding the Mistral distribution and inten-sity. Obermann et al. (2016) show in their Fig. 10 that the model used in the present study (IPSL-WRF311 0.18) overestimates the intensity of Mistral downstream of Cap Creus and the intensity of Cierzo between Valencia and Ibiza compared to Quickscat and other RCMs. The largest
OMS-LPCniaROMS-LPCTSS
10 ms−1
36◦N
38◦N
40◦N
42◦N
44◦N
2◦W 0◦ 2◦E 4◦E 6◦E 8◦E 10◦E−0.55
−0.35
−0.15
0.05
0.25
0.45
38◦N
40◦N
2◦W 0◦ 2◦E 4◦E
−9−7−5−3−113579
(a) (b)
Fig. 5 Composite for the events with cold SST anomalies between CPL and SMO. a Colours: SST differences between CPL and SMO (only significant values above 97.5 % probability of rejecting a zero average difference with a Student t test are shown). Arrows: CPL
wind (averaged on the first levels (≃0–800 m)). Blue contours: CPL rain (contour every 50 mm). b Colours: Rain differences (mm). Red contours: significant rain difference values above 97.5 %. Blue con-tours: CPL rain (contour every 50 mm)

S. Berthou et al.
1 3
20◦N
30◦N
40◦N
0◦60◦W 40◦W 20◦W5200528053605440552056005680576058405920
(b) Geopotential height at 925 hPa, D
30◦N
35◦N
40◦N
45◦N
50◦N
10◦W 0◦ 10◦E 20◦E 30◦E
750
750
750
760
760
760
770
770
770
780
780
780
780
790 790
790
790 790
800 800
800 80
0 800
800800
800
800
810
810810 810
810
820
820
830840
850
0
500
1000
1500
2000
2500
20◦N
30◦N
40◦N
0◦60◦W 40◦W 20◦W5200528053605440552056005680576058405920
30◦N
35◦N
40◦N
45◦N
50◦N
10◦W 0◦ 10◦E 20◦E 30◦E
760 770
770
780
780
780
780
780
780
780
780
780
790
097
790
790
800
800
800
81082
0830
840850
0
500
1000
1500
2000
2500
20◦N
30◦N
40◦N
0◦60◦W 40◦W 20◦W5200528053605440552056005680576058405920
30◦N
35◦N
40◦N
45◦N
50◦N
10◦W 0◦ 10◦E 20◦E 30◦E
770 770770
770
770
780
780
780
780
780
780
790
790
790790
800
800
800
810
810
82083
0
0
500
1000
1500
2000
2500
(g) D - 3
20◦N
30◦N
40◦N
0◦60◦W 40◦W 20◦W5200528053605440552056005680576058405920
30◦N
35◦N
40◦N
45◦N
50◦N
10◦W 0◦ 10◦E 20◦E 30◦E
760
760
760
770780
087
790
790
790
097
790
800 800
800800
810 81
0
810
820
820
830
0
500
1000
1500
2000
2500
20◦N
30◦N
40◦N
0◦60◦W 40◦W 20◦W5200528053605440552056005680576058405920
30◦N
35◦N
40◦N
45◦N
50◦N
10◦W 0◦ 10◦E 20◦E 30◦E
770
780
780
780
780 780
790
790
790
790
790790
800
800
800
800
800
810
810
810
810
820
0
500
1000
1500
2000
2500
20◦N
30◦N
40◦N
0◦60◦W 40◦W 20◦W5200528053605440552056005680576058405920
30◦N
35◦N
40◦N
45◦N
50◦N
10◦W 0◦ 10◦E 20◦E 30◦E
780790790
800
800
800
800
800 800
810
810
810
810 810810
820
820
820820820
0
500
1000
1500
2000
2500
(e) D - 2
(d) D - 1(c) D - 1
(f) D - 2
(h) D - 3
(i) D - 5 (j) D - 5
(k) D - 7 (l) D - 7
(a) Geopotential height at 500 hPa, D

Lagged effects of the Mistral on HPEs in Valencia
1 3
intensity of cooling found in Fig. 5 south of Cap Creus is therefore at least partly a model bias.
To go one step further and identify the ocean processes responsible for the cooling in most cases in CPL, we used the diagnosed tendencies of the OML temperature available in the NEMO code (Madec and the NEMO Team 2008), in the same way as Lebeaupin Brossier et al. (2013, 2014). The different contributions to OML temperature changes are calculated according to the surface forcing (SURF), the horizontal advection (ADV), the vertical advection (z-ADV), the diffusivity. The residual term of this calcula-tion gives the contribution of the entrainment at the OML base (variations of the surface z = −h and to turbulent mix-ing at the OML base) (ENT).
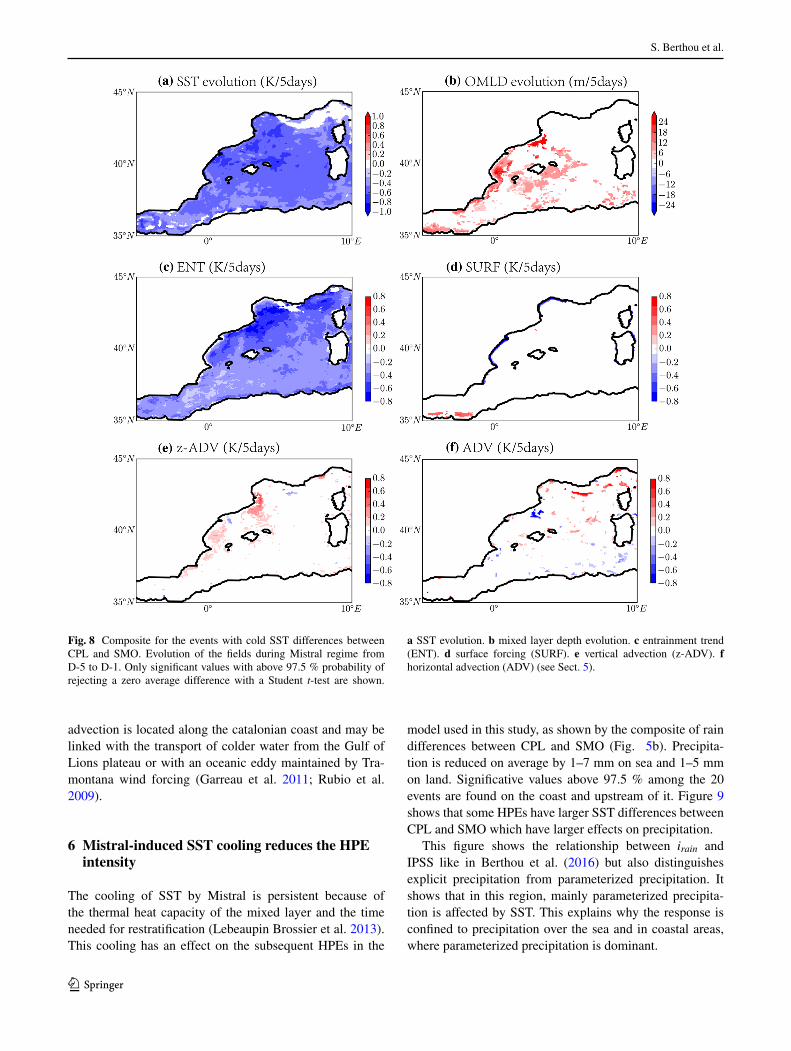
The composites of the 5-day trends from D-5 to D-1 during Mistral regime are shown in Fig. 8. Only the terms with a certain spatial extent of significance are shown. These composites first show that the total SST decrease during Mistral regime ranges from 0.5 to 0.7 °C. This is larger than the difference between CPL and SMO shown in Fig. 5 since this latter difference removes the monthly trend. Figure 8 further shows that the OMLD can increase by up to 24 m in the Balearic Sea in the composite. This signal is mainly located near the Spanish coast and near the Balearic Islands. The term that is most representative in the composite is the entrainment (ENT), which is the main contributor of the SST decrease in the Balearic Sea. In particular, low-temperature water as the Winter Interme-diate Water flowing at about 100 m depth (Juza et al. 2013) can be uplifted and contribute to the SST decrease. Sur-face fluxes and horizontal advection show patchy changes while the vertical advection works to partially counteract the cooling in the Balearic Sea. The signal in horizontal
Fig. 7 Time series from 10 days before the HPE (D-10) to the day itself (D). In black for all events and in blue for HPEs with negative SSTCPL–SSTSMO difference. The line is the average and the shaded area represents the 97.5 % confidence interval for a t-student distribu-tion. a, c Mean spatial pressure in the Gulf of Genoa (yellow box in
Fig. 1a). The dotted line is the climatological average. b, d SSTCPL–SSTSMO in the Balearic Sea (red box in Fig. 1a); a, b for the selected HPEs of CPL. c, d for the selected HPEs of Spain02. b CPL SSTd CNR SST
Fig. 6 Composite for the events with cold SST anomalies between CPL and SMO. Left column: 500 hPa geopotential height at 1200 UTC, ERA-interim fields. Right column: 925 hPa geopotential height at 1200 UTC, CPL fields. a, b for the rain event day (D). c, d for the day before the event (D-1). e, f D-2. g, h D-3. i, j D-5. k, l D-7
◂
S. Berthou et al.
1 3
advection is located along the catalonian coast and may be linked with the transport of colder water from the Gulf of Lions plateau or with an oceanic eddy maintained by Tra-montana wind forcing (Garreau et al. 2011; Rubio et al. 2009).
6 Mistral‑induced SST cooling reduces the HPE intensity
The cooling of SST by Mistral is persistent because of the thermal heat capacity of the mixed layer and the time needed for restratification (Lebeaupin Brossier et al. 2013). This cooling has an effect on the subsequent HPEs in the
model used in this study, as shown by the composite of rain differences between CPL and SMO (Fig. 5b). Precipita-tion is reduced on average by 1–7 mm on sea and 1–5 mm on land. Significative values above 97.5 % among the 20 events are found on the coast and upstream of it. Figure 9 shows that some HPEs have larger SST differences between CPL and SMO which have larger effects on precipitation.
This figure shows the relationship between irain and IPSS like in Berthou et al. (2016) but also distinguishes explicit precipitation from parameterized precipitation. It shows that in this region, mainly parameterized precipita-tion is affected by SST. This explains why the response is confined to precipitation over the sea and in coastal areas, where parameterized precipitation is dominant.
Fig. 8 Composite for the events with cold SST differences between CPL and SMO. Evolution of the fields during Mistral regime from D-5 to D-1. Only significant values with above 97.5 % probability of rejecting a zero average difference with a Student t-test are shown.
a SST evolution. b mixed layer depth evolution. c entrainment trend (ENT). d surface forcing (SURF). e vertical advection (z-ADV). f horizontal advection (ADV) (see Sect. 5).

Lagged effects of the Mistral on HPEs in Valencia
1 3
Figure 10 shows the composite of differences between CPL and SMO for several diagnostics: CAPE, moisture convergence, surface pressure and low-level stratification. Figure 10b shows a significant mean decrease of CAPE by 10–50 J kg−1 in the upstream zone. In the same zone, Fig. 10a shows a significant decrease in the moisture con-vergence by 0.5–1.5 10−7 kg kg−1 s−1. The convergence difference is linked to wind changes rather than moisture changes, as shown in Berthou et al. (2016). Figure 10d shows an anticyclonic wind anomaly around a significant pressure positive anomaly in the convergence zone. This wind anomaly corresponds to a geostrophic anomaly mod-ulated by surface friction (not shown). As Fig. 10e shows, the pressure anomaly is already present at the beginning of the day when there is little convective activity (there is at most 5 mm/h at 00 UTC in the composite). It is the hydro-static response to temperature anomalies in this area (not shown). CAPE or stratification changes are not significant across all events at that time. Finally, there is little common signal among all events in the stratification changes shown in Fig. 10d.
When there is still little convection in the composite at 00 UTC, the only significant change between CPL and SMO simulations is a positive pressure difference which modifies the upstream winds and the moisture convergence (Fig. 10e). This pressure anomaly is affecting the winds and reducing the moisture convergence towards the start on the event. The Kain–Fritsch closure assumption is based on the the CAPE of a diluted parcel and the maximum entrain-ment rate is stronger when the low-level convergence is weaker. Therefore, the reduction in moisture conver-gence is likely to reduce the intensity of the parameterised
convection. On the daily average, the CAPE is also reduced upstream of the convection and may also play a role in reducing its intensity too. The reduction in the convection may also on the daily mean affect the pressure anomaly with a positive feedback.
It is again worth mentioning that the spatial distribution of SST cooling due to Mistral may not be well represented by the model as noted in Sect. 5. This may have an influ-ence on the precipitation change too.
7 Conclusion
We showed that 77 % of the HPEs in the region of Valencia in MORCE and 85 % in Spain02 dataset (using a criteria of the average of 1.25 HPE/year for the period 1989–2008) show a larger SST cooling in the Balearic Sea than the monthly tendency during the 4 days preceding the HPEs. This cooling is associated with Mistral regime (Mistral, Tramontane, Cierzo) during the 6 days preceding the HPEs. A Rossby wave with a ridge-trough succession centered over western France is responsible for Mistral regime pre-ceding the HPE. This Rossby wave then breaks and leads to conditions favorable to the occurrence of HPEs over the region of Valencia with a cut-off low on the Iberian pen-insula and a surface depression on the Alboran Sea. This type of succession between a Mistral event and a HPE in the region of Valencia had already been found in case stud-ies such as 6 September 1989 (Pastor et al. (2001), this case being one of the selected cases of the present study) and 4 November 1987 (Millán et al. 2005). However, we show here that in most of the HPE cases over this region, Mis-tral can be observed in the days that precede the event, and that this Mistral wind cools the regional SST significantly, that is by about 0.4 °C in addition to the seasonal trend on average for all events in the MORCE simulation. This was confirmed using observation-based datasets: a similar cool-ing was found in the CNR SST dataset using the Spain02 HPEs. The observed and simulated cooling of the SST over the western Mediterranean upwind of the Valencia region is predominantly due to the entrainment of deeper water within the OML in the MORCE simulation.
Interestingly, it is shown that this SST cooling is not just a byproduct of the synoptic conditions leading to the HPEs, but also in turn significantly affects the HPEs themselves, by a significant reduction in the amount of precipitation, of up to 7 mm over sea and up to 5 mm over land. There-fore, what we are observing and simulating here is not just a forcing of the atmosphere by the ocean or of the ocean by the atmosphere, but a chain of coupled effects acting both ways and significantly reducing the quantity of rain falling over sea and over land during the HPEs that occur over the Valencia area.
0.0 0.5 1.0 1.5 2.0IPSS ( ◦C)
0.00
0.05
0.10
0.15
0.20
0.25
0.30i rain
03
08
09
1002
05
10 10
09
09090912
12 11
04
0504
09
10
101212
0110 10
Explicit precip.
Convective precip.
Fig. 9 irain (% of total maximum precipitation) and IPSS (°C) calcu-lated as in Berthou et al. (2016) for the explicit precipitation (light blue, x crosses) and the convective precipitation (magenta, + crosses) in the areas presented in Fig. 1a. Numbers next to the magenta crosses indicate the month when the HPE occur

S. Berthou et al.
1 3
The impact being mostly on parameterized precipitation, the SST cooling effect on HPEs should be further investi-gated with the use of higher resolution models which allow a better representation of convection (Prein et al. 2015b). This would first allow the representation of events sensitive to small scale orography and cold pools, and potentially capture more events: we restricted the study to 26 events so that 80 % of the events were in the 100 heaviest precipita-tion events of Spain02 dataset. The use of higher resolution simulations would also permit a better representation of the sensibility of fine-scale processes to air–sea coupling: Pas-tor et al. (2001) showed that SST changes of about 2–5 ◦C could lead to 25–200 % changes in precipitation with a
model with 2.5 km grid-spacing, which is a larger effect than the one presented in this study. Eventually, the use of nudging above the planetary boundary layer may also lead to underestimation of the effect of SST on HPEs on the daily time scale. Thus, precipitation change found in this study is significant across the selected HPEs but likely underestimated by the experimental design.
Acknowledgments This work is part of the Med-CORDEX initiative (www.medcordex.eu) supported by the HyMeX programme (www.hymex.org) through INSU-MISTRALS support. This research has received funding from the French National Research Agency (ANR) project REMEMBER (contract ANR-12-SENV-001). It was sup-ported by the IPSL group for regional climate and environmental
(a) Moisture div. CPL-SMO (daily mean)
38◦N
40◦N
2◦W 0◦ 2◦E 4◦E
−3.5
−2.5
−1.5
−0.5
0.5
1.5
2.5
3.5
kgkg−2s−
1
×10−7
36◦N
38◦N
40◦N
42◦N
44◦N
2◦W 0◦ 2◦E 4◦E 6◦E 8◦E 10◦E−70
−50
−30
−10
10
30
50
70
Jkg−1
1 ms−1
36◦N
38◦N
40◦N
42◦N
44◦N
2◦W 0◦ 2◦E 4◦E 6◦E 8◦E 10◦E−17.5
−12.5
−7.5
−2.5
2.5
7.5
12.5
17.5
%
1 ms−1
36◦N
38◦N
40◦N
42◦N
44◦N
2◦W 0◦ 2◦E 4◦E 6◦E 8◦E 10◦E−5.5
−3.5
−1.5
0.5
2.5
4.5
%
1 ms−1
36◦N
38◦N
40◦N
42◦N
44◦N
2◦W 0◦ 2◦E 4◦E 6◦E 8◦E 10◦E−0.55
−0.35
−0.15
0.05
0.25
0.45
hPa
(b) CAPE CPL-SMO (daily mean) (c) Stratification CPL-SMO (daily mean)
(d) Pressure CPL-SMO (daily mean) (e) Pressure CPL-SMO (00UTC)
Fig. 10 Composite for the events with cold SST differences between CPL and SMO. a Colours: moisture divergence differ-ence (kg kg−1 s−1). Red contours: significant difference values with above 97.5 % probability of rejecting a zero average differ-ence with a Student t test. Magenta contours: CPL moisture diver-gence (only negative values are shown in dashed line, contour every 0.2 10
−6 kg kg−1 s−1). b Colours: CAPE difference (only significant values above 97.5 % are shown). Magenta contours: CPL CAPE,
every 200 J kg−1. c Colours: stratification differences (Brunt-Väisälä frequency in the 6 first model levels) (% of CPL values), red con-tours: significant difference values above 97.5 %. d Colours: pressure difference (hPa), only significant above 97.5 % values are shown. Arrows: wind difference (average over the first 6 levels (≃0–800 m)). e same as d but at 00 UTC. In all panels, blue contours are daily rain in CPL (contour every 20 mm), except e 3 h-accumulated rain (con-tour every 5 mm)

Lagged effects of the Mistral on HPEs in Valencia
1 3
studies, with granted access to the HPC resources of IDRIS (under allocation i2011010227). The authors acknowledge the HyMeX data-base teams (ESPRI/IPSL and SEDOO/Observatoire Midi-Pyrénés) for their help in accessing the data. We thank the MYOCEAN pro-ject for providing the CNR-ISAC-GOS SST product. The authors also thank AEMET and UC for the data provided for this work (Spain02 dataset, http://www.meteo.unican.es/datasets/spain02). The authors are thankful to Robert Jones for correcting the language and to the anonymous reviewers who greatly helped to improve the manuscript.
References
Berthou S, Mailler S, Drobinski P, Arsouze T, Bastin S, Béranger K, Lebeaupin Brossier C (2014) Prior history of mistral and tra-montane winds modulates heavy precipitation events in southern France. Tellus A 66. doi:10.3402/tellusa.v66.24064
Berthou S, Mailler S, Drobinski P, Arsouze T, Bastin S, Béranger K, Lebeaupin-Brossier C (2015) Sensitivity of an intense rain event between atmosphere-only and atmosphere-ocean regional cou-pled models: 19 september 1996. Q J R Meteorol Soc 141:258–271. doi:10.1002/qj.2355
Berthou S, Mailler S, Drobinski P, Arsouze T, Bastin S, Béranger K, Flaounas E, Lebeaupin Brossier C, Stéfanon M (2016) Influ-ence of submonthly air-sea coupling on heavy precipitation events in the western mediterranean basin. Q J R Meteorol Soc. doi:10.1002/qj.2717
Beuvier J, Béranger K, Lebeaupin Brossier C, Somot S, Sevault F, Drillet Y, Bourdallé-Badie R, Ferry N, Lyard F (2012) Spreading of the western Mediterranean deep water after winter 2005: time scales and deep cyclone transport. J Geophys Res 117. doi:10.1029/2011JC007679
Brankart J, Brasseur P (1998) The general circulation in the Mediter-ranean sea: a climatological approach. J Mar Syst 18(1–3):41–70. doi:10.1016/S0924-7963(98)00005-0
Buongiorno Nardelli B, Tronconi C, Pisano A (2014) MyOcean PRODUCT USER MANUAL for reprocessed level 4 SST prod-ucts over the mediterranean and black seas. MyOcean
Colin J (2012) Étude des événements précipitants intenses en médi-terranée: approche par la modélisation climatique régionale. PhD thesis, Université Paul Sabatier, Toulouse 3, France, Toulouse, France
Doswell CA III, Ramis C, Romero R, Alonso S (1998) A diagnostic study of three heavy precipitation episodes in the western Medi-terranean region. Weather Forecast 13(1):102–124
Drobinski P, Flamant C, Dusek J, Flamant P, Pelon J (2001) Obser-vational evidence and modeling of an internal hydraulic jump at the atmospheric boundary layer top during a tramontane event. Bound-Lay Meteorol 98:497–515
Drobinski P, Bastin S, Guénard V, Caccia J, Dabas AM, Delville P, Protat A, Reitebuch O, Werner C (2005) Summer mistral at the exit of the rhône valley. Q J R Meteorol Soc 131:353–375
Drobinski P, Anav A, Lebeaupin Brossier C, Samson G, Stéfanon M, Bastin S, Baklouti M, Béranger K, Beuvier J, Bourdallé-Badie R, Coquart L, D’Andrea F, de Noblet-Ducoudré N, Diaz F, Dutay JC, Ethe C, Foujols MA, Khvorostyanov D, Madec G, Mancip M, Masson S, Menut L, Palmieri J, Polcher J, Turquety S, Valcke S, Viovy N (2012) Model of the regional coupled earth system (MORCE): application to process and climate studies in vul-nerable regions. Environ Model Softw 35:1–18. doi:10.1016/j.envsoft.2012.01.017
Drobinski P, Ducrocq V, Alpert P, Anagnostou E, Béranger K, Borga M, Braud I, Chanzy A, Davolio S, Delrieu G, Estournel C, Bou-brahmi NF, Font J, Grubisic V, Gualdi S, Homar V, Ivancan-Picek B, Kottmeier C, Kotroni V, Lagouvardos K, Lionello P, Llasat M,
Ludwig W, Lutoff C, Mariotti A, Richard E, Romero R, Rotunno R, Roussot O, Ruin I, Somot S, Taupier-Letage I, Tintore J, Uijlenhoet R, Wernli H (2014) HyMeX, a 10-year multidiscipli-nary program on the Mediterranean water cycle. Bull Am Mete-orol Soc 95:1063–1082. doi:10.1175/BAMS-D-12-00242.1
Ducrocq V, Braud I, Davolio S, Ferretti R, Flamant C, Jans A, Kalthoff N, Richard E, Taupier-Letage I, Ayral PA, Belamari S, Berne A, Borga M, Boudevillain B, Bock O, Boichard JL, Bouin MN, Bousquet O, Bouvier C, Chiggiato J, Cimini D, Corsmeier U, Coppola L, Cocquerez P, Defer E, Delano J, Di Girolamo P, Doerenbecher A, Drobinski P, Dufournet Y, Fourri N, Gour-ley JJ, Labatut L, Lambert D, Le Coz J, Marzano FS, Molini G, Montani A, Nord G, Nuret M, Ramage K, Rison B, Roussot O, Said F, Schwarzenboeck A, Testor P, Van-Baelen J, Vincendon B, Aran M, Tamayo J (2014) HyMeX-SOP1, the field campaign dedicated to heavy precipitation and flash flooding in the north-western Mediterranean. Bull Am Meteorol Soc 95(7):1083–1100. doi:10.1175/BAMS-D-12-00244.1
Fernández C, Gaertner M, Gallardo C, Castro M (1995) Simulation of a long-lived meso-β scale convective system over the mediter-ranean coast of spain. part i: Numerical predictability. Meteorol Atmos Phys 56(3–4):157–179
Flamant C (2003) Alpine lee cyclogenesis influence on air-sea heat exchanges and marine atmospheric boundary layer thermo-dynamics over the western Mediterranean during a Tramon-tane/Mistral event. J Geophys Res 108(C2). doi:10.1029/2001JC001040
Frei C, Schll R, Fukutome S, Schmidli J, Vidale PL (2006) Future change of precipitation extremes in Europe: Intercomparison of scenarios from regional climate models. Journal of Geophysical Research 111(D6): doi:10.1029/2005JD005965
Garreau P, Garnier V, Schaeffer A (2011) Eddy resolving modelling of the Gulf of Lions and Catalan Sea. Ocean Dyn 61(7):991–1003. doi:10.1007/s10236-011-0399-2
Giorgi F, Jones C, Asrar GR (2009) Addressing climate information needs at the regional level: the CORDEX framework. WMO Bull 58(3):175
Guénard V, Drobinski P, Caccia J, Campistron B, Bénech B (2005) An observational study of the mesoscale mistral dynamics. Bound-Lay Meteorol 115:263–288
Guénard V, Drobinski P, Caccia J, Tedeschi G, Currier P (2006) Dynamics of the MAP IOP-15 severe mistral event: observations and high-resolution numerical simulations. Q J R Meteorol Soc 132:757–778
Haylock M, Hofstra N, Klein Tank A, Klok E, Jones P, New M (2008) A European daily high-resolution gridded dataset of surface tem-perature and precipitation. J Geophys Res Atmos 113(D20):119. doi:10.1029/2008JD10201
Herrera S, Fita L, Fernández J, Gutiérrez JM (2010) Evaluation of the mean and extreme precipitation regimes from the ENSEMBLES regional climate multimodel simulations over Spain. J Geophys Res 115(D21): doi:10.1029/2010JD013936
Herrera S, Gutierrez J, Ancell R, Pons MR, Frias M, Fernandez J (2012) Development and analysis of a 50 year high-resolution daily gridded precipitation dataset over Spain (spain02). Int J Climatol 32:74–85. doi:10.1002/joc.2256
Herrmann M, Somot S, Calmanti S, Dubois C, Sevault F (2011) Representation of daily wind speed spatial and temporal vari-ability and intense wind events over the mediterranean sea using dynamical downscaling: impact of the regional climate model configuration. NHESS 11:1983–2001. doi:10.5194/nhess-11-1983-2011
Homar V, Romero R, Ramis C, Alonso S (2002) Numerical study of the october 2000 torrential precipitation event over eastern Spain: analysis of the synoptic-scale stationarity. Ann Geophys 20:2047–2066. doi:10.5194/angeo-20-2047-2002

S. Berthou et al.
1 3
Houpert L, Testor P, Durrieu de Madron X, Somot S, DOrtenzio F, Estournel C, Lavigne H (2015) Seasonal cycle of the mixed layer, the seasonal thermocline and the upper-ocean heat stor-age rate in the Mediterranean Sea derived from observations. Prog Oceanogr 132:333–352. doi:10.1016/j.pocean.2014.11.004, http://linkinghub.elsevier.com/retrieve/pii/S0079661114001797
Jiang Q, Smith RB, Doyle J (2003) The nature of the mistral: obser-vations and modelling of two MAP events. Q J R Meteorol Soc 129(588):857–875. doi:10.1256/qj.02.21
Juza M, Renault L, Ruiz S, Tintoré J (2013) Origin and pathways of winter intermediate water in the northwestern mediterranean sea using observations and numerical simulation. J Geophys Res Oceans 118:1–13. doi:10.1002/2013JC009231
Kain JS (2004) The Kain–Fritsch convective parameteri-zation: an update. J Appl Meteorol 43(1):170–181. doi:10.1175/1520-0450(2004)043
Kain JS, Fritsch JM (1990) A one-dimensional entraining/detraining plume model and its application in convective parameterization. J Atmos Sci 47(23):2784–2802
Katsafados P, Mavromatidis E, Papadopoulos A, Pytharoulis I (2011) Numerical simulation of a deep Mediterranean storm and its sen-sitivity on sea surface temperature. NHESS 11(5):1233–1246. doi:10.5194/nhess-11-1233-2011
Lebeaupin C, Ducrocq V, Giordani H (2006) Sensitivity of torren-tial rain events to the sea surface temperature based on high-resolution numerical forecasts. J Geophys Res Atmos 111(D12). doi:10 .1029/2005JD006541
Lebeaupin Brossier C, Drobinski P (2009) Numerical high-resolu-tion air-sea coupling over the gulf of lions during two tramon-tane/mistral events. J Geophys Res 114(D10). doi:10.1029/2008JD011601
Lebeaupin Brossier C, Béranger K, Deltel C, Drobinski P (2011) The Mediterranean response to different space–time resolu-tion atmospheric forcings using perpetual mode sensitiv-ity simulations. Ocean Model 36(1–2):1–25. doi:10.1016/j.ocemod.2010.10.008
Lebeaupin Brossier C, Drobinski P, Béranger K, Bastin S, Orain F (2013) Ocean memory effect on the dynamics of coastal heavy precipitation preceded by a mistral event in the north-western Mediterranean. Q J R Meteorol Soc 139:1583–1897. doi:10.1002/qj.2049
Lebeaupin Brossier C, Arsouze T, Béranger K, Bouin MN, Bres-son E, Ducrocq V, Giordani H, Nuret M, Rainaud R, Taupier-Letage I (2014) Ocean Mixed Layer responses to intense mete-orological events during HyMeX-SOP1 from a high-resolution ocean simulation. Ocean Model 84:84–103. doi:10.1016/j.ocemod.2014.09.009
Levitus S, Antonov J, Boyer T (2005) Warming of the world ocean, 1955–2003. Geophys Res Lett 32(2). doi:10.1029/2004GL021592
Littmann T (2000) An empirical classification of weather types in the mediterranean basin and their interrelation with rainfall. Theor Appl Climatol 66(3–4):161–171
Madec G, the NEMO Team (2008) Nemo ocean engine. Tech. rep., Institut Pierre-Simon Laplace (IPSL), Paris, France
Masson V, Bougeault P (1996) Numerical simulation of a low-level wind created by complex orography: a cierzo case study. Mon Weather Rev 124(4):701–715
Miglietta MM, Moscatello A, Conte D, Mannarini G, Lacorata G, Rotunno R (2011) Numerical analysis of a mediterranean hur-ricaneover south-eastern italy: sensitivity experiments to sea sur-face temperature. Atmos Res 101(1):412–426
Millán M, Estrela MJ, Caselles V (1995) Torrential precipita-tions on the Spanish east coast: the role of the Mediter-ranean sea surface temperature. Atmos Res 36(1):1–16. doi:10.1016/0169-8095(94)00048-I
Millán MM, Estrela MJ, Miró J (2005) Rainfall components: vari-ability and spatial distribution in a Mediterranean Area (Valencia Region). J Clim 18(14):2682–2705
Noh Y, Cheon WG, Hong SY, Raasch S (2003) Improvement of the k-profile model for the planetary boundary layer based on large eddy simulation data. Bound-Lay Meteorol 107(2):401–427. doi:10.1023/A:1022146015946
Obermann A, Bastin S, Belamari S, Conte D, Gaertner MA, Li L, Ahrens B (2016) Mistral and tramontane wind speed and wind direction patterns in regional climate simulations. Clim Dyn 1–18. doi:10.1007/s00382-016-3053-3
Omrani H, Drobinski P, Dubos T (2013) Optimal nudging strategies in regional climate modelling: investigation in a big-brother experiment over the European and Mediterranean regions. Clim Dyn 41:2451–2470. doi:10.1007/s00382-012-1615-6
Pastor F, Estrela MJ, Peñarrocha D, Millán MM (2001) Torrential rains on the Spanish Mediterranean coast: modeling the effects of the sea surface temperature. J Appl Meteorol 40(7):1180–1195. doi:10.1175/1520-0450(2001)040<1180:TROTSM>2.0 .CO;2
Pastor F, Gómez I, Estrela MJ (2010) Numerical study of the Octo-ber 2007 flash flood in the Valencia region (Eastern Spain): the role of orography. NHESS 10(6):1331–1345. doi:10.5194/nhess-10-1331-2010
Pastor F, Valiente JA, Estrela MJ (2015) Sea surface tempera-ture and torrential rains in the Valencia region: modelling the role of recharge areas. NHESS Discussions 3(2):1357–1396. doi:10.5194/nhessd-3-1357-2015
Peñarrocha D, Estrela MJ, Millán M (2002) Classification of daily rainfall patterns in a Mediterranean area with extreme inten-sity levels: the Valencia region. Int J Climatol 22(6):677–695. doi:10.1002/joc.747
Prein AF, Gobiet A, Truhetz H, Keuler K, Goergen K, Teichmann C, Fox Maule C, van Meijgaard E, Déqué M, Nikulin G, Vautard R, Colette A, Kjellström E, Jacob D (2015a) Precipitation in the EURO-CORDEX 0.11◦ and 0.44◦ simulations: high resolution, high benefits? Clim Dyn. doi:10.1007/s00382-015-2589-y
Prein AF, Langhans W, Fosser G, Ferrone A, Ban N, Goergen K, Kel-lerM, Tlle M, Gutjahr O, Feser F, Brisson E, Kollet S, Schmidli J, vanLipzig NPM, Leung R (2015b) A review on regional con-vection-permitting climate modeling: demonstrations, prospects, and challenges. Rev Geophys. doi:10.1002/2014RG000475
Ramis C, Romero R, Homar V, Alonso S, Alarcón M (1998) Diagno-sis and numerical simulation of a torrential precipitation event in catalonia (Spain). Meteorol Atmos Phys 69(1–2):1–21
Romero R, Guijarro J, Ramis C, Alonso S (1998) A 30-year (1964–1993) daily rainfall data base for the Spanish Mediterranean regions: first exploratory study. Int J Climatol 18(5):541–560
Romero R, Sumner G, Ramis C, Genovés A (1999) A classifica-tion of the atmospheric circulation patterns producing sig-nificant daily rainfall in the Spanish Mediterranean area. Int J Climatol 19(7):765–785. doi:10.1002/(SICI)1097-0088(19990615)19:7<765::AID-JOC388>3.0.CO;2-T
Romero R, Ramis C, Homar V (2014) On the severe convective storm of 29 October 2013 in the Balearic Islands: observational and numerical study. Q J R Meteorol Soc. doi:10.1002/qj.2429
Rubio A, Barnier B, Jord G, Espino M, Marsaleix P (2009) Origin and dynamics of mesoscale eddies in the Catalan Sea (NW Mediter-ranean): insight from a numerical model study. J Geophys Res 114(C6). doi:10.1029/2007JC004245
Ruti P, Somot S, Giorgi F, Dubois C, Flaounas E, Obermann A, Dell’Aquila A, Pisacane G, Harzallah A, Lombardi E, Ahrens B, Akhtar N, Alias A, Arsouze T, Raznar R, Bastin S, Bartholy J, Béranger K, Beuvier J, Bouffies-Cloche S, Brauch J, Cabos W, Calmanti S, Calvet J, Carillo A, Conte D, Coppola E, Djurdje-vic V, Drobinski P, Elizalde A, Gaertner M, Galan P, Gallardo

Lagged effects of the Mistral on HPEs in Valencia
1 3
C, Gualdi S, Goncalves M, Jorba O, Jorda G, Lheveder B, Leb-eaupin Brossier C, Li L, Liguori G, Lionello P, Macias-Moy D, Onol B, Rajkovic B, Ramage K, Sevault F, Sannino G, Struglia M, Sanna A, Torma C, Vervatis V (2015) MED-CORDEX initia-tive for Mediterranean Climate studies. Bull Am Meteorol Soc. doi:10.1175/BAMS-D-14-00176.1
Salameh T, Drobinski P, Dubos T (2010) The effect of indiscriminate nudging time on large and small scales in regional climate mod-elling: application to the Mediterranean basin. Q J R Meteorol Soc 136(646):170–182. doi:10.1002/qj.518
Senatore A, Mendicino G, Knoche HR, Kunstmann H (2014) Sen-sitivity of modeled precipitation to sea surface temperature in regions with complex topography and coastlines: a case study for the Mediterranean. J Hydrometeorol 15(6):2370–2396. doi:10.1175/JHM-D-13-089.1
Sevault F, Somot S, Alias A, Dubois C, Lebeaupin-Brossier C, Nabat P, Adloff F, Déqué M, Decharme B (2014) A fully coupled Medi-terranean regional climate system model: design and evaluation of the ocean component for the 1980–2012 period. Tellus A 66. doi:10.3402/tellusa.v66.23967
Skamarock WC, Klemp JB, Dudhia J, Gill DO, Barker DM, Duda M, Huang XY, Wang W, Powers JG (2008) A description of the advanced research WRF version 3. Tech. rep, DTIC Document
Small R, Carniel S, Campbell T, Teixeira J, Allard R (2012) The response of the Ligurian and Tyrrhenian seas to a summer Mis-tral event: a coupled atmosphereocean approach. Ocean Model 48:30–44. doi:10.1016/j.ocemod.2012.02.003
Stauffer DR, Seaman NL (1990) Use of four-dimensional data assimi-lation in a limited-area mesoscale model. part i: experiments with synoptic-scale data. Mon Weather Rev 118(6):1250–1277. doi:10.1175/1520-0493(1990)118
Stull RB (1988) An introduction to boundary Layer meteorology. Kluwer Academic Publishers, Dordrecht. doi:10.1007/978-94-009-3027-8
The PROTHEUS Group, Artale V, Calmanti S, Carillo A,Dell’Aquila A, Herrmann M, Pisacane G, Ruti PM, Sannino G, Struglia MV, Giorgi F, Bi X, Pal JS, Rauscher S (2009) An atmosphere-ocean regional climate model for the Mediterranean area: assessment of a present climate simulation. Clim Dyn 35(5):721–740. doi:10.1007/s00382-009-0691-8
Tout D, Kemp V (1985) The named winds of Spain. Weather 40(10):322–329
Valcke S (2013) The OASIS3 coupler: a European climate mod-elling community software. Geosci Model Dev 6:373–388. doi:10.5194/gmdd-5-2139-2012