Lafarge North America, Inc, Lafarge Midwest, Inc, and Lafarge ...

Lafarge Africa Plc
Unaudited Financial Statements
30 September 2019
Lafarge Africa Plc
Contents
Directors' and Other Corporate Information 3
Consolidated and Separate Statements of Profit or Loss and Other Comprehensive Income 4
Consolidated and Separate Statements of Financial Position 6
Consolidated and Separate Statements of Changes in Equity 7
Consolidated and Separate Statements of Cash Flows 9
Notes to the Consolidated and Separate Financial Statements 10
2
Lafarge Africa Plc
Directors' and Other Corporate Information
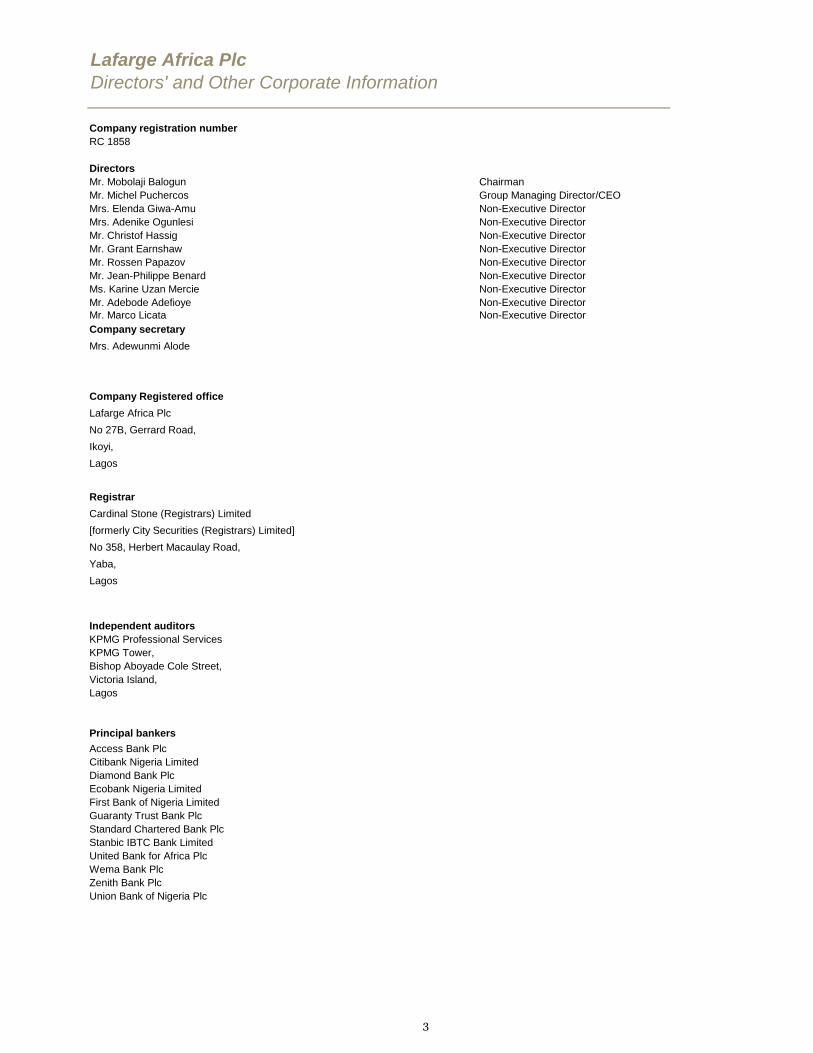
Company registration number
RC 1858
Directors
Mr. Mobolaji Balogun Chairman
Mr. Michel Puchercos Group Managing Director/CEO
Mrs. Elenda Giwa-Amu Non-Executive Director
Mrs. Adenike Ogunlesi Non-Executive Director
Mr. Christof Hassig Non-Executive Director
Mr. Grant Earnshaw Non-Executive Director
Mr. Rossen Papazov Non-Executive Director
Mr. Jean-Philippe Benard Non-Executive Director
Ms. Karine Uzan Mercie Non-Executive Director
Mr. Adebode Adefioye Non-Executive Director
Mr. Marco Licata Non-Executive Director
Company secretary
Mrs. Adewunmi Alode
Company Registered office
Lafarge Africa Plc
No 27B, Gerrard Road,
Ikoyi,
Lagos
Registrar
Cardinal Stone (Registrars) Limited
[formerly City Securities (Registrars) Limited]
No 358, Herbert Macaulay Road,
Yaba,
Lagos
Independent auditors
KPMG Professional Services
KPMG Tower,
Bishop Aboyade Cole Street,
Victoria Island,
Lagos
Principal bankers
Access Bank Plc
Citibank Nigeria Limited
Diamond Bank Plc
Ecobank Nigeria Limited
First Bank of Nigeria Limited
Guaranty Trust Bank Plc
Standard Chartered Bank Plc
Stanbic IBTC Bank Limited
United Bank for Africa Plc
Wema Bank Plc
Zenith Bank Plc
Union Bank of Nigeria Plc
3

Lafarge Africa Plc
3months
ended
3months
ended
9 months
ended
9 months
ended
3months
ended
3months
ended
9 months
ended
9 months
ended Notes N'000 N'000 N'000 N'000
Continuing operations
Revenue 6 45,171,777 72,008,596 163,057,020 234,300,122 39,308,592 42,307,207 140,888,245 142,756,931
Cost of sales 7 (33,360,571) (54,875,664) (111,785,243) (178,205,218) (26,999,400) (27,879,268) (90,685,232) (90,215,957)
Gross profit 11,811,206 17,132,932 51,271,777 56,094,904 12,309,192 14,427,939 50,203,013 52,540,974
Selling and marketing expenses 8 (1,809,268) (1,684,923) (3,189,009) (4,454,909) (1,368,528) (631,038) (3,097,667) (1,298,934)
Administrative expenses 9 (2,699,698) (12,670,112) (13,086,178) (32,626,415) (3,008,646) (8,024,383) (12,622,024) (21,498,436)
Other income 10 443,196 (6,641) 482,189 99,997 214,198 (9,625) 8,195,496 86,669
Impairment write back /(loss) on trade and other receivables 11 235 23,810 59,660 18,268 4,281 (1,232) 61,603 (5,252)
Operating profit 7,745,671 2,795,066 35,538,439 19,131,845 8,150,497 5,761,661 42,740,421 29,825,021
Finance income 12 188,978 413,100 1,178,630 1,446,622 166,856 336,556 934,310 1,221,957
Finance costs 12 (3,248,681) (11,212,513) (16,577,889) (34,928,321) (3,389,432) (11,581,552) (16,944,335) (33,761,831)
Reversal of impairment loss on investment in subsidiary - - - 1,094,361 - - -
Loss on disposal of Investment in subsidiary (839,263) (839,263)
- (10,824) - (10,824) - - - -
Profit/(Loss) before minimum tax 4,685,968 (8,015,171) 20,139,180 (14,360,678) 5,183,019 (5,483,335) 25,891,133 (2,714,853)
Profit/(Loss) after minimum tax 4,685,968 (8,015,171) 20,139,180 (14,360,678) 5,183,019 (5,483,335) 25,891,133 (2,714,853)
Income tax credit/(expense) 13.1 48,118 1,544,434 434,144 3,987,654 (182,707) 1,473,233 954,878 795,632
Profit/(Loss) after tax from continuing operation 4,734,086 (6,470,737) 20,573,324 (10,373,024) 5,000,312 (4,010,102) 26,846,011 (1,919,221)
Discontinued operation
Post-tax operating loss of discontinued operation 16.4 (106,379) - (6,936,729) - - - - -
Gain on disposal of discontinued operation 16 106,523,296 - 106,523,296 - - - -
Loss after tax from discontinued operation 106,416,916 - 99,586,566 - - - - -
** Group Company
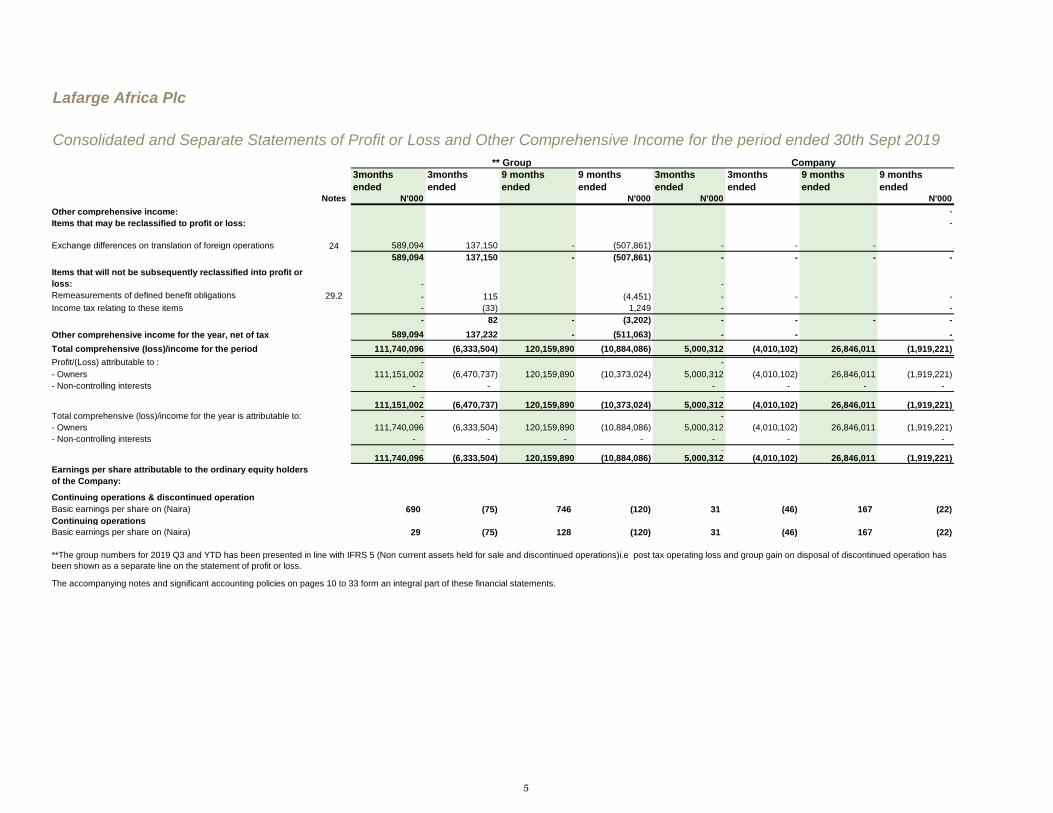
Consolidated and Separate Statements of Profit or Loss and Other Comprehensive Income for the period ended 30th Sept 2019
Share of loss from joint ventures accounted for using the equity
method
4
Lafarge Africa Plc
3months
ended
3months
ended
9 months
ended
9 months
ended
3months
ended
3months
ended
9 months
ended
9 months
ended Notes N'000 N'000 N'000 N'000
** Group Company
Consolidated and Separate Statements of Profit or Loss and Other Comprehensive Income for the period ended 30th Sept 2019
Other comprehensive income: -
Items that may be reclassified to profit or loss: -
Exchange differences on translation of foreign operations 24 589,094 137,150 - (507,861) - - -
589,094 137,150 - (507,861) - - - -
Items that will not be subsequently reclassified into profit or
loss: - -
Remeasurements of defined benefit obligations 29.2 - 115 (4,451) - - -
Income tax relating to these items - (33) 1,249 - -
- 82 - (3,202) - - - -
Other comprehensive income for the year, net of tax 589,094 137,232 - (511,063) - - -
Total comprehensive (loss)/income for the period 111,740,096 (6,333,504) 120,159,890 (10,884,086) 5,000,312 (4,010,102) 26,846,011 (1,919,221)
Profit/(Loss) attributable to : - -
- Owners 111,151,002 (6,470,737) 120,159,890 (10,373,024) 5,000,312 (4,010,102) 26,846,011 (1,919,221)
- Non-controlling interests - - - - - -
- - 111,151,002 (6,470,737) 120,159,890 (10,373,024) 5,000,312 (4,010,102) 26,846,011 (1,919,221)
Total comprehensive (loss)/income for the year is attributable to: - -
- Owners 111,740,096 (6,333,504) 120,159,890 (10,884,086) 5,000,312 (4,010,102) 26,846,011 (1,919,221)
- Non-controlling interests - - - - - - -
- - 111,740,096 (6,333,504) 120,159,890 (10,884,086) 5,000,312 (4,010,102) 26,846,011 (1,919,221)
Earnings per share attributable to the ordinary equity holders
of the Company:
Continuing operations & discontinued operation
Basic earnings per share on (Naira) 690 (75) 746 (120) 31 (46) 167 (22)
Continuing operations
Basic earnings per share on (Naira) 29 (75) 128 (120) 31 (46) 167 (22)
The accompanying notes and significant accounting policies on pages 10 to 33 form an integral part of these financial statements.
**The group numbers for 2019 Q3 and YTD has been presented in line with IFRS 5 (Non current assets held for sale and discontinued operations)i.e post tax operating loss and group gain on disposal of discontinued operation has
been shown as a separate line on the statement of profit or loss.
5

Lafarge Africa Plc
**'30 Sept
2019
31 Dec
2018
30 Sept
2019
31 Dec
2018
Notes N'000 N'000 N'000 N'000
ASSETS
Non-current assets
Property, plant and equipment 14 365,236,408 394,488,764 302,807,463 291,775,732
Intangible assets 15 3,159,549 6,194,518 3,138,404 3,204,505
Investment in subsidiaries - - 63,946,867 178,923,532
Other financial assets 17 1,148,247 1,301,148 1,148,247 1,134,509
Other assets 19 18,977,025 16,671,760 17,389,010 15,073,457
Deferred tax assets 13.6 30,148,702 28,720,032 29,216,769 27,950,907
Total non-current assets 418,669,931 447,376,222 417,646,760 518,062,642
Current assets
Inventories 20 41,868,762 47,156,521 35,025,643 28,921,467
Trade and other receivables 21 5,970,968 21,163,994 20,878,141 11,167,705
Current tax asset 13.3 - 658,291 - -
Other assets 19 13,739,238 10,594,409 12,302,338 8,661,903
Other financial assets 17 767,599 1,140,956 1,465,920 605,230
Derivative assets 18 - 95,573 - 95,573
Cash and cash equivalents 22 9,744,172 12,550,697 7,700,601 10,177,776
Total current assets 72,090,739 93,360,441 77,372,643 59,629,654
Total assets 490,760,670 540,736,663 495,019,403 577,692,296
LIABILITIES
Non-current liabilities
Loans and borrowings 26 55,625,359 172,373,209 46,836,744 144,391,743
Deferred tax liabilities 13.6 9,510,029 10,200,112 - -
Provisions 27 1,449,659 3,645,751 921,918 618,970
Deferred income 28 2,436,847 2,597,602 1,372,722 1,455,770
Employee benefit obligations 29 2,211,896 4,729,183 1,885,997 1,611,411
Total non-current liabilities 71,233,790 193,545,857 51,017,381 148,077,894
Current liabilities
Trade and other payables 30 56,391,242 80,537,817 61,587,723 49,921,179
Loans and borrowings 26 8,950,590 93,833,850 12,507,754 105,685,719
Current tax liabilities 13.4 1,701,373 1,156,231 512,183 201,199
Provisions 27 1,190,409 1,281,247 1,009,637 845,328
Derivative liabilities 18 164,384 244,176 164,384 244,176
Deferred income 28 555,925 315,452 110,732 110,732
Bank overdrafts 22.1 692,039 35,280,945 692,039 16,862,345
Total current liabilities 69,645,962 212,649,718 76,584,452 173,870,678
Total liabilities 140,879,752 406,195,575 127,601,833 321,948,572
EQUITY
Share capital 23.1 8,053,899 4,336,714 8,053,898 4,336,714
Share premium 23.2 435,148,730 350,945,748 435,148,730 350,945,748
Retained earnings 160,768,243 138,272,355 115,893,903 92,140,223
Foreign currency translation reserve 24 39,103 9,364,261 39,103 39,103
Other reserves arising on business combination and re-
organisations 25 (254,129,057) (368,683,312) (191,718,064) (191,718,064)
Capital and reserves attributable to owners 349,880,918 134,235,766 367,417,570 255,743,724
Non-controlling interests - 305,322 - -
Total equity 349,880,918 134,541,088 367,417,570 255,743,724
Total equity and liabilities 490,760,670 540,736,663 495,019,403 577,692,296
Mobolaji Balogun Michel Puchercos Itie Ovie
Chairman Group Managing Director Chief Accounting Officer
FRC/2013/CISN/00000004945 FRC/2017/IODN/00000015919 FRC/2013/ICAN/00000000868
These financial statements were approved and authorised for issue by the board of directors on 24th October 2019 and were signed on its behalf by:
Consolidated and Separate Statements of Financial Position as at 30 Sept 2019
Group Company
The accompanying notes and significant accounting policies on pages 10 to 33 form an integral part of these financial statements.
**Group numbers as at 30th September 2019 excludes numbers from discontinued operation ( Lafarge South Africa Holdings (Pty) Ltd) which have
6

Lafarge Africa Plc
Consolidated and Separate Statements of Changes in Equity for the period ended 30 Sept 2019
Group
Share
capital
Share
premium
Retained
earnings Deposit for shares
Foreign
currency
translation
reserve
Other reserves
arising on business
combination and re-
organisations Total
Non-controlling
interests Total equity
Notes N'000 N'000 N'000 N'000 N'000 N'000 N'000 N'000 N'000
Balance at 1 January 2018 2,787,888 222,272,108 160,257,556 130,416,872 9,935,643 (368,683,312) 156,986,755 (0) 156,986,755
- -
(Loss)/profit for the year (10,373,024) (10,373,024) (10,373,024)
Other comprehensive income (Net of tax) (3,202) (507,861) (511,063) (511,063)
Issue of shares 1,548,827 130,101,427 131,650,255 131,650,255
Dividends paid (13,010,143) (13,010,143) (13,010,143)
Deposit for shares (130,416,872) (130,416,872) (130,416,872)
Right issue costs (1,427,788) (1,427,788) (1,427,788)
Transaction with owners 1,548,827 128,673,639 (23,386,369) (130,416,872) (507,861) - (24,088,636) - (24,088,636)
Balance at 30 Sept, 2018 4,336,715 350,945,747 136,871,187 - 9,427,782 (368,683,312) 132,898,119 (0) 132,898,119
Profit from Oct 2018 to Dec 2018 - - 1,265,976 - - - 1,265,976 - 1,265,976
Other comprehensive income (Net of tax) - - 135,192 - (63,521) - 71,671 305,322 376,993
Total comprehensive income for the
period
- - 1,401,168 - (63,521) - 1,337,647 305,322 1,642,969
Balance at 31 Dec 2018 4,336,715 350,945,747 138,272,355 - 9,364,261 (368,683,312) 134,235,766 305,322 134,541,088
At 1 January 2019 4,336,715 350,945,747 138,272,355 - 9,364,261 (368,683,312) 134,235,766 305,322 134,541,088
(Loss)/profit for the period - - 120,159,890 - - - 120,159,890 - 120,159,890
Other comprehensive income (Net of tax) - - - - - - - - -
Effect of change in accounting policy (3,102,321) (3,102,321) (3,102,321)
Total comprehensive income for the - - 117,057,569 - - - 117,057,569 - 117,057,569
Transaction with owners: -
Issue of shares 23 3,717,184 85,495,224 89,212,408 - 89,212,408
Reserves released upon
disposal of subsidiary company
- - (94,561,681) - 94,561,681 - -
Other movement in reserves arising from
disposal of discontinued operation
(9,325,158) 19,992,574 10,667,416 (305,322) 10,362,094
Right issue costs 23.2 (1,292,240) - - - (1,292,240) - (1,292,240)
Total transaction with owners 3,717,184 84,202,984 (94,561,681) - (9,325,158) 114,554,255 98,587,583 (305,322) 98,282,261
Balance at 30 Sept, 2019 8,053,899 435,148,730 160,768,243 - 39,103 (254,129,057) 349,880,918 (0) 349,880,918
Attributable to equity holders of the parent
The accompanying notes and significant accounting policies on pages 10 to 33 form an integral part of these financial statements.
**Group numbers as at 30th September 2019 excludes numbers from discontinued operation ( Lafarge South Africa Holdings (Pty) Ltd) which have been deconsolidated.
7
Lafarge Africa Plc
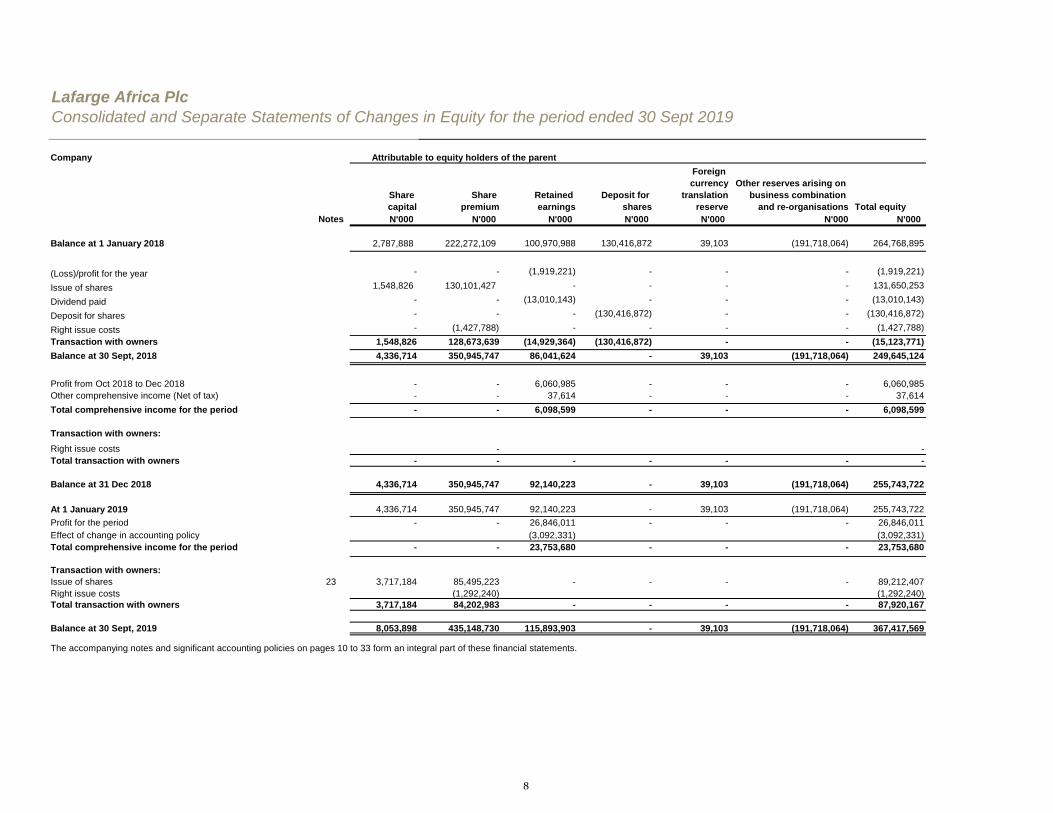
Consolidated and Separate Statements of Changes in Equity for the period ended 30 Sept 2019
Company
Share
capital
Share
premium
Retained
earnings
Deposit for
shares
Foreign
currency
translation
reserve
Other reserves arising on
business combination
and re-organisations Total equity
Notes N'000 N'000 N'000 N'000 N'000 N'000 N'000
Balance at 1 January 2018 2,787,888 222,272,109 100,970,988 130,416,872 39,103 (191,718,064) 264,768,895
(Loss)/profit for the year - - (1,919,221) - - - (1,919,221)
Issue of shares 1,548,826 130,101,427 - - - - 131,650,253
Dividend paid - - (13,010,143) - - - (13,010,143)
Deposit for shares - - - (130,416,872) - - (130,416,872)
Right issue costs - (1,427,788) - - - - (1,427,788)
Transaction with owners 1,548,826 128,673,639 (14,929,364) (130,416,872) - - (15,123,771)
Balance at 30 Sept, 2018 4,336,714 350,945,747 86,041,624 - 39,103 (191,718,064) 249,645,124
Profit from Oct 2018 to Dec 2018 - - 6,060,985 - - - 6,060,985
Other comprehensive income (Net of tax) - - 37,614 - - - 37,614
Total comprehensive income for the period - - 6,098,599 - - - 6,098,599
Transaction with owners:
Right issue costs - -
Total transaction with owners - - - - - - -
Balance at 31 Dec 2018 4,336,714 350,945,747 92,140,223 - 39,103 (191,718,064) 255,743,722
At 1 January 2019 4,336,714 350,945,747 92,140,223 - 39,103 (191,718,064) 255,743,722
Profit for the period - - 26,846,011 - - - 26,846,011
Effect of change in accounting policy (3,092,331) (3,092,331)
Total comprehensive income for the period - - 23,753,680 - - - 23,753,680
Transaction with owners:
Issue of shares 23 3,717,184 85,495,223 - - - - 89,212,407
Right issue costs (1,292,240) (1,292,240)
Total transaction with owners 3,717,184 84,202,983 - - - - 87,920,167
Balance at 30 Sept, 2019 8,053,898 435,148,730 115,893,903 - 39,103 (191,718,064) 367,417,569
Attributable to equity holders of the parent
The accompanying notes and significant accounting policies on pages 10 to 33 form an integral part of these financial statements.
8
Lafarge Africa Plc
30 Sept
2019
30 Sept
2018
31 Dec
2018
30 Sept
2019
30 Sept
2018
31 Dec
2018
Notes N'000 N'000 N'000 N'000 N'000 N'000
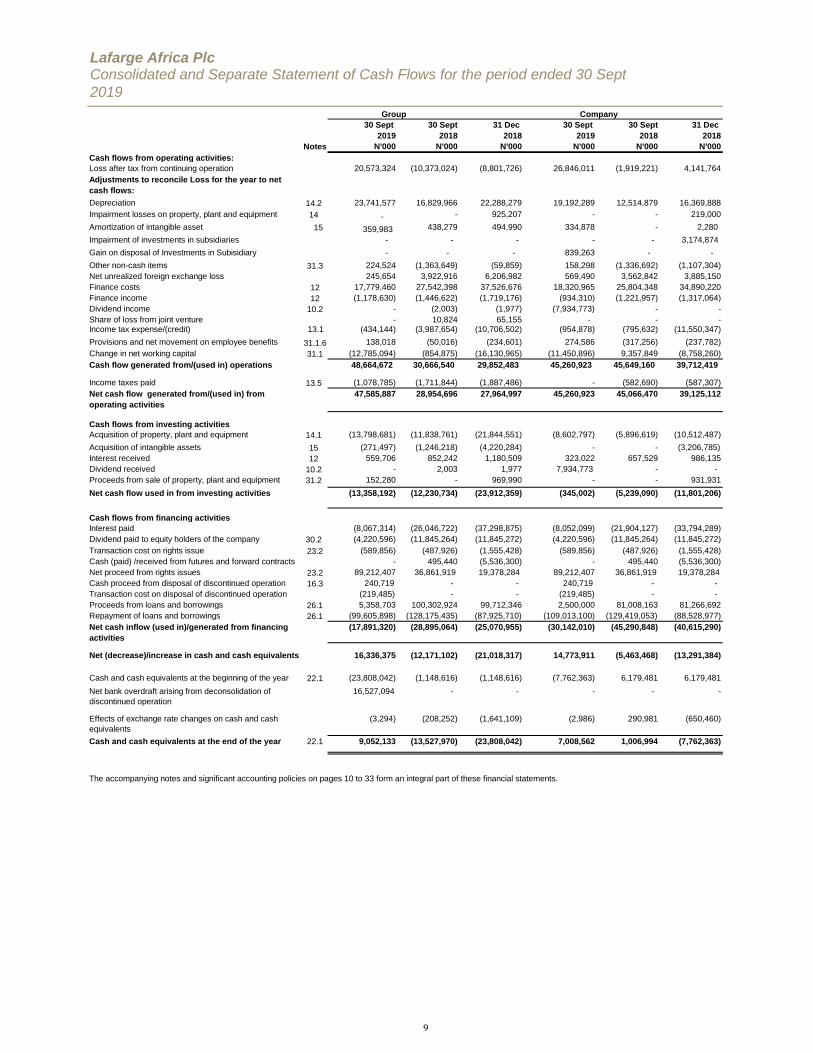
Cash flows from operating activities:
Loss after tax from continuing operation 20,573,324 (10,373,024) (8,801,726) 26,846,011 (1,919,221) 4,141,764
Adjustments to reconcile Loss for the year to net
cash flows:
Depreciation 14.2 23,741,577 16,829,966 22,288,279 19,192,289 12,514,879 16,369,888
Impairment losses on property, plant and equipment 14 - - 925,207 - - 219,000
Amortization of intangible asset 15 359,983 438,279 494,990 334,878 - 2,280
Impairment of investments in subsidiaries - - - - - 3,174,874
Gain on disposal of Investments in Subisidiary - - - 839,263 - -
Other non-cash items 31.3 224,524 (1,363,649) (59,859) 158,298 (1,336,692) (1,107,304)
Net unrealized foreign exchange loss 245,654 3,922,916 6,206,982 569,490 3,562,842 3,885,150
Finance costs 12 17,779,460 27,542,398 37,526,676 18,320,965 25,804,348 34,890,220
Finance income 12 (1,178,630) (1,446,622) (1,719,176) (934,310) (1,221,957) (1,317,064)
Dividend income 10.2 - (2,003) (1,977) (7,934,773) - -
Share of loss from joint venture - 10,824 65,155 - - - Income tax expense/(credit) 13.1 (434,144) (3,987,654) (10,706,502) (954,878) (795,632) (11,550,347)
Provisions and net movement on employee benefits 31.1.6 138,018 (50,016) (234,601) 274,586 (317,256) (237,782)
Change in net working capital 31.1 (12,785,094) (854,875) (16,130,965) (11,450,896) 9,357,849 (8,758,260)
Cash flow generated from/(used in) operations 48,664,672 30,666,540 29,852,483 45,260,923 45,649,160 39,712,419
Income taxes paid 13.5 (1,078,785) (1,711,844) (1,887,486) - (582,690) (587,307)
Net cash flow generated from/(used in) from
operating activities
47,585,887 28,954,696 27,964,997 45,260,923 45,066,470 39,125,112
Cash flows from investing activities
Acquisition of property, plant and equipment 14.1 (13,798,681) (11,838,761) (21,844,551) (8,602,797) (5,896,619) (10,512,487)
Acquisition of intangible assets 15 (271,497) (1,246,218) (4,220,284) - - (3,206,785)
Interest received 12 559,706 852,242 1,180,509 323,022 657,529 986,135
Dividend received 10.2 - 2,003 1,977 7,934,773 - -
Proceeds from sale of property, plant and equipment 31.2 152,280 - 969,990 - - 931,931
Net cash flow used in from investing activities (13,358,192) (12,230,734) (23,912,359) (345,002) (5,239,090) (11,801,206)
Cash flows from financing activities
Interest paid (8,067,314) (26,046,722) (37,298,875) (8,052,099) (21,904,127) (33,794,289)
Dividend paid to equity holders of the company 30.2 (4,220,596) (11,845,264) (11,845,272) (4,220,596) (11,845,264) (11,845,272)
Transaction cost on rights issue 23.2 (589,856) (487,926) (1,555,428) (589,856) (487,926) (1,555,428)
Cash (paid) /received from futures and forward contracts - 495,440 (5,536,300) - 495,440 (5,536,300)
Net proceed from rights issues 23.2 89,212,407 36,861,919 19,378,284 89,212,407 36,861,919 19,378,284
Cash proceed from disposal of discontinued operation 16.3 240,719 - - 240,719 - -
Transaction cost on disposal of discontinued operation (219,485) - - (219,485) - -
Proceeds from loans and borrowings 26.1 5,358,703 100,302,924 99,712,346 2,500,000 81,008,163 81,266,692
Repayment of loans and borrowings 26.1 (99,605,898) (128,175,435) (87,925,710) (109,013,100) (129,419,053) (88,528,977)
Net cash inflow (used in)/generated from financing
activities
(17,891,320) (28,895,064) (25,070,955) (30,142,010) (45,290,848) (40,615,290)
Net (decrease)/increase in cash and cash equivalents 16,336,375 (12,171,102) (21,018,317) 14,773,911 (5,463,468) (13,291,384)
Cash and cash equivalents at the beginning of the year 22.1 (23,808,042) (1,148,616) (1,148,616) (7,762,363) 6,179,481 6,179,481
16,527,094 - - - - -
Effects of exchange rate changes on cash and cash
equivalents
(3,294) (208,252) (1,641,109) (2,986) 290,981 (650,460)
Cash and cash equivalents at the end of the year 22.1 9,052,133 (13,527,970) (23,808,042) 7,008,562 1,006,994 (7,762,363)
Group Company
Consolidated and Separate Statement of Cash Flows for the period ended 30 Sept
2019
The accompanying notes and significant accounting policies on pages 10 to 33 form an integral part of these financial statements.
Net bank overdraft arising from deconsolidation of
discontinued operation
9

Lafarge Africa Plc
1 The Company
Business description
30th Sept 2019 31st Dec. 2018 30th Sept 2018
Ashaka Cement PLC Ashaka Cement PLC Ashaka Cement PLC
Lafarge Ready Mix Nigeria Limited Lafarge Ready Mix Nigeria Limited Lafarge Ready Mix Nigeria Limited
Lafarge South Africa Holdings (PTY) Limited Lafarge South Africa Holdings (PTY) Limited
Wapsila Nigeria Limited Wapsila Nigeria Limited
2
i) Financial period
ii) Statement of compliance
iii) Basis of preparation
- defined benefit pension plans - plan assets measured at fair value
- inventory - lower of cost and net realisable value
- non-derivative financial instruments – initially at fair value and subsequently at amortized cost using effective interest rate
- derivative financial instruments – measured at fair value
The historical financial information is presented in Naira and all values are rounded to the nearest thousand (N'000), except where
otherwise indicated. The accounting policies are applicable to both the Company and Group.
These consolidated and separate financial statements cover the financial period from 1 January 2019 to 30 September 2019 with
corresponding figures for period ended 30 September 2018.
Summary of significant accounting policies
The financial statements have been prepared in accordance with the going concern assumption under the historical cost concept except
for the following:
These interim condensed consolidated and separate financial statements of Lafarge Africa Plc Group have been prepared in accordance
with IAS 34 Interim Financial Reporting. They do not include all disclosures that would otherwise required in a complete set of financial
statements and should be read in conjuction with 2018 annual report. The financial statements which were prepared on a going concern
basis, were authorized for issue by the Company's board of directors on 24th October 2019.
The financial statements comprise the statement of profit or loss and other comprehensive income, the statement of financial position, the
statement of changes in equity, the statement of cash flows and the notes to the financial statements.
The Group financial statements of Lafarge Africa Plc for the period ended 30 Sept 2019 have been prepared in accordance with
International Financial Reporting Standards ("IFRS") and interpretations issued by the IFRS Interpretations Committee (IFRS IC)
applicable to companies reporting under IFRS and the requirements of the Companies and Allied Matters Act CAP C.20 Laws of the
Federation of Nigeria, 2004 and the Financial Reporting Council of Nigeria Act, 2011.
Lafarge Africa Plc Group has consistently applied the same accounting policies and methods of computation in its interim condensed
consolidated and separate financial statements as in its 2018 annual financial statements. New standards, interpretations and
ammendments , effective for the first time from 1st January 2019, which had a material effect on the financial statements have been
applied appropriately.
The Group's subsidiaries are as stated below;
Notes to the Consolidated and Separate Financial Statements for the period
ended 30 Sept 2019
Lafarge Africa is in the business of manufacturing and marketing of cement and other cementitious products such as Ready-Mix
Concrete, Aggregates, Fly-Ash etc. On July 15, 2016, Lafarge S.A. France and Holcim Limited, Switzerland two large global players
merged to form LafargeHolcim Group based in Zurich, Switzerland. Consequently Lafarge Africa is now a subsidiary company of Lafarge
Holcim. The term ‘Group’ as used in this report refers to Lafarge Africa, its subsidiaries and investment in joint operations.
Lafarge Africa PLC (Lafarge Africa) was incorporated in Nigeria on 26 February, 1959 and commenced business on 10 January 1961.
The Company formerly known as Lafarge Cement WAPCO Nigeria Plc changed its name after a special resolution was passed by the
shareholders at an Annual General Meeting held on Wednesday 9 July 2014. These consolidated financial statements comprise the
Company and its subsidiaries (together referred to as the "Group"). The Company’s corporate head office is situated at 27B Gerrard
Road, Ikoyi, Lagos which is same as the registered office.
10
Lafarge Africa Plc
3months ended
30/09/2019
3months ended
30/09/2018
9months ended
30/09/2019
9months ended
30/09/2018
3months ended
30/09/2019
3months ended
30/09/2018
9months ended
30/09/2019
9months ended
30/09/2018
N'000 N'000 N'000 N'000 N'000 N'000
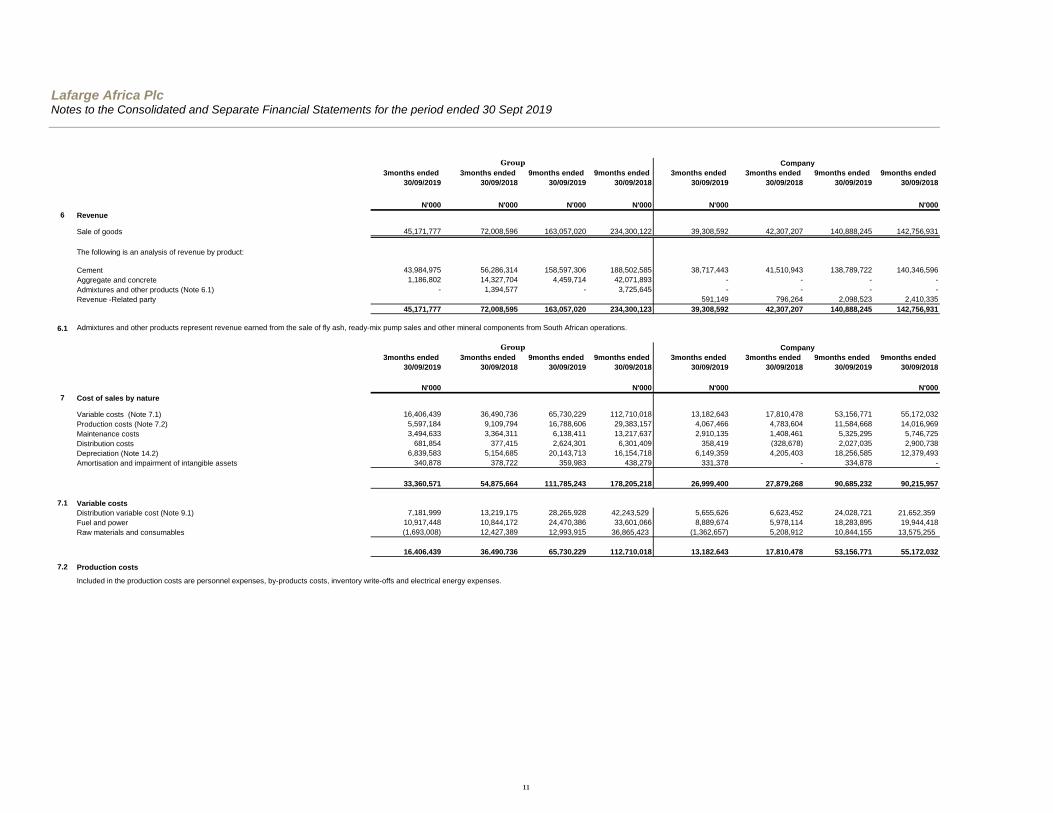
6 Revenue
Sale of goods 45,171,777 72,008,596 163,057,020 234,300,122 39,308,592 42,307,207 140,888,245 142,756,931
The following is an analysis of revenue by product:
Cement 43,984,975 56,286,314 158,597,306 188,502,585 38,717,443 41,510,943 138,789,722 140,346,596
Aggregate and concrete 1,186,802 14,327,704 4,459,714 42,071,893 - - - -
Admixtures and other products (Note 6.1) - 1,394,577 - 3,725,645 - - - -
Revenue -Related party 591,149 796,264 2,098,523 2,410,335
45,171,777 72,008,595 163,057,020 234,300,123 39,308,592 42,307,207 140,888,245 142,756,931
6.1
3months ended
30/09/2019
3months ended
30/09/2018
9months ended
30/09/2019
9months ended
30/09/2018
3months ended
30/09/2019
3months ended
30/09/2018
9months ended
30/09/2019
9months ended
30/09/2018
N'000 N'000 N'000 N'000
7 Cost of sales by nature
Variable costs (Note 7.1) 16,406,439 36,490,736 65,730,229 112,710,018 13,182,643 17,810,478 53,156,771 55,172,032
Production costs (Note 7.2) 5,597,184 9,109,794 16,788,606 29,383,157 4,067,466 4,783,604 11,584,668 14,016,969
Maintenance costs 3,494,633 3,364,311 6,138,411 13,217,637 2,910,135 1,408,461 5,325,295 5,746,725
Distribution costs 681,854 377,415 2,624,301 6,301,409 358,419 (328,678) 2,027,035 2,900,738
Depreciation (Note 14.2) 6,839,583 5,154,685 20,143,713 16,154,718 6,149,359 4,205,403 18,256,585 12,379,493
Amortisation and impairment of intangible assets 340,878 378,722 359,983 438,279 331,378 - 334,878 -
33,360,571 54,875,664 111,785,243 178,205,218 26,999,400 27,879,268 90,685,232 90,215,957
7.1 Variable costs
Distribution variable cost (Note 9.1) 7,181,999 13,219,175 28,265,928 42,243,529 5,655,626 6,623,452 24,028,721 21,652,359
Fuel and power 10,917,448 10,844,172 24,470,386 33,601,066 8,889,674 5,978,114 18,283,895 19,944,418
Raw materials and consumables (1,693,008) 12,427,389 12,993,915 36,865,423 (1,362,657) 5,208,912 10,844,155 13,575,255
16,406,439 36,490,736 65,730,229 112,710,018 13,182,643 17,810,478 53,156,771 55,172,032
7.2 Production costs
Notes to the Consolidated and Separate Financial Statements for the period ended 30 Sept 2019
Group Company
Group Company
Included in the production costs are personnel expenses, by-products costs, inventory write-offs and electrical energy expenses.
Admixtures and other products represent revenue earned from the sale of fly ash, ready-mix pump sales and other mineral components from South African operations.
11
Lafarge Africa PlcNotes to the Consolidated and Separate Financial Statements for the period ended 30 Sept 2019
3months ended
30/09/2019
3months ended
30/09/2018
9months ended
30/09/2019
9months ended
30/09/2018
3months ended
30/09/2019
3months ended
30/09/2018
9months ended
30/09/2019
9months ended
30/09/2018
N'000 N'000 N'000 N'000
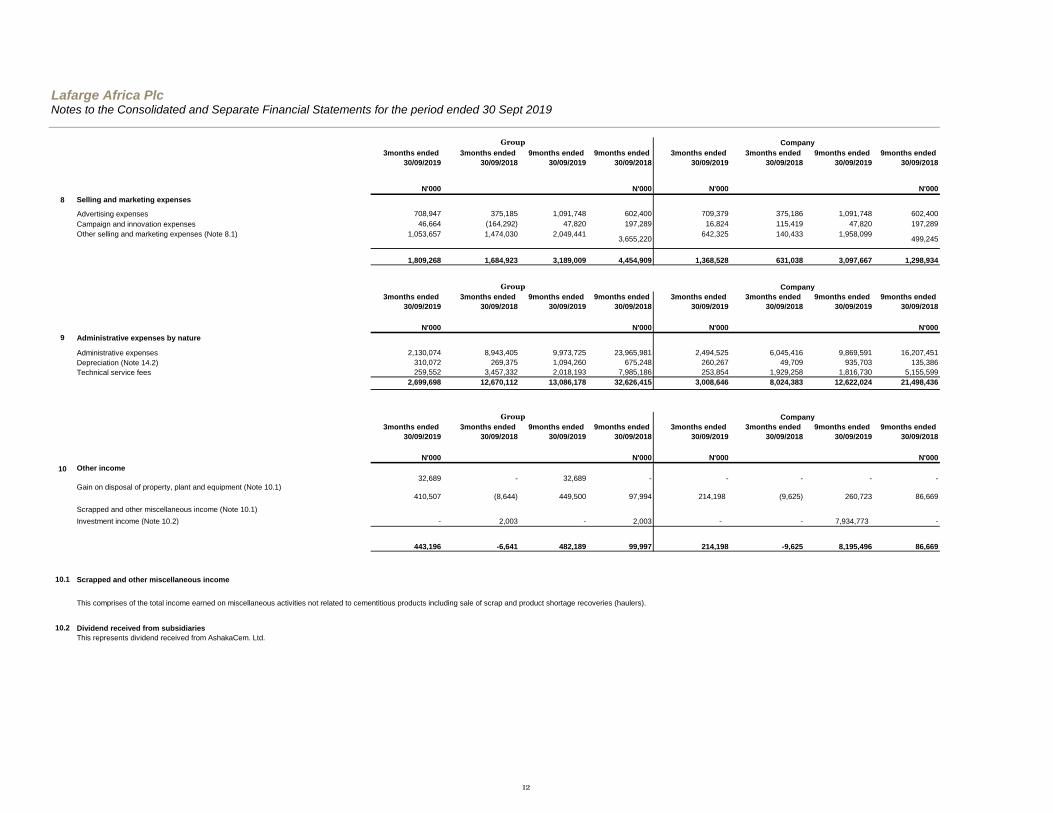
8 Selling and marketing expenses
Advertising expenses 708,947 375,185 1,091,748 602,400 709,379 375,186 1,091,748 602,400
Campaign and innovation expenses 46,664 (164,292) 47,820 197,289 16,824 115,419 47,820 197,289
Other selling and marketing expenses (Note 8.1) 1,053,657 1,474,030 2,049,441 3,655,220
642,325 140,433 1,958,099 499,245
1,809,268 1,684,923 3,189,009 4,454,909 1,368,528 631,038 3,097,667 1,298,934
3months ended
30/09/2019
3months ended
30/09/2018
9months ended
30/09/2019
9months ended
30/09/2018
3months ended
30/09/2019
3months ended
30/09/2018
9months ended
30/09/2019
9months ended
30/09/2018
N'000 N'000 N'000 N'000
9 Administrative expenses by nature
Administrative expenses 2,130,074 8,943,405 9,973,725 23,965,981 2,494,525 6,045,416 9,869,591 16,207,451
Depreciation (Note 14.2) 310,072 269,375 1,094,260 675,248 260,267 49,709 935,703 135,386
Technical service fees 259,552 3,457,332 2,018,193 7,985,186 253,854 1,929,258 1,816,730 5,155,599
2,699,698 12,670,112 13,086,178 32,626,415 3,008,646 8,024,383 12,622,024 21,498,436
3months ended
30/09/2019
3months ended
30/09/2018
9months ended
30/09/2019
9months ended
30/09/2018
3months ended
30/09/2019
3months ended
30/09/2018
9months ended
30/09/2019
9months ended
30/09/2018
N'000 N'000 N'000 N'000
10 Other income
32,689 - 32,689 - - - - -
410,507 (8,644) 449,500 97,994 214,198 (9,625) 260,723 86,669 - - - - - - -
Investment income (Note 10.2) - 2,003 - 2,003 - - 7,934,773 -
443,196 -6,641 482,189 99,997 214,198 -9,625 8,195,496 86,669
10.1 Scrapped and other miscellaneous income
10.2 Dividend received from subsidiaries
This represents dividend received from AshakaCem. Ltd.
Group Company
Company Group
This comprises of the total income earned on miscellaneous activities not related to cementitious products including sale of scrap and product shortage recoveries (haulers).
Gain on disposal of property, plant and equipment (Note 10.1)
Scrapped and other miscellaneous income (Note 10.1)
Group Company
12
Lafarge Africa PlcNotes to the Consolidated and Separate Financial Statements for the period ended 30 Sept 2019
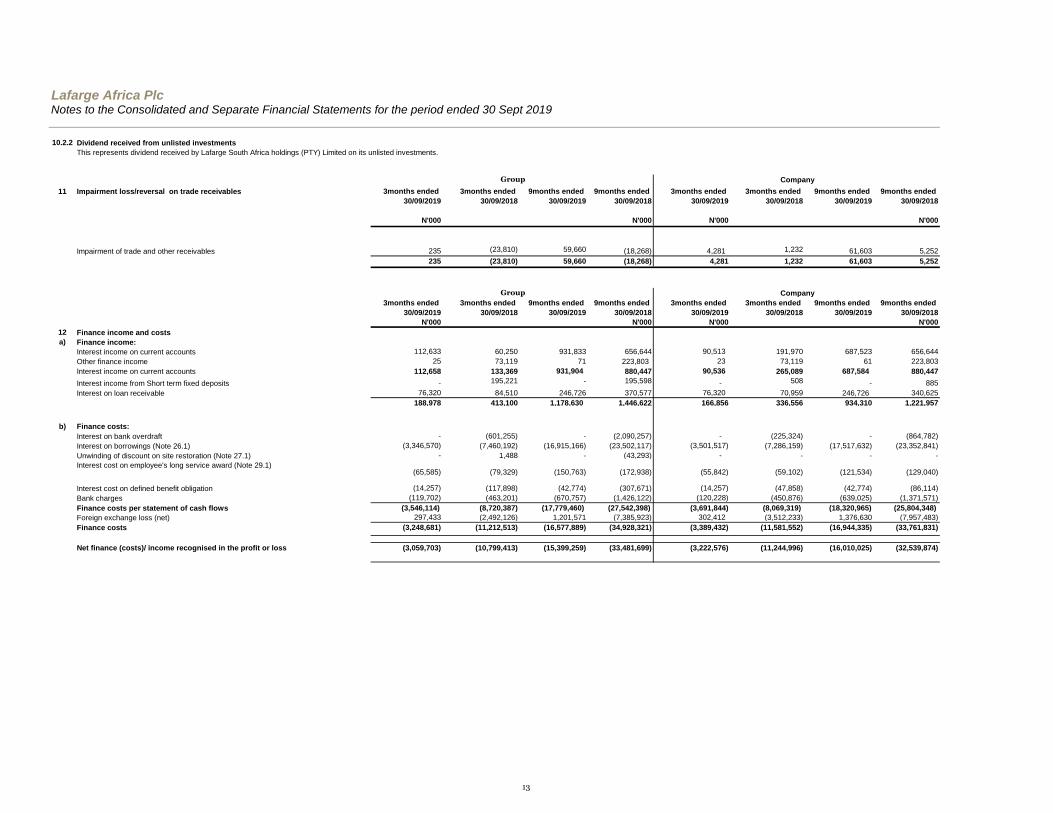
10.2.2 Dividend received from unlisted investments
This represents dividend received by Lafarge South Africa holdings (PTY) Limited on its unlisted investments.
11 Impairment loss/reversal on trade receivables 3months ended
30/09/2019
3months ended
30/09/2018
9months ended
30/09/2019
9months ended
30/09/2018
3months ended
30/09/2019
3months ended
30/09/2018
9months ended
30/09/2019
9months ended
30/09/2018
N'000 N'000 N'000 N'000
Impairment of trade and other receivables 235 (23,810) 59,660 (18,268) 4,281 1,232 61,603 5,252
235 (23,810) 59,660 (18,268) 4,281 1,232 61,603 5,252
3months ended
30/09/2019
3months ended
30/09/2018
9months ended
30/09/2019
9months ended
30/09/2018
3months ended
30/09/2019
3months ended
30/09/2018
9months ended
30/09/2019
9months ended
30/09/2018
N'000 N'000 N'000 N'000
12 Finance income and costs
a) Finance income:
Interest income on current accounts 112,633 60,250 931,833 656,644 90,513 191,970 687,523 656,644
Other finance income 25 73,119 71 223,803 23 73,119 61 223,803
Interest income on current accounts 112,658 133,369 931,904 880,447 90,536 265,089 687,584 880,447
Interest income from Short term fixed deposits - 195,221 - 195,598 - 508 - 885
Interest on loan receivable 76,320 84,510 246,726 370,577 76,320 70,959 246,726 340,625
188,978 413,100 1,178,630 1,446,622 166,856 336,556 934,310 1,221,957
b) Finance costs:
Interest on bank overdraft - (601,255) - (2,090,257) - (225,324) - (864,782)
Interest on borrowings (Note 26.1) (3,346,570) (7,460,192) (16,915,166) (23,502,117) (3,501,517) (7,286,159) (17,517,632) (23,352,841)
Unwinding of discount on site restoration (Note 27.1) - 1,488 - (43,293) - - - -
Interest cost on employee's long service award (Note 29.1) (65,585) (79,329) (150,763) (172,938) (55,842) (59,102) (121,534) (129,040)
Interest cost on defined benefit obligation (14,257) (117,898) (42,774) (307,671) (14,257) (47,858) (42,774) (86,114)
Bank charges (119,702) (463,201) (670,757) (1,426,122) (120,228) (450,876) (639,025) (1,371,571)
Finance costs per statement of cash flows (3,546,114) (8,720,387) (17,779,460) (27,542,398) (3,691,844) (8,069,319) (18,320,965) (25,804,348)
Foreign exchange loss (net) 297,433 (2,492,126) 1,201,571 (7,385,923) 302,412 (3,512,233) 1,376,630 (7,957,483)
Finance costs (3,248,681) (11,212,513) (16,577,889) (34,928,321) (3,389,432) (11,581,552) (16,944,335) (33,761,831)
Net finance (costs)/ income recognised in the profit or loss (3,059,703) (10,799,413) (15,399,259) (33,481,699) (3,222,576) (11,244,996) (16,010,025) (32,539,874)
Group Company
Company Group
13
Lafarge Africa PlcNotes to the Consolidated and Separate Financial Statements for the period ended 30 Sept 2019
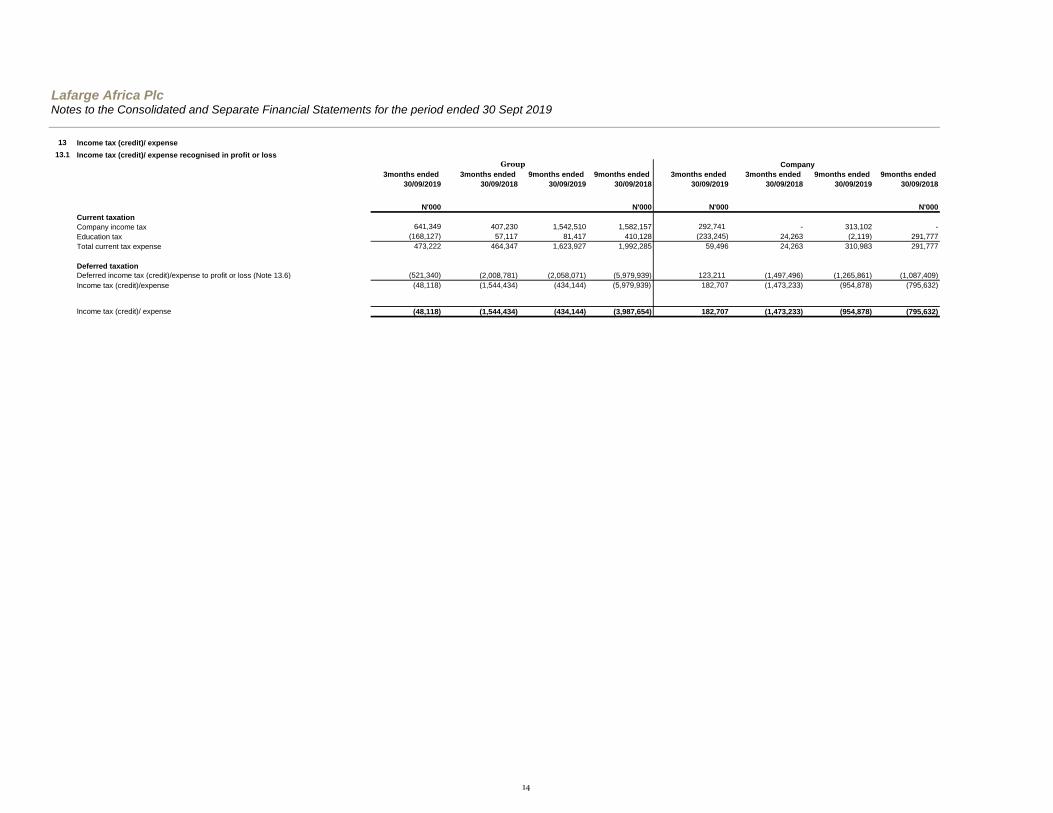
13 Income tax (credit)/ expense
13.1 Income tax (credit)/ expense recognised in profit or loss
3months ended
30/09/2019
3months ended
30/09/2018
9months ended
30/09/2019
9months ended
30/09/2018
3months ended
30/09/2019
3months ended
30/09/2018
9months ended
30/09/2019
9months ended
30/09/2018
N'000 N'000 N'000 N'000
Current taxation
Company income tax 641,349 407,230 1,542,510 1,582,157 292,741 - 313,102 -
Education tax (168,127) 57,117 81,417 410,128 (233,245) 24,263 (2,119) 291,777
Total current tax expense 473,222 464,347 1,623,927 1,992,285 59,496 24,263 310,983 291,777
Deferred taxation
Deferred income tax (credit)/expense to profit or loss (Note 13.6) (521,340) (2,008,781) (2,058,071) (5,979,939) 123,211 (1,497,496) (1,265,861) (1,087,409)
Income tax (credit)/expense (48,118) (1,544,434) (434,144) (5,979,939) 182,707 (1,473,233) (954,878) (795,632)
Income tax (credit)/ expense (48,118) (1,544,434) (434,144) (3,987,654) 182,707 (1,473,233) (954,878) (795,632)
Company Group
14
Lafarge Africa Plc
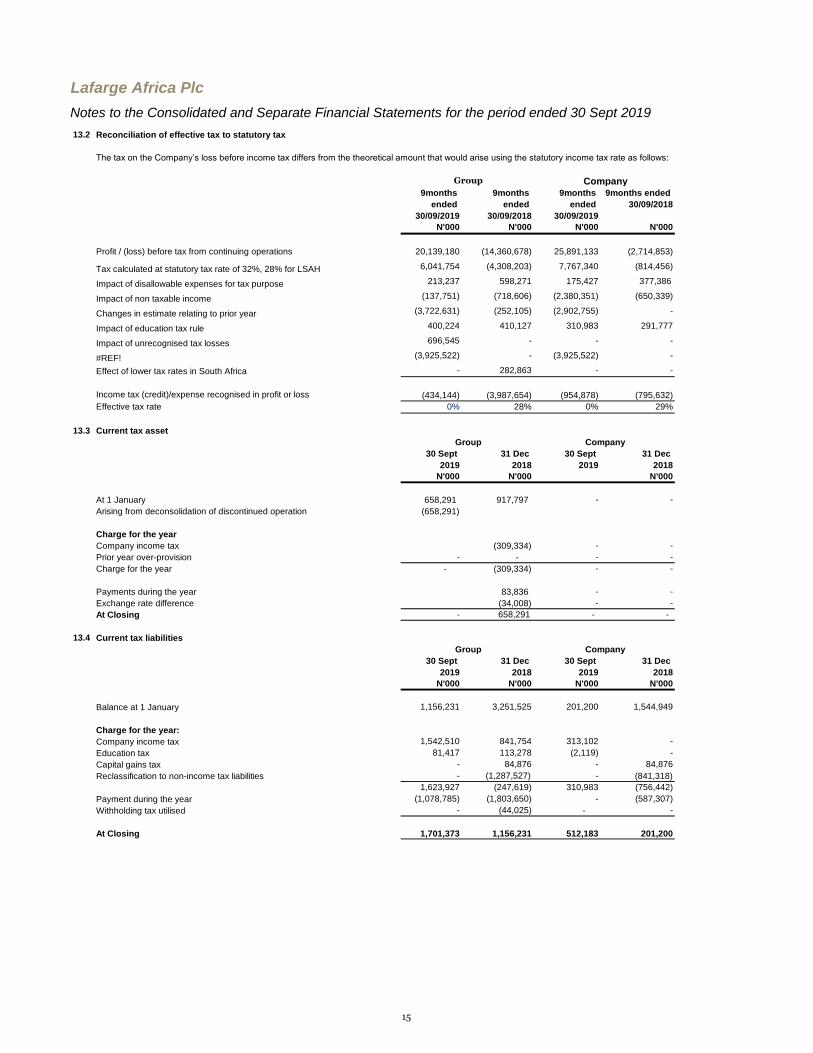
13.2 Reconciliation of effective tax to statutory tax
9months
ended
30/09/2019
9months
ended
30/09/2018
9months
ended
30/09/2019
9months ended
30/09/2018
N'000 N'000 N'000 N'000
20,139,180 (14,360,678) 25,891,133 (2,714,853)
6,041,754 (4,308,203) 7,767,340 (814,456)
Impact of disallowable expenses for tax purpose 213,237 598,271 175,427 377,386
Impact of non taxable income (137,751) (718,606) (2,380,351) (650,339)
Changes in estimate relating to prior year (3,722,631) (252,105) (2,902,755) -
Impact of education tax rule 400,224 410,127 310,983 291,777
Impact of unrecognised tax losses 696,545 - - -
#REF! (3,925,522) - (3,925,522) -
Effect of lower tax rates in South Africa - 282,863 - -
(434,144) (3,987,654) (954,878) (795,632)
Effective tax rate 0% 28% 0% 29%
13.3 Current tax asset
30 Sept
2019
31 Dec
2018
30 Sept
2019
31 Dec
2018
N'000 N'000 N'000
At 1 January 658,291 917,797 - -
Arising from deconsolidation of discontinued operation (658,291)
Charge for the year
Company income tax (309,334) - -
Prior year over-provision - - - -
Charge for the year - (309,334) - -
Payments during the year 83,836 - -
Exchange rate difference (34,008) - -
At Closing - 658,291 - -
13.4 Current tax liabilities
30 Sept
2019
31 Dec
2018
30 Sept
2019
31 Dec
2018
N'000 N'000 N'000 N'000
Balance at 1 January 1,156,231 3,251,525 201,200 1,544,949
Charge for the year:
Company income tax 1,542,510 841,754 313,102 -
Education tax 81,417 113,278 (2,119) -
Capital gains tax - 84,876 - 84,876
Reclassification to non-income tax liabilities - (1,287,527) - (841,318)
1,623,927 (247,619) 310,983 (756,442)
Payment during the year (1,078,785) (1,803,650) - (587,307)
Withholding tax utilised - (44,025) - -
At Closing 1,701,373 1,156,231 512,183 201,200
Group Company
Group Company
The tax on the Company’s loss before income tax differs from the theoretical amount that would arise using the statutory income tax rate as follows:
Group Company
Notes to the Consolidated and Separate Financial Statements for the period ended 30 Sept 2019
Profit / (loss) before tax from continuing operations
Tax calculated at statutory tax rate of 32%, 28% for LSAH
Income tax (credit)/expense recognised in profit or loss
15

13.5
30 Sept
2019
31 Dec
2018
30 Sept
2019
31 Dec
2018
N'000 N'000 N'000 N'000
Current income tax asset paid (Note 13.3) - (83,836) -
Current income tax liabilities paid (Note 13.4) (1,078,785) (1,803,650) - (587,307)
Total current income taxes paid (1,078,785) (1,887,486) - (587,307)
13.6 Deferred taxation
The analysis of deferred tax assets/(liabilities) is as follows:
30 Sept
2019
31 Dec
2018
30 Sept
2019
31 Dec
2018
N'000 N'000 N'000 N'000
Deferred tax assets 30,148,702 28,720,032 29,216,769 27,950,907
Deferred tax liabilities (9,510,029) (10,200,112) - -
Deferred tax assets/(liabilities) net 20,638,673 18,519,920 29,216,769 27,950,907
Group
Deferred tax liabilities/(assets): At 1 January
2019
Derecognitio
n of
discontinued
operation
(Credit)/
charge to P/L
(Credit)/
charge to OCI
Exchange rate
differences
30 Sept
2019
N'000 N'000 N'000 N'000 N'000 N'000
Property, plant and equipment 18,967,634 (9,965,785) (7,522,399) - (23) 1,479,426
Provisions and other liabilities (9,324,378) 2,449,551 522,652 - 382,295 (5,969,880)
Unutilised tax losses (23,576,537) 7,244,981 4,596,491 - (4,480) (11,739,545)
Employment benefit obligation 167,220 (96,349) - - (70,871) -
Unrealised exchange differences (4,753,859) 345,185 - - (4,408,674)
Total deferred tax (assets)/liabilities (18,519,920) (367,602) (2,058,071) - 306,920 (20,638,673)
Deferred tax liabilities/(assets): At 1 January
2018
(Credit)/
charge to P/L
(Credit)/
charge to OCI
Exchange
rate
31 December
2018
N'000 N'000 N'000 N'000 N'000
Property, plant and equipment 24,725,234 (5,011,254) - (746,346) 18,967,634
Provisions and other liabilities (6,407,725) (3,041,388) - 124,735 (9,324,378)
Unutilised tax losses (19,038,136) (5,066,123) - 527,722 (23,576,537)
Employment benefit obligation (131,065) 176,953 54,401 66,931 167,220
Prepayments 83,776 (82,649) - (1,127) -
Unrealised exchange differences (5,720,573) 966,714 - - (4,753,859)
Total deferred tax (assets)/liabilities (6,488,489) (12,057,747) 54,401 (28,085) (18,519,920) -
Company
Deferred tax assets/(liabilities):
At 1 January
2019
(Credit)/
charge to P/L
(Credit)/
charge to OCI
30 Sept
2019
N'000 N'000 N'000 N'000
Property, plant and equipment (1,437,267) (6,472,016) - (7,909,283)
Unutilised tax losses (15,773,773) 4,664,742 - (11,109,031)
Provisions and other liabilities (5,781,347) 95,195 - (5,686,152)
Unrealised exchange differences (4,958,520) 446,218 - (4,512,302)
Total deferred tax (assets)/liabilities (27,950,907) (1,265,862) (29,216,769)
Deferred tax liabilities/ (assets): At 1 January
2018
(Credit)/
charge to P/L
(Credit)/
charge to OCI
31 December
2018
N'000 N'000 N'000 N'000
Property, plant and equipment 3,756,535 (5,193,802) - (1,437,267)
Unutilised tax losses (11,684,826) (4,088,947) - (15,773,773)
Provisions and other liabilities (2,699,231) (3,082,116) - (5,781,347)
Unrealised exchange differences (5,511,209) 552,689 - (4,958,520)
Post employment benefit obligation (194,653) 176,953 17,700 -
Total deferred tax liabilities/(assets) (16,333,384) (11,635,223) 17,700 (27,950,907) -
Group Company
Deferred tax assets are recognised to the extent that it is probable that taxable profit will be available against which the deductible temporary
differences and unutilized tax losses can be utilised.
Group Company
In the statement of cash flows, Income taxes paid comprise:
16

Lafarge Africa Plc
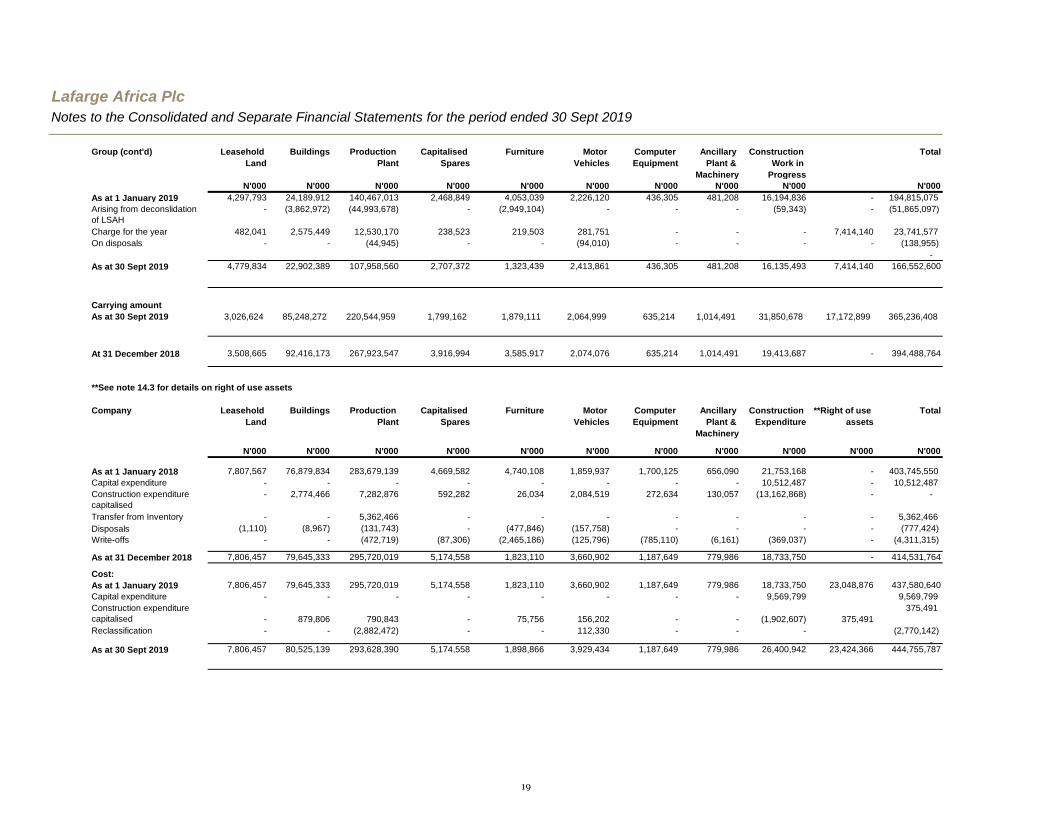
14 Property, plant and equipment
Group Leasehold
Land
Buildings Production
Plant
Capitalised
Spares
Furniture Motor
Vehicles
Computer
Equipment
Ancillary
Plant &
Machinery
Construction
Work in
Progress
**Right of use
assets
Total
N'000 N'000 N'000 N'000 N'000 N'000 N'000 N'000 N'000 N'000 N'000
Cost:
As at 1 January 2018 7,957,750 112,228,459 399,062,642 4,669,582 10,995,791 2,429,640 1,583,995 1,371,803 34,130,290 - 574,429,952
Capital expenditure - - - - - - - - 21,654,504 - 21,654,504
Transfer from inventory - - 5,362,466 1,211,285 - - - - - - 6,573,751
Construction expenditure
capitalised
- 5,572,794 10,635,564 592,282 341,526 2,245,276 272,634 130,057 (19,790,133) - -
Reclassification - - - - 45,562 (45,562) - - - - -
Disposals (1,110) (9,099) (347,503) - (749,297) (198,162) - - - - (1,305,171)
Write-offs (150,182) (492,404) (553,146) (87,306) (2,657,045) (130,996) (785,110) (6,161) (458,882) - (5,321,232)
Effect of movements in
exchange rates
- (693,665) (5,769,463) - (337,581) - - - 72,744 - (6,727,965)
-
As at 31 December 2018 7,806,458 116,606,085 408,390,560 6,385,843 7,638,956 4,300,196 1,071,519 1,495,699 35,608,523 - 589,303,839
Cost:
As at 1 January 2019 7,806,458 116,606,085 408,390,560 6,385,843 7,638,956 4,300,196 1,071,519 1,495,699 35,608,523 24,108,188 613,412,027
Arising from deconslidation
of LSAH
- (9,396,166) (77,722,580) - (4,512,162) - - - (989,517) - (92,620,425)
Capital expenditure - - - - - - - - 15,396,250 - 15,396,250
Construction expenditure
capitalised
- 940,742 843,642 612 75,756 168,334 - - (2,029,086) 478,851 478,851
Reclassification - - (2,955,626) (1,879,922) - 221,277 - - - - (4,614,271)
Disposals - - (52,477) - - (210,947) - - - - (263,424)
As at 30 Sept 2019 7,806,458 108,150,661 328,503,518 4,506,533 3,202,550 4,478,860 1,071,519 1,495,699 47,986,170 24,587,039 531,789,008
Group Leasehold
Land
Buildings Production
Plant
Capitalised
Spares
Furniture Motor
Vehicles
Computer
Equipment
Ancillary
Plant &
Machinery
Construction
Work in
Progress
**Right of use
assets
Total
N'000 N'000 N'000 N'000 N'000 N'000 N'000 N'000 N'000 N'000
Accumulated depreciation and impairment losses:
As at 1 January 2018 4,085,324 21,189,359 127,699,454 1,790,640 6,392,191 2,331,167 1,127,259 385,243 15,777,381 - 180,778,018
Charge for the year 239,762 3,386,848 16,219,591 765,515 1,320,964 239,551 95,517 121,235 (4,319) - 22,384,664
On disposals - (5,586) (340,261) - (727,498) (198,980) - (16,821) - - (1,289,146)
Write-offs (27,293) (99,718) (489,648) (87,306) (2,717,520) (145,618) (786,471) (8,449) - - (4,362,023)
Impairment loss - - 498,971 - - - - - 426,236 - 925,207
Effect of movements in
exchange rates
- (280,991) (3,121,094) - (215,098) - - - (4,462) - (3,621,645)
As at 31 December 2018 4,297,793 24,189,912 140,467,013 2,468,849 4,053,039 2,226,120 436,305 481,208 16,194,836 - 194,815,075
Notes to the Consolidated and Separate Financial Statements for the period ended 30 Sept 2019
18
Lafarge Africa Plc
Notes to the Consolidated and Separate Financial Statements for the period ended 30 Sept 2019
Group (cont'd) Leasehold
Land
Buildings Production
Plant
Capitalised
Spares
Furniture Motor
Vehicles
Computer
Equipment
Ancillary
Plant &
Machinery
Construction
Work in
Progress
Total
N'000 N'000 N'000 N'000 N'000 N'000 N'000 N'000 N'000 N'000
As at 1 January 2019 4,297,793 24,189,912 140,467,013 2,468,849 4,053,039 2,226,120 436,305 481,208 16,194,836 - 194,815,075
Arising from deconslidation
of LSAH
- (3,862,972) (44,993,678) - (2,949,104) - - - (59,343) - (51,865,097)
Charge for the year 482,041 2,575,449 12,530,170 238,523 219,503 281,751 - - - 7,414,140 23,741,577
On disposals - - (44,945) - - (94,010) - - - - (138,955)
-
As at 30 Sept 2019 4,779,834 22,902,389 107,958,560 2,707,372 1,323,439 2,413,861 436,305 481,208 16,135,493 7,414,140 166,552,600
Carrying amount
As at 30 Sept 2019 3,026,624 85,248,272 220,544,959 1,799,162 1,879,111 2,064,999 635,214 1,014,491 31,850,678 17,172,899 365,236,408
At 31 December 2018 3,508,665 92,416,173 267,923,547 3,916,994 3,585,917 2,074,076 635,214 1,014,491 19,413,687 - 394,488,764
Company Leasehold
Land
Buildings Production
Plant
Capitalised
Spares
Furniture Motor
Vehicles
Computer
Equipment
Ancillary
Plant &
Machinery
Construction
Expenditure
**Right of use
assets
Total
N'000 N'000 N'000 N'000 N'000 N'000 N'000 N'000 N'000 N'000 N'000
As at 1 January 2018 7,807,567 76,879,834 283,679,139 4,669,582 4,740,108 1,859,937 1,700,125 656,090 21,753,168 - 403,745,550
Capital expenditure - - - - - - - - 10,512,487 - 10,512,487
Construction expenditure
capitalised
- 2,774,466 7,282,876 592,282 26,034 2,084,519 272,634 130,057 (13,162,868) - -
Transfer from Inventory - - 5,362,466 - - - - - - - 5,362,466
Disposals (1,110) (8,967) (131,743) - (477,846) (157,758) - - - - (777,424)
Write-offs - - (472,719) (87,306) (2,465,186) (125,796) (785,110) (6,161) (369,037) - (4,311,315)
- As at 31 December 2018 7,806,457 79,645,333 295,720,019 5,174,558 1,823,110 3,660,902 1,187,649 779,986 18,733,750 - 414,531,764
Cost:
As at 1 January 2019 7,806,457 79,645,333 295,720,019 5,174,558 1,823,110 3,660,902 1,187,649 779,986 18,733,750 23,048,876 437,580,640
Capital expenditure - - - - - - - - 9,569,799 9,569,799
Construction expenditure
capitalised - 879,806 790,843 - 75,756 156,202 - - (1,902,607) 375,491
375,491
Reclassification - - (2,882,472) - - 112,330 - - - (2,770,142)
- As at 30 Sept 2019 7,806,457 80,525,139 293,628,390 5,174,558 1,898,866 3,929,434 1,187,649 779,986 26,400,942 23,424,366 444,755,787
**See note 14.3 for details on right of use assets
19
Lafarge Africa Plc
Notes to the Consolidated and Separate Financial Statements for the period ended 30 Sept 2019
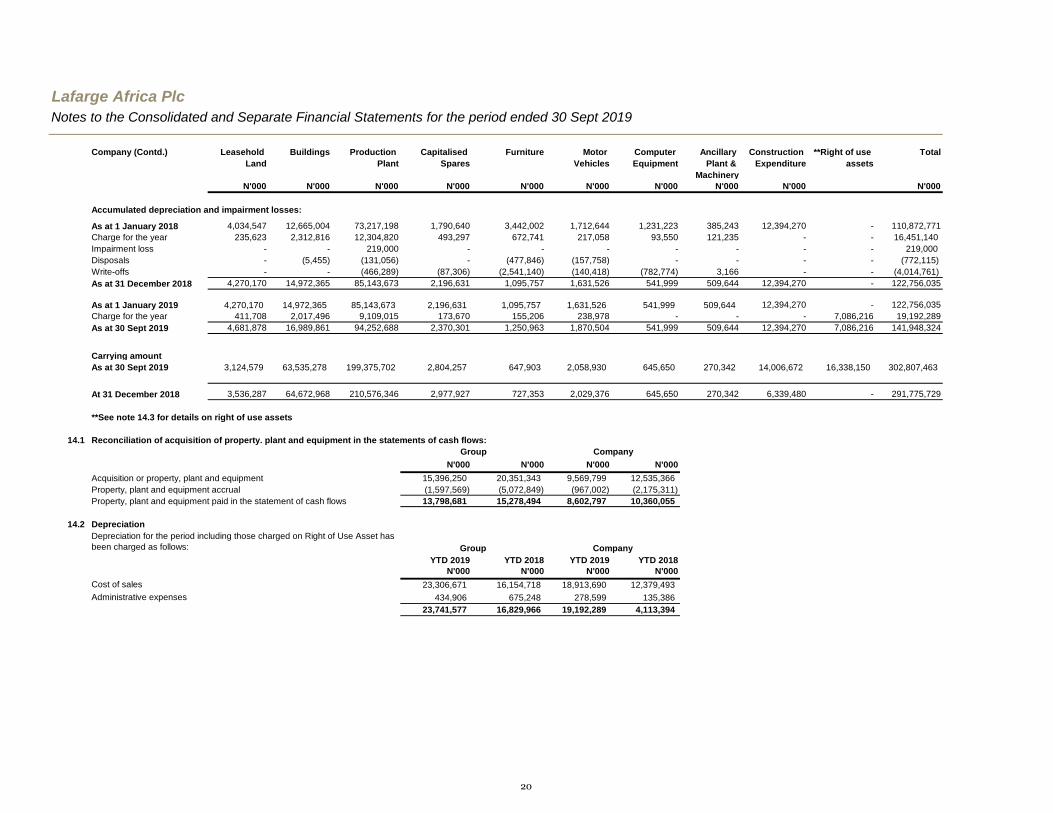
Company (Contd.) Leasehold
Land
Buildings Production
Plant
Capitalised
Spares
Furniture Motor
Vehicles
Computer
Equipment
Ancillary
Plant &
Machinery
Construction
Expenditure
**Right of use
assets
Total
N'000 N'000 N'000 N'000 N'000 N'000 N'000 N'000 N'000 N'000
Accumulated depreciation and impairment losses:
As at 1 January 2018 4,034,547 12,665,004 73,217,198 1,790,640 3,442,002 1,712,644 1,231,223 385,243 12,394,270 - 110,872,771
Charge for the year 235,623 2,312,816 12,304,820 493,297 672,741 217,058 93,550 121,235 - - 16,451,140
Impairment loss - - 219,000 - - - - - - - 219,000
Disposals - (5,455) (131,056) - (477,846) (157,758) - - - - (772,115)
Write-offs - - (466,289) (87,306) (2,541,140) (140,418) (782,774) 3,166 - - (4,014,761)
As at 31 December 2018 4,270,170 14,972,365 85,143,673 2,196,631 1,095,757 1,631,526 541,999 509,644 12,394,270 - 122,756,035
As at 1 January 2019 4,270,170 14,972,365 85,143,673 2,196,631 1,095,757 1,631,526 541,999 509,644 12,394,270 - 122,756,035
Charge for the year 411,708 2,017,496 9,109,015 173,670 155,206 238,978 - - - 7,086,216 19,192,289
As at 30 Sept 2019 4,681,878 16,989,861 94,252,688 2,370,301 1,250,963 1,870,504 541,999 509,644 12,394,270 7,086,216 141,948,324
Carrying amount
As at 30 Sept 2019 3,124,579 63,535,278 199,375,702 2,804,257 647,903 2,058,930 645,650 270,342 14,006,672 16,338,150 302,807,463
At 31 December 2018 3,536,287 64,672,968 210,576,346 2,977,927 727,353 2,029,376 645,650 270,342 6,339,480 - 291,775,729
14.1 Reconciliation of acquisition of property. plant and equipment in the statements of cash flows:
2018 2017 2018 2017N'000 N'000 N'000 N'000
Acquisition or property, plant and equipment 15,396,250 20,351,343 9,569,799 12,535,366
Property, plant and equipment accrual (1,597,569) (5,072,849) (967,002) (2,175,311)
Property, plant and equipment paid in the statement of cash flows 13,798,681 15,278,494 8,602,797 10,360,055
14.2 Depreciation
YTD 2019 YTD 2018 YTD 2019 YTD 2018
N'000 N'000 N'000 N'000
Cost of sales 23,306,671 16,154,718 18,913,690 12,379,493
Administrative expenses 434,906 675,248 278,599 135,386
23,741,577 16,829,966 19,192,289 4,113,394
Group Company
**See note 14.3 for details on right of use assets
Group Company
Depreciation for the period including those charged on Right of Use Asset has
been charged as follows:
20
Lafarge Africa Plc
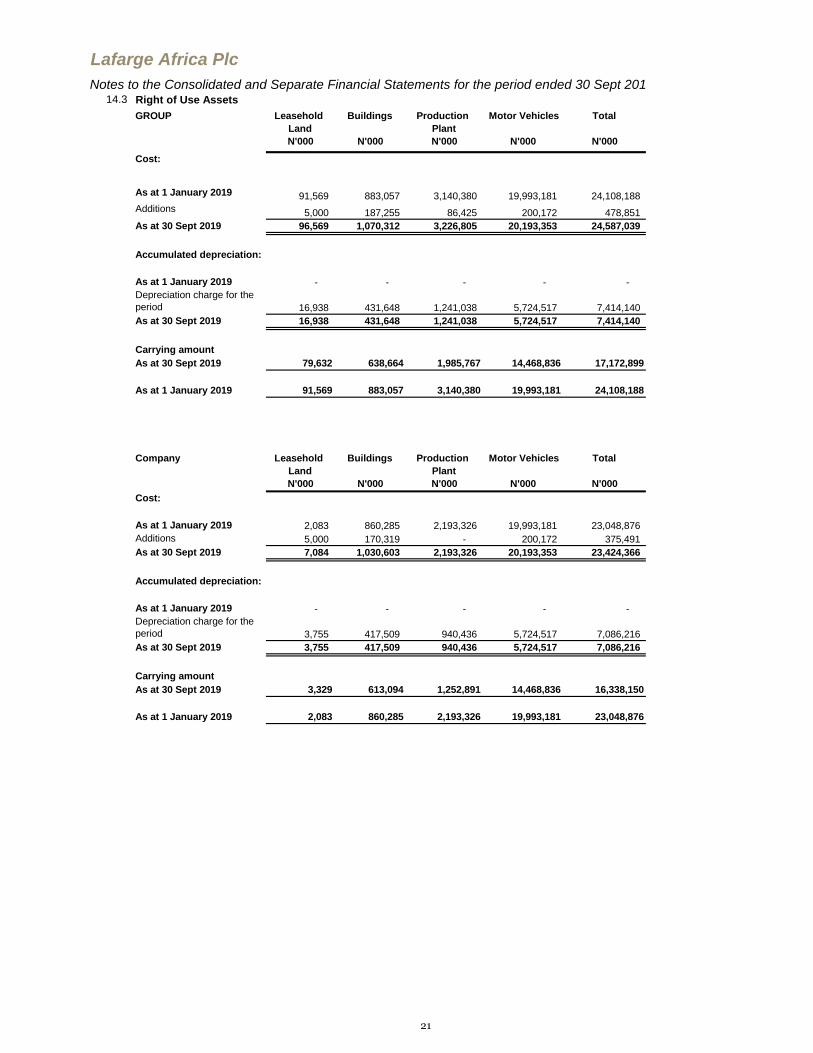
14.3 Right of Use Assets
GROUP Leasehold
Land
Buildings Production
Plant
Motor Vehicles Total
N'000 N'000 N'000 N'000 N'000
Cost:
As at 1 January 2019 91,569 883,057 3,140,380 19,993,181 24,108,188
Additions 5,000 187,255 86,425 200,172 478,851
As at 30 Sept 2019 96,569 1,070,312 3,226,805 20,193,353 24,587,039
Accumulated depreciation:
As at 1 January 2019 - - - - -
Depreciation charge for the
period 16,938 431,648 1,241,038 5,724,517 7,414,140
As at 30 Sept 2019 16,938 431,648 1,241,038 5,724,517 7,414,140
Carrying amount
As at 30 Sept 2019 79,632 638,664 1,985,767 14,468,836 17,172,899
As at 1 January 2019 91,569 883,057 3,140,380 19,993,181 24,108,188
Company Leasehold
Land
Buildings Production
Plant
Motor Vehicles Total
N'000 N'000 N'000 N'000 N'000
Cost:
As at 1 January 2019 2,083 860,285 2,193,326 19,993,181 23,048,876
Additions 5,000 170,319 - 200,172 375,491
As at 30 Sept 2019 7,084 1,030,603 2,193,326 20,193,353 23,424,366
Accumulated depreciation:
As at 1 January 2019 - - - - -
Depreciation charge for the
period 3,755 417,509 940,436 5,724,517 7,086,216
As at 30 Sept 2019 3,755 417,509 940,436 5,724,517 7,086,216
Carrying amount
As at 30 Sept 2019 3,329 613,094 1,252,891 14,468,836 16,338,150
As at 1 January 2019 2,083 860,285 2,193,326 19,993,181 23,048,876
Notes to the Consolidated and Separate Financial Statements for the period ended 30 Sept 2019
21
Lafarge Africa Plc
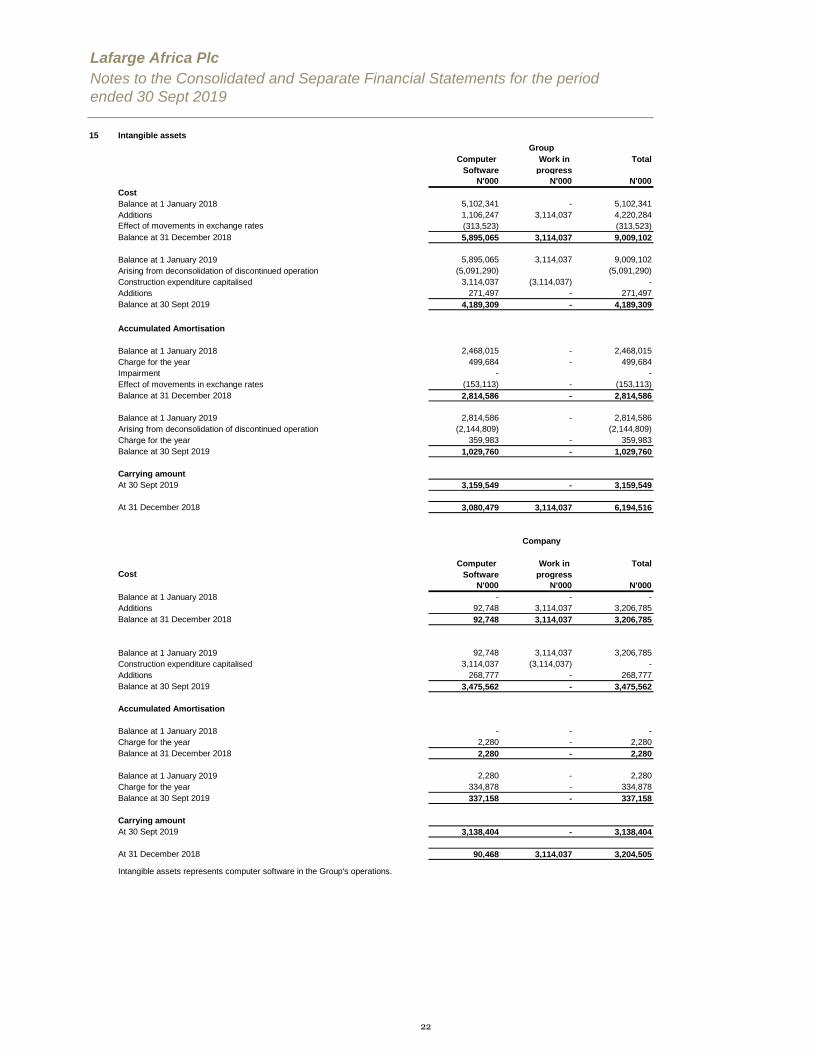
15 Intangible assets
Computer
Software
Work in
progress
Total
N'000 N'000 N'000
Cost
Balance at 1 January 2018 5,102,341 - 5,102,341
Additions 1,106,247 3,114,037 4,220,284
Effect of movements in exchange rates (313,523) (313,523)
Balance at 31 December 2018 5,895,065 3,114,037 9,009,102
Balance at 1 January 2019 5,895,065 3,114,037 9,009,102
Arising from deconsolidation of discontinued operation (5,091,290) (5,091,290)
Construction expenditure capitalised 3,114,037 (3,114,037) -
Additions 271,497 - 271,497
Balance at 30 Sept 2019 4,189,309 - 4,189,309
Accumulated Amortisation
Balance at 1 January 2018 2,468,015 - 2,468,015
Charge for the year 499,684 - 499,684
Impairment - -
Effect of movements in exchange rates (153,113) - (153,113)
Balance at 31 December 2018 2,814,586 - 2,814,586
Balance at 1 January 2019 2,814,586 - 2,814,586
Arising from deconsolidation of discontinued operation (2,144,809) (2,144,809)
Charge for the year 359,983 - 359,983
Balance at 30 Sept 2019 1,029,760 - 1,029,760
Carrying amount
At 30 Sept 2019 3,159,549 - 3,159,549
At 31 December 2018 3,080,479 3,114,037 6,194,516
Cost
Computer
Software
Work in
progress
Total
N'000 N'000 N'000
Balance at 1 January 2018 - - -
Additions 92,748 3,114,037 3,206,785
Balance at 31 December 2018 92,748 3,114,037 3,206,785
Balance at 1 January 2019 92,748 3,114,037 3,206,785
Construction expenditure capitalised 3,114,037 (3,114,037) -
Additions 268,777 - 268,777
Balance at 30 Sept 2019 3,475,562 - 3,475,562
Accumulated Amortisation
Balance at 1 January 2018 - - -
Charge for the year 2,280 - 2,280
Balance at 31 December 2018 2,280 - 2,280
Balance at 1 January 2019 2,280 - 2,280
Charge for the year 334,878 - 334,878
Balance at 30 Sept 2019 337,158 - 337,158
Carrying amount
At 30 Sept 2019 3,138,404 - 3,138,404
At 31 December 2018 90,468 3,114,037 3,204,505
Intangible assets represents computer software in the Group's operations.
Group
Company
Notes to the Consolidated and Separate Financial Statements for the period
ended 30 Sept 2019
22

Lafarge Africa Plc
Notes to the Consolidated and Separate Financial Statements for the period
ended 30 Sept 2019
16 Disposal of investment in Subsidiary
16.1 Group gain on discontinued operation
USD'000 Rate N'000
Proceed from disposal 317,000,000 360.72 114,348,240
Transaction cost on disposal (219,485)
114,128,755
Less:
Net liability of LSAH at July 31, 2019 2,386,768
Non-controlling interest derecognised (305,322)
(9,686,905)
Gain on disposal 106,523,295
16.2 Parent's loss on disposal of subsidiary
N'000
Fair value of consideration received 114,348,240
Transaction cost on disposal (219,485)
Less carrying value of investment disposed of (114,968,018)
Loss on disposal (839,263)
16.3 Net cash inflow/outflow arising on disposal of subsidiary N'000
Proceed from disposal 114,348,240
Related party Loan settlement 114,090,438
Cash consideration received 240,719
other payables offset 17,083 (114,348,240)
-
16.4 Lafarge South Africa Holdings (PTY) Limited One month
ended
31/07/2019
7 months ended
31/07/2019
6 months ended
30/06/2019
Statements of Profit or Loss as of July 31, 2019 N'000 N'000 N'000
Revenue 8,734,284 51,145,309 42,411,025
Cost of sales (7,846,534) (48,972,675) (41,126,141)
Gross Profit 887,749 2,172,633 1,284,884
-
Selling and marketing expenses (458,421) (1,195,466) (737,045)
Administrative expenses (522,495) (6,414,479) (5,891,984)
Other operating expenses (14,195) (75,708) (61,513)
Operating loss (107,362) (5,513,020) (5,405,658)
-
Finance income 76,037 283,607 207,570
Finance costs (192,259) (1,128,184) (935,925)
Share of loss from associates 17,718 (27,430) (45,148)
Loss before tax (205,866) (6,385,027) (6,179,161)
Income tax expense 99,486 (551,703) (651,189)
Loss after tax from discontinued operation (106,379) (6,936,729) (6,830,350)
The Company has compared the proceed of disposal against the carrying value of investment disposed at the date of disposal in order to arrive
at group profit/(loss) on disposal.
On July 31st 2019, the company completed the sale of its investment in South Africa subsidiary, Lafarge SouthAfrica Holdings (LSAH) based
on the approval of Shareholders at the 60th Annual General meeting on July 22, 2019. The investment was sold at US$317,000,000 which was
utilized to settle the entire principal (US$ 293,000,000) and accrued interest to 31st July, 2019 (US$23,289,060.55) on the Inter Company loan
owed to Caricement BV (Purchaser).
The gain on the disposal of the investment was calculated and shown below:
The group has compared the consideration of disposal against the net asset/ (liability) of its subidiary at the date of disposal in order to arrive at
group profit/(loss) on disposal.
Cumulative exchange differences in respect of the net assets/liability of the
subsidiary reclassified from equity on loss of control of subsidiary
23
Lafarge Africa Plc
Notes to the Consolidated and Separate Financial Statements for the period
ended 30 Sept 2019
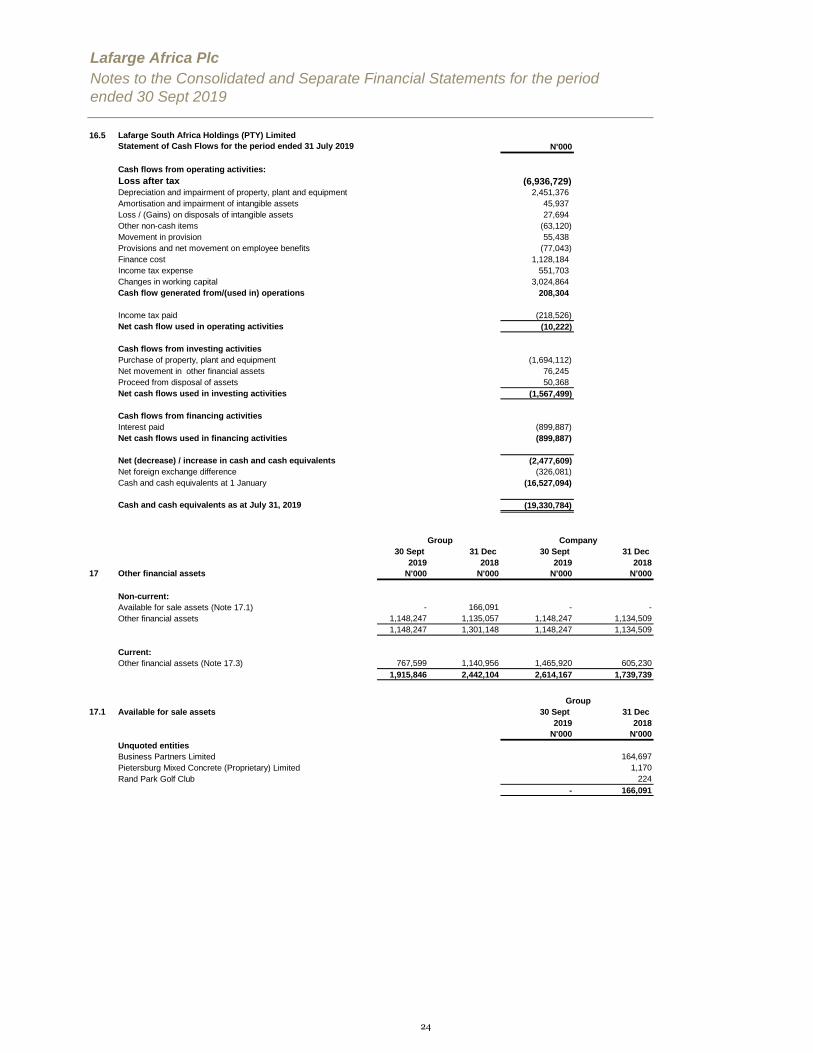
16.5 Lafarge South Africa Holdings (PTY) Limited
Statement of Cash Flows for the period ended 31 July 2019 N'000
Cash flows from operating activities:
Loss after tax (6,936,729) Depreciation and impairment of property, plant and equipment 2,451,376
Amortisation and impairment of intangible assets 45,937
Loss / (Gains) on disposals of intangible assets 27,694
Other non-cash items (63,120)
Movement in provision 55,438
Provisions and net movement on employee benefits (77,043)
Finance cost 1,128,184
Income tax expense 551,703
Changes in working capital 3,024,864
Cash flow generated from/(used in) operations 208,304
Income tax paid (218,526)
Net cash flow used in operating activities (10,222)
Cash flows from investing activities
Purchase of property, plant and equipment (1,694,112)
Net movement in other financial assets 76,245
Proceed from disposal of assets 50,368
Net cash flows used in investing activities (1,567,499)
Cash flows from financing activities
Interest paid (899,887)
Net cash flows used in financing activities (899,887)
Net (decrease) / increase in cash and cash equivalents (2,477,609)
Net foreign exchange difference (326,081)
Cash and cash equivalents at 1 January (16,527,094)
Cash and cash equivalents as at July 31, 2019 (19,330,784)
30 Sept
2019
31 Dec
2018
30 Sept
2019
31 Dec
2018
17 Other financial assets N'000 N'000 N'000 N'000
Non-current:
Available for sale assets (Note 17.1) - 166,091 - -
Other financial assets 1,148,247 1,135,057 1,148,247 1,134,509
1,148,247 1,301,148 1,148,247 1,134,509
Current:
Other financial assets (Note 17.3) 767,599 1,140,956 1,465,920 605,230
1,915,846 2,442,104 2,614,167 1,739,739
17.1 Available for sale assets 30 Sept
2019
31 Dec
2018
N'000 N'000
Unquoted entities
Business Partners Limited 164,697
Pietersburg Mixed Concrete (Proprietary) Limited 1,170
Rand Park Golf Club 224
- 166,091
Group Company
Group
24

Lafarge Africa Plc
Notes to the Consolidated and Separate Financial Statements for the period
ended 30 Sept 2019
17.2.1 Loan to CBI Ghana
17.3.1 Loans to CBI Ghana
18 Derivative financial instruments
Assets Liabilities Assets Liabilities
N'000 N'000 N'000 N'000
Caricement B.V - 164,384 - 244,176
- 164,384 - 244,176
19 Other assets
30 Sept
2019
31 Dec
2018
30 Sept
2019
31 Dec
2018
N'000 N'000 N'000 N'000
Non current 18,977,025 16,671,760 17,389,010 15,073,457
Current 13,739,238 10,594,409 12,302,338 8,661,903
32,716,263 27,266,169 29,691,348 23,735,360
Advance payment to suppliers 9,577,641 2,501,059 8,276,433 1,863,729
Deferred charges (Note 19.1) 9,600 9,600 9,600 9,600
Prepayment for Gas 17,389,010 11,798,702 17,389,010 11,798,702
Rental lease prepayment - 709,244 - -
Prepaid rent 111,601 699,196 - 558,542
Prepaid insurance 1,664,965 317,846 1,641,375 207,883
Prepaid expenses 701,972 1,061,477 701,969 1,041,331
30 Sept
2019
31 Dec
2018
30 Sept
2019
31 Dec
2018
N'000 N'000 N'000 N'000
Advance payment to transporters (Note 19.3) - 3,751,967 - 3,751,967
Advance payment of taxes and levies 325,505 936,676 325,506 936,676
Letters of credit 1,588,015 1,573,750 - -
Long term prepayments - 2,188,022 - 2,188,022
Deposit for imports 540,030 1,378,908 540,030 1,378,908
Other assets 807,927 339,725 807,427 -
32,716,266 27,266,172 29,691,350 23,735,360
30-Sep-19
Company
31-Dec-18
Group Company
This represents the current portion of the USD1.39 million loan granted to CBI, Ghana in October, 2016 for the development of its grinding and
related activities. The loan was given at an interest rate of LIBOR 12 Months + 11% (per annum) and the loan was expected to be repaid within
a period of seven years with a moratorium period of two years commencing on October 6, 2016. The loan has been converted at NAFEX rate
as at 30th September 2019. The interest is repaid monthly.
Group
Included in loan receivable from CBI Ghana is USD1.39 million loan granted by Lafarge Africa Plc to CBI Ghana in October, 2016 for the
development of its grinding and related activities. The loan was given at an interest rate of LIBOR 12Months + 11% (per annum) and the loan is
expected to be repaid within a period of seven years with a moratorium period of two years from draw down date on October 6, 2016. The loan
has been converted at NAFEX rate as at the reporting period.
These are the Group's investments in a number of businesses across South Africa. They are owned and managed by Lafarge South Africa
Holdings. All Group's investment in unquoted equities are classified as available for sale instruments and are carried at cost because their fair
values cannot be measured reliably. There were therefore no gains or losses recognised in other comprehensive income.
The Group/Company's derivative financial instruments arose from Non-deliverable foreign exchange forward (NDF) contracts with commercial
banks that were yet to mature as at reporting date, and includes:
25
Lafarge Africa Plc
Notes to the Consolidated and Separate Financial Statements for the period
ended 30 Sept 2019
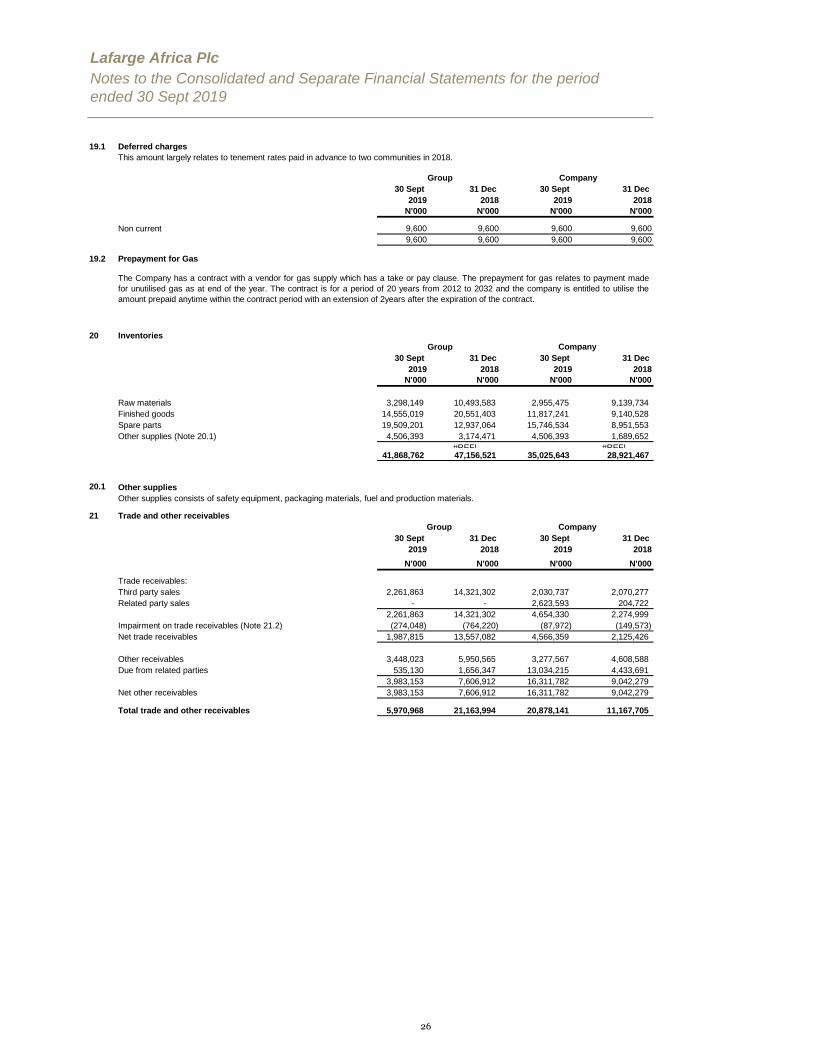
19.1 Deferred charges
30 Sept
2019
31 Dec
2018
30 Sept
2019
31 Dec
2018
N'000 N'000 N'000 N'000
Non current 9,600 9,600 9,600 9,600
9,600 9,600 9,600 9,600
19.2 Prepayment for Gas
20 Inventories
30 Sept
2019
31 Dec
2018
30 Sept
2019
31 Dec
2018
N'000 N'000 N'000 N'000
Raw materials 3,298,149 10,493,583 2,955,475 9,139,734
Finished goods 14,555,019 20,551,403 11,817,241 9,140,528
Spare parts 19,509,201 12,937,064 15,746,534 8,951,553
Other supplies (Note 20.1) 4,506,393 3,174,471 4,506,393 1,689,652
#REF! #REF!41,868,762 47,156,521 35,025,643 28,921,467
20.1 Other supplies
21 Trade and other receivables
30 Sept
2019
31 Dec
2018
30 Sept
2019
31 Dec
2018
N'000 N'000 N'000 N'000
Trade receivables:
Third party sales 2,261,863 14,321,302 2,030,737 2,070,277
Related party sales - - 2,623,593 204,722
2,261,863 14,321,302 4,654,330 2,274,999
Impairment on trade receivables (Note 21.2) (274,048) (764,220) (87,972) (149,573)
Net trade receivables 1,987,815 13,557,082 4,566,359 2,125,426
Other receivables 3,448,023 5,950,565 3,277,567 4,608,588
Due from related parties 535,130 1,656,347 13,034,215 4,433,691
3,983,153 7,606,912 16,311,782 9,042,279
Net other receivables 3,983,153 7,606,912 16,311,782 9,042,279
Total trade and other receivables 5,970,968 21,163,994 20,878,141 11,167,705
Other supplies consists of safety equipment, packaging materials, fuel and production materials.
Group Company
The Company has a contract with a vendor for gas supply which has a take or pay clause. The prepayment for gas relates to payment made
for unutilised gas as at end of the year. The contract is for a period of 20 years from 2012 to 2032 and the company is entitled to utilise the
amount prepaid anytime within the contract period with an extension of 2years after the expiration of the contract.
This amount largely relates to tenement rates paid in advance to two communities in 2018.
Company
Group Company
Group
26
Lafarge Africa Plc
Notes to the Consolidated and Separate Financial Statements for the period
ended 30 Sept 2019
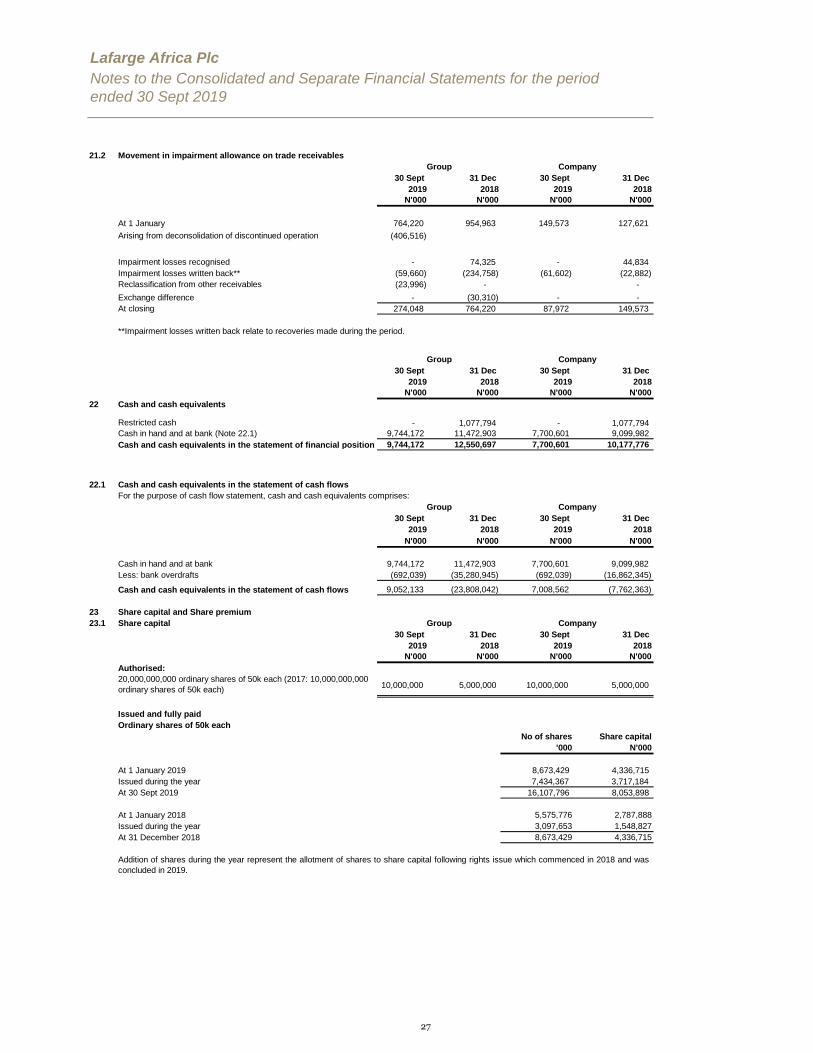
21.2 Movement in impairment allowance on trade receivables
30 Sept
2019
31 Dec
2018
30 Sept
2019
31 Dec
2018
N'000 N'000 N'000 N'000
At 1 January 764,220 954,963 149,573 127,621
Arising from deconsolidation of discontinued operation (406,516)
Impairment losses recognised - 74,325 - 44,834
Impairment losses written back** (59,660) (234,758) (61,602) (22,882)
Reclassification from other receivables (23,996) - -
Exchange difference - (30,310) - -
At closing 274,048 764,220 87,972 149,573
30 Sept
2019
31 Dec
2018
30 Sept
2019
31 Dec
2018
N'000 N'000 N'000 N'000
22 Cash and cash equivalents
Restricted cash - 1,077,794 - 1,077,794
Cash in hand and at bank (Note 22.1) 9,744,172 11,472,903 7,700,601 9,099,982
Cash and cash equivalents in the statement of financial position 9,744,172 12,550,697 7,700,601 10,177,776
22.1 Cash and cash equivalents in the statement of cash flows
For the purpose of cash flow statement, cash and cash equivalents comprises:
30 Sept
2019
31 Dec
2018
30 Sept
2019
31 Dec
2018
N'000 N'000 N'000 N'000
Cash in hand and at bank 9,744,172 11,472,903 7,700,601 9,099,982
Less: bank overdrafts (692,039) (35,280,945) (692,039) (16,862,345)
#REF! #REF!Cash and cash equivalents in the statement of cash flows 9,052,133 (23,808,042) 7,008,562 (7,762,363)
23 Share capital and Share premium
23.1 Share capital
30 Sept
2019
31 Dec
2018
30 Sept
2019
31 Dec
2018
N'000 N'000 N'000 N'000
Authorised:
20,000,000,000 ordinary shares of 50k each (2017: 10,000,000,000
ordinary shares of 50k each) 10,000,000 5,000,000 10,000,000 5,000,000
Issued and fully paid
Ordinary shares of 50k each
No of shares Share capital
'000 N'000
At 1 January 2019 8,673,429 4,336,715
Issued during the year 7,434,367 3,717,184
At 30 Sept 2019 16,107,796 8,053,898
At 1 January 2018 5,575,776 2,787,888
Issued during the year 3,097,653 1,548,827
At 31 December 2018 8,673,429 4,336,715
Group
Group
Company
Company
**Impairment losses written back relate to recoveries made during the period.
Company
Company
Group
Addition of shares during the year represent the allotment of shares to share capital following rights issue which commenced in 2018 and was
concluded in 2019.
Group
27
Lafarge Africa Plc
Notes to the Consolidated and Separate Financial Statements for the period
ended 30 Sept 2019
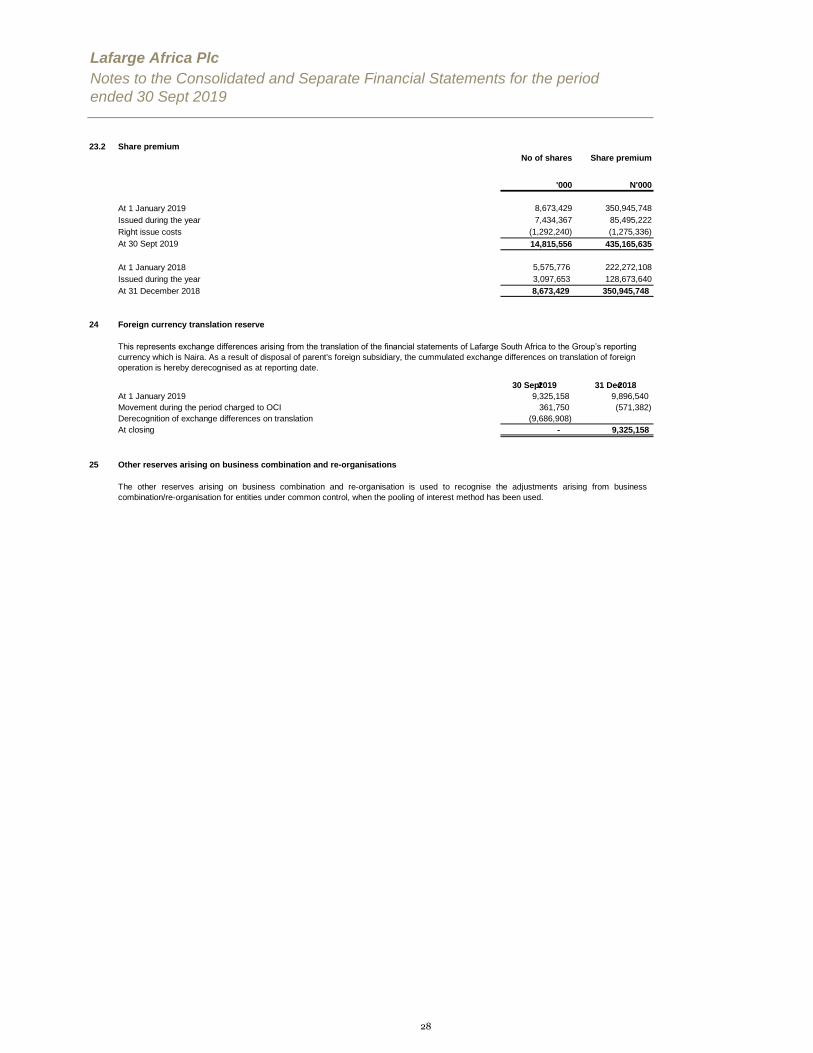
23.2 Share premium
No of shares Share premium
'000 N'000
At 1 January 2019 8,673,429 350,945,748
Issued during the year 7,434,367 85,495,222
Right issue costs (1,292,240) (1,275,336)
At 30 Sept 2019 14,815,556 435,165,635
At 1 January 2018 5,575,776 222,272,108
Issued during the year 3,097,653 128,673,640
At 31 December 2018 8,673,429 350,945,748
24 Foreign currency translation reserve
30 Sept 2019 31 Dec 2018
At 1 January 2019 9,325,158 9,896,540
Movement during the period charged to OCI 361,750 (571,382)
Derecognition of exchange differences on translation (9,686,908)
At closing - 9,325,158
25 Other reserves arising on business combination and re-organisations
The other reserves arising on business combination and re-organisation is used to recognise the adjustments arising from business
combination/re-organisation for entities under common control, when the pooling of interest method has been used.
This represents exchange differences arising from the translation of the financial statements of Lafarge South Africa to the Group’s reporting
currency which is Naira. As a result of disposal of parent's foreign subsidiary, the cummulated exchange differences on translation of foreign
operation is hereby derecognised as at reporting date.
28
Lafarge Africa Plc
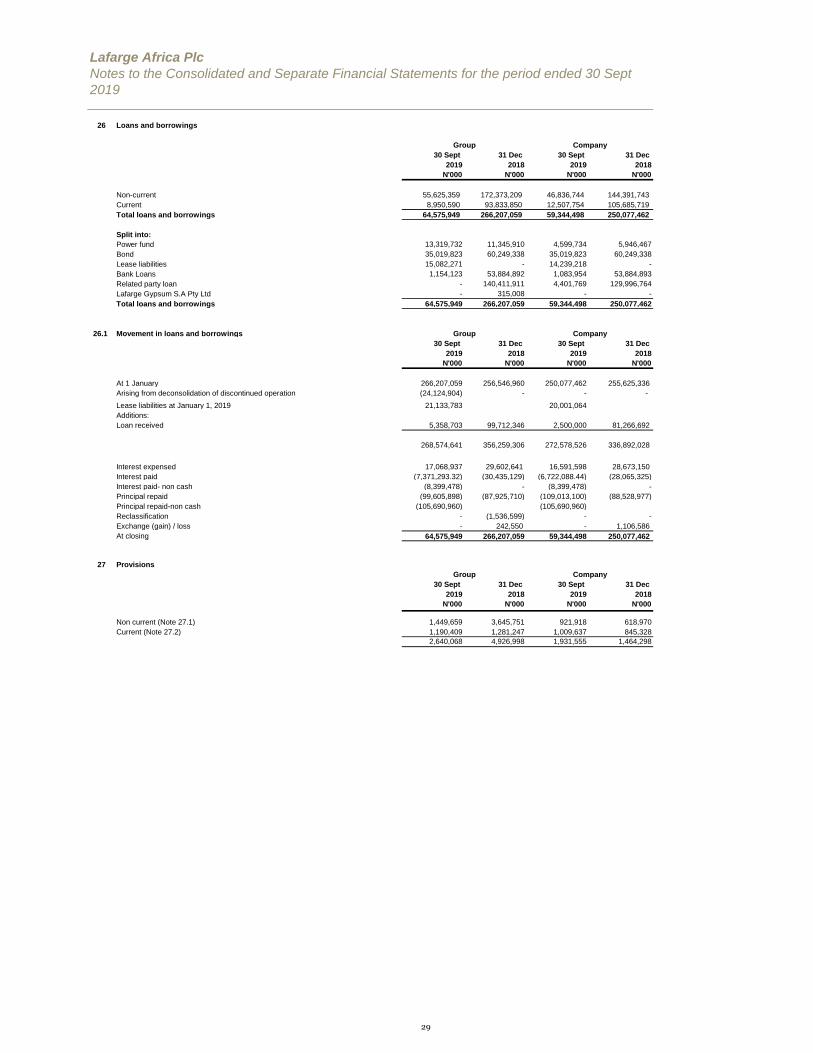
26 Loans and borrowings
30 Sept
2019
31 Dec
2018
30 Sept
2019
31 Dec
2018
N'000 N'000 N'000 N'000
Non-current 55,625,359 172,373,209 46,836,744 144,391,743
Current 8,950,590 93,833,850 12,507,754 105,685,719
Total loans and borrowings 64,575,949 266,207,059 59,344,498 250,077,462
Split into:
Power fund 13,319,732 11,345,910 4,599,734 5,946,467
Bond 35,019,823 60,249,338 35,019,823 60,249,338
Lease liabilities 15,082,271 - 14,239,218 -
Bank Loans 1,154,123 53,884,892 1,083,954 53,884,893
Related party loan - 140,411,911 4,401,769 129,996,764
Lafarge Gypsum S.A Pty Ltd - 315,008 - -
Total loans and borrowings 64,575,949 266,207,059 59,344,498 250,077,462
26.1 Movement in loans and borrowings
30 Sept
2019
31 Dec
2018
30 Sept
2019
31 Dec
2018
N'000 N'000 N'000 N'000
At 1 January 266,207,059 256,546,960 250,077,462 255,625,336
Arising from deconsolidation of discontinued operation (24,124,904) - - -
Lease liabilities at January 1, 2019 21,133,783 20,001,064
Additions:
Loan received 5,358,703 99,712,346 2,500,000 81,266,692
268,574,641 356,259,306 272,578,526 336,892,028
Interest expensed 17,068,937 29,602,641 16,591,598 28,673,150
Interest paid (7,371,293.32) (30,435,129) (6,722,088.44) (28,065,325)
Interest paid- non cash (8,399,478) - (8,399,478) -
Principal repaid (99,605,898) (87,925,710) (109,013,100) (88,528,977)
Principal repaid-non cash (105,690,960) (105,690,960)
Reclassification - (1,536,599) - -
Exchange (gain) / loss - 242,550 - 1,106,586
At closing 64,575,949 266,207,059 59,344,498 250,077,462
27 Provisions
30 Sept
2019
31 Dec
2018
30 Sept
2019
31 Dec
2018
N'000 N'000 N'000 N'000
Non current (Note 27.1) 1,449,659 3,645,751 921,918 618,970
Current (Note 27.2) 1,190,409 1,281,247 1,009,637 845,328
2,640,068 4,926,998 1,931,555 1,464,298
Group Company
Notes to the Consolidated and Separate Financial Statements for the period ended 30 Sept
2019
Group Company
CompanyGroup
29
Lafarge Africa Plc
Notes to the Consolidated and Separate Financial Statements for the period ended 30 Sept
2019
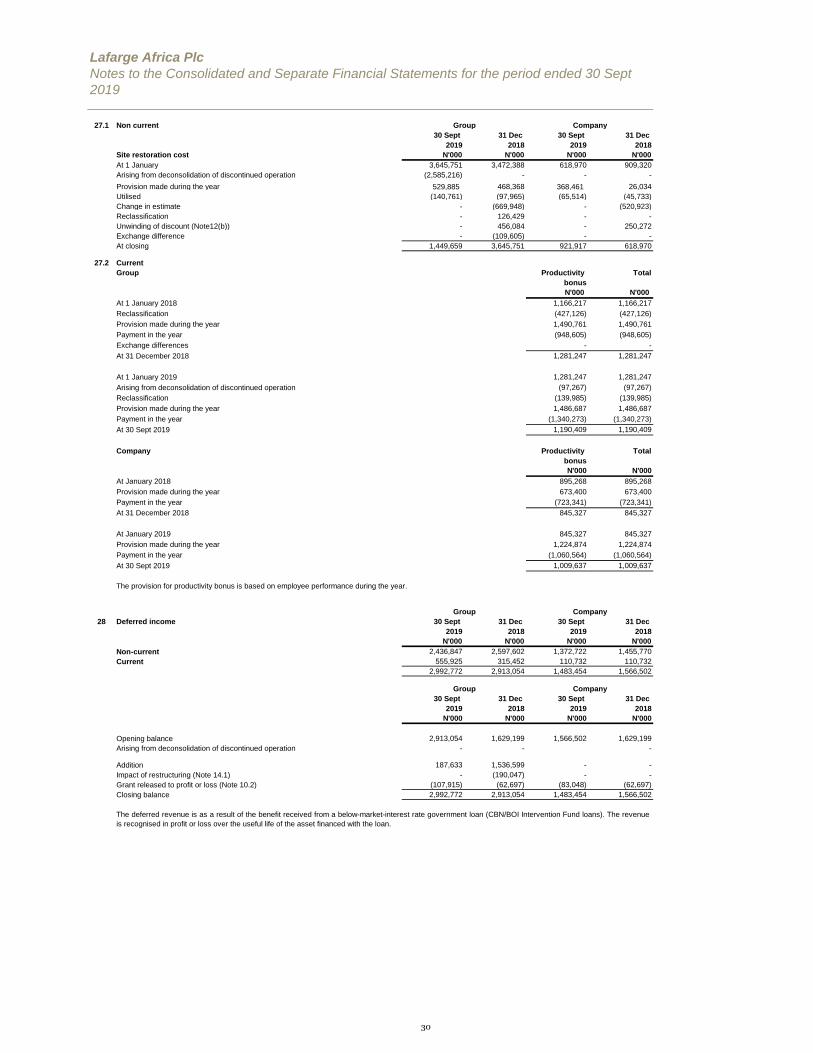
27.1 Non current
30 Sept
2019
31 Dec
2018
30 Sept
2019
31 Dec
2018
Site restoration cost N'000 N'000 N'000 N'000
At 1 January 3,645,751 3,472,388 618,970 909,320
Arising from deconsolidation of discontinued operation (2,585,216) - - -
Provision made during the year 529,885 468,368 368,461 26,034
Utilised (140,761) (97,965) (65,514) (45,733)
Change in estimate - (669,948) - (520,923)
Reclassification - 126,429 - -
Unwinding of discount (Note12(b)) - 456,084 - 250,272
Exchange difference - (109,605) - -
At closing 1,449,659 3,645,751 921,917 618,970
27.2 Current
Group Productivity
bonus
Total
N'000 N'000
At 1 January 2018 1,166,217 1,166,217
Reclassification (427,126) (427,126)
Provision made during the year 1,490,761 1,490,761
Payment in the year (948,605) (948,605)
Exchange differences - -
At 31 December 2018 1,281,247 1,281,247
At 1 January 2019 1,281,247 1,281,247
Arising from deconsolidation of discontinued operation (97,267) (97,267)
Reclassification (139,985) (139,985)
Provision made during the year 1,486,687 1,486,687
Payment in the year (1,340,273) (1,340,273)
At 30 Sept 2019 1,190,409 1,190,409
Company Productivity
bonus
Total
N'000 N'000
At January 2018 895,268 895,268
Provision made during the year 673,400 673,400
Payment in the year (723,341) (723,341)
At 31 December 2018 845,327 845,327
At January 2019 845,327 845,327
Provision made during the year 1,224,874 1,224,874
Payment in the year (1,060,564) (1,060,564)
At 30 Sept 2019 1,009,637 1,009,637
28 Deferred income 30 Sept
2019
31 Dec
2018
30 Sept
2019
31 Dec
2018
N'000 N'000 N'000 N'000
Non-current 2,436,847 2,597,602 1,372,722 1,455,770
Current 555,925 315,452 110,732 110,732
2,992,772 2,913,054 1,483,454 1,566,502
30 Sept
2019
31 Dec
2018
30 Sept
2019
31 Dec
2018
N'000 N'000 N'000 N'000
Opening balance 2,913,054 1,629,199 1,566,502 1,629,199
Arising from deconsolidation of discontinued operation - - -
Addition 187,633 1,536,599 - -
Impact of restructuring (Note 14.1) - (190,047) - -
Grant released to profit or loss (Note 10.2) (107,915) (62,697) (83,048) (62,697)
Closing balance 2,992,772 2,913,054 1,483,454 1,566,502
The deferred revenue is as a result of the benefit received from a below-market-interest rate government loan (CBN/BOI Intervention Fund loans). The revenue
is recognised in profit or loss over the useful life of the asset financed with the loan.
The provision for productivity bonus is based on employee performance during the year.
Company
Company
Group Company
Group
Group
30
Lafarge Africa Plc
Notes to the Consolidated and Separate Financial Statements for the period ended 30 Sept
2019
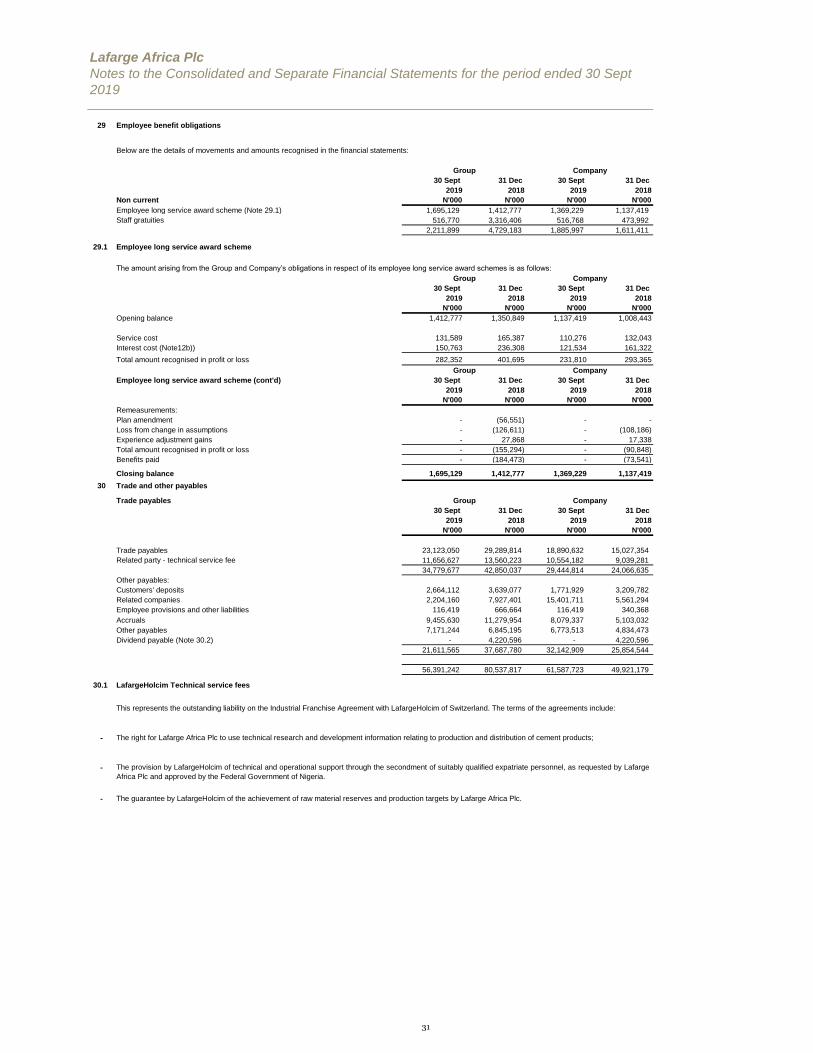
29 Employee benefit obligations
30 Sept
2019
31 Dec
2018
30 Sept
2019
31 Dec
2018
Non current N'000 N'000 N'000 N'000
Employee long service award scheme (Note 29.1) 1,695,129 1,412,777 1,369,229 1,137,419
Staff gratuities 516,770 3,316,406 516,768 473,992
2,211,899 4,729,183 1,885,997 1,611,411
29.1 Employee long service award scheme
30 Sept
2019
31 Dec
2018
30 Sept
2019
31 Dec
2018
N'000 N'000 N'000 N'000
Opening balance 1,412,777 1,350,849 1,137,419 1,008,443
Service cost 131,589 165,387 110,276 132,043
Interest cost (Note12b)) 150,763 236,308 121,534 161,322
Total amount recognised in profit or loss 282,352 401,695 231,810 293,365
Employee long service award scheme (cont'd) 30 Sept
2019
31 Dec
2018
30 Sept
2019
31 Dec
2018
N'000 N'000 N'000 N'000
Remeasurements:
Plan amendment - (56,551) - -
Loss from change in assumptions - (126,611) - (108,186)
Experience adjustment gains - 27,868 - 17,338
Total amount recognised in profit or loss - (155,294) - (90,848)
Benefits paid - (184,473) - (73,541)
Closing balance 1,695,129 1,412,777 1,369,229 1,137,419
30 Trade and other payables
Trade payables
30 Sept
2019
31 Dec
2018
30 Sept
2019
31 Dec
2018
N'000 N'000 N'000 N'000
Trade payables 23,123,050 29,289,814 18,890,632 15,027,354
Related party - technical service fee 11,656,627 13,560,223 10,554,182 9,039,281
34,779,677 42,850,037 29,444,814 24,066,635
Other payables:
Customers' deposits 2,664,112 3,639,077 1,771,929 3,209,782
Related companies 2,204,160 7,927,401 15,401,711 5,561,294
Employee provisions and other liabilities 116,419 666,664 116,419 340,368
Accruals 9,455,630 11,279,954 8,079,337 5,103,032
Other payables 7,171,244 6,845,195 6,773,513 4,834,473
Dividend payable (Note 30.2) - 4,220,596 - 4,220,596
21,611,565 37,687,780 32,142,909 25,854,544
56,391,242 80,537,817 61,587,723 49,921,179
30.1 LafargeHolcim Technical service fees
-
-
-
Below are the details of movements and amounts recognised in the financial statements:
The amount arising from the Group and Company’s obligations in respect of its employee long service award schemes is as follows:
Company
Group Company
The guarantee by LafargeHolcim of the achievement of raw material reserves and production targets by Lafarge Africa Plc.
The provision by LafargeHolcim of technical and operational support through the secondment of suitably qualified expatriate personnel, as requested by Lafarge
Africa Plc and approved by the Federal Government of Nigeria.
This represents the outstanding liability on the Industrial Franchise Agreement with LafargeHolcim of Switzerland. The terms of the agreements include:
Group Company
The right for Lafarge Africa Plc to use technical research and development information relating to production and distribution of cement products;
Group Company
Group
31
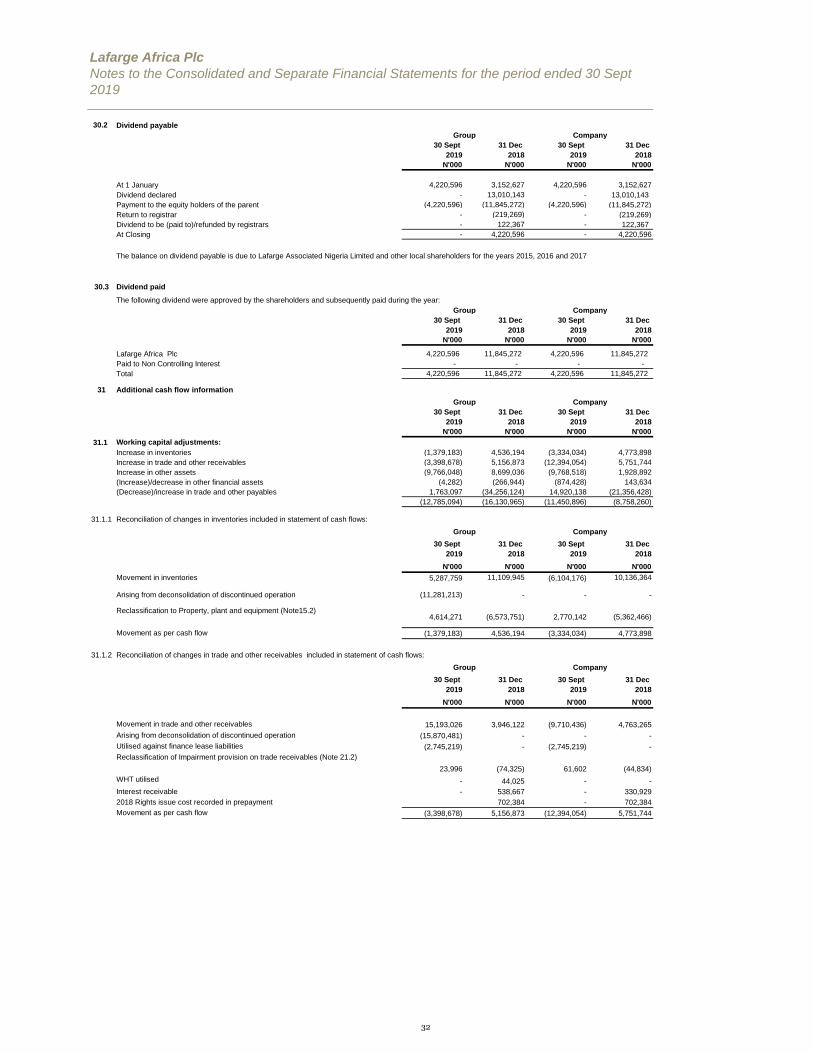
Lafarge Africa Plc
Notes to the Consolidated and Separate Financial Statements for the period ended 30 Sept
2019
30.2 Dividend payable
30 Sept
2019
31 Dec
2018
30 Sept
2019
31 Dec
2018
N'000 N'000 N'000 N'000
At 1 January 4,220,596 3,152,627 4,220,596 3,152,627
Dividend declared - 13,010,143 - 13,010,143
Payment to the equity holders of the parent (4,220,596) (11,845,272) (4,220,596) (11,845,272)
Return to registrar - (219,269) - (219,269)
Dividend to be (paid to)/refunded by registrars - 122,367 - 122,367
At Closing - 4,220,596 - 4,220,596
30.3 Dividend paid
30 Sept
2019
31 Dec
2018
30 Sept
2019
31 Dec
2018
N'000 N'000 N'000 N'000
Lafarge Africa Plc 4,220,596 11,845,272 4,220,596 11,845,272
Paid to Non Controlling Interest - - - -
Total 4,220,596 11,845,272 4,220,596 11,845,272
31 Additional cash flow information
30 Sept
2019
31 Dec
2018
30 Sept
2019
31 Dec
2018
N'000 N'000 N'000 N'000
31.1 Working capital adjustments:
Increase in inventories (1,379,183) 4,536,194 (3,334,034) 4,773,898
Increase in trade and other receivables (3,398,678) 5,156,873 (12,394,054) 5,751,744
Increase in other assets (9,766,048) 8,699,036 (9,768,518) 1,928,892
(Increase)/decrease in other financial assets (4,282) (266,944) (874,428) 143,634
(Decrease)/increase in trade and other payables 1,763,097 (34,256,124) 14,920,138 (21,356,428)
(12,785,094) (16,130,965) (11,450,896) (8,758,260)
31.1.1 Reconciliation of changes in inventories included in statement of cash flows:
30 Sept
2019
31 Dec
2018
30 Sept
2019
31 Dec
2018
N'000 N'000 N'000 N'000
Movement in inventories 5,287,759 11,109,945 (6,104,176) 10,136,364
Arising from deconsolidation of discontinued operation (11,281,213) - - -
Reclassification to Property, plant and equipment (Note15.2) 4,614,271 (6,573,751) 2,770,142 (5,362,466)
Movement as per cash flow (1,379,183) 4,536,194 (3,334,034) 4,773,898
31.1.2 Reconciliation of changes in trade and other receivables included in statement of cash flows:
30 Sept
2019
31 Dec
2018
30 Sept
2019
31 Dec
2018
N'000 N'000 N'000 N'000
Movement in trade and other receivables 15,193,026 3,946,122 (9,710,436) 4,763,265
Arising from deconsolidation of discontinued operation (15,870,481) - - -
Utilised against finance lease liabilities (2,745,219) - (2,745,219) -
Reclassification of Impairment provision on trade receivables (Note 21.2)
23,996 (74,325) 61,602 (44,834)
WHT utilised - 44,025 - -
Interest receivable - 538,667 - 330,929
2018 Rights issue cost recorded in prepayment 702,384 - 702,384
Movement as per cash flow (3,398,678) 5,156,873 (12,394,054) 5,751,744
Group Company
Group
Group Company
Company
The following dividend were approved by the shareholders and subsequently paid during the year:
The balance on dividend payable is due to Lafarge Associated Nigeria Limited and other local shareholders for the years 2015, 2016 and 2017
Group Company
Group Company
32
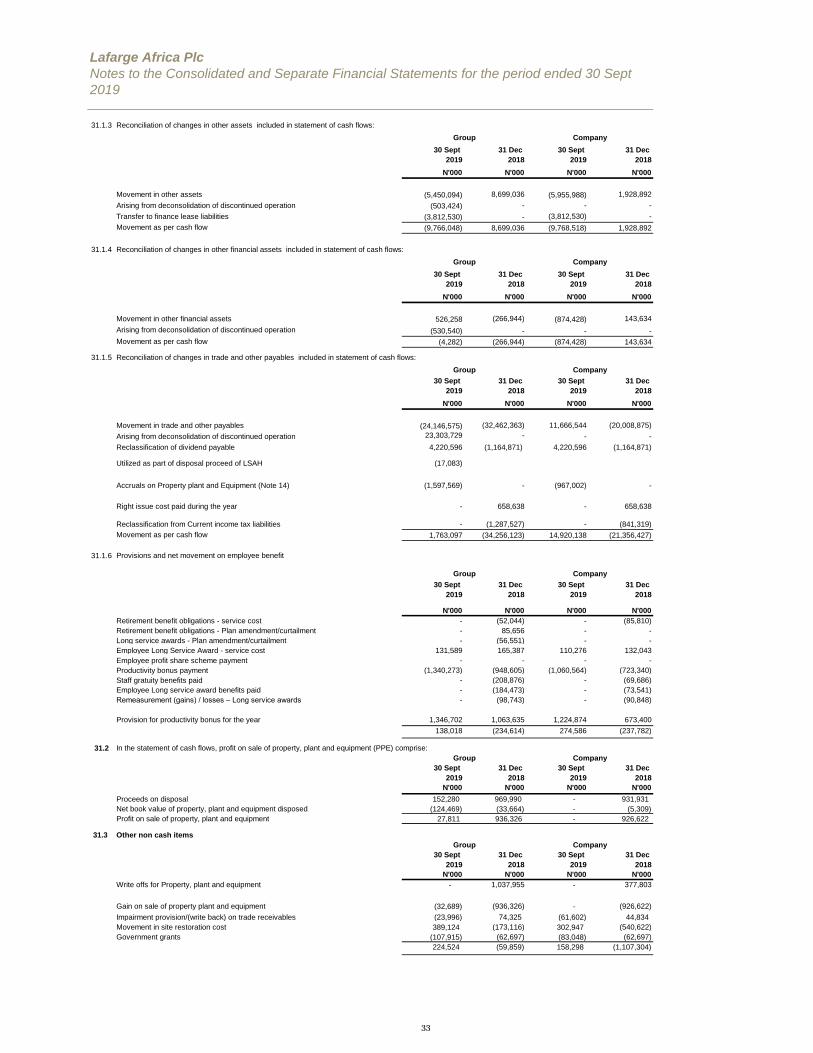
Lafarge Africa Plc
Notes to the Consolidated and Separate Financial Statements for the period ended 30 Sept
2019
31.1.3 Reconciliation of changes in other assets included in statement of cash flows:
30 Sept
2019
31 Dec
2018
30 Sept
2019
31 Dec
2018
N'000 N'000 N'000 N'000
Movement in other assets (5,450,094) 8,699,036 (5,955,988) 1,928,892
Arising from deconsolidation of discontinued operation (503,424) - - -
Transfer to finance lease liabilities (3,812,530) - (3,812,530) -
Movement as per cash flow (9,766,048) 8,699,036 (9,768,518) 1,928,892
31.1.4 Reconciliation of changes in other financial assets included in statement of cash flows:
30 Sept
2019
31 Dec
2018
30 Sept
2019
31 Dec
2018
N'000 N'000 N'000 N'000
Movement in other financial assets 526,258 (266,944) (874,428) 143,634
Arising from deconsolidation of discontinued operation (530,540) - - -
Movement as per cash flow (4,282) (266,944) (874,428) 143,634
31.1.5 Reconciliation of changes in trade and other payables included in statement of cash flows:
30 Sept
2019
31 Dec
2018
30 Sept
2019
31 Dec
2018
N'000 N'000 N'000 N'000
Movement in trade and other payables (24,146,575) (32,462,363) 11,666,544 (20,008,875)
Arising from deconsolidation of discontinued operation 23,303,729 - - -
Reclassification of dividend payable 4,220,596 (1,164,871) 4,220,596 (1,164,871)
Utilized as part of disposal proceed of LSAH (17,083)
Accruals on Property plant and Equipment (Note 14) (1,597,569) - (967,002) -
Right issue cost paid during the year - 658,638 - 658,638
Reclassification from Current income tax liabilities - (1,287,527) - (841,319)
Movement as per cash flow 1,763,097 (34,256,123) 14,920,138 (21,356,427)
31.1.6 Provisions and net movement on employee benefit
30 Sept
2019
31 Dec
2018
30 Sept
2019
31 Dec
2018
N'000 N'000 N'000 N'000
Retirement benefit obligations - service cost - (52,044) - (85,810)
Retirement benefit obligations - Plan amendment/curtailment - 85,656 - -
Long service awards - Plan amendment/curtailment - (56,551) - -
Employee Long Service Award - service cost 131,589 165,387 110,276 132,043
Employee profit share scheme payment - - - -
Productivity bonus payment (1,340,273) (948,605) (1,060,564) (723,340)
Staff gratuity benefits paid - (208,876) - (69,686)
Employee Long service award benefits paid - (184,473) - (73,541)
Remeasurement (gains) / losses – Long service awards - (98,743) - (90,848)
Provision for productivity bonus for the year 1,346,702 1,063,635 1,224,874 673,400
138,018 (234,614) 274,586 (237,782)
31.2
30 Sept
2019
31 Dec
2018
30 Sept
2019
31 Dec
2018
N'000 N'000 N'000 N'000
Proceeds on disposal 152,280 969,990 - 931,931
Net book value of property, plant and equipment disposed (124,469) (33,664) - (5,309)
Profit on sale of property, plant and equipment 27,811 936,326 - 926,622
31.3 Other non cash items
30 Sept
2019
31 Dec
2018
30 Sept
2019
31 Dec
2018
N'000 N'000 N'000 N'000
Write offs for Property, plant and equipment - 1,037,955 - 377,803
Gain on sale of property plant and equipment (32,689) (936,326) - (926,622)
Impairment provision/(write back) on trade receivables (23,996) 74,325 (61,602) 44,834
Movement in site restoration cost 389,124 (173,116) 302,947 (540,622)
Government grants (107,915) (62,697) (83,048) (62,697)
224,524 (59,859) 158,298 (1,107,304)
Group Company
Group Company
Group Company
Group
In the statement of cash flows, profit on sale of property, plant and equipment (PPE) comprise:
Company
Group Company
Group Company
33