LabVIEW Program - EDGEedge.rit.edu/edge/P13051/public/MSD II Documentation/LabVIEW... · 1....
14
LabVIEW Program Pressure Sensing and Reading Functional Overview And Conversion Procedure Manual For use with developing future iterations of MSD Project P13051
Transcript of LabVIEW Program - EDGEedge.rit.edu/edge/P13051/public/MSD II Documentation/LabVIEW... · 1....

LabVIEW Program
Pressure Sensing and Reading
Functional Overview
And
Conversion Procedure
Manual
For use with developing future iterations of MSD Project P13051
Table of Contents 1. Functional Overview ............................................................................................................................. 3
1.1. Front End ............................................................................................................................................ 3
1.2. Back End ............................................................................................................................................. 7
1.3. Hardware Interface ............................................................................................................................ 8
2. Conversion Procedure ......................................................................................................................... 10
2.1. Opening the Program for Edit .......................................................................................................... 10
2.2. Assigning Scan Buttons to Outlets ................................................................................................... 10
2.3. Defining Scan Lists for Each Outlet .................................................................................................. 12
2.4. Defining the Update Lists for Each Outlet ....................................................................................... 13

1. Functional Overview The LabVIEW program used for this project is designed to allow the experiment operator to monitor pressure at different outlets in the lung model. Doing so allows for the operator to adjust the system pressure accordingly to accurately replicate the conditions of a human lung. The program is comprised of three major components: the front end, back end, and hardware interface.
LabVIEW Back End
User RequestFront End Scan LogicUpdate Configs.
Scan Configs
I/O Definitions(DAQ Device)
Pressure Sensors
1.1. Front End The front end of the program is where the experiment operator obtains pressure readings. The
interface is presented as a simplified map of the lung model, displaying the branches and outlets.
The map is presented such that the operator may quickly identify an outlet’s generation number,
neighboring outlets, and the outlet’s general position on the model itself.
There are presently two front-end interfaces; the front end changes depending on which version
of the LabVIEW program (17-outlet or 81-outlet model) is being run. While the basic concept of the
lung map remains the same for both, they are presented slightly differently due to the number of
outlets being monitored. The 17-outlet model can be presented entirely in the interface window
and thus looks like a binary tree map.

Given the 81-outlet model’s large quantity of outlets, the lung map is arranged slightly
differently. First, the outlets are no longer numbered 1, 2, 3, etc.; instead, the outlets are grouped
into six regions and numbered based on those regions (e.g. A3, E16, etc.). The second major change
is that the map is no longer spread out horizontally, but rather vertically. This was done so that the
user only needs to scroll up and down to find an outlet. These maps also have an image of each
portion of the lung model that comprises each region, complete with outlet labels. Lastly, each
region has been color coded to help quickly identify which outlets belong to each region.
A-7
A-8
A-6
A-5
A-2
A-3
A-4
A-1
Region A

B-1
B-2
B-4
B-9
B-8
B-6
B-5
B-7
B-3
Region B
C-1
C-2
C-3
C-4
C-5
C-6
C-7
C-8
C-9
C-10
C-15
C-16
C-11
C-12
C-13
C-14
Region C

D-1
D-2
D-3
D-4
D-5
D-6
D-7
D-8
D-9
D-10
D-15
D-16
D-11
D-12
D-13
D-14
Region D
E-1
E-2
E-3
E-4
E-13
E-14
E-9
E-10
E-5
E-6
E-7
E-8
E-11
E-12
E-15
E-16
Region E
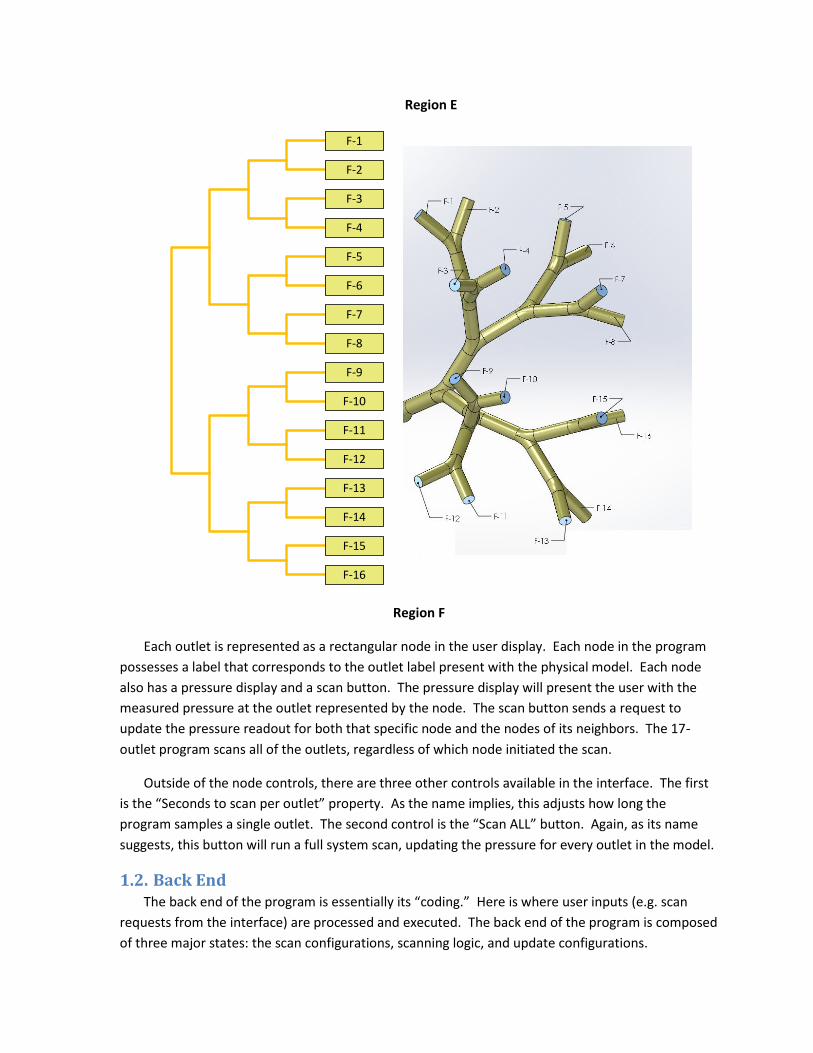
F-1
F-2
F-3
F-4
F-5
F-6
F-7
F-8
F-9
F-10
F-11
F-12
F-13
F-14
F-15
F-16
Region F
Each outlet is represented as a rectangular node in the user display. Each node in the program
possesses a label that corresponds to the outlet label present with the physical model. Each node
also has a pressure display and a scan button. The pressure display will present the user with the
measured pressure at the outlet represented by the node. The scan button sends a request to
update the pressure readout for both that specific node and the nodes of its neighbors. The 17-
outlet program scans all of the outlets, regardless of which node initiated the scan.
Outside of the node controls, there are three other controls available in the interface. The first
is the “Seconds to scan per outlet” property. As the name implies, this adjusts how long the
program samples a single outlet. The second control is the “Scan ALL” button. Again, as its name
suggests, this button will run a full system scan, updating the pressure for every outlet in the model.
1.2. Back End The back end of the program is essentially its “coding.” Here is where user inputs (e.g. scan
requests from the interface) are processed and executed. The back end of the program is composed
of three major states: the scan configurations, scanning logic, and update configurations.

When the pressure is changed at one outlet in the model, it is likely that the pressure will
partially affect its neighboring outlet(s). Thus, when we want to update an outlet of interest, it is
beneficial to update those affected neighbor outlets too. This is the purpose behind the Scan
Configurations block. Each outlet’s node has a list of its neighbor nodes most likely to change along
with it. When a user clicks a node’s scan button, the back end chooses that outlet node’s list of
neighbors and forwards that list to the scanning logic to begin sampling outlet pressures.
Essentially, this block configures the next stage in the data processing chain, thus its name.
Once a list of outlets is provided for scanning, the program then proceeds to obtain pressure
readings for those outlets. The scanning logic accomplishes this task by scanning one outlet at a
time. First, an input from the DAQ device is sampled for a user-defined amount of time (determined
by the “Seconds to scan per outlet” parameter from the front end). Once the allotted scan time is
over, the voltage samples acquired from the DAQ are processed and a mean value is calculated. The
voltage is then converted to a pressure. Once this value is obtained, the process will continue to
repeat until all outlets in the list have been scanned.
Once the updated pressure values have been calculated, they are passed on to the final stage,
the update configurations block. All that this block does is take the same list of inputs from the first
stage along with the updated pressures and updates the front end pressure readouts for the
experiment operator to see.
1.3. Hardware Interface The hardware interface is an analog-to-digital conversion (ADC) interface in which analog
voltages from the pressure sensors are digitized and sent to the LabVIEW program. For this project,
the interface is a National Instruments Digital Acquisition device, or DAQ. The DAQ connects to the
PC via USB port and is wired directly to the pressure sensors’ output. When connecting sensors to
the DAQ, it is important to keep track of which outlet sensor is connected to which DAQ input, since
the program’s functionality depends on proper arrangement to display the correct pressures at the
right location on the lung map. Use the tables below to keep track of which outlet corresponds to
which input (e.g. Outlet A1 = ai 0 on DAQ).

Table 1: 17-Outlet Model Sensor Map
Lung Model Outlet DAQ Input Pin
1
2
3
4
5
6
7
8
9
10
11
12
13
14
15
16
17
Table 2: 81-Outlet Model Sensor Map
Sensor # Lung Region
A B C D E F
1
2
3
4
5
6
7
8
9
10
11
12
13
14
15
16

2. Conversion Procedure Note: The LabVIEW programs were created using LabVIEW 2011. It is recommended to continue using
this version of LabVIEW in order to avoid compatibility issues that may arise from using multiple
versions of LabVIEW on a single program.
Note: The wiring arrangement for outlet pressure sensors to the DAQ inputs should be known
beforehand and recorded, therefore the sensor maps (Tables 1 and 2 above) should be filled out.
2.1. Opening the Program for Edit 1. In order to edit the LabVIEW program, first open the program that you want modified (17-
outlet model is ‘PIV Main Code.vi’ and the program for the 81 outlet model is ‘PIV Main Code
81.vi.’
2. Once this has been done, you will be presented with the User Interface (UI). To open the back
end block diagram, use the keyboard shortcut: Ctrl+t
This will bring up the block diagram’s window.
2.2. Assigning Scan Buttons to Outlets Each outlet has a scan button assigned to it. Pressing this button triggers the scan process that
updates the pressure readouts displayed on the front-end UI. The buttons have already been
created, but they have not been assigned to their specific outlets yet since the sensor-to-DAQ wiring
arrangement is currently unknown for future iterations of the project.
1. Find the green Boolean logic blocks in the back-end’s block diagram. Each outlet has one,
labeled ai0 through ai80.
1. There is one additional Boolean block for ‘Scan All’, making a total of 82 Boolean
values
2. Double click the Boolean object that you want to assign to an outlet. You will be shown the
‘Scan’ button that corresponds with that Boolean on the front-end UI.
Boolean Logic Block (Left) and Front End Scan Button w/ Display (Right)

3. Once you have the appropriate ‘Scan’ button identified in the UI, drag that button and its
pressure display (which should be located next to the button) over to its appropriate
position on the lung map, based on what has been filled out in Tables 1 and 2. Rename the
display label from “ai x” to its outlet name.
Before Placing Button and Display
After Placing Button and Display
The diagrams above show the process of placing the displays and scan buttons for outlet B-
5, assuming that the outlet is connected to DAQ input “ai 33.”
4. Repeat these steps for the remaining outlet assignments
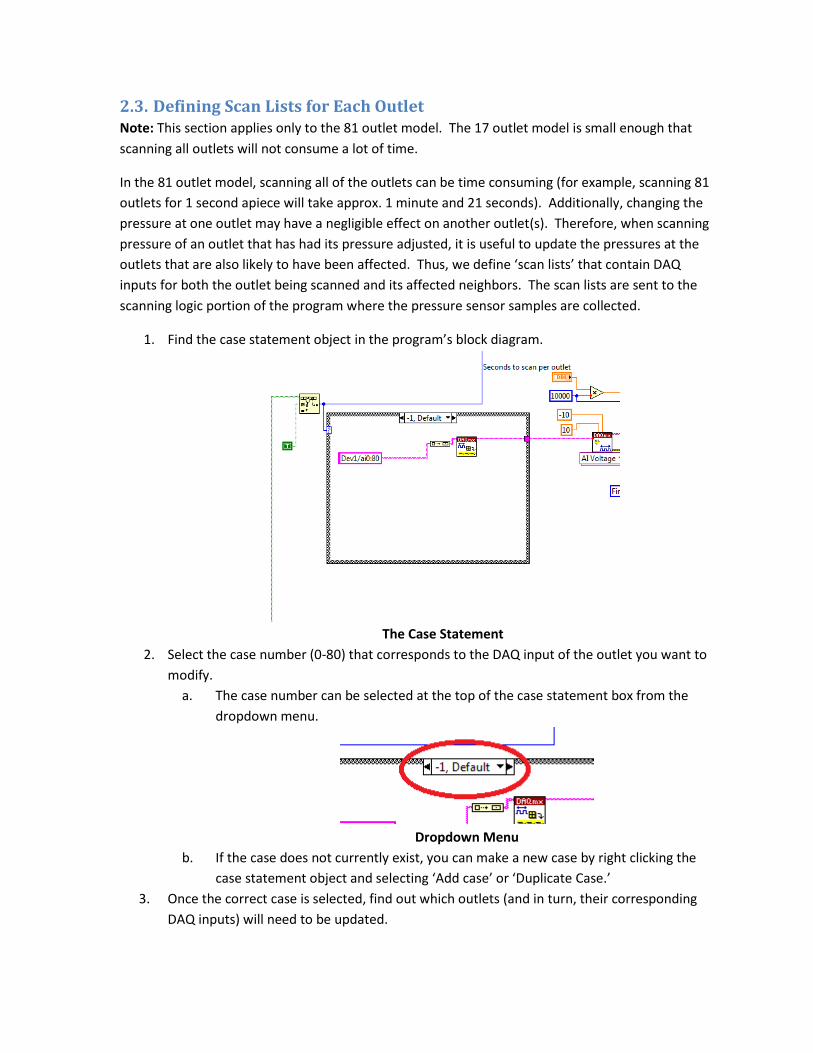
2.3. Defining Scan Lists for Each Outlet Note: This section applies only to the 81 outlet model. The 17 outlet model is small enough that
scanning all outlets will not consume a lot of time.
In the 81 outlet model, scanning all of the outlets can be time consuming (for example, scanning 81
outlets for 1 second apiece will take approx. 1 minute and 21 seconds). Additionally, changing the
pressure at one outlet may have a negligible effect on another outlet(s). Therefore, when scanning
pressure of an outlet that has had its pressure adjusted, it is useful to update the pressures at the
outlets that are also likely to have been affected. Thus, we define ‘scan lists’ that contain DAQ
inputs for both the outlet being scanned and its affected neighbors. The scan lists are sent to the
scanning logic portion of the program where the pressure sensor samples are collected.
1. Find the case statement object in the program’s block diagram.
The Case Statement
2. Select the case number (0-80) that corresponds to the DAQ input of the outlet you want to
modify.
a. The case number can be selected at the top of the case statement box from the
dropdown menu.
Dropdown Menu
b. If the case does not currently exist, you can make a new case by right clicking the
case statement object and selecting ‘Add case’ or ‘Duplicate Case.’
3. Once the correct case is selected, find out which outlets (and in turn, their corresponding
DAQ inputs) will need to be updated.

4. Define the list from step three in the program by setting up a list of strings that identify the
DAQ device(s) and inputs.
a. If a consecutive group of inputs are being updated, you can save time by naming the
string in the format “Devn/aix:y” (minus the quotes) where n is the device number,
x is the lower end of the input range, and y is the upper limit of the input range.
Ex: DAQ inputs ai 4, ai 5, ai 6, and ai 7 for device 1 are all going to be updated, so
you can name the string “Dev1/ai4:7” instead of creating multiple string where each
one is dedicated to a single input.
Input Strings
The image above shows an example scan list for scan outlet 31. Take note of the
following as they may be useful to know for the actual setup:
a) Case number 31 is selected, meaning this list is executed when the scan
button corresponding to input 31 (ai 31) is pressed.
b) The top string lists multiple DAQ inputs to save room.
c) The inputs may be read from multiple DAQ devices. The third input string
specifies “Dev2” as the DAQ device reading that particular outlet’s pressure.
2. When adding inputs, they need to be wired to the “Build Array” object (tan
rectangle in the middle of the image above). If there are not enough inputs to wire
all of the strings, more can be made by hovering the mouse over the bottom edge of
the object until the double sided arrows appear. Then click + drag the box
downward, expanding the number of inputs. This can be done to reduce inputs as
well by dragging the edge upward.
5. Repeat this process for every outlet in the model. For the ‘Scan All’ case, the scan list
should contain every input.
2.4. Defining the Update Lists for Each Outlet The update lists tell the program which pressure sensor readouts to update on the front end UI for
the LabVIEW program. The update list for a specific outlet should be exactly the same as the scan
lists defined in the previous section. The process for configuring the update lists is similar to that of
the scan lists.

1. First, find the update list case statement.
Update List Case Statement
2. Select the case number corresponding to input of the outlet you wish to modify.
3. For every pressure reading that is to be updated, create an index, index array, mean, and
bundle by name block and wire them together as shown above.
a. Indexes correspond to the DAQ inputs (e.g. ai 36 = index 36). These indexes simply
need to be attached to an index array block.
b. Index array blocks should be connected to the scan logic output (orange wire) in
addition to the index blocks. Their outputs should be sent to the mean calculation
blocks.
c. The mean blocks take an input from each index array and output the mean value of
all of the samples taken for a specific output. The blocks output their results to the
Bundle by Name object.
d. The Bundle by Name object takes in the means and must be wired to the case
statement’s output (brown wire).
4. Fill in these update lists for all of the outputs.